
Abstract
The 2011 off the Pacific Coast of Tohoku earthquake caused extensive liquefaction damage to reclaimed land along the Tokyo Bay coast, even though it was approximately 400 km from the epicenter. The characteristics of the liquefaction damage include the fact that liquefaction occurred in soils with a high percentage of fine particles and that the distribution of liquefied and nonliquefied areas was nonuniform. The factors contributing to such nonuniform liquefaction damage included the heterogeneity of the ground materials and their depositional conditions, and the effects of the long earthquake duration. Although these points are certainly valid as reasons for the occurrence of severe liquefaction damage, they do not fully explain the mechanisms of the liquefaction of the fine-grained soils, or the localized extent of the liquefaction. To elucidate the severe and nonuniform damage, seismic response analyses of a multi-layered ground were conducted focusing on the stratigraphic irregularities in the ground beneath Urayasu city. The results showed that the thicker and softer sedimentary layers amplify the slightly long-period component of the seismic motion and increase the shaking at the ground surface. Moreover, the wave propagation in the ground became very complicated owing to the focal effect caused by the refractions and reflections of body waves at the stratum boundary, surface wave excitation at the base of the slope, and amplified interference between body and surface waves. This complex wave propagation contributed to nonuniform surface ground shaking and severe liquefaction damage. In addition, surface waves, which consist primarily of slightly long-period components, can propagate far and wide; as such, they triggered extensive damage owing to delayed shaking phenomena that continue even after the earthquake. The analysis results suggested that multidimensional elasto-plastic seismic response analyses considering stratigraphic irregularities are important for detailed seismic evaluation.
Keywords
Introduction
The 2011 off the Pacific Coast of Tohoku earthquake with its moment magnitude Mw = 9.0, caused extensive and severe liquefaction damage in the reclaimed coastal areas of Tokyo Bay, including Urayasu city. The characteristics of the liquefaction damage in Urayasu were as follows. (1) Although the city was located approximately 400 km from the epicenter and the tremors were only approximately a “lower 5” on the Japan Meteorological Agency seismic intensity scale, “VI” on the Mercalli intensity scale, and 1.0–2.0 m/s2 according to surface ground motion records, severe liquefaction damage occurred. (2) The grain size distribution of soil samples collected from the liquefied area revealed that liquefaction occurred even in soils with high fine particle content of 30% to 60%, although the plasticity index for fine particles was judged as “non-plastic” (Kyokawa et al., 2012; Yasuda and Harada, 2011). (3) The distribution of liquefied and nonliquefied areas was nonuniform (Kyokawa et al., 2012; Yasuda et al., 2012a, 2012b)
Figure 1 shows the distribution of the relative amount of pile pullout due to ground settlement after the earthquake (Chiba Prefectural Environmental Research Center). Since the ground settlement was caused by the liquefaction, large amount of pile pullout indicates more severe liquefaction. Notably, the absence of plots does not imply that liquefaction damage has not occurred, as detached houses are not built on pile foundations. The area enclosed by the pink line is the reclaimed ground where construction began in 1965. Although liquefaction damage occurred over a wide area in Urayasu, it was relatively concentrated in the new reclaimed land, with almost no liquefaction damage in the old natural ground. In addition, the liquefaction damage was spatially heterogeneous, with some areas being severely damaged locally. The factors contributing to such nonuniform liquefaction damage included (a) the heterogeneity of the ground materials and their depositional conditions, that is, differences in density owing to different reclamation ages, ground improvements, and dredging methods; and (b) the effects of the long earthquake duration and aftershocks occurring immediately after the main earthquake (Bhattacharya et al., 2011; Kyokawa et al., 2012; Tokimatsu et al., 2013; Wakamatsu and Senna, 2015; Yasuda and Harada, 2011; Yasuda et al., 2012a, 2012b). These factors are certainly valid as reasons for the occurrence of severe liquefaction damage. However, these factors do not fully explain why soil containing a large amount of fine particles were liquefied, nor why liquefaction damage became locally severe.
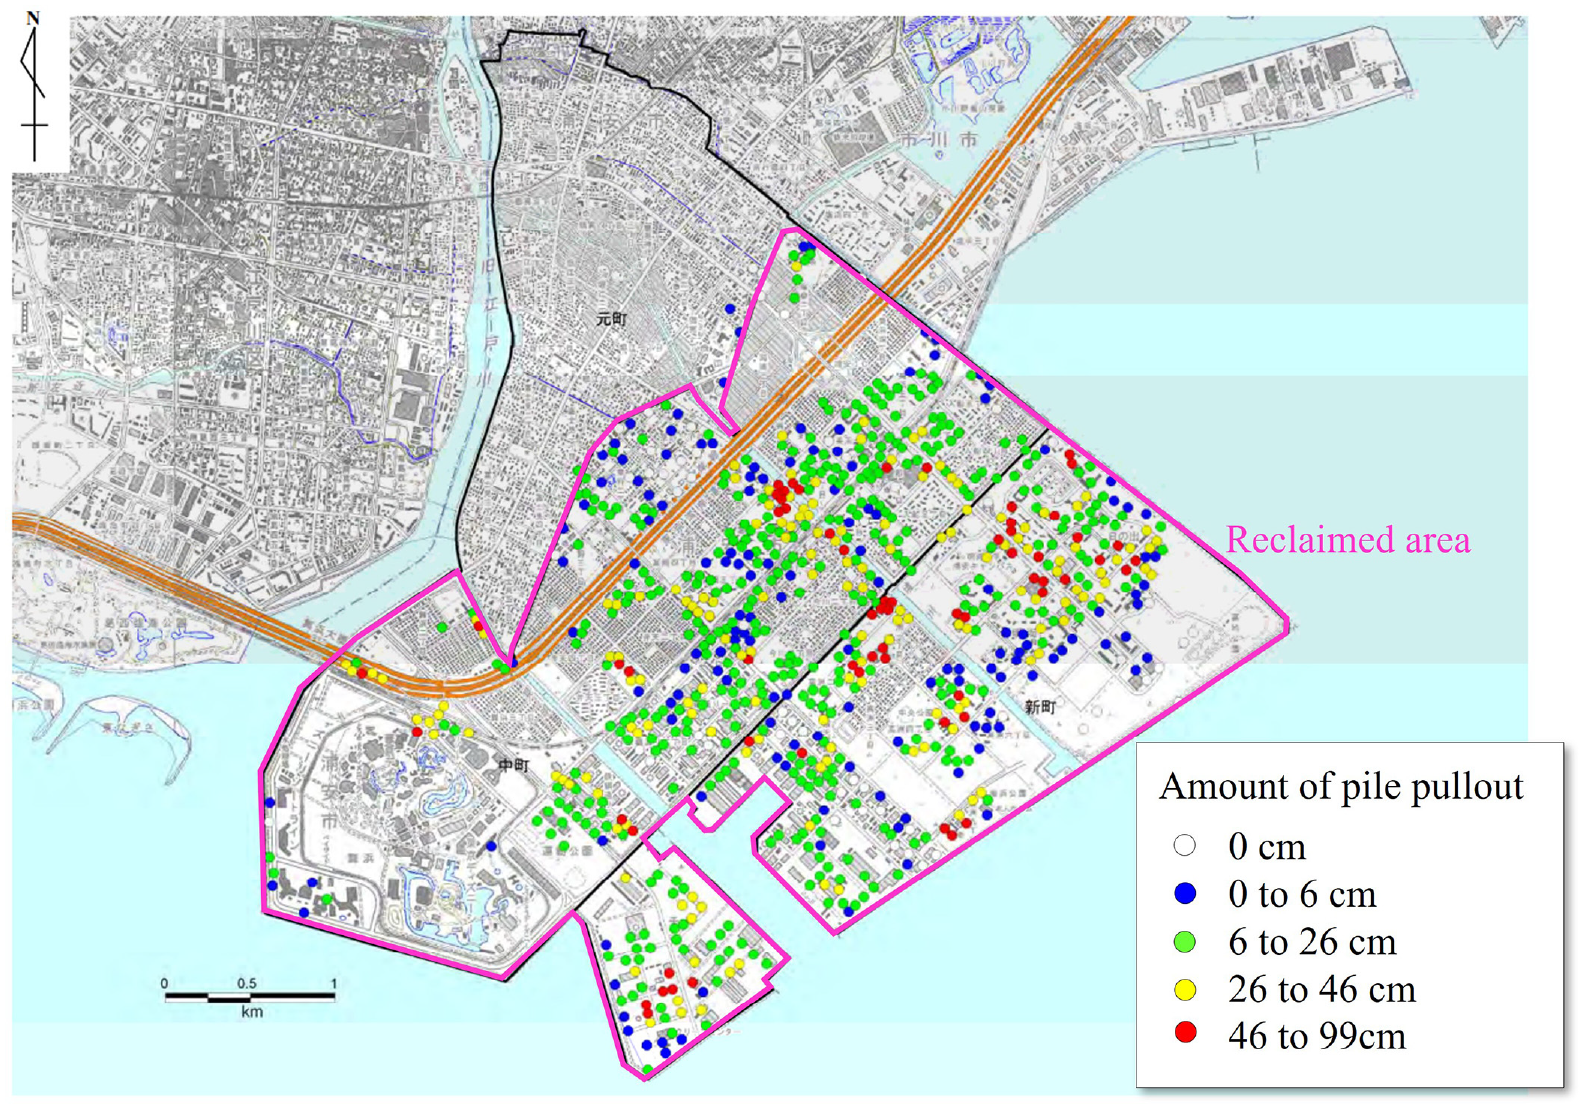
Distribution of liquefaction damage in Urayasu city.
Figure 2 shows the distribution of the elevations at the top of diluvium (herein called the engineering base) beneath Urayasu city (Urayasu city, 2012). The elevation of the engineering base slopes gently from landward (north) to seaward (southeast), with −20 m at the northern end and −60 to −80 m at the southern end. Locally, buried valleys with elevation differences of 0–30 m can be observed, and the thickness of the sedimentary layer (alluvium) varies across areas as the engineering base undulates. A comparison with the liquefaction damage shown in Figure 1 indicates that the degree of liquefaction damage tends to be greater in areas with lower base elevations, that is, areas with thicker sedimentary layers. In fact, reports have highlighted that to understand liquefaction damage over a wide area, focus should be placed not only on the characteristics of the sedimentary soil but also on the spatial distribution of the sedimentary layer thickness (Chiba Prefectural Environmental Research Center, 2011; Tokimatsu et al., 2013; Sugai and Honda, 2015). A geological cross-sectional map based on borehole data is shown in Figure 3. The Urayasu soil can be roughly divided into four layers: diluvium layer D, alluvial clay layer Ac, alluvial sand layer As, and reclaimed soil layer B (dredged and filled soil) from the deepest part. The reclaimed soil layers are heterogeneously deposited from sandy soil to clayey soil, depending on the location; however, accurately determining their distribution is challenging. Table 1 compares N-values, fine content Fc, and clay content Cc for reclaimed soil and alluvial sand using the results of existing geotechnical investigations by Urayasu city (2012), where μ is the mean value and σ is the standard deviation. Due to depositional and aging effects, average overburden-corrected N-values in the reclaimed soil and alluvial sand are 7 and 13, respectively. However, both sands have a common characteristic that the N-value is small enough to pose a high risk of liquefaction, and they both contain a large amount of fine particles. In this study, for simplicity, reclaimed soil was assumed to be the same as the alluvial sand. Therefore, the thickness of the surface sandy layer is uniform and boundary between the alluvial sand and alluvial clay layer is almost horizontal. On the other hand, the boundary between the alluvial clay and diluvium layer, that is, the engineering base surface, sinks deeply as it moves from the natural ground on the landside to the reclaimed land on the seaside (as shown in Figure 3), essentially forming an irregularly shaped sloping base structure.
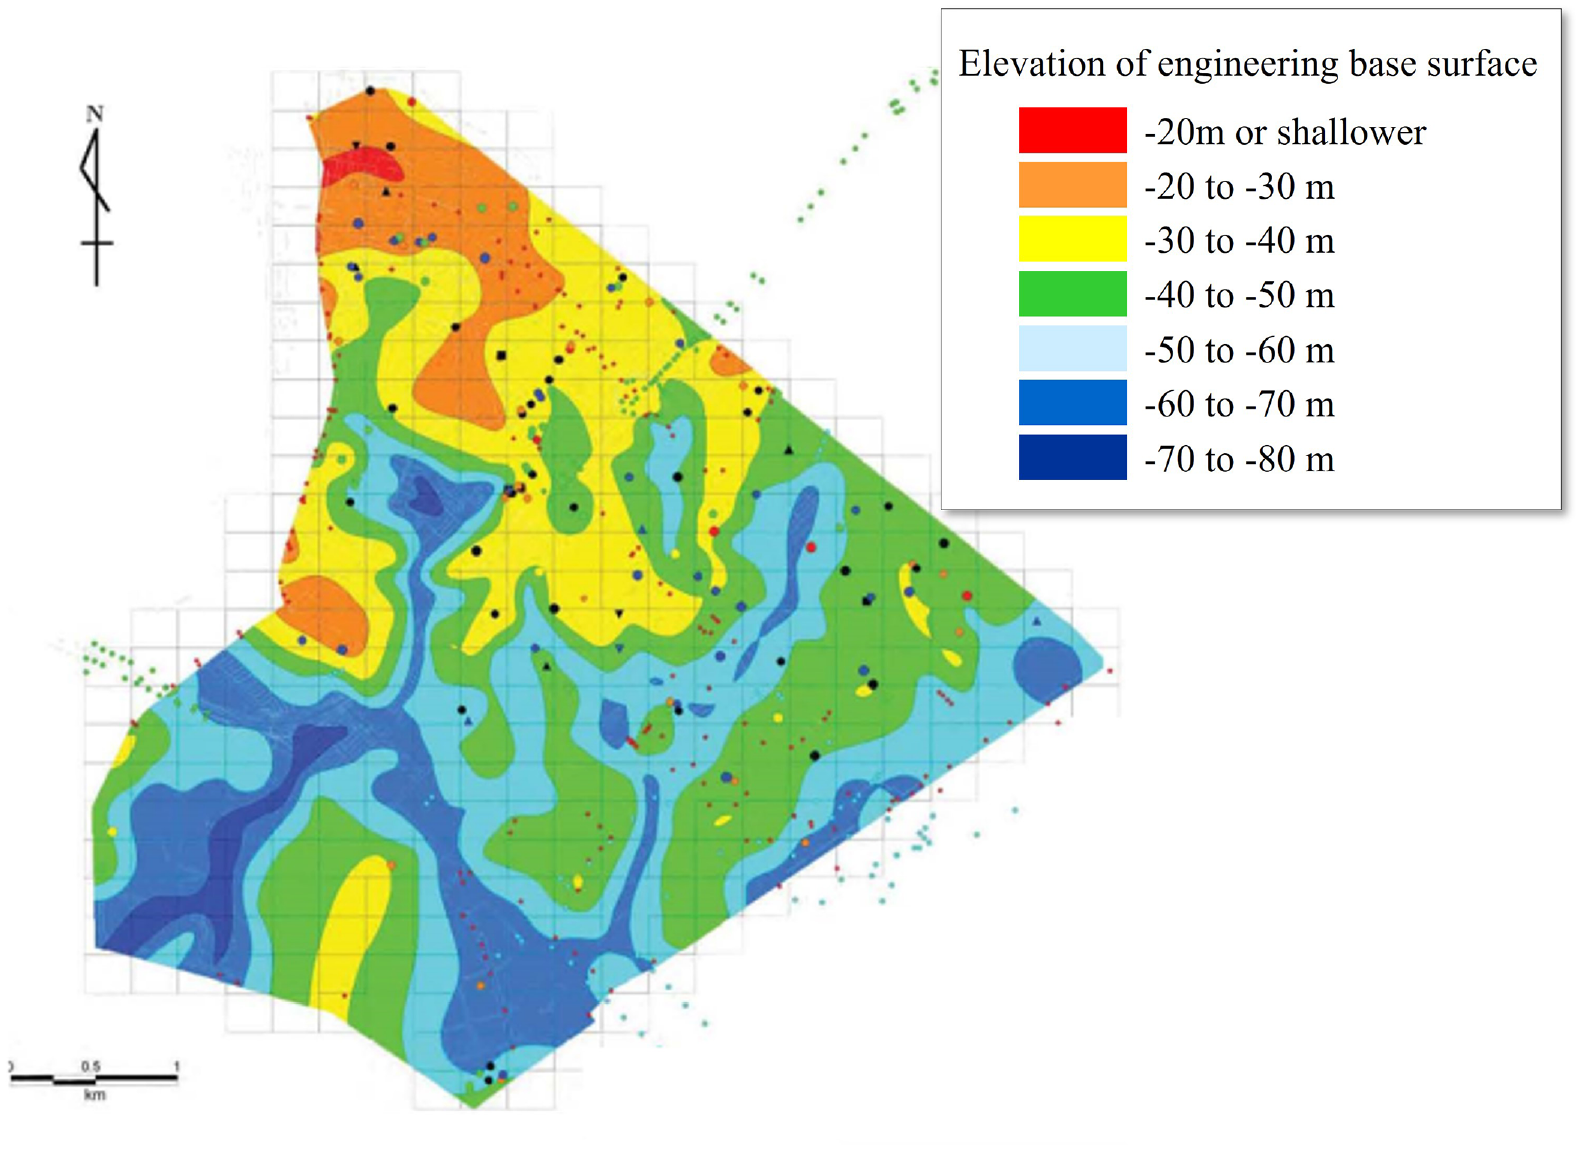
Elevation of the top of the engineering base in Urayasu city.
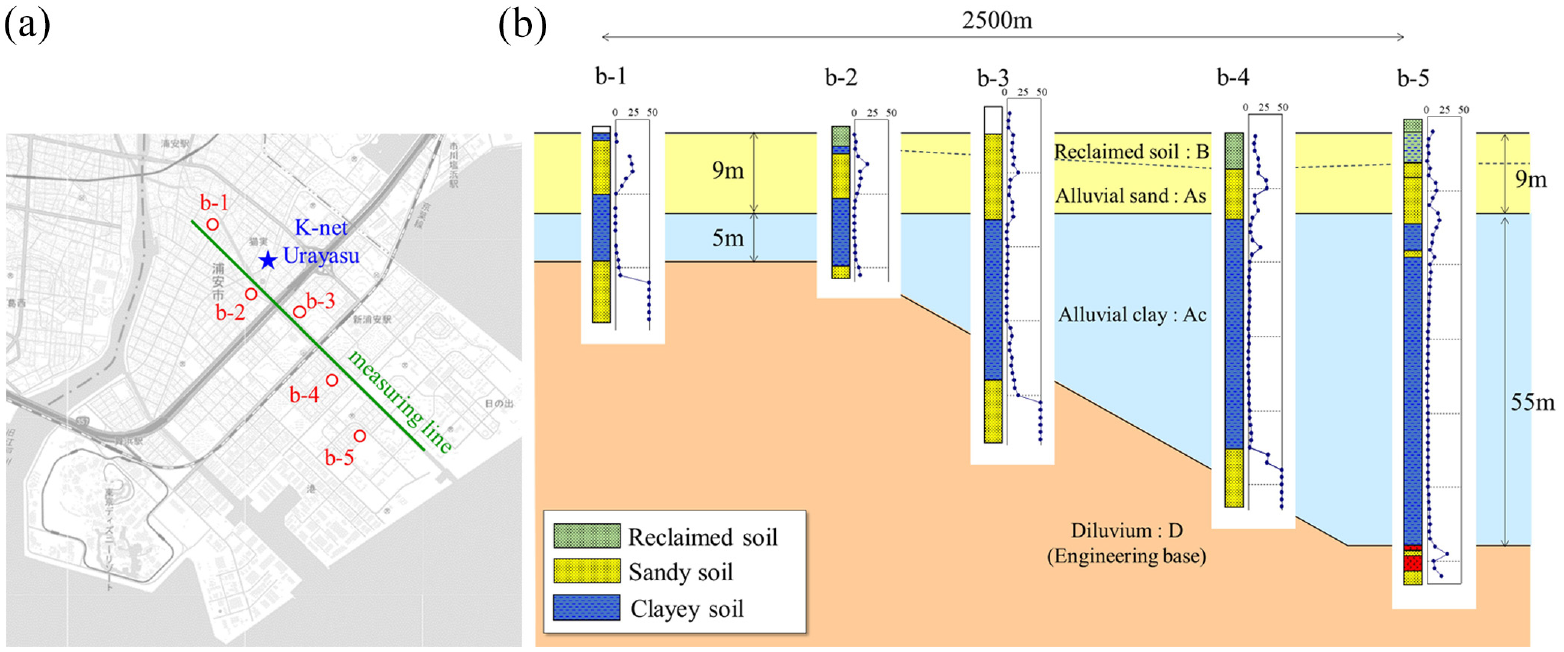
Simplified geological cross-section of Urayasu city assumed from borehole data. (a) Borehole data used for the geological cross-sectional map. (b) Simplified geological cross-sectional map of Urayasu ground.
Comparison of physical properties between reclaimed soil and alluvial sand
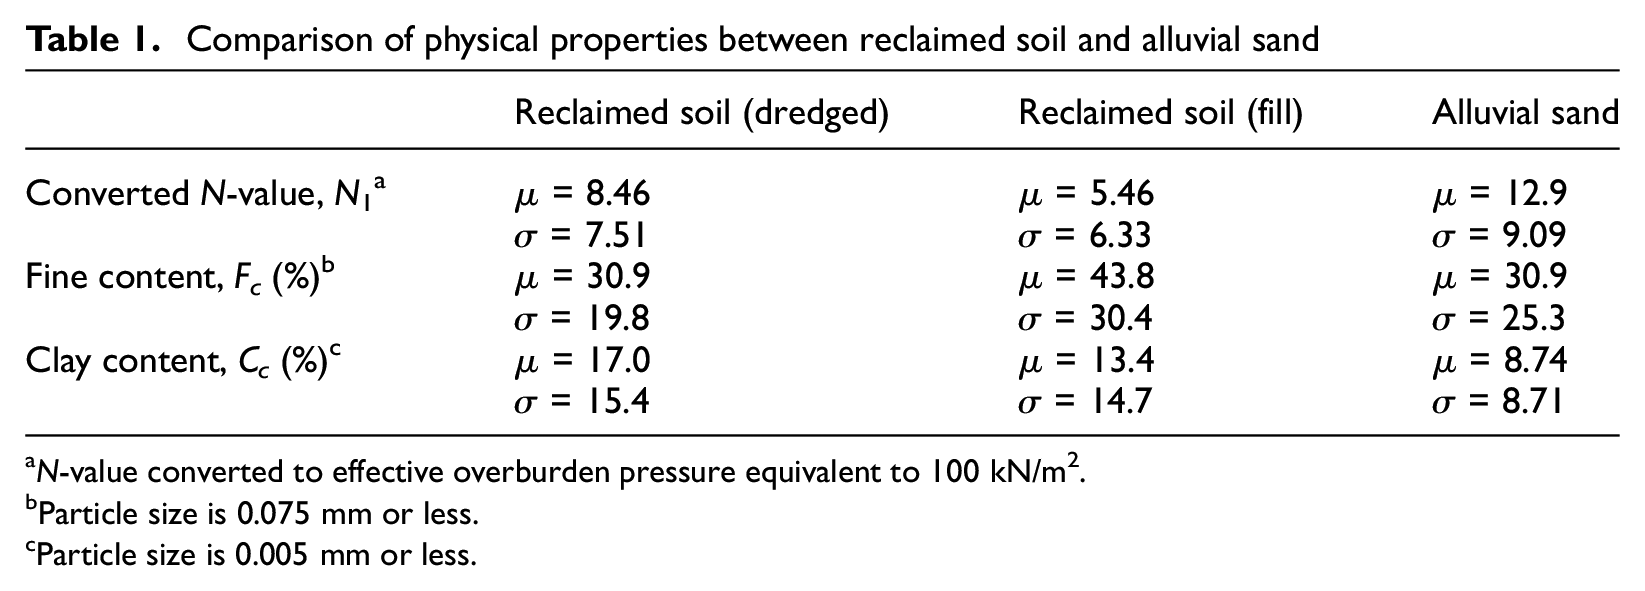
N-value converted to effective overburden pressure equivalent to 100 kN/m2.
Particle size is 0.075 mm or less.
Particle size is 0.005 mm or less.
The 1985 Mexico City earthquake is a well-known example of the effects of an irregularly shaped basement structure on seismic damage. Mexico City is located in a basin approximately 60 km from east to west and 80 km from north to south, and the basin was reclaimed from an old lake. Although located approximately 350 km from the epicenter of the 1985 earthquake, severe earthquake damage was reported (Mendoza, 1987; Merlos and Romo, 2006). The strong tremors that occurred within the Mexico basin were caused by long-period seismic motions that developed in the sedimentary basins, and their main component was thought to be surface waves generated secondarily from the basin boundary edges.
In regard to irregularly shaped basement structures, focus is placed typically on large-scale stratigraphic irregularities ranging from several kilometers to more than a hundred kilometers in length formed at the boundary between the Tertiary and Quaternary layers in sedimentary basins and sedimentary plains, such as the Mexico basin described above. However, as in the Urayasu ground, although the scale is small, numerous small-scale stratigraphic irregularities, ranging from tens to hundreds of meters, exist formed by the boundary between the diluvium and alluvium layers within the sedimentary basins and plains. Surface waves are excited and developed at the boundary edge, that is, the same as in large-scale stratigraphic irregularities. However, the effects of such small-scale stratigraphic irregularities are often not considered in seismic evaluations. Thus, when conducting a detailed seismic evaluation of a specific structure or specific point, not only the effects of body waves while assuming horizontal stratification but also the effects of these numerous small-scale stratigraphic irregularities must be properly evaluated; otherwise, the damage may be overlooked or underestimated. Several seismological studies on strong ground motions have modeled the irregularities of engineering base surfaces as site characteristics; however, they are based on elastic wave theory, which focuses only on the attenuation and amplification characteristics of an earthquake motion in the surface soil above the engineering base. Moreover, they do not consider the plastic deformation of the surface soil and complex strong nonlinearities of the elasto-plastic ground (Harada et al., 2002; Huang et al., 2021; Inoue and Miyatake, 1997).
In addition, numerous field investigations, experiments, and analytical studies have been conducted to elucidate the mechanisms of the liquefaction damage observed in the coastal areas of Tokyo Bay during the 2011 off the Pacific coast of the Tohoku earthquake. For example, Morikawa et al. (2012), Fukutake and Jang (2013), Kamagata and Takewaki (2015), Tamari et al. (2017), Sawada et al. (2017), and Kteich et al. (2019) focused on the effects of differences in the stratigraphic compositions, sedimentary layer thickness, and continuous excitations from main and aftershocks occurring within a short time. However, all these studies used 1D models and did not consider the effects of irregularly shaped basement structures. Yasuda et al. (2016) and Fukutake et al. (2015) conducted multidimensional analyses considering complex geological formations, such as the buried valleys in the Tokyo Bay coastal reclaimed ground. They reported that the deformation was locally dominant in the thick sedimentary layers and formation boundaries. However, the former study comprised a static consolidation analysis based on a prior calculation of the ground stiffness reduction owing to cyclic loading; therefore, the time history seismic characteristics were not calculated. The latter study did not consider the soil–water coupling effect. Most importantly, the effects of the complex wave propagation owing to stratigraphic irregularities were not considered in either analyses. In numerous seismic response analyses (i.e. not limited to the analysis of the Tokyo Bay coastal area in 2011 off the Pacific coast of Tohoku earthquake), the stratigraphic structure is often assumed to be horizontally stratified for the sake of model simplification, as such, the effects of the complex wave propagations caused by stratigraphic irregularities are not fully understood. In fact, the Cabinet Office compiled a “Report on Long-period Ground Motions Caused by Large Earthquakes along the Nankai Trough (Cabinet Office Government of Japan, 2015)” and warned of long-period ground motions developing in sedimentary basins. However, the report was limited to the study of resonance in high-rise buildings and oil tank sloshing damage, and did not mention any effects on ground damage at all.
Regarding these matters, the authors conducted a 2D elasto-plastic seismic response analysis considering stratum irregularities, and numerically confirmed that complex wave propagation due to stratum irregularities causes severe and nonuniform liquefaction damage (Nakai et al., 2016). Although the authors suggested that surface waves excited at the base of the irregularity near the ground surface were the important cause, validation of the numerically represented surface waves including the effect of analytical region and finite element mesh division, etc., was not sufficient because of the narrow analytical model region. Therefore, in this study, we performed a soil–water coupled elasto-plastic seismic response analysis for a multi-layered ground system using the modified ground model in which the analytical region was expanded. The ground model used in the analysis was a sloping base structure model, with reference to the Urayasu ground. Through seismic response analyses, we numerically reproduced the complex wave propagation characteristics due to stratigraphic irregularities, and confirmed the influence on surface ground shaking and liquefaction damage. Moreover, through the analysis of the results, we suggested that the spatially heterogeneous and severe liquefaction damage observed in Urayasu is not only caused by the characteristics of the seismic motions and the inherent heterogeneity of the ground, but also the unique geological structure of Urayasu. The analysis code used in this study comprises a soil–water coupled finite deformation analysis code (Noda et al., 2008), incorporating elasto-plastic constitutive equations (Super/subloading Yield Surface (SYS) Cam-clay model (Asaoka et al., 2002) to describe sand, intermediate soil, and clay in the same theoretical framework.
Elasto-plastic modeling of reclaimed ground
Figure 4 shows a numerical model used in the analysis. The model was simplified as much as possible while considering the influence of the slope of the engineering base, as shown in Figure 3, as this is a characteristic feature of the Urayasu ground. In addition, although the actual formation has 3D stratigraphic irregularities, it is modeled here as a 2D plane strain condition. The liquefied layers in the surface were assumed to be horizontally stratified and homogeneous to understand the effect of the stratum irregularities on the liquefaction damage. Consequently, the sandy soil layer was uniform in thickness, and the clay layer was thicker from the landward side to the seaward side. The slope of the engineering base was approximately 3°. The actual Urayasu ground turns to the sea at x = 2500 m in Figure 4. It is also thought that the engineering base sinks deeper as it moves offshore. However, to understand the propagation characteristics of the surface waves, the analytical model was modeled in the form of horizontally stratified ground that is virtually continuous up to x = 30,000 m. Because surface waves propagate from the landward side (left in the figure) to the seaward side (right in the figure) due to the right-down sloping base structure, the presence of fictitious ground in the analysis would have little effect on the liquefaction and oscillation characteristics of the actual Urayasu ground at points A, B, and C in the figure. Note that because the analysis is performed under 2D plane strain conditions, only Rayleigh waves are excited by stratigraphic irregularities, and Love waves are not reproduced. The finite element mesh used in the analysis contained 29,720 elements and 31,227 nodes.
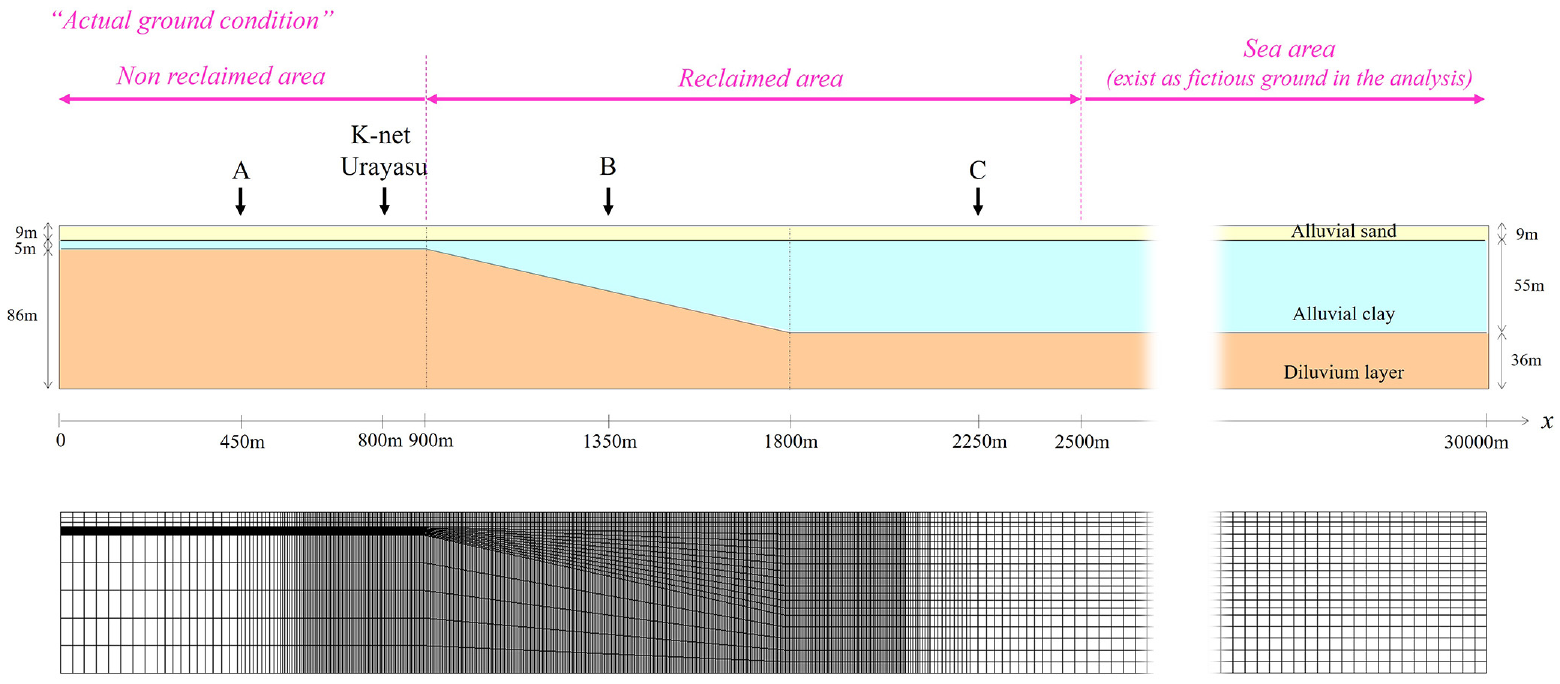
Numerical modeling of the ground model referring Urayasu.
Table 2 lists the elasto-plastic parameters, evolutional parameters, and initial conditions used in the analysis. The material constants for each layer were obtained using the SYS Cam-clay model to reproduce the borehole investigation conducted in Urayasu and based on various mechanical tests of undisturbed samples collected from the same location (Kaneda et al., 2016; Nakai et al., 2014). Examples of the reproduced results for the sandy and clayey soils are shown in Figures 5 and 6, respectively. The results from the in-situ investigation reveal that the N-value distribution of the sandy soil was generally loose, at less than 20 (Ishii et al., 2017). As shown in Figure 5, the degree of positive dilatancy was not so large, and the soil was modeled as soil with high liquefaction potential. By contrast, the N-values of the clays in the Urayasu soil were very small and soft, ranging from 0 to 1 (Figure 3). Figure 6 shows the shear behavior with strain softening and compression behavior that takes the stress states outside the normal consolidation line (impossible region (Atkinson and Bransby, 1987)), which are the characteristic of soft and sensitive clay (Nakano et al., 2005). Evidently, the overconsolidation ratio was distributed according to the overburden pressure, assuming that the specific volume (density), degree of structure (Asaoka et al., 2002; Noda et al., 2009), stress ratio, and degree of anisotropy are uniform within the layer in the depth direction for the initial values obtained from these replicated results. The groundwater level of the Urayasu ground was close to the ground surface, at a depth of −1.0 to −1.5 m. In this analysis, it was assumed that the soil was completely saturated, and the groundwater level was set at the ground surface. Therefore, as a hydraulic boundary, the top surface was always set to zero water pressure, and both sides and the bottom surface were set as undrained boundaries.
Elasto-plastic parameters used for the analyses
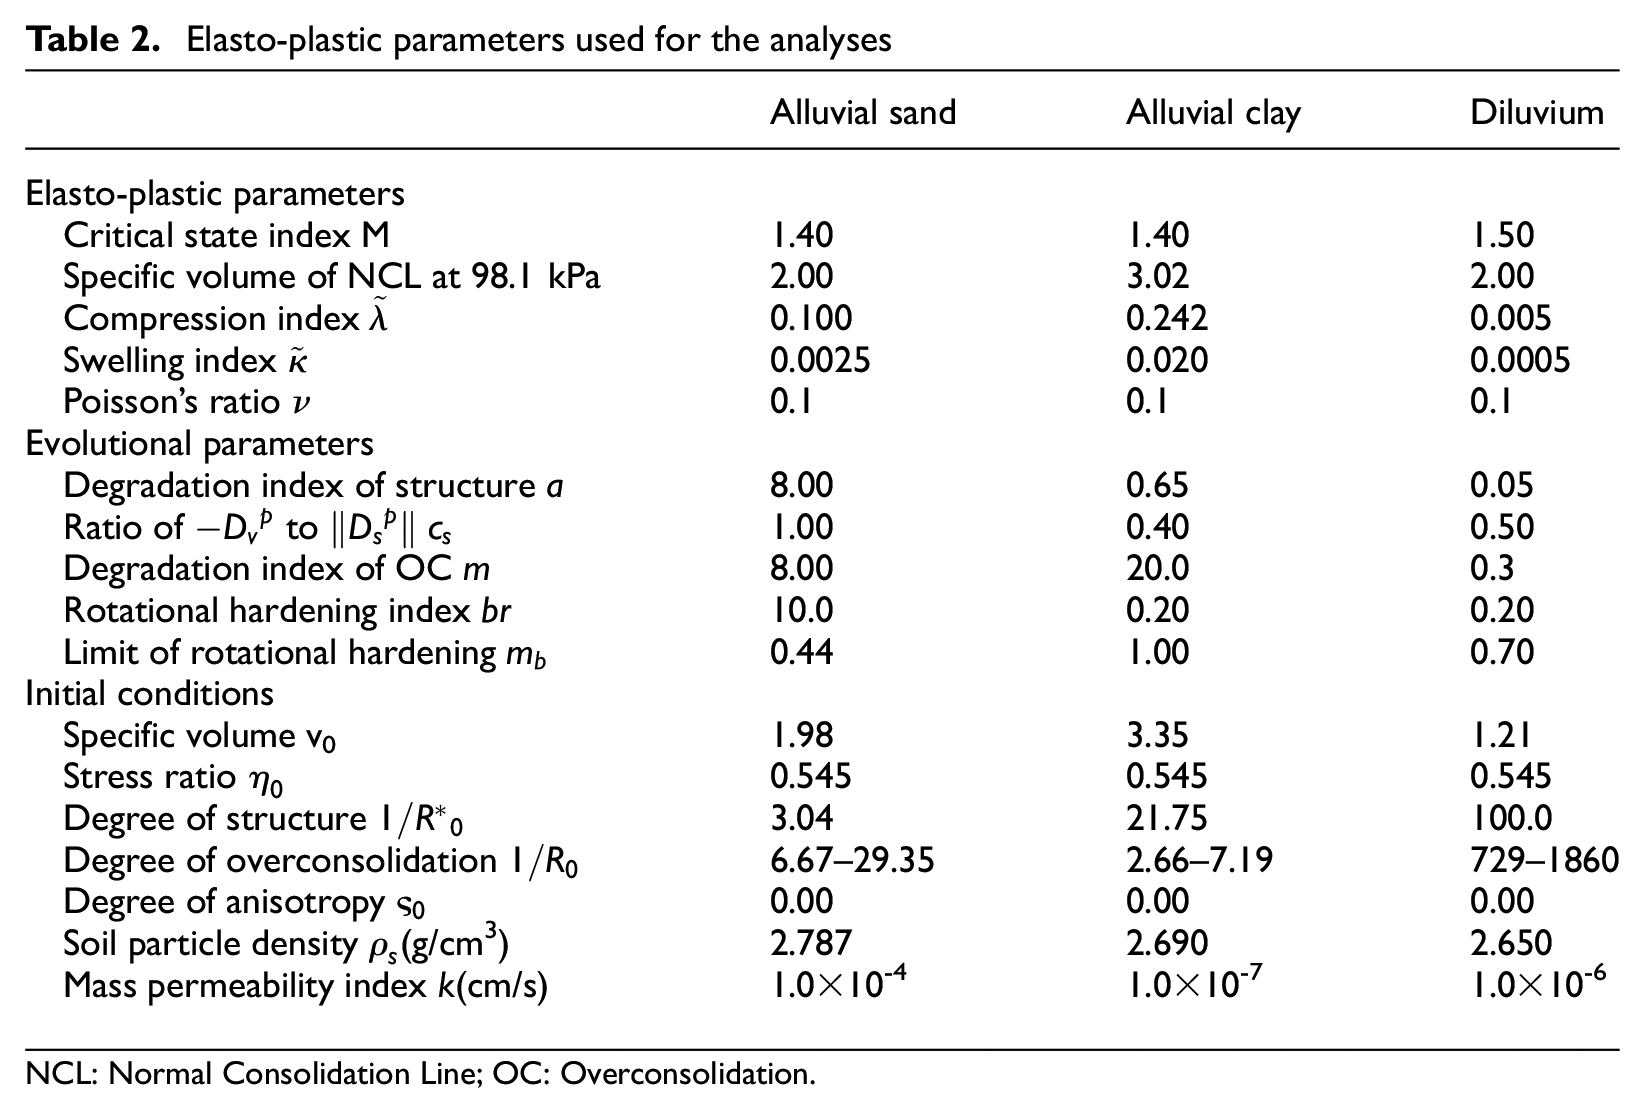
NCL: Normal Consolidation Line; OC: Overconsolidation.
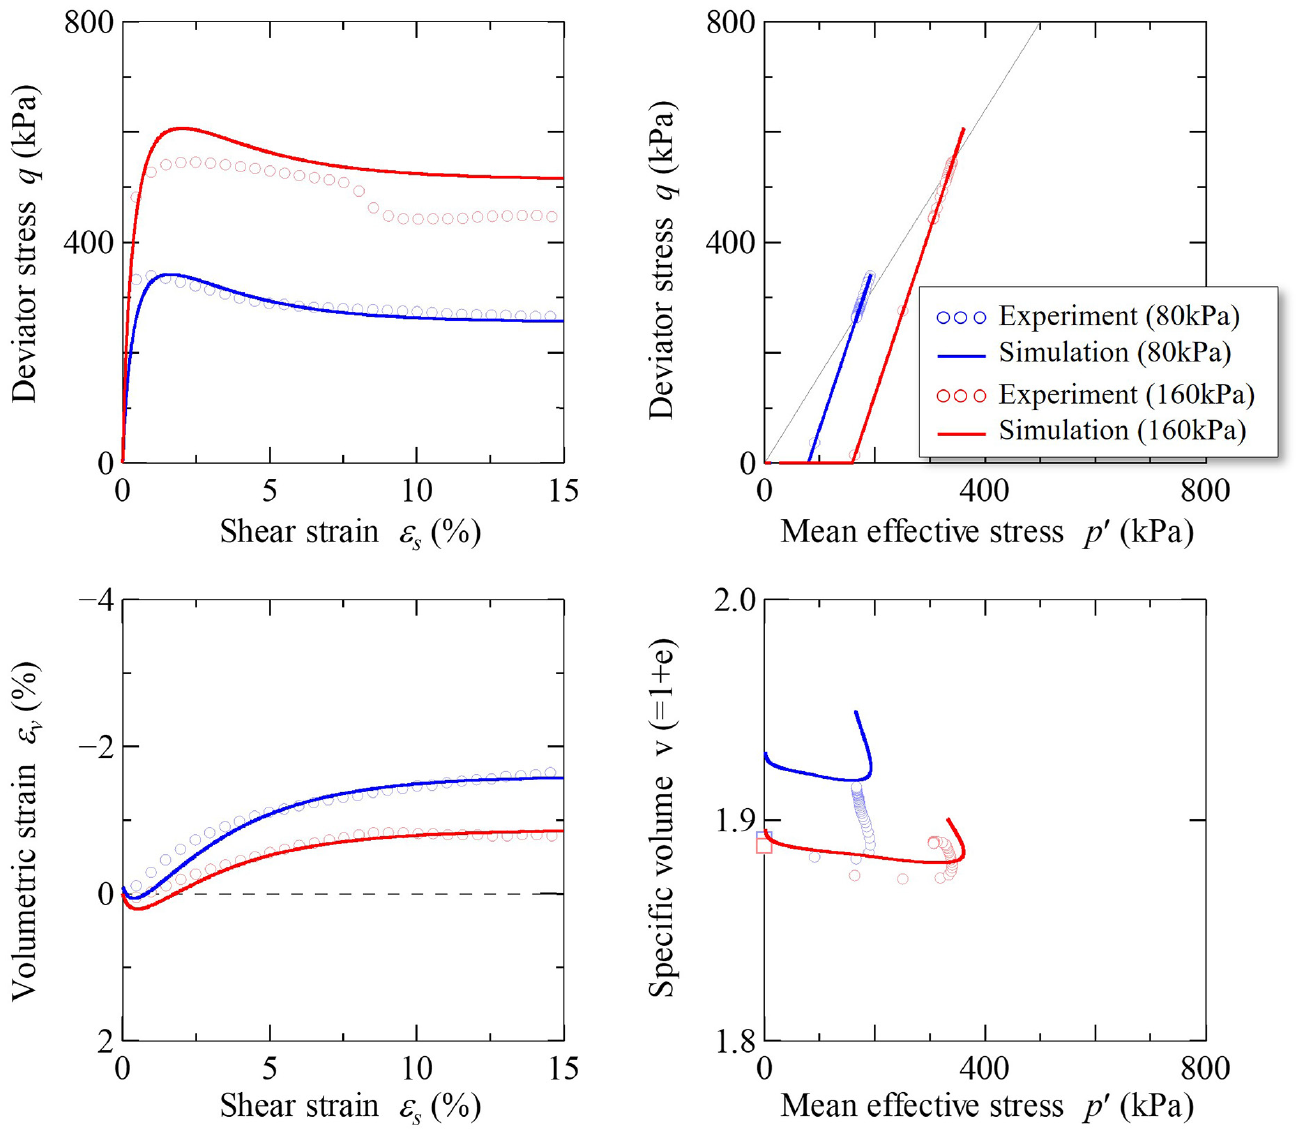
Drained triaxial compression tests of undisturbed sandy samples.
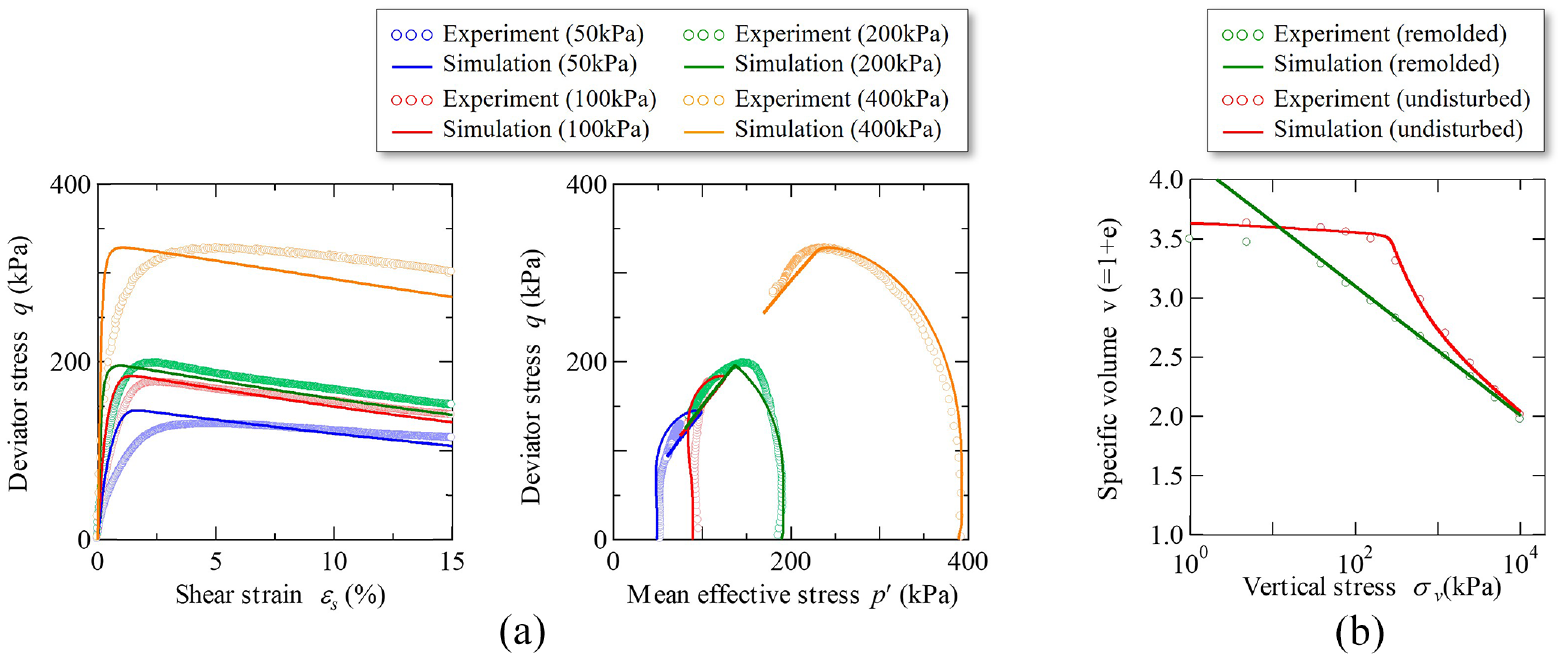
Undrained triaxial compression tests and oedometer test of undisturbed clayey samples: (a) undrained triaxial compression behavior and (b) one-dimensional compression behavior.
Since only strong-motion earthquake records at ground surface can be obtained at Urayasu city, the E–W component of the seismic wave observed at the Shinagawa seismic station of the Tokyo Metropolitan Government Bureau of Port and Harbor at a ground level of −36 m was used as input seismic motion as shown in Figure 7(a). The maximum acceleration was as small as 0.6 m/s2 owing to the seismic motion observed at the deeper basement. A simple shear deformation boundary with lateral boundary elements was set at both ends of the boundary (Asaoka et al., 1998; Noda et al., 2009), and a viscous boundary equivalent to Vs = 400 m/s (Lysmer and Kuhlemeyer, 1969; Noda et al., 2009) was used at the bottom of the FEM mesh. The seismic waveform was input to the horizontal direction simultaneously at all nodes of the bottom boundary. The analysis was carried out for 400 s after the seismic motion was input.
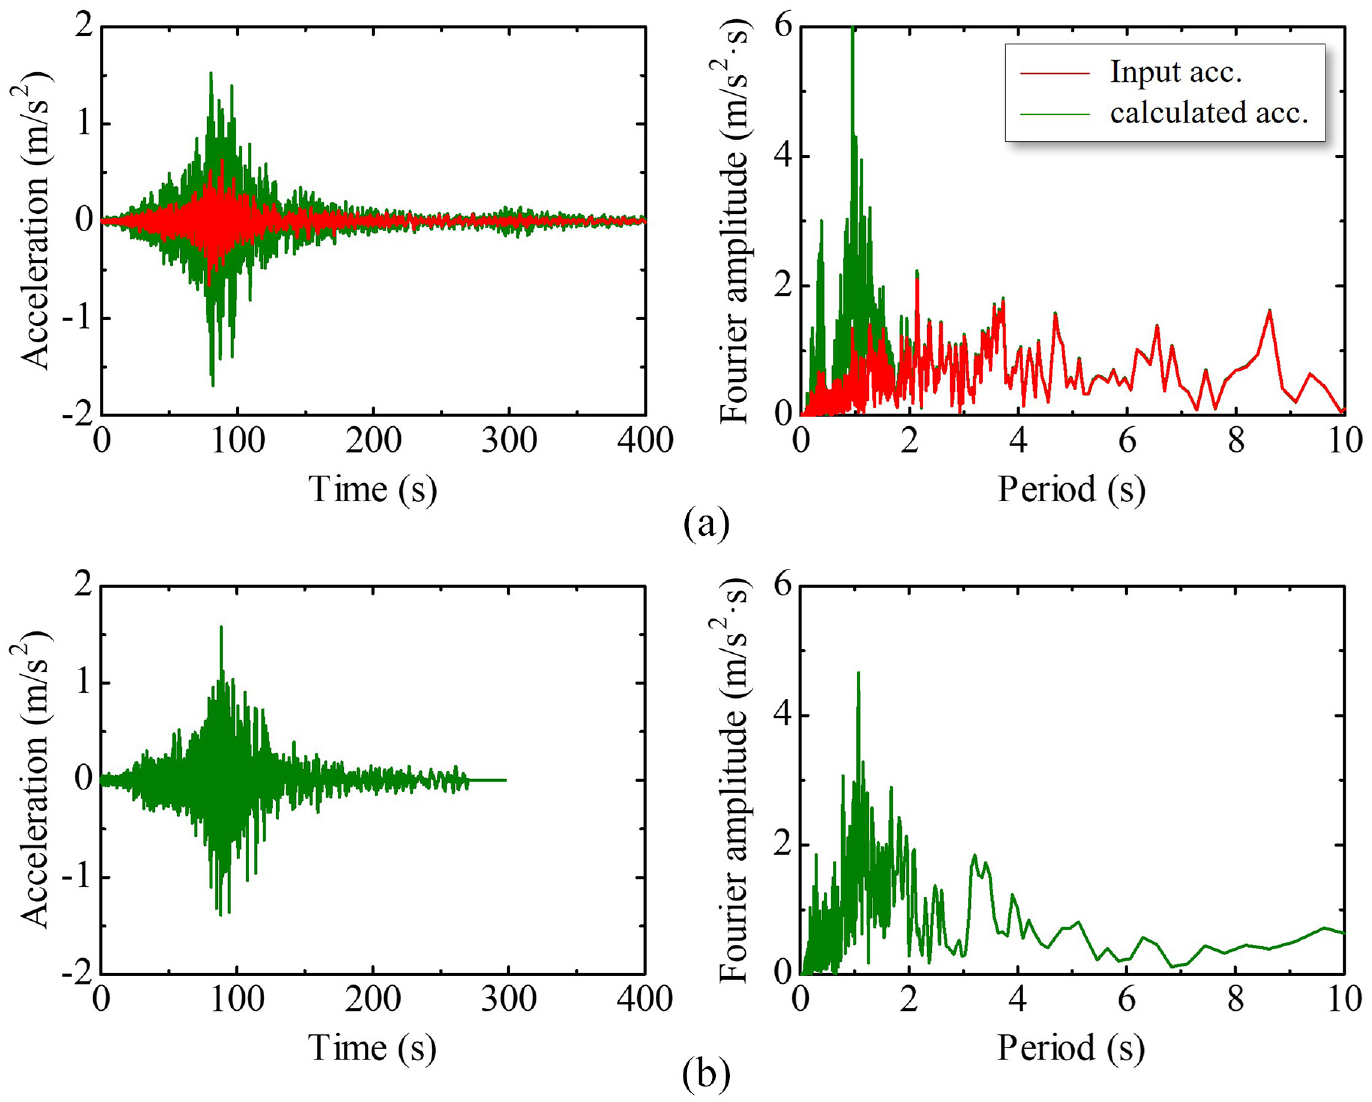
Comparison of strong motion records and analysis results at K-net Urayasu station: (a) 2D analysis result at x = 800 m and (b) observed ground motion.
First, we confirmed the validity of using strong-motion records observed at Shinagawa as input seismic motion at Urayasu ground. The surface strong-motion earthquake records for Urayasu city were obtained from the K-net Urayasu observatory of the National Research Institute for Earth Science and Disaster Resilience; NIED (see Figure 3). Figure 7 compares the observational and analysis results at a point equivalent to the location of Urayasu station (x = 800 m). The characteristics of the two models were similar: the maximum acceleration was approximately 1.5 m/s2, and the dominant period was approximately 1.0 s, which indicates the validity of the analysis even if the strong-motion records of Shinagawa, 20 km from Urayasu was used. Together with the reproducibility of the laboratory tests in Figures 5 and 6, the elasto-plastic modeling of the Urayasu ground was validated.
Effect of sedimentary thickness on subsurface seismic damage (1D analyses)
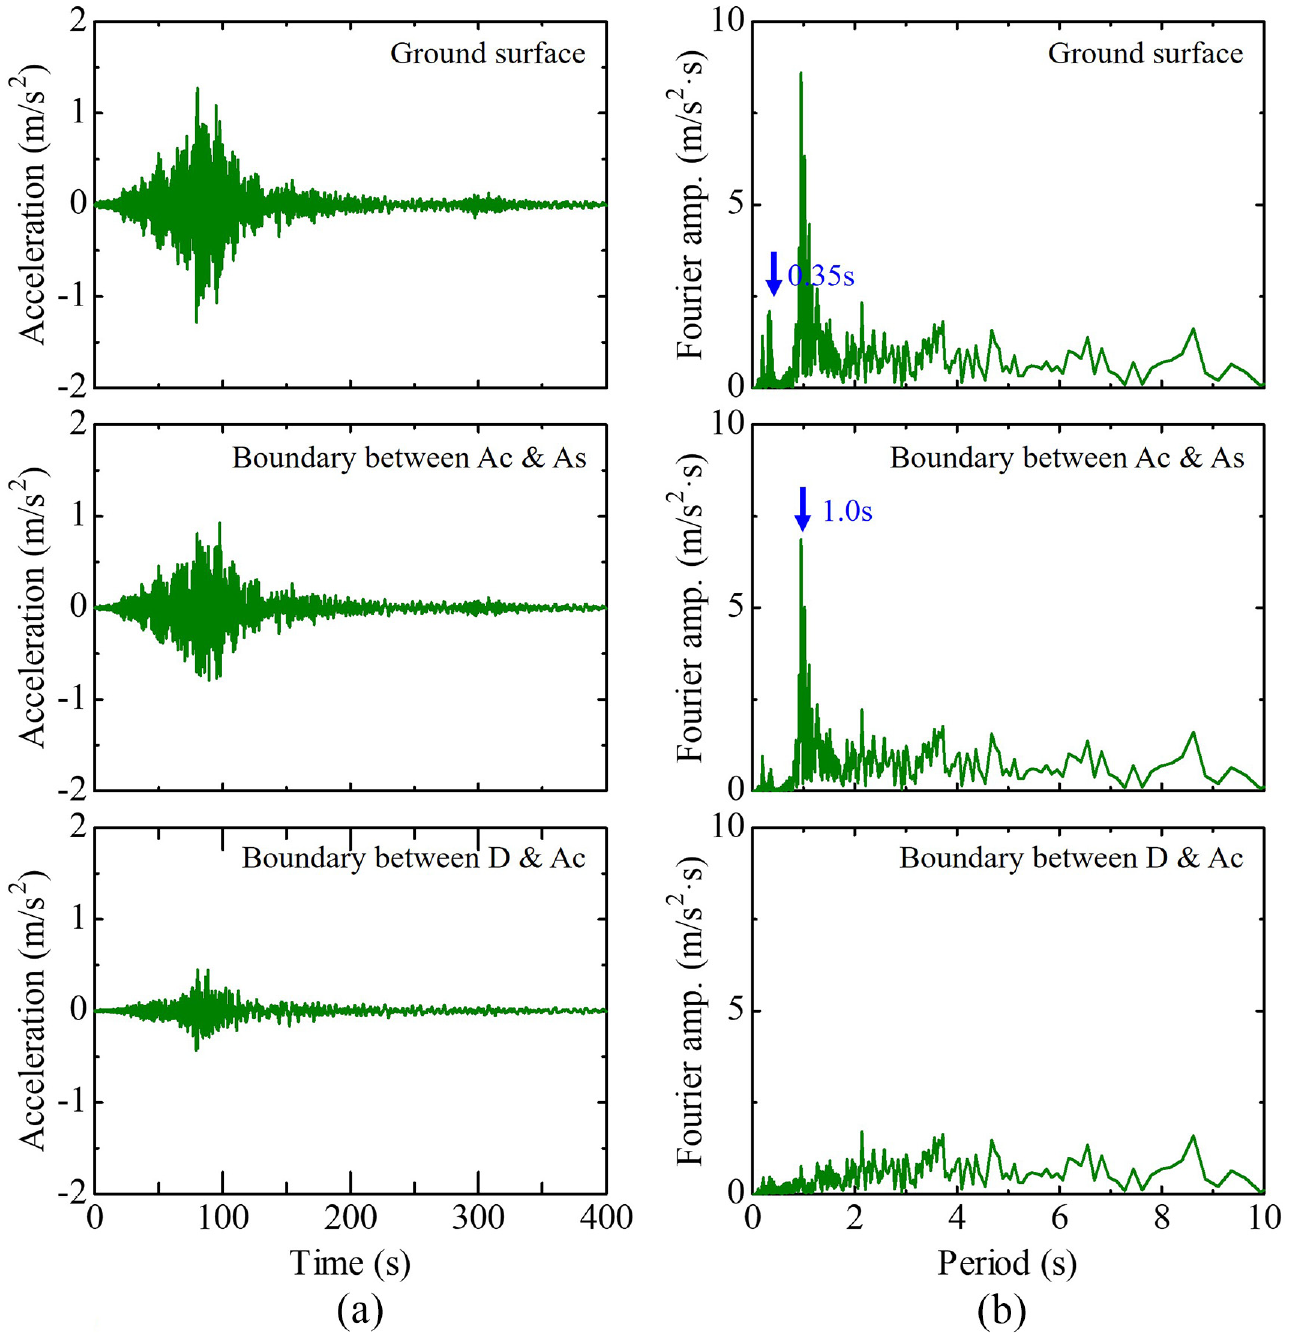
First, 1D vertical models were created at points A, B, and C in Figure 4, and a seismic response analysis was conducted to determine the effect of the thickness of the sedimentary layer. The finite element mesh used in the analysis is shown in Figure 8. The mesh division interval was the same as that used in the 2D model. The figure also shows the shear wave velocity distribution calculated from the input parameters. The shear wave velocity in sedimentary layers is small, ranging from 60 to 160 m/s in the alluvial sand layers and 80 to 150 m/s in the alluvial clay layers. On the other hand, the diluvium layer has a large shear wave velocity of 300 to 600 m/s, and it can be seen that the impedance ratio differs greatly on the engineering base, that is a boundary between the alluvial layer and the diluvium. The shear wave velocity profiles shown in Figure 8 are roughly consistent with field measurements (Nakai et al., 2014). Figure 9 shows a comparison of the horizontal displacements at the ground surface. The displacement during the earthquake varied considerably across locations; from A to C, the thicker the sedimentary layer, the greater the displacement. Figures 10–12 show the acceleration response by layer at each location. The left figures show the time history of acceleration, and the right figures show the Fourier amplitude spectrum of acceleration. The maximum accelerations were not significantly different; however, the amplification characteristics of the seismic motion differed depending on the thickness of the sedimentary layer. Focusing on the Fourier amplitude spectrum after passing through the clay layer, the thicker the sedimentary layer, the more the seismic motion is amplified in the range of slightly longer periods, that is, 1.0 s at point A, 1.45 s at point B, and 2.1 s at point C. Here, a “slightly long period” refers to a period of one to several seconds. The sandy soil was amplified at 0.35 s at all points because the layer thickness was the same. The clayey soil deposited at Urayasu has a long natural period owing to its low N-value and softness. In particular, when a clay layer is thick, the slightly long-period component resonates and produces large shaking, thus resulting in a large displacement of the ground.
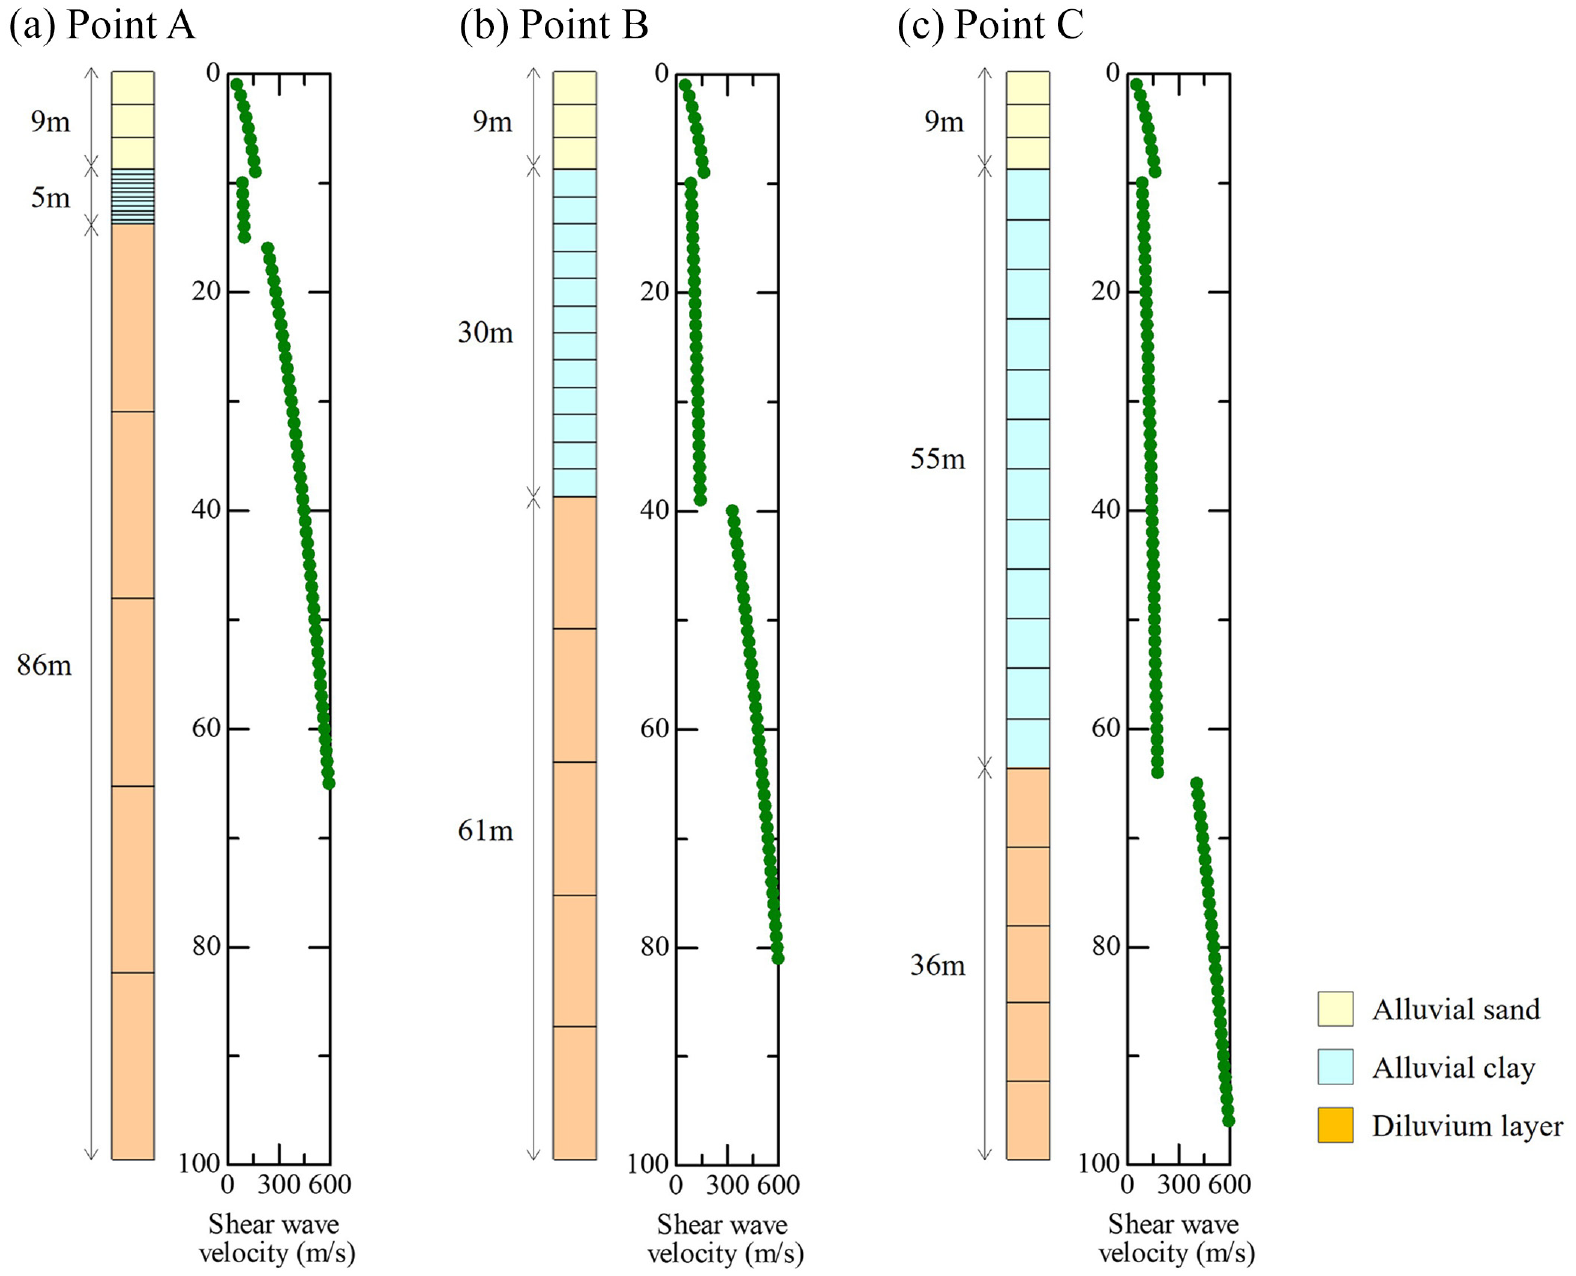
One-dimensional finite element meshes and assumed shear wave velocity distributions. (a) to (c) indicate the finite element mesh and assumed shear wave velocity at points A, B and C: (a) Point A, (b) Point B, and (c) Point C.
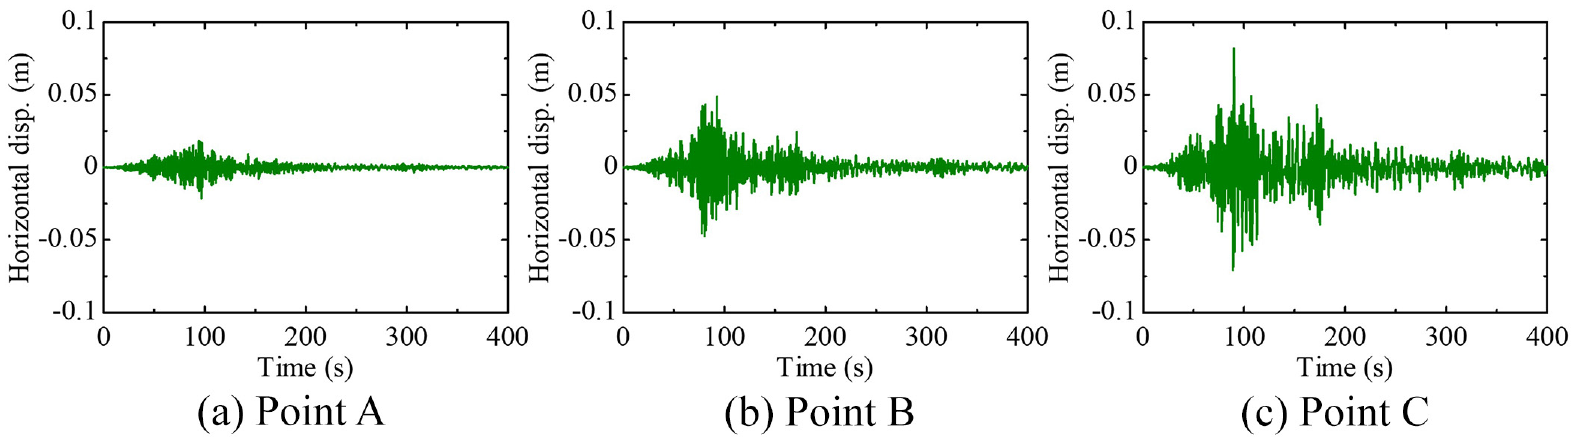
Comparison of the horizontal displacement at ground surface with each point A to C: (a) Point A, (b) Point B, and (c) Point C.
Stratified acceleration response (time history and Fourier amplitude spectrum) at point A: (a) time-acceleration relationship and (b) Fourier amplitude.
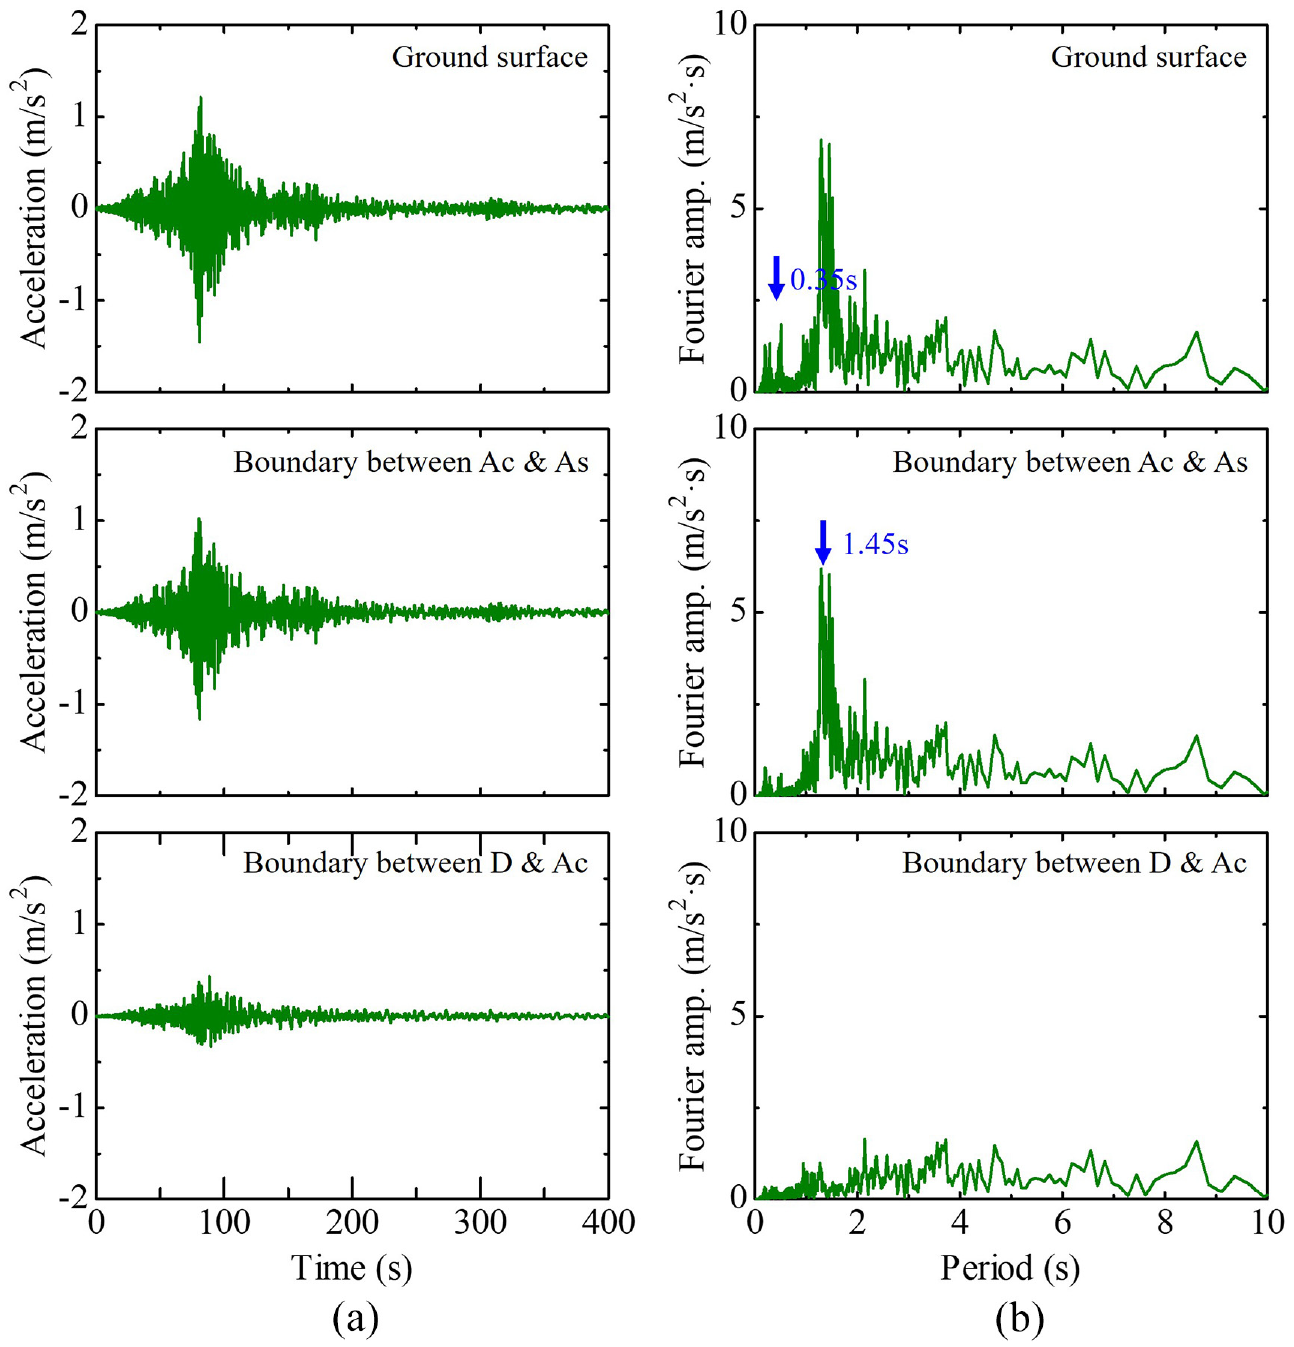
Stratified acceleration response (time history and Fourier amplitude spectrum) at point B: (a) time-acceleration relationship and (b) Fourier amplitude.
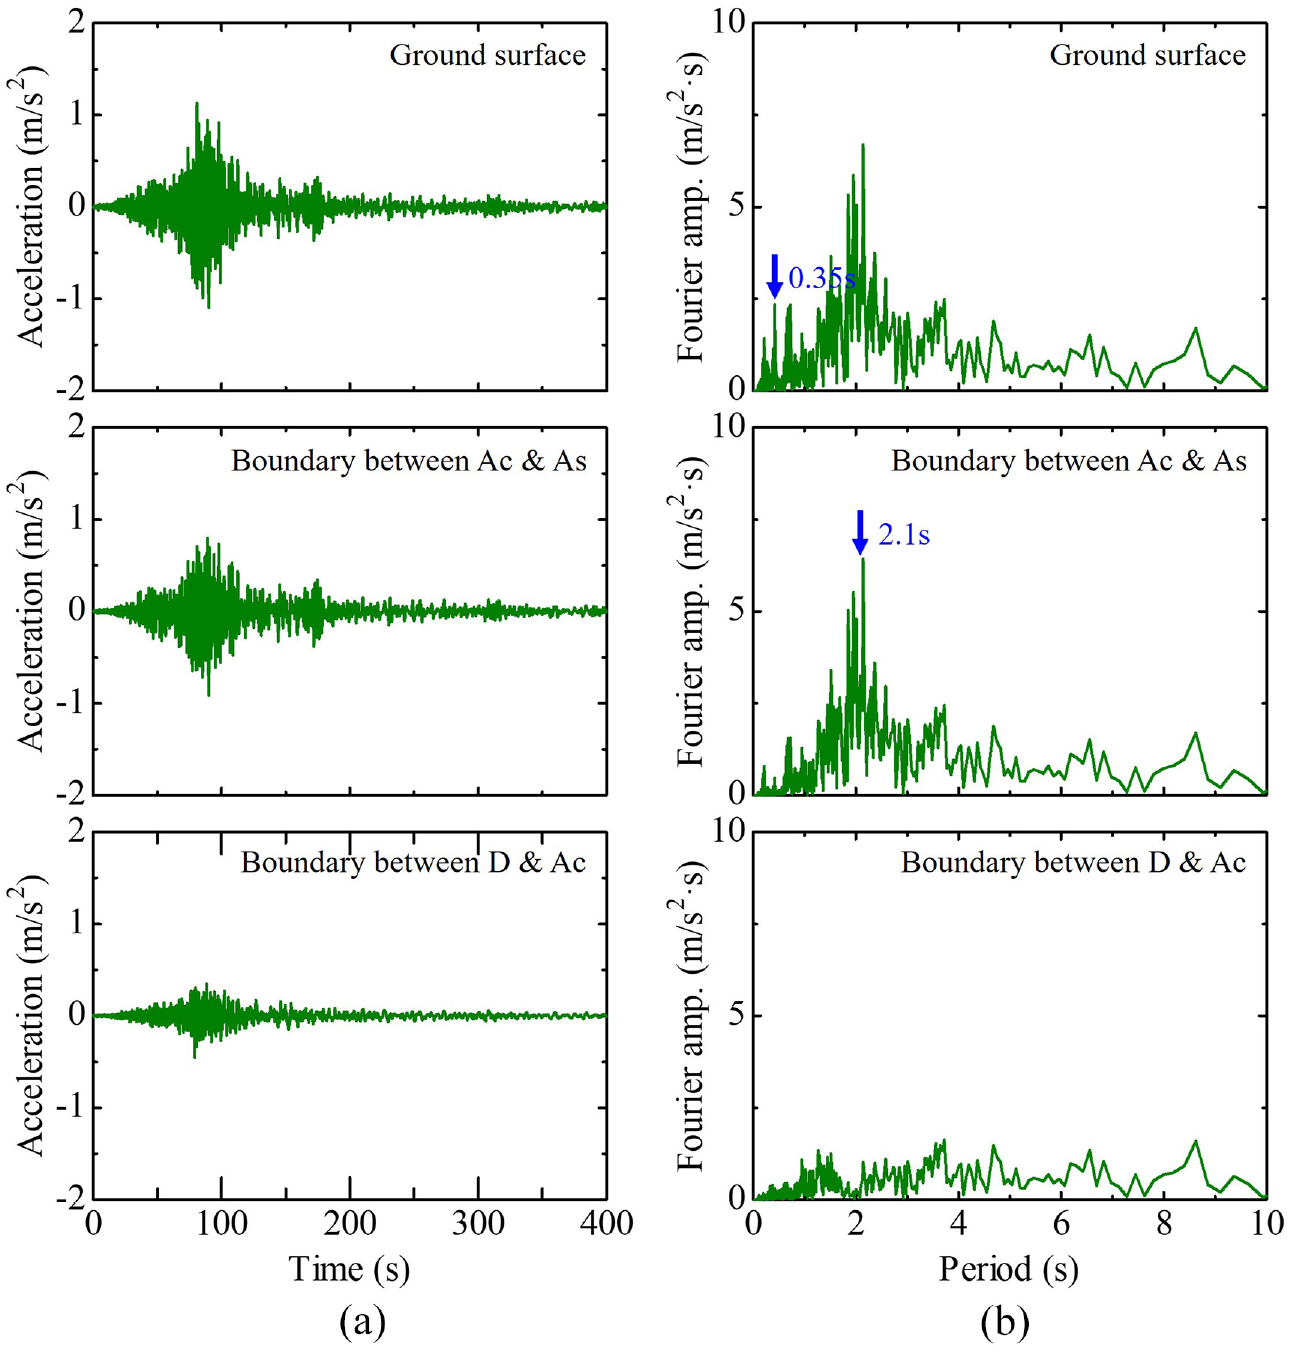
Stratified acceleration response (time history and Fourier amplitude spectrum) at point C: (a) time-acceleration relationship and (b) Fourier amplitude.
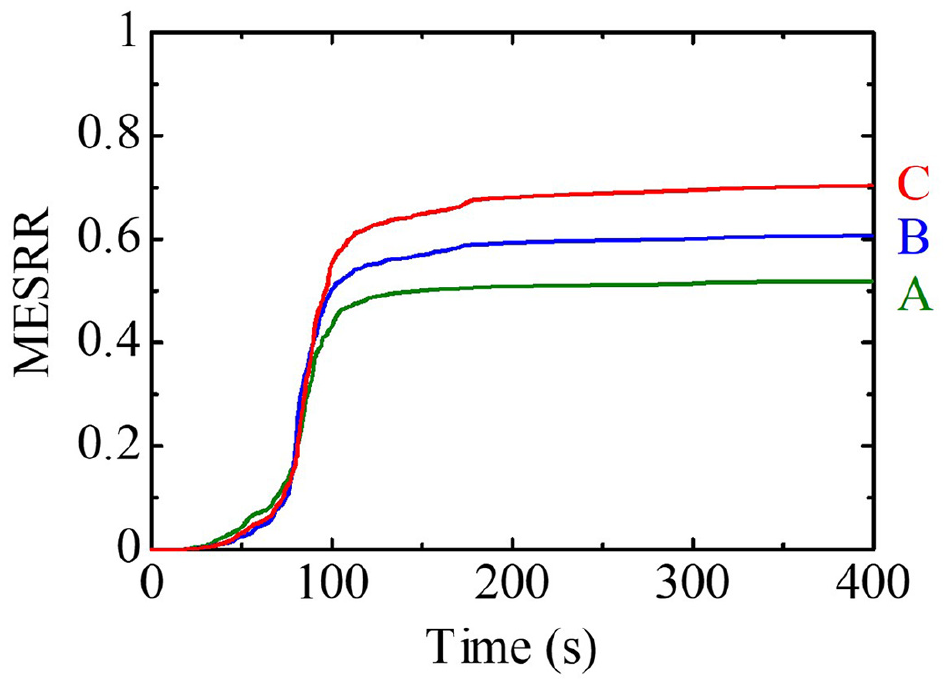
Figure 13 shows the mean effective stress reduction ratio (hereafter described as MESRR) at the center of the sandy soil layer. The MESRR is an index obtained by dividing the excess pore water pressure generated during an earthquake by the initial mean effective stress and takes a value between 0 and 1. In engineering terms, liquefaction is often indicated when the MESRR is 0.95 or greater. The figure shows that the MESRR increased rapidly near the main motion (approximately 80 s after the start of the earthquake). At point C, where the clay layer was thicker, the MESRR was larger than those at the other points, thus indicating that the point was closer to liquefaction. Although no significant difference was observed in the maximum acceleration, the amplification of the long-period component of the acceleration caused a large shear deformation at the ground surface, thus indicating that the site was closer to liquefaction compared with other sites. However, the 1D analyses revealed that liquefaction was not achieved at any of the locations.
MESRR in the center of the sandy layer at each point A to C, based on 1D analysis.
The 1D seismic response analyses with different sediment thicknesses predicted that the thicker the clay layer, the more pronounced the amplification of the long-period component and larger the displacement. However, the 1D model, considering only the differences in clay layer thickness, did not predict liquefaction at any of the locations. The sandy soil layer was modeled with three elements at each location, the clay layer with twelve elements, and the diluvium layer with five elements. Appendix 1 confirms that the number of mesh divisions was adequate for the proposed model.
Effect of stratigraphic irregularities on subsurface seismic damage (2D analyses)
Under the same ground conditions and input seismic motion as the previous 1D analyses, 2D seismic response analyses were conducted to consider the effect of stratum irregularities. Figure 14 shows a velocity vector diagram around the base of the slope 150 s after the start of the earthquake motion. The length of the arrow in the lower right indicates the magnitude of the velocity, and the color indicates the vertical component of the velocity. Although the seismic motion was input only horizontally, a vertical motion was generated around the base tilt. Vertical motion is large at the surface but rapidly decreases at depth, and surface oscillations follow a counterclockwise trajectory. These features are well-known as characteristics of the surface waves (Here we refer to Rayleigh waves oscillating in the plane). Surface waves generate at the base of the tilt and propagate to the right side of the figure. This type of surface wave is naturally not generated in horizontally stratified ground.
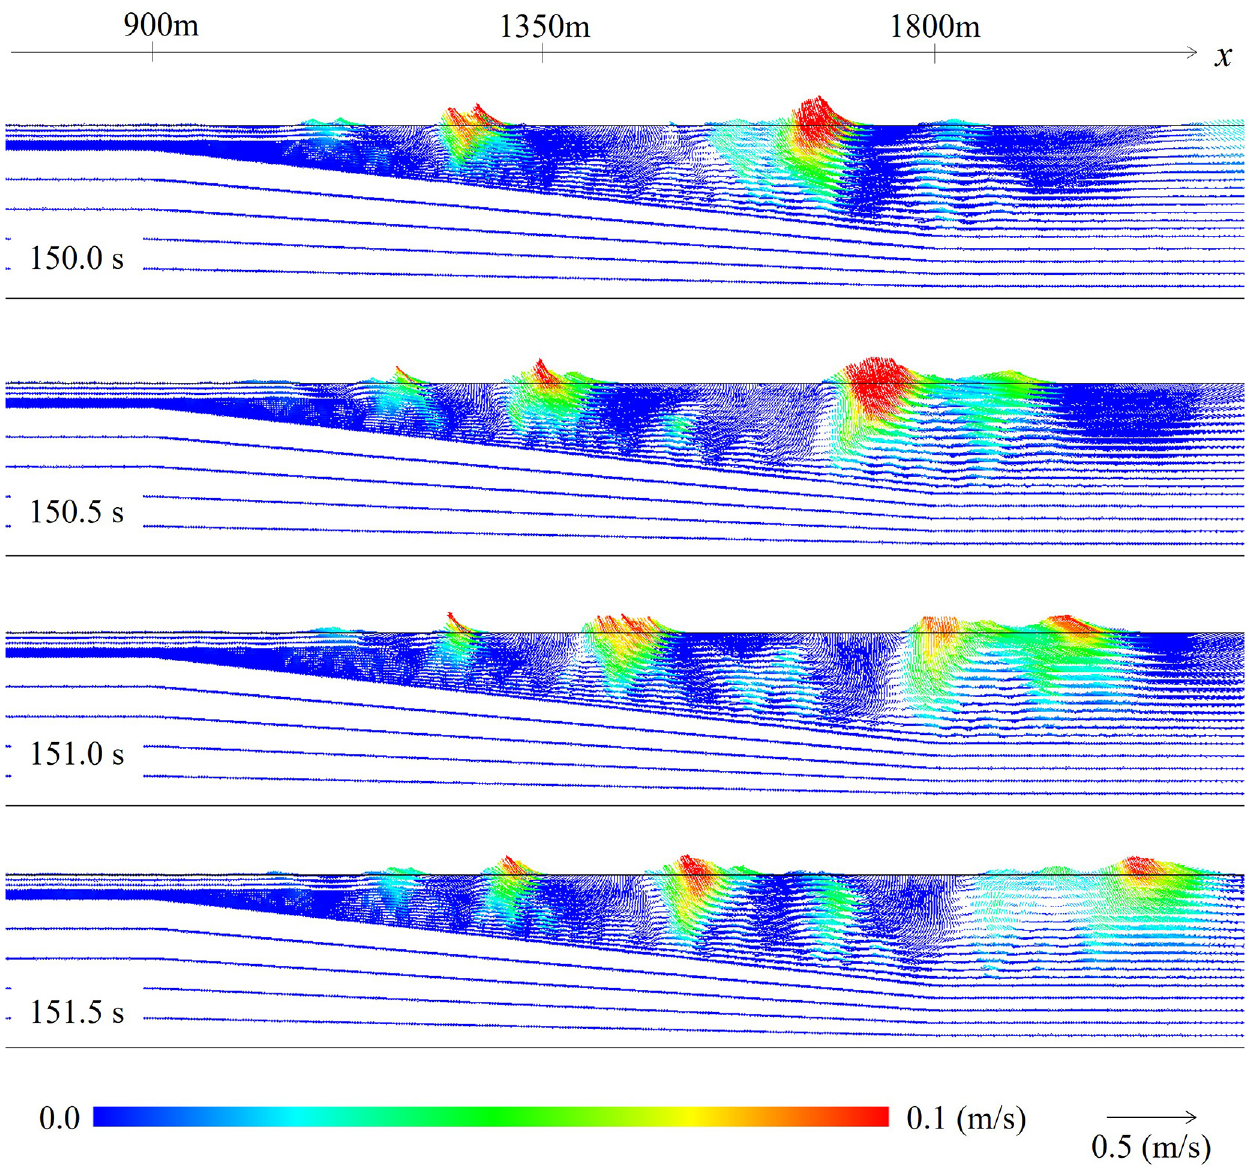
Velocity vector diagram around the base of the slope.
To confirm the generation and propagation characteristics of seismic motion in irregularly shaped basement structures, surface velocity waveforms at different points in the analysis region are shown in Figure 15. The vertical axis represents horizontal coordinates of the model, and horizontal and vertical velocity waveforms at different points are shown alongside each other. The scale-bar of the velocity is shown in the upper right corner of each figure. Evidently, vertical motion did not occur on the left side of the slope (x < 900 m) but occurred after the base of the slope (x = 900 m) owing to the stratum irregularity. Separating the body and surface waves in the horizontal motion is challenging owing to the long duration of the earthquake motion; nonetheless, the vertical motion clearly shows that the surface waves were excited at the base of the tilt. The surface waves propagated to distant locations with the wave packets dispersing, and the small distance attenuation is another characteristic of the surface waves. The propagation velocity of surface waves was approximately 80–100 m/s; this is roughly consistent with the value of the shear velocity Vs measured in the field (Nakai et al., 2014). Figure 16 shows the vertical velocity waveform and its Fourier amplitude spectrum at x = 10,500 m. The surface waves were dominated by a slightly long-period component, with a period of 1–2 s. For reference, Appendix 2 shows the results from the analysis for a case of a short-duration earthquake motion. Evidently, when the duration was short, the excitation, propagation, and dispersion of the surface waves were obtained in both the vertical and horizontal motions. In addition, a slightly long-period component with a period of 1–2 s dominated the surface waves, even for the different seismic motions. Because the surface wave characteristics are caused by the ground structure, no significant differences were observed in the dominant period and propagation velocity between the different earthquake ground motions. As is well-known, the surface wave characteristics are also affected by the thickness of the deep base. Thus, the validity of the base thickness set in this analytical model was validated in Appendix 3 and confirmed that the base layer is modeled to be of sufficient thickness. Through these comparisons, the analytically reproduced surface waves were validated.
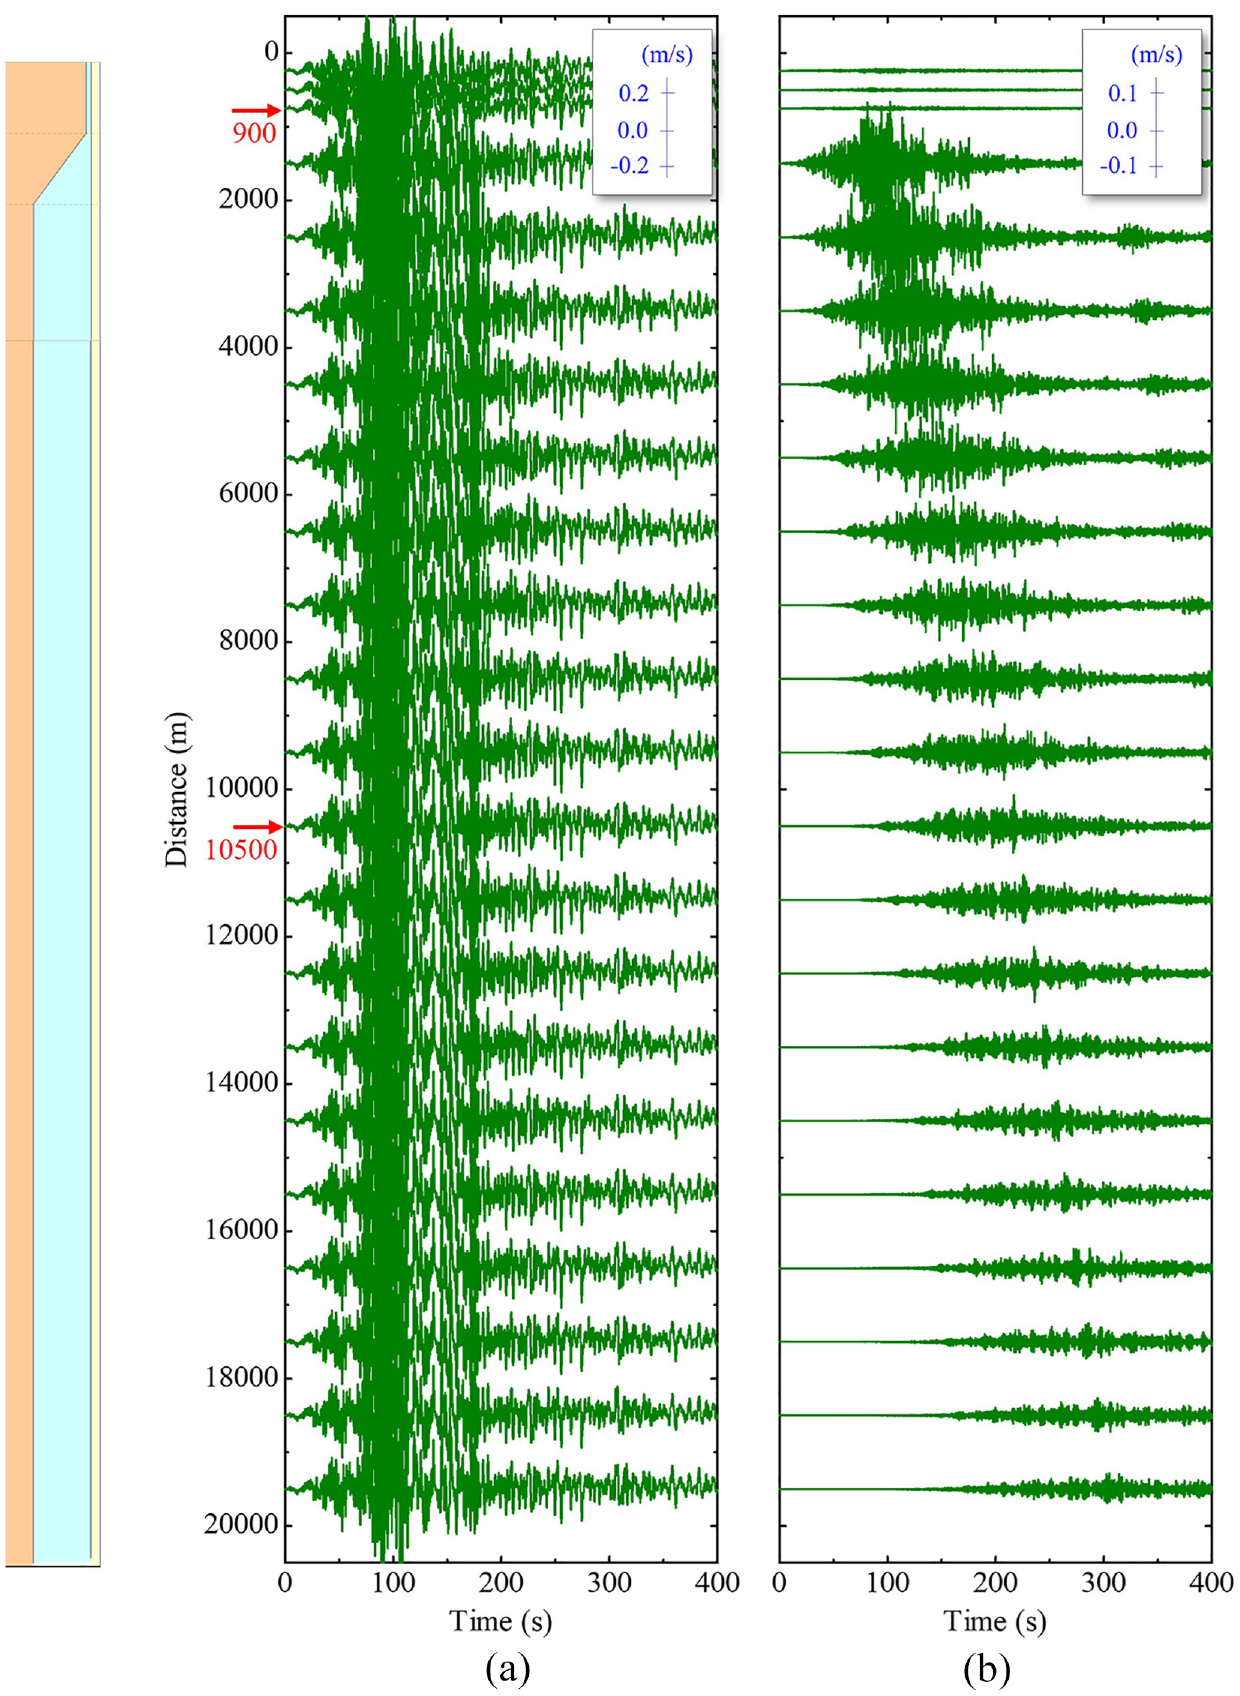
Velocity vector diagram around the base of the slope: (a) horizontal direction and (b) vertical direction.
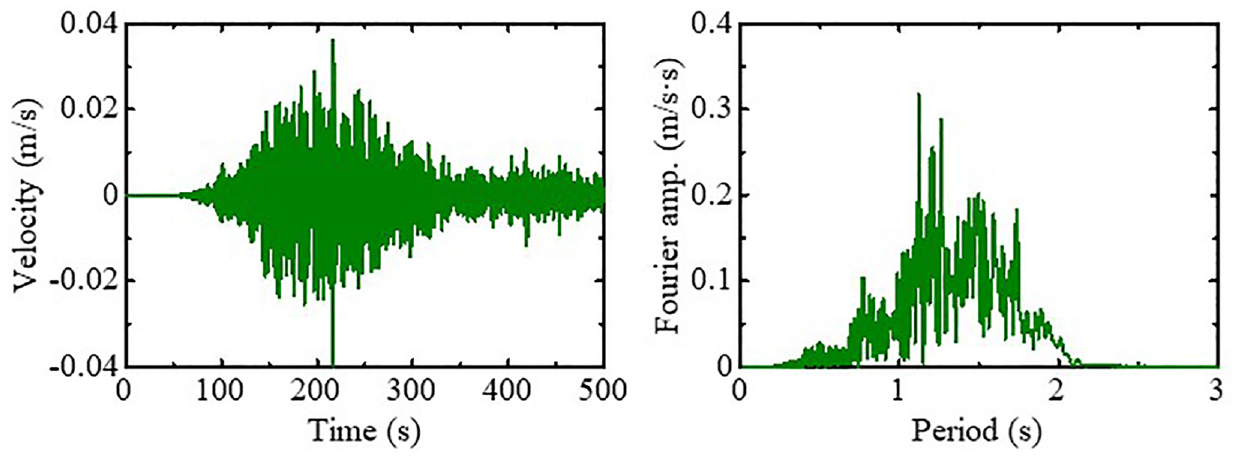
Velocity response of surface wave vertical motion at x = 10,500 m.
Figure 17 shows the distributions of the maximum values of displacement, velocity, and acceleration at the ground surface in both vertical and horizontal directions. The horizontal axis represents horizontal coordinates of the model. The values at both edges were almost equal to those from the results of the 1D analyses. Evidently, the acceleration was maximum immediately above the slope, whereas the displacement and velocity were maximum on the right side of the slope and were nonuniform. This nonuniform damage is owing to the surface waves excited at the base of the slope, as well as the focal effects caused by the refraction and reflection of the body waves at the formation boundary. It is also owing to the “edge effects” (Kawase et al., 1998), that is, the amplified interference effects between the surface and body waves at the localized points.
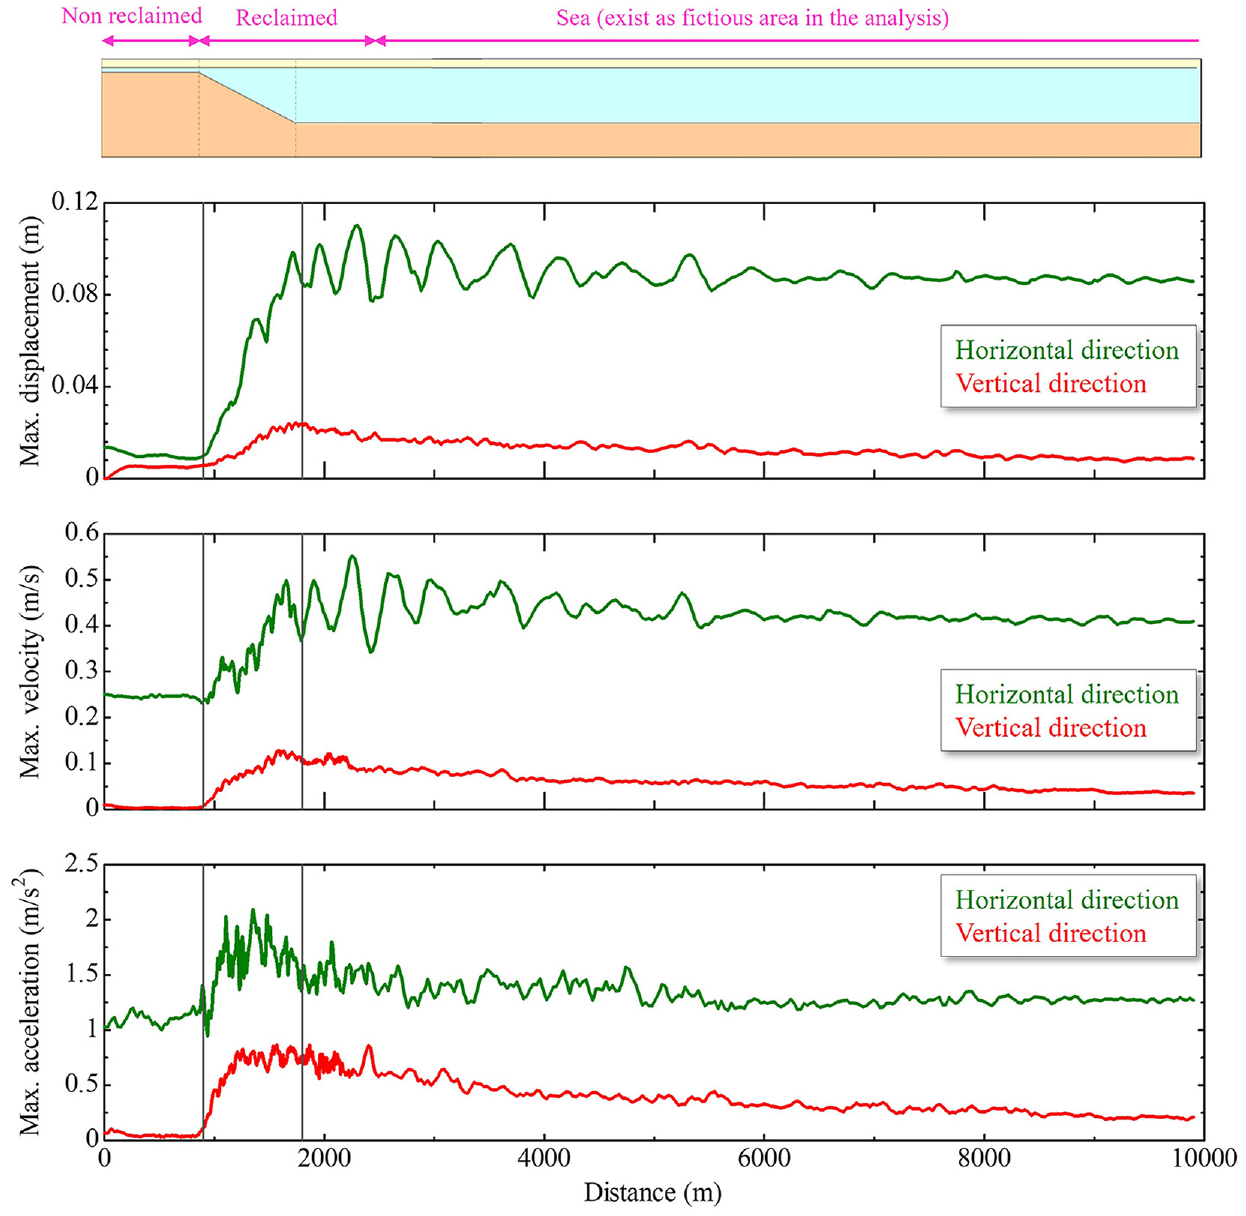
Distributions of maximum horizontal displacement, velocity, and acceleration at ground surface.
Finally, the effects of the stratum irregularity on the liquefaction damage were reviewed. Figure 18 shows the distribution of the MESRR 100 s after the earthquake. The left side of the slope exhibited a small increase in the MESRR, which implies no liquefaction, whereas the right side exhibited liquefaction as the MESRR increased to approximately 1.0. Similar to the shear strain distribution, the MESRR distribution was spatially nonuniform, consistent with the characteristics of actual liquefaction damage in Urayasu. Figure 19 shows the change in the MESRR at the center of the sand layer at points A (x = 450 m), B (x = 1050 m), and C (x = 2300 m), respectively. The results from the 1D analyses shown in Figure 13 are also included for comparison. Evidently, point A was not affected by the sloping base (because both the refraction of the body waves and excitation of the surface waves propagated to the right of the slope); thus, its results did not differ from those of the 1D analysis. However, at points B and C to the right of the sloping base, the MESRR increased faster than in the 1D analysis and continued to increase slowly even after the end of the main motion, eventually reaching liquefaction at both locations. In the case of 2D analysis, MESRR increased by 1.6 times at point B and 1.4 times at point C. The causes of this increase in MESRR, which differed from the results of the 1D analysis, were (as described previously) the excitation of surface waves owing to the stratigraphic irregularities, refraction and reflection of the body waves, and amplified interference effects between the body and surface waves. Figure 20 shows the acceleration response by layer at point C, the same locations as in the one-dimensional analysis in Figure 12. By comparing 1D and 2D analysis, the surface wave excitation and edge effects caused vertical motion, while the horizontal motion was larger in amplitude and longer in duration. The Fourier amplitude shows that the acceleration in the 1–2 sec periodic band by the surface waves is significantly amplified. The amplification of these slightly long period zones and the continuation of shaking contributed to severe liquefaction damage compared with 1D analysis.
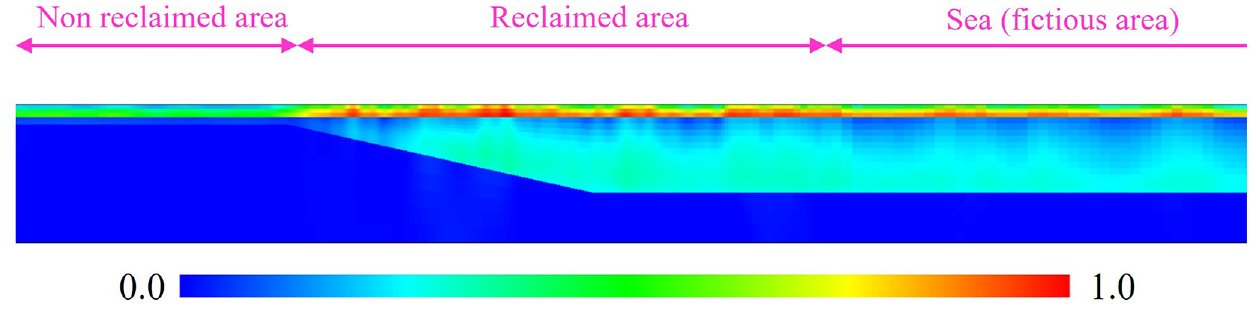
Distribution of MESRR 100 s after earthquake.
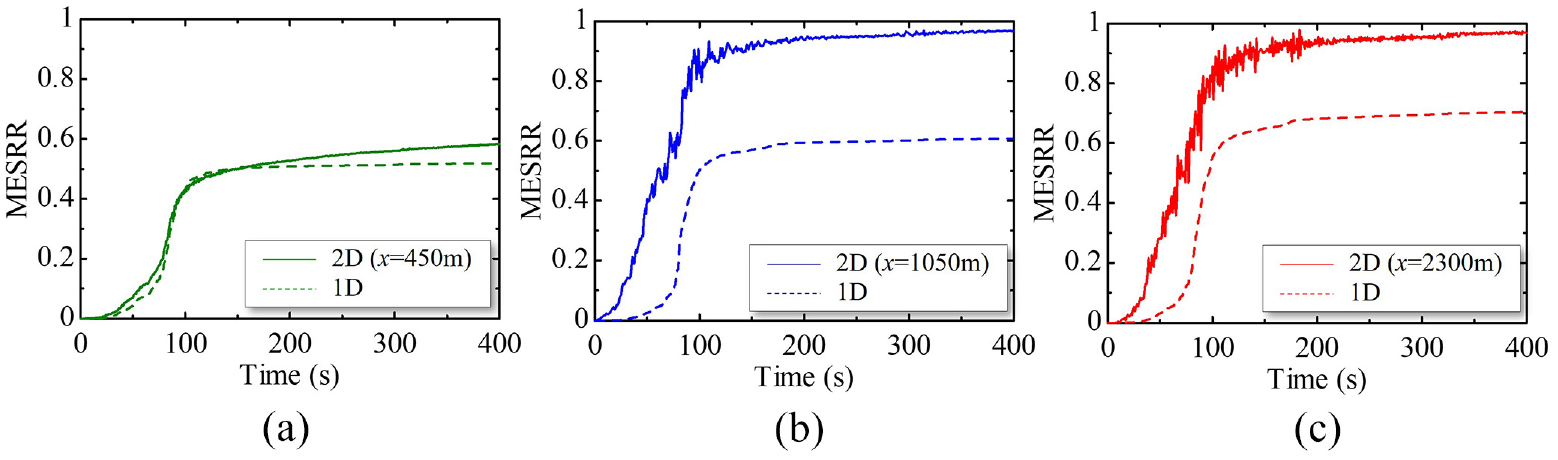
MESRR at the center of the sandy layer at points A, B, and C: (a) Point A, (b) Point B, and (c) Point C.
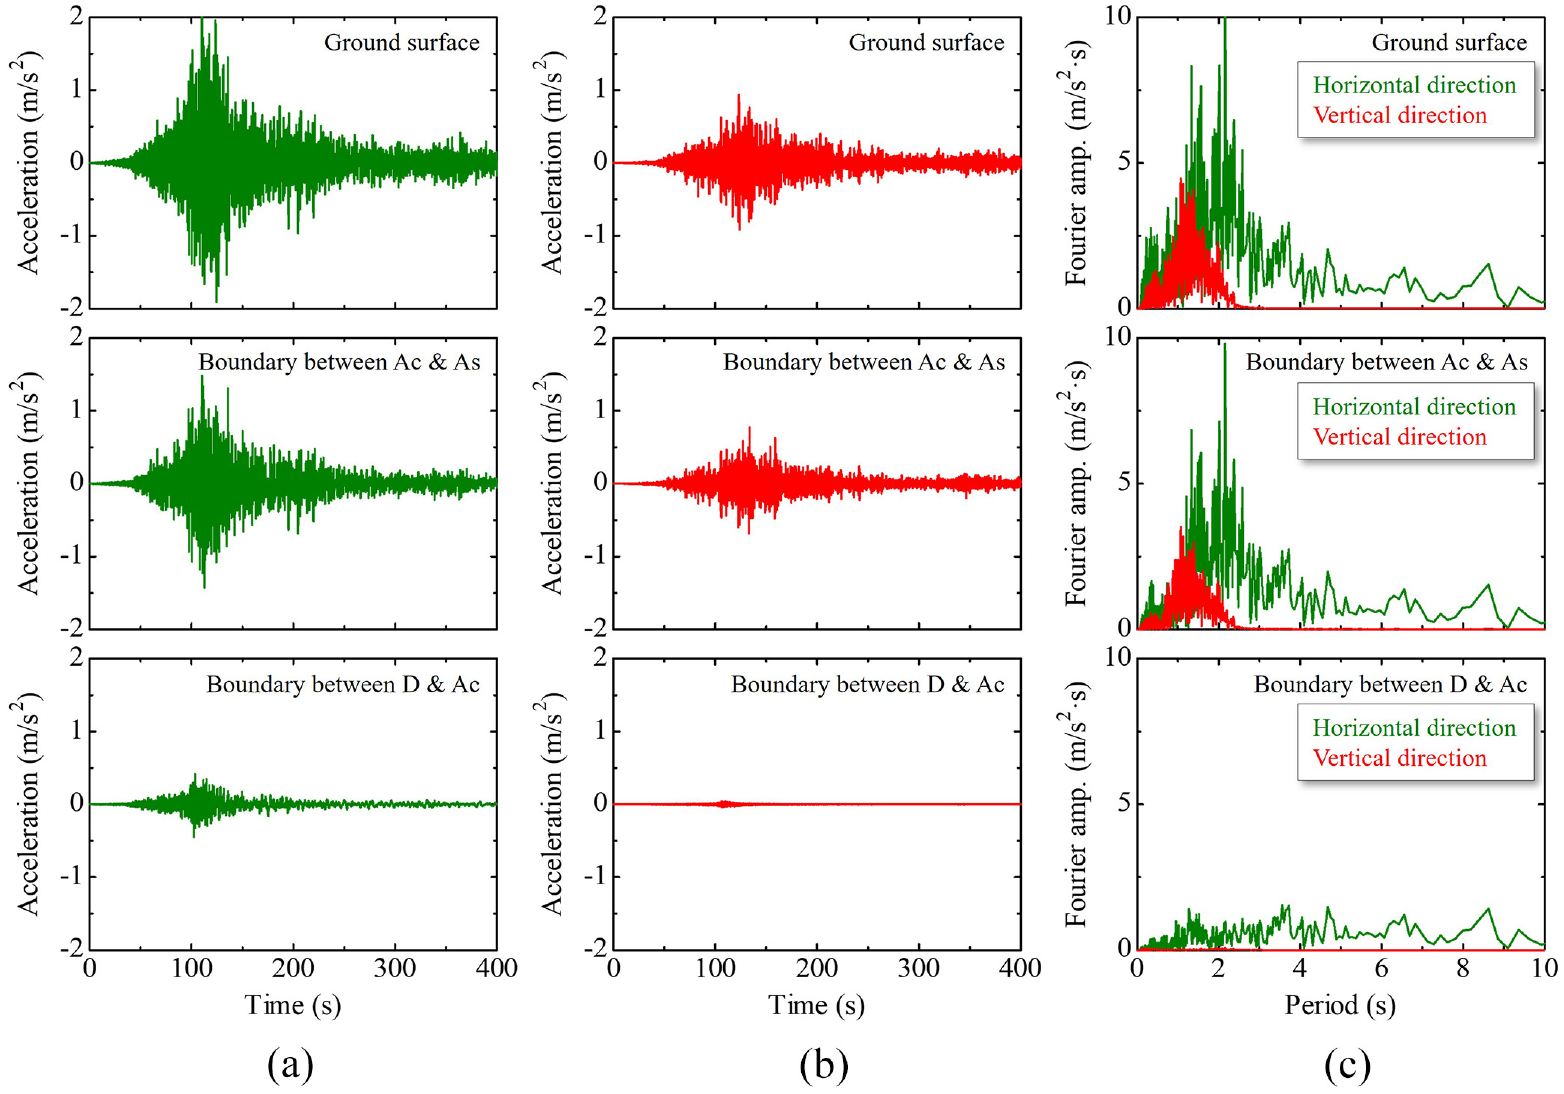
Stratified acceleration response (time history and Fourier amplitude spectrum) at point C: (a) horizontal direction, (b) vertical direction, and (c) Fourier amplitude.
Figure 21 shows the MESRR at points far from the slope (x = 10,000, 20,000, and 29,000 m). Although these points are the fictitious area that does not exist in the actual Urayasu ground, how the surface waves contribute to the rise in excess pore water pressure was confirmed. As the distance from the inclined section is not affected by the refraction or focal effects of the body waves, the results were equal to those from the 1D analysis up to approximately 200 s after the end of the main motion. Thereafter, however, the MESRR increased again with the arrival of the surface waves, starting from a location close to the slope. That is, a delayed shaking phenomenon is generated by the propagation of surface waves. Under the present analysis conditions, MESRR increased to 0.6 due to the body wave, and it further increased by 0.25 to 0.35 due to the surface wave. As shown in the analysis results, surface waves are characterized by low distance attenuation. Therefore, in the case of a closed topography, such as a basin structure, the reflection of surface waves is repeated at the edges, and the shaking stays for a long time; this may cause more severe damage to the surface ground.
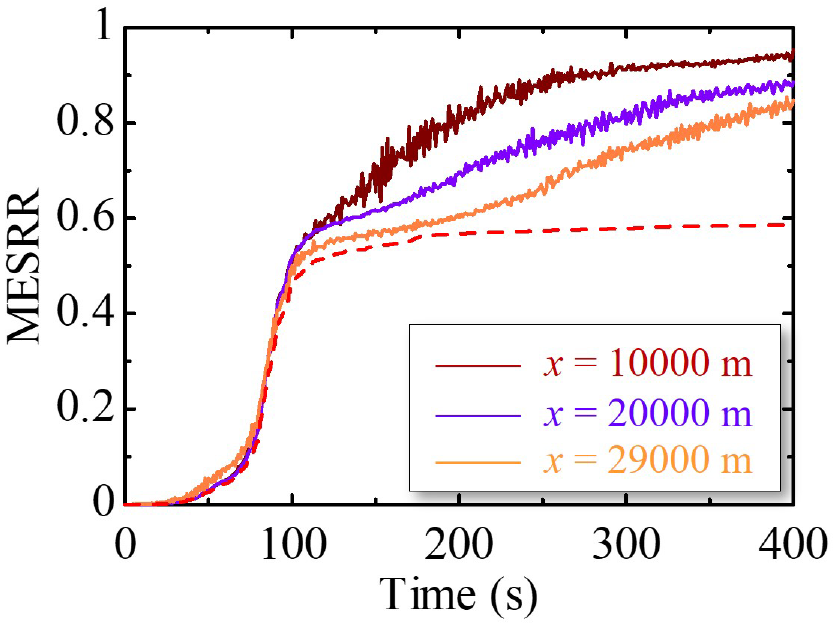
MESRR at the center of the sandy layer at a distance.
Conclusion
In this study, we investigated the seismic responses of a multi-layered ground system, focusing on the stratigraphic irregularities. The ground model was a sloping base structure with reference to the Urayasu ground, where the thickness of the sedimentary layer is not constant. The results obtained by the comparison between 1D and 2D analyses are summarized as follows.
First, numerically reproduced surface waves (Rayleigh waves) were validated from the periodic and propagation characteristics.
The thicker and softer sedimentary layers amplify the slightly long-period component of the seismic motion and increase the shaking at the ground surface.
The wave propagation in the ground is very complicated and nonuniform when considering the stratum irregularities owing to the focal effect caused by the refractions and reflections of body waves at the stratum boundary, surface wave excitation at the base of the slope, and amplified interference between body and surface waves (edge effect).
The complex wave propagation causes nonuniform surface ground shaking and liquefaction damage and can cause severe localized damage.
The results show that surface waves, which consist primarily of slightly long-period components, can propagate far and wide; as such, they can cause extensive damage owing to delayed shaking phenomena that continue even after the end of the earthquake motion.
As mentioned at the beginning of this article, liquefaction damage at Urayasu was characterized by the liquefaction of silty sand despite the comparatively small input seismic motion, and by the spatially heterogeneous and locally extensive liquefaction damage. On the bases of considering the analytical results mentioned above, the reason for the former is that, in addition to the long duration of the earthquake motion, the slightly long-period component of the body waves was amplified owing to the thick accumulation of the soft clay layers, and the surface waves excited by the strata irregularity were dominated by a slightly long-period component. Both caused slightly long-period, and long-duration shaking. Meanwhile, the reason for the latter was affected by the complex wave propagation owing to stratum irregularities, in addition to the heterogeneity of the original materials and depositional conditions. In particular, the study analytically showed that the amplified interference between surface and body waves at specific locations contributes to the spatial heterogeneity of the subsurface ground damage, including liquefaction. The stratigraphic irregularities focused on in this study are not rare features limited to the Urayasu area but exist in numerous sedimentary plains and sedimentary basins, albeit on a smaller or larger scale. The results of this analysis suggest that multidimensional elasto-plastic seismic response analyses considering stratigraphic irregularities are important for detailed seismic evaluation.
In this study, 2D plane strain seismic response analysis has been performed using a simple ground model assuming that the soil is homogeneous and uniform under a linearly sloping base structure. However, the stratigraphic irregularity of the actual ground forms a complex structure with a lot of unevenness, and the type and density of the deposited soil are spatially unevenly distributed. In the future, we will conduct systematic analyses with different stratigraphic irregularities and soil types to confirm the effects of these factors on surface ground seismic damage. In addition, since this study focused on the influence of surface waves on seismic damage, an analytical model in which the fictious ground is continuous in the horizontal direction was used instead of modeling the existing seawall at Urayasu. We would like to investigate the effects of wave reflection due to the presence of seawalls on the liquefaction and oscillation characteristics of reclaimed ground as a future topic. Furthermore, we will reproduce the irregularity of the strata in a 3D model and evaluate the seismic response considering the effect of not only the Rayleigh waves but also the Love waves.
Footnotes
Appendix 1
Appendix 2
Appendix 3
Acknowledgements
Input seismic motions were obtained from the strong-motion observation network of the Bureau of Port and Harbor, Tokyo Metropolitan Government, National Research Institute for Earth Science and Disaster Resilience (NIED, K-net), and Japan Meteorological Agency. The borehole data used for elasto-plastic modeling were from the Chiba Prefectural Geological Environment Information Bank. The authors would like to express their gratitude.
Declaration of conflicting interests
The author(s) declared no potential conflicts of interest with respect to the research, authorship, and/or publication of this article.
Funding
The author(s) disclosed receipt of the following financial support for the research, authorship, and/or publication of this article: This research was supported in part by Grants-in-Aid from the Japan Society for the Promotion of Science (JSPS “Kakenhi” 25249064).