
Abstract
The detailed evaluation of expected losses and damage experienced by structural and nonstructural components is a fundamental part of performance-based seismic design and assessment. The FEMA P-58 methodology represents the state of the art in this area. Increasing interest in improving structural performance and community resilience has led to widespread adoption of this methodology and the library of component models published with it. This study focuses on the modeling of economies of scale for repair cost calculation and specifically highlights the lack of a definition for aggregate damage, a quantity with considerable influence on the component repair costs. The article illustrates the highly variable and often substantial impact of damage aggregation that can alter total repair costs by more than 25%. Four so-called edge cases representing different damage aggregation methods are introduced to investigate which components experience large differences in their repair costs and under what circumstances. A three-step evaluation strategy is proposed that allows engineers to quickly evaluate the potential impact of damage aggregation on a specific performance assessment. This helps users of currently available assessment tools to recognize and communicate this uncertainty even when the tools they use only support one particular damage aggregation method. A case study of a 9-story building illustrates the proposed strategy and the impact of this ambiguity on the performance of a realistic structure. The article concludes with concrete recommendations toward the development of a more sophisticated model for repair consequence calculation.
Introduction
The primary objective of conventional seismic design and retrofit of buildings is to keep collapse risk below a predefined threshold by ensuring sufficiently high strength and ductility at the building level (ACI 318-19, 2019; ANSI/AISC 341-16, 2016; EN 1998-1:2008, 2008). Experiences from large earthquakes at the end of the twentieth century confirmed that such designs indeed prevent collapse and achieve life safety objectives, but the same experiences also highlighted the substantial economic consequences of structural damage in buildings that did not collapse (McKevitt et al., 1995; Tremblay et al., 1996). These observations pointed out the need to limit the amount of damage and corresponding monetary losses under smaller, more frequent seismic events. Over the last decades, substantial research effort has been dedicated to developing a framework for the simulation of seismic damage and losses in buildings so that engineers and other stakeholders can better communicate these outcomes and make more effective design and retrofit decisions. The Pacific Earthquake Engineering Research (PEER) center developed a performance-based earthquake engineering framework that simulates the seismic performance of structural and nonstructural components of a building to arrive at estimates of so-called decision variables (DVs) such as repair cost, downtime, and casualties (Cornell and Krawinkler, 2000; Miranda and Aslani, 2003; Moehle and Deierlein, 2004). The PEER framework quantifies and propagates various sources of uncertainty in the seismic hazard phenomena and structural behavior. The framework decouples models that describe the intensity of the seismic event (IM—intensity measure), the structural response (EDP—engineering demand parameter), the expected damage (DM—damage measure), and the consequences of damages (DV). These models are combined by applying the theorem of total probability three times, which leads to the following triple integral that has become ubiquitous in structural performance assessment (Attary et al., 2017; Barbato et al., 2013; Ciampoli et al., 2011):

where G() is the complementary cumulative distribution function (CDF) or exceedance function, and λ() is the hazard intensity exceedance function also known as the hazard curve.
Finding a closed-form solution for this triple integral is challenging because the underlying models are typically complex and nonlinear. The PEER framework was used in the ATC-58 project to develop the FEMA P-58 methodology (FEMA P-58-1, 2018) that provides a numerical approach to estimate the triple integral through Monte Carlo simulation. The ATC-58 project also prepared a library of fragility curves and consequence functions that provide parameters of damage and consequence models for more than 700 common structural and nonstructural components in typical buildings. This library is used by researchers and practitioners to implement the methodology in practice. Based on the guidelines in FEMA P-58, several software tools have been developed and are currently available to the engineering community to facilitate further research and practical adoption of seismic performance assessment (e.g. FEMA P-58-3, 2018; Haselton Baker Risk Group, 2020; Zsarnóczay and Deierlein, 2020).
FEMA P-58 influenced the performance-based design procedures developed for structural retrofits (ASCE/SEI 41-17, 2017) and tall buildings (Los Angeles Tall Buildings Structural Design Council (LATBSDC), 2020; Tall Buildings Initiative (TBI), 2017) that use simulated structural response, damage, and loss values to arrive at designs that achieve predefined damage and loss limitation objectives. Lessons learned from earthquakes of the last decade (Shrestha et al., 2021; Stevenson et al., 2011) pointed out the need to better understand and constrain damage consequences, especially the time it takes for buildings to regain basic functionality before completing all repair interventions. Several research groups and institutions are developing guidelines (EERI, 2019; FEMA P-2090/NIST SP-1254, 2021) and simulation methods (ATC 138-3, 2021; Molina Hutt et al., 2022; Terzic et al., 2021) to support an extension of existing design procedures with regulations that effectively limit so-called functional recovery times. The influence of the correlation between damage to different components is another important issue that will require further investigation in future studies (Baker et al., 2023).
Both performance-based design and functional recovery time calculations rely on the FEMA P-58 methodology to simulate the earthquake consequences (i.e. DVs) for each building component. The FEMA P-58 methodology is currently being reviewed and updated within the scope of the ATC 138 project. One of the anticipated major updates is the introduction of correlation between component vulnerabilities to simulate more realistic damages in the building. The updated methodology will yield different damage and loss results, but the authors are not aware of any changes that would address the problem presented in this study. Although introducing correlated component vulnerabilities will result in different quantities of damaged components across the building, based on the currently available information, the problem presented below will still affect the consequence calculations.
This article focuses on ambiguity in consequence modeling as per FEMA P-58 that can have a significant impact on the simulated repair costs and repair times and affect performance assessment, design, and functional recovery time calculation. The FEMA P-58 methodology involves five main steps for calculating repair consequences for each realization of a Monte Carlo simulation (Figure 1): (1) the response of a building is characterized by sampling EDPs conditioned on IMs that represent the local seismic hazard; (2) the building is checked for irreparable damage due to either collapse or excessive residual drift; (3) each building component’s damage state (DS) is calculated using EDP realizations from step 1 and component-specific (CS) fragility functions; (4) the unit repair cost of each damaged component is calculated using aggregated damaged quantities and the consequence model associated with each DS; and (5) the product of unit repair costs and damaged quantities is aggregated across all components in the building.
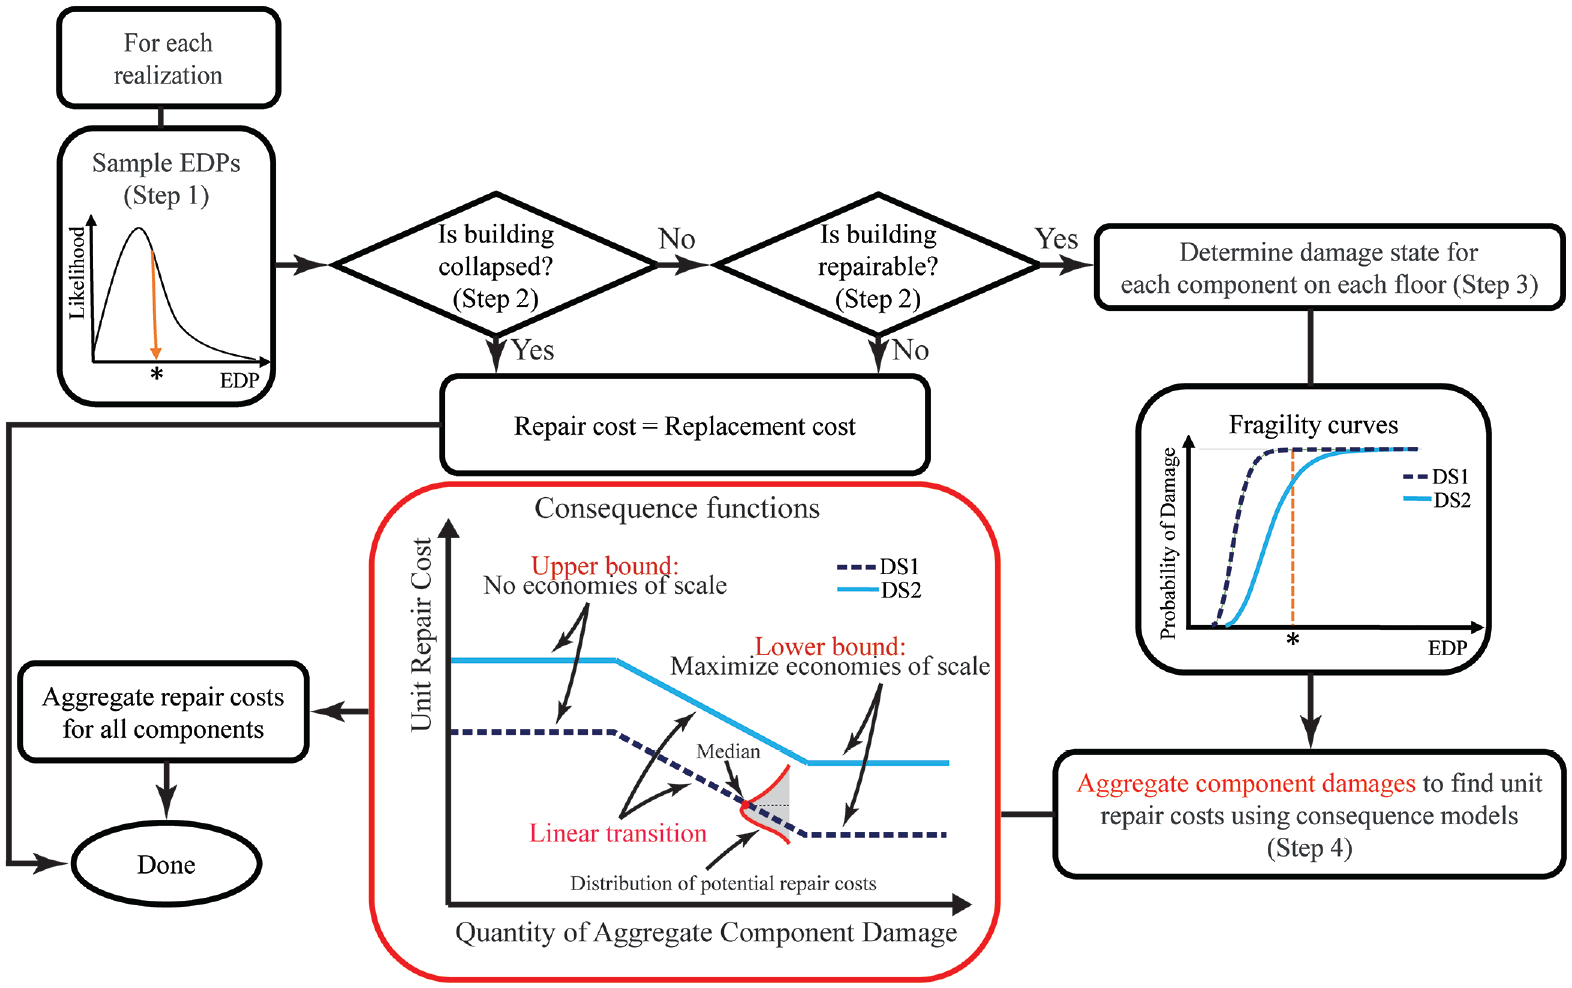
Flowchart of the FEMA P-58 methodology for the total repair cost calculation.
This article focuses on the consequence models used in step 4 of the procedure. These models describe damage effects (FEMA P-58-1, 2018) using distributions of probable consequences, such as repair cost and time. The shape of a typical median consequence function associated with a specific DS is illustrated in the red box in Figure 1. The aggregate quantity of damaged components is used as an input to consequence functions to determine the median unit repair cost for each damaged component. The applied unit repair cost is then determined by sampling a random distribution of potential repair costs assuming either a normal or a lognormal distribution with a predefined variance and using the median unit repair cost determined from the consequence function. Upper- and lower-bound quantities introduce economies of scale or operational efficiencies in the model to consider the cost savings when similar repairs are performed multiple times, or the same preparations affect multiple repairs in the building. Examples of operations affected by economies of scale include removal or protection of contents close to a damaged area, procurement and delivery of new materials, and clean-up and replacement of contents. If fewer components are damaged than the lower-bound quantity, no economies of scale are considered; if more components are damaged than the upper-bound quantity, all reasonable economies of scale and operational efficiencies are considered, resulting in the lowest possible median unit repair cost. Median consequences for intermediate quantities are calculated with linear interpolations.
The FEMA P-58 manual lacks specific instructions on computing the aggregate damage (i.e. the quantity of aggregate component damage used to evaluate the impact of economies of scale when determining the median consequence), resulting in different possible interpretations and corresponding repair cost estimates. The main objective of this study is to review how different approaches for calculating the aggregate damage affect seismic loss estimation through economies of scale and highlight the practical scenarios when the results are substantially affected by the adopted interpretation. Four approaches are reviewed in detail as edge cases to characterize the domain of all possible interpretations of aggregate damage within the scope of FEMA P-58. The following sections explore which component types are more sensitive to the interpretation of the economies of scale and the other parameters of a seismic performance assessment that can have substantial impact on this part of the repair cost calculation. The findings are illustrated through the detailed seismic loss assessment of a 9-story building equipped with various nonstructural and structural components. The last part of the article discusses the advantages of developing a more comprehensive approach that could leverage research developments since the publication of FEMA P-58 and encourage future work in this area. Although this article focuses on repair costs when describing the impact of possible interpretations on consequences, it is important to emphasize that the same issue arises with repair time simulation as well.
Aggregate damage calculation in a FEMA P-58 analysis
Two main questions arise when calculating aggregate damage of a particular component type to evaluate the impact of economies of scale in a consequence model: (1) Do repairs across different repair tasks (i.e. different DSs) include similar operations that could lead to cost reductions when multiple repair tasks need to be performed simultaneously in the same location?; and (2) Do we expect cost reductions when identical repair tasks are performed at different locations across the building, or should only damages on the floors that are repaired at the same repair phase be taken into account? The answers to these questions lead to four interpretations of the aggregate damage calculation that we consider edge cases and use to discuss the range of all possible interpretations:
Illustrative example of aggregate damage calculation for partition walls
To illustrate how the four interpretations introduced above influence the repair calculation in a FEMA P-58 analysis, 10 units of partition walls are considered on each floor of a 2-story building. Table 1 shows quantities of damaged items for the considered partition wall components on each floor and in each DS for a single damage realization. The repair consequence functions provided in the FEMA P-58 library for the partition wall component C1011.001b were used, and median repair costs were used directly as deterministic consequences for the sake of clarity in the example. The total costs to repair the partition walls in the building, estimated using the four different interpretations for aggregate damage, are also shown in Table 1. Figure 2 shows the consequence functions for this component and illustrates the evaluation of unit repair costs for each interpretation.
Illustrative example of the four interpretations to estimate the total repair cost of a component in two DSs across two floors in a building
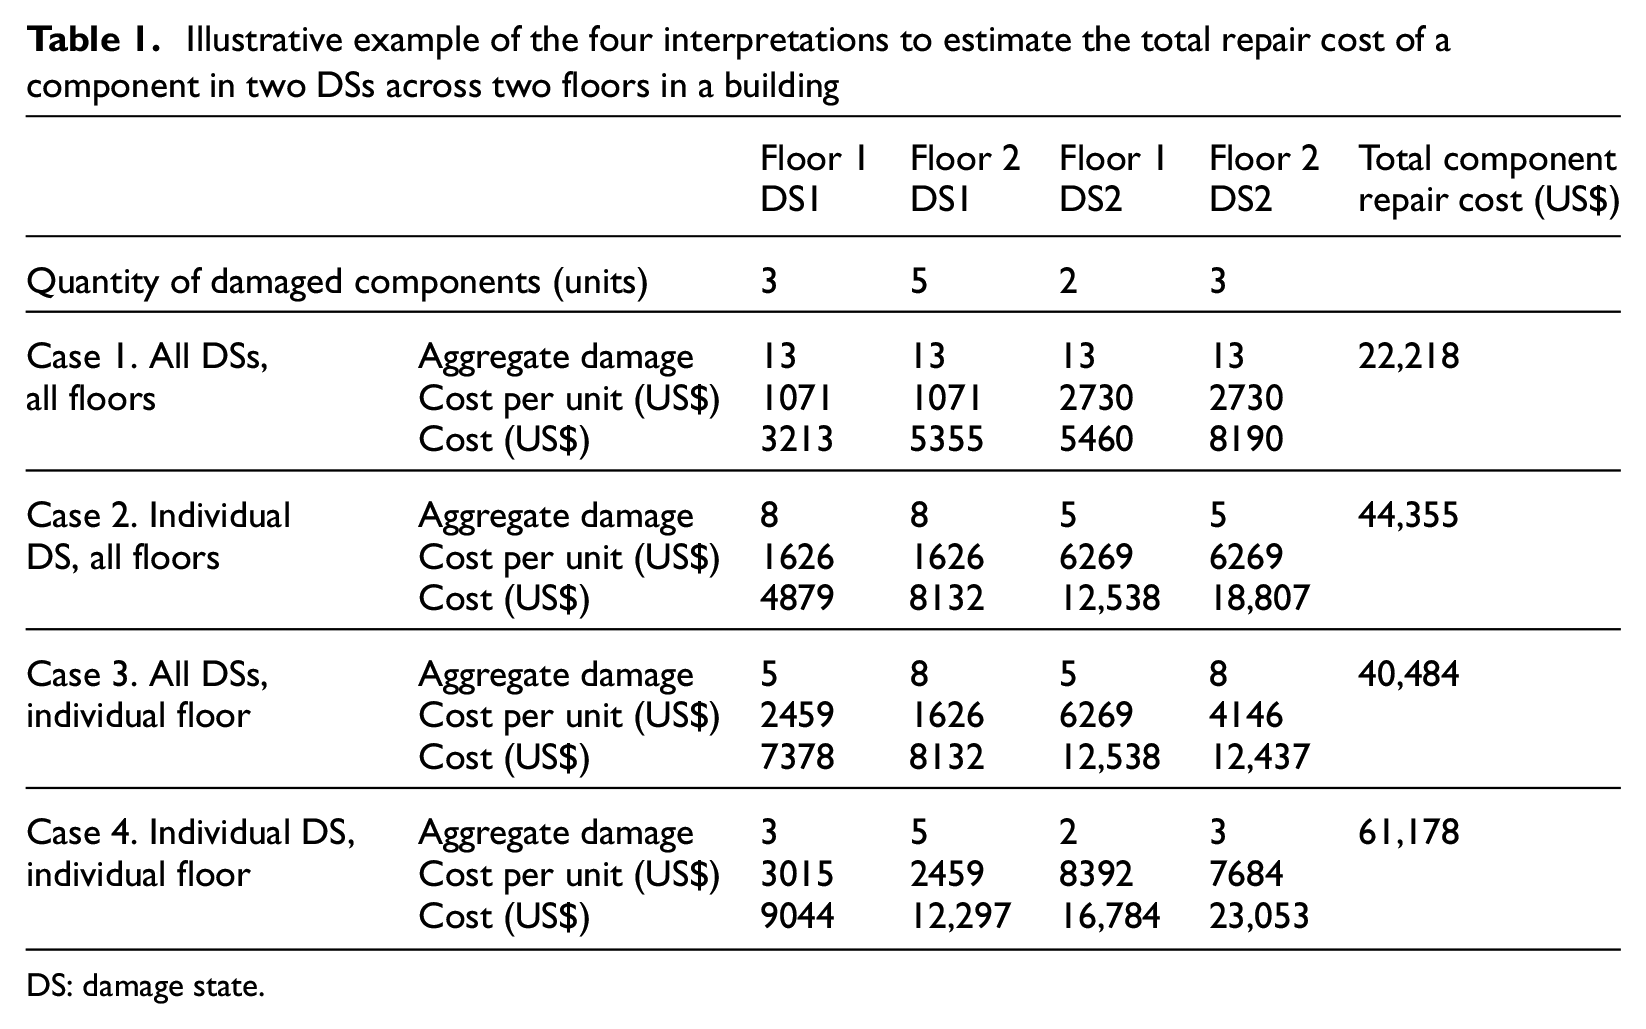
DS: damage state.
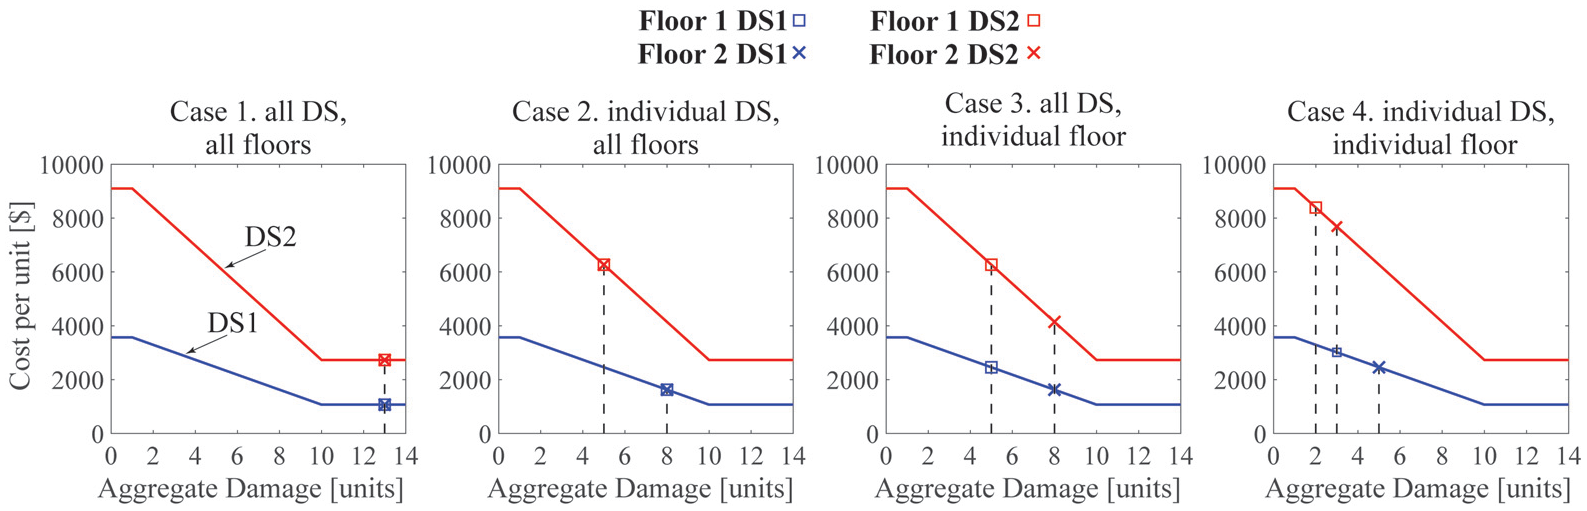
Illustrative example of the four interpretations to estimate unit repair cost of a component in two DSs across two floors in a building.
The total repair cost is approximately three times higher for Case 4 (i.e. “Individual DS, individual floor”) than for Case 1 (i.e. “All DSs, all floors”). Case 1 yields the lowest total repair cost since maximum economies of scale are applied, which means the minimum unit repair costs are assigned to all damaged components, regardless of their floor or DS. In Case 4, on the contrary, a higher unit repair cost is assigned to damaged items (Figure 2), because the smaller aggregate damage quantities lead to less cost savings through economies of scale. The total repair costs in Case 2 (i.e. “Individual DS, all floors”) and Case 3 (i.e. “All DSs, individual floor”) are approximately the average of those calculated for Cases 1 and 4. The observed variation in total repair costs is solely attributable to the method used to aggregate damages for modeling economies of scale.
Practical example
The previous example illustrates that different interpretations of damage aggregation can yield substantially different repair costs for an individual component. However, the impact on repair costs depends on several factors, and the following section shows that for an individual component there are also cases where the impact is negligible. However, the following example uses a practical, realistic performance model to demonstrate that a few components that experience substantial changes in their repair costs can still have a significant impact on the total repair cost of a building. The example performance models bundled with the PACT software are considered, and the total repair costs are calculated with each of the four edge interpretation cases introduced earlier. The archetype is a 3-story office building with a floor area of 22,736 ft2 and a floor height of 14 ft in the first story and 11.5 ft in upper floors. This reinforced concrete moment-resisting frame structure was designed for a site in Berkeley, California. There are 15 different nonstructural components and one structural component assigned to each floor in various quantities. A complete specification of component types and assigned quantities is provided in the corresponding PACT example file, and the uncertainty in consequence functions suggested by FEMA P-58-3 is considered. Volumes 2 and 3 of FEMA P-58 provide more information on this performance model (FEMA P-58-2, 2018; FEMA P-58-3, 2018).
Figure 3 shows the CDF of the calculated total repair costs for the four edge cases under a 420-year return period earthquake. Case 1 (i.e. “All DSs, all floors”), which is used in the PACT software and always leads to the lowest repair costs, is considered a reference and is compared with the other edge cases that yield 10%–26% (US$78,000–US$195,000 in absolute value) higher median repair costs. A variation of this magnitude has the potential to result in an overestimation or underestimation of assessed losses that could impact stakeholders’ decision-making.
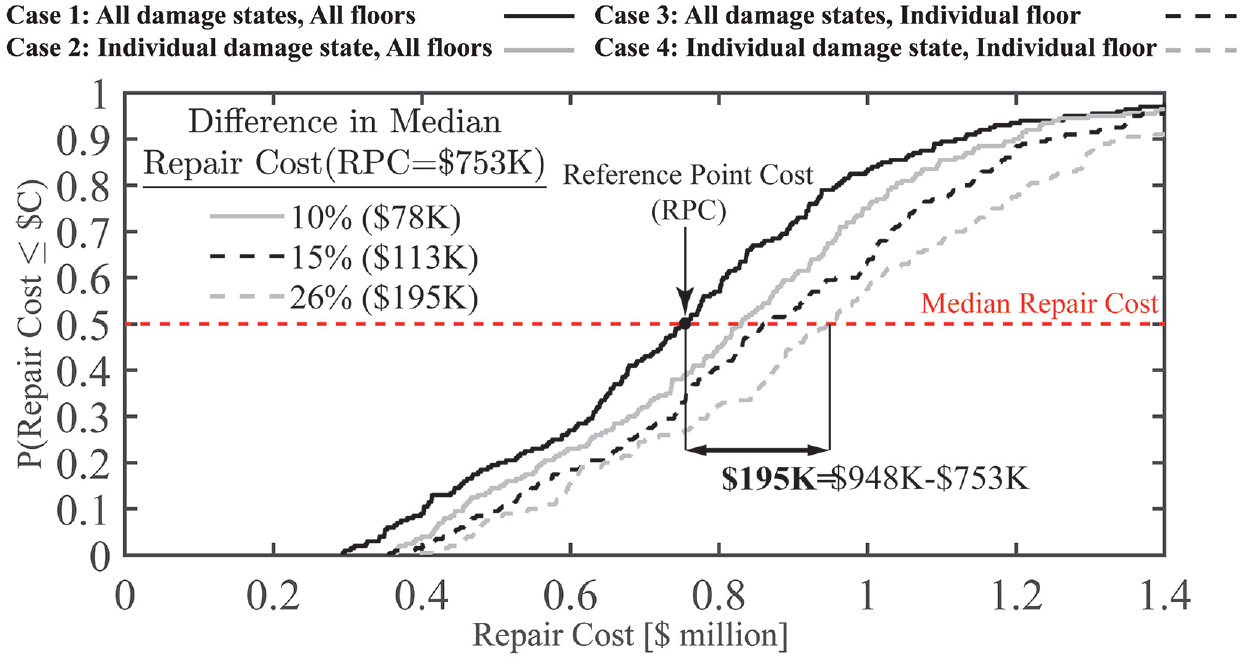
Cumulative distribution functions of total repair cost from analyses using different interpretations for damage aggregation in a case study 3-story office building.
Drivers of economies of scale in FEMA P-58
This section identifies the key drivers that affect the economies of scale calculation in FEMA P-58 and offers guidance on recognizing when the result of a performance assessment is significantly affected by the choice of damage aggregation method. The variance in total repair costs is more pronounced when one damage aggregation method yields a sufficiently large quantity of damaged units to trigger maximum economies of scale (i.e. lower-bound unit repair costs), while other damage aggregation methods lead to upper-bound or intermediate unit repair costs.
A strategy is proposed that uses three steps to review the key drivers and aims to confirm that the results are not sensitive to the choice of damage aggregation method. Starting with a list of every component in the performance model, each of the three steps is used to exclude a set of components where the decision on how the aggregate damage and economies of scale are calculated has negligible impact on the total repair costs. Each step requires more information on the structure and the remaining components; hence, it is desirable to remove as many components as quickly as possible. If any component remains in the list after the three steps, the total repair costs will almost surely be affected by how the damage is aggregated in the calculation of the repair costs of those components.
Figure 4 provides an overview of the three steps and corresponding key drivers: First, the number of DSs and the number of floors with component are checked to see whether there is an opportunity to aggregate damage across DSs and floors. Components assigned to a single floor with a single possible DS are indifferent to the damage aggregation method. Second, the Consequence Functions are used to evaluate the peak impact for each remaining component—that is, the maximum possible reduction in repair cost due to economies of scale. Only components with substantial reductions will have a considerable impact on the total repair cost. Third, the damaged component quantities are used to check whether the four edge cases introduced earlier lead to different unit repair costs given the specific structural response. When the components experience either very little or very much damage on every floor, the impact of aggregation becomes less pronounced. These three steps and their key drivers are controlled by the following input parameters (black rectangles in Figure 4):
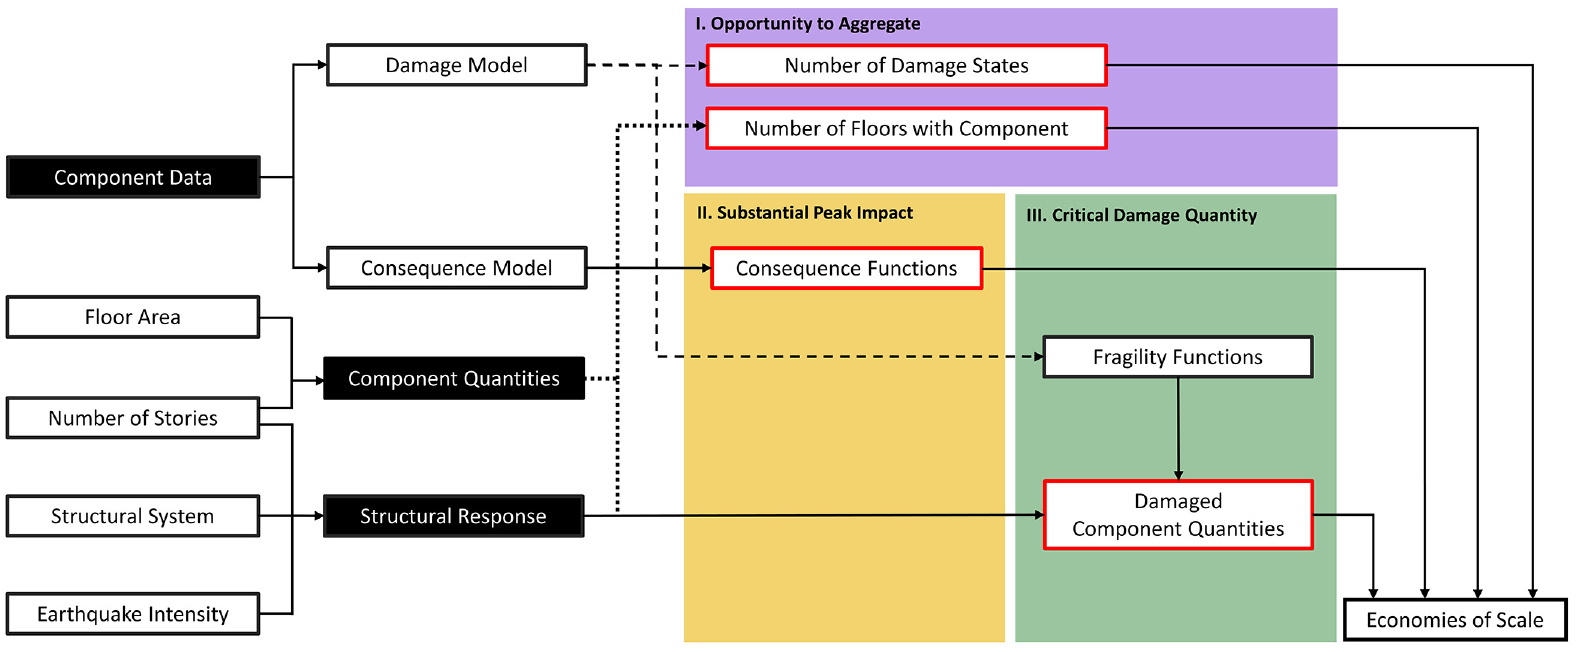
Overview of the three steps (purple, yellow, and green boxes) proposed to evaluate whether a FEMA P-58 performance assessment is sensitive to the choice of damage aggregation method. The key drivers in each step are in red rectangles and the input parameters that influence them are in black boxes. Other important inputs and intermediate data are in white boxes. Line styles differ to distinguish between arrows.
The following subsections provide more information on the three steps and highlight which components are typically filtered through each of them. If the list is not empty after the three steps, the remaining components should be examined more carefully. As long as only a few components remain in the list, the impact of damage aggregation on their repair costs can be estimated with a few simple calculations, as shown in the illustrative example in the following section.
Step 1—opportunity to aggregate
The first step starts by filtering out components that have a single DS and are constrained to only one floor in the building. There are 305 (out of 764) components in FEMA P-58 with only one DS. For components in this large group, such as chevron braces in steel frames and raised access floors, using a method that aggregates across all DSs will yield the same results as one that uses damage only from individual DSs. The other criterion focuses on the location of the component in the building. When a component type is located on a single story, such as heating, ventilation, and air conditioning (HVAC) equipment that is typically installed on roofs, there is no difference in component repair costs between approaches that aggregate across all floors and those that use damage only from individual floors.
Components that fulfill both above criteria can be safely excluded from further analysis. If we are only interested in the impact of aggregation across one entity (i.e. either DSs or floors), then it is sufficient to check only for the corresponding criterion. This will allow the filtering of a larger set of components in this step.
Step 2—substantial peak impact
This second step seeks to identify component types with a potentially large absolute repair cost difference due to changes in the calculation of economies of scale. The evaluation below uses only the consequence functions of the components to provide an upper bound of the potential impact of damage aggregation on repair costs. The peak impact is applicable to any structure and seismic scenario, but the actual impact in a particular scenario might be substantially less depending on the actual amount of damage experienced; this is addressed in step 3.
The impact (I) of damage aggregation on the repair cost of damaged component units in a specific DS on a specific floor is defined as the difference shown in Figure 5 between the repair cost based on the quantity of damaged units in the specific floor and DS and the lower-bound cost corresponding to maximum economies of scale. The latter requires sufficient additional damage in other locations and DSs to have the aggregate damage exceed QL, the upper limit of economies of scale in the consequence function. Using the notation from Figure 5, the impact can be calculated as follows:

where Q is the quantity of damaged units in the specific floor and DS; CQ is the unit repair cost considering economies of scale for quantity Q, and CL is the lower-bound unit repair cost that requires at least QL aggregate damage. The red rectangle represents the impact at a particular Q quantity of damage in Figure 5.
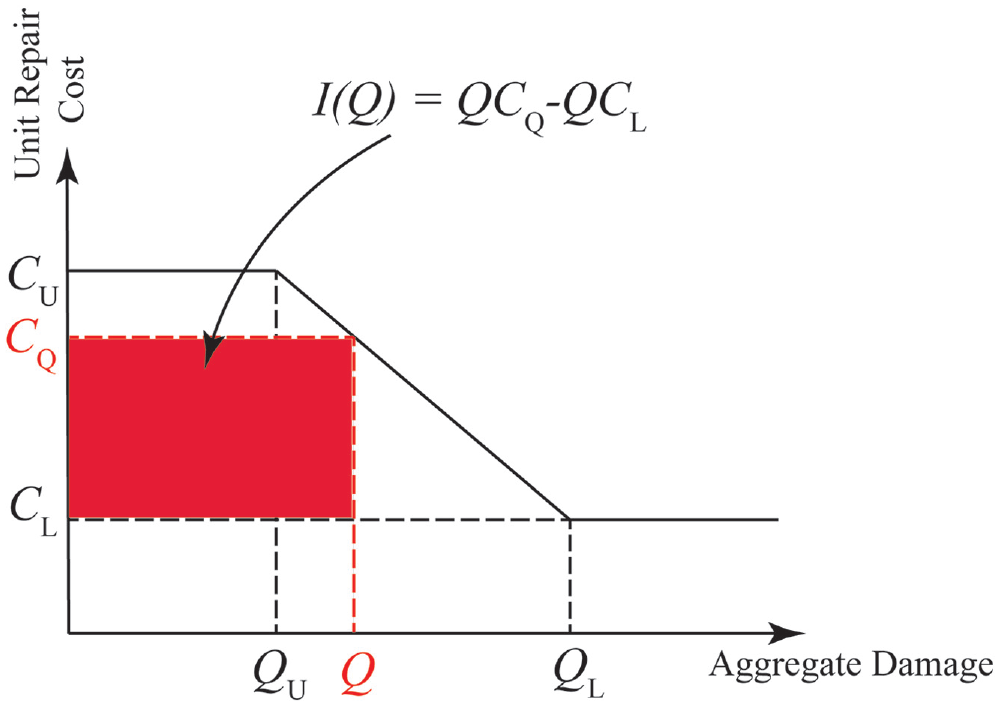
Impact of a component.
The graphical representation in Figure 5 clearly shows that the impact (I) is a function of the quantity of damage and that its maximum is in the domain of QU ≤ Q < QL. The unit repair cost CQ for the linear transition section can be expressed as a function of upper- and lower-bound quantity constants and corresponding unit repair costs, as shown in Equation 3.

The maximum potential impact is sought by taking the first derivative of Equation 3 with respect to Q and finding the critical quantity (Qcr) where the derivative is zero:

The area of the red rectangle in Figure 5 is maximized when Q = Qcr. The critical quantity is typically at half of the upper quantity limit (QL) because QL≥ 2 QU holds for most components. In practice, this implies that economies of scale will have the maximum impact on the repair costs of components with QL/2 damaged units per floor and DS when there is sufficient damage in other DS and floors in the building to reach the lower-bound unit repair costs. The maximum potential impact (Imax) can be calculated by substituting Qcr in Equation 3 as follows:

Figure 6 shows the computed Imax and Qcr for every DS of all components with complete consequence model data in the FEMA P-58 library (737 out of 764 components). Each horizontal row in the figure shows groups of similar components based on the first three labels in their ID numbers. For each component group (CG), the position of each marker represents the computed Imax per floor for one of the DSs of a component type. DSs are identified by the size of the marker. The largest Imax in each DS in each CG is highlighted with colored markers. Markers with Imax below US$1000 are considered negligible and are not shown. The right side of the figure shows rounded Qcr values for each CG. A range of Qcr is specified when a group has different values among its components and DSs.
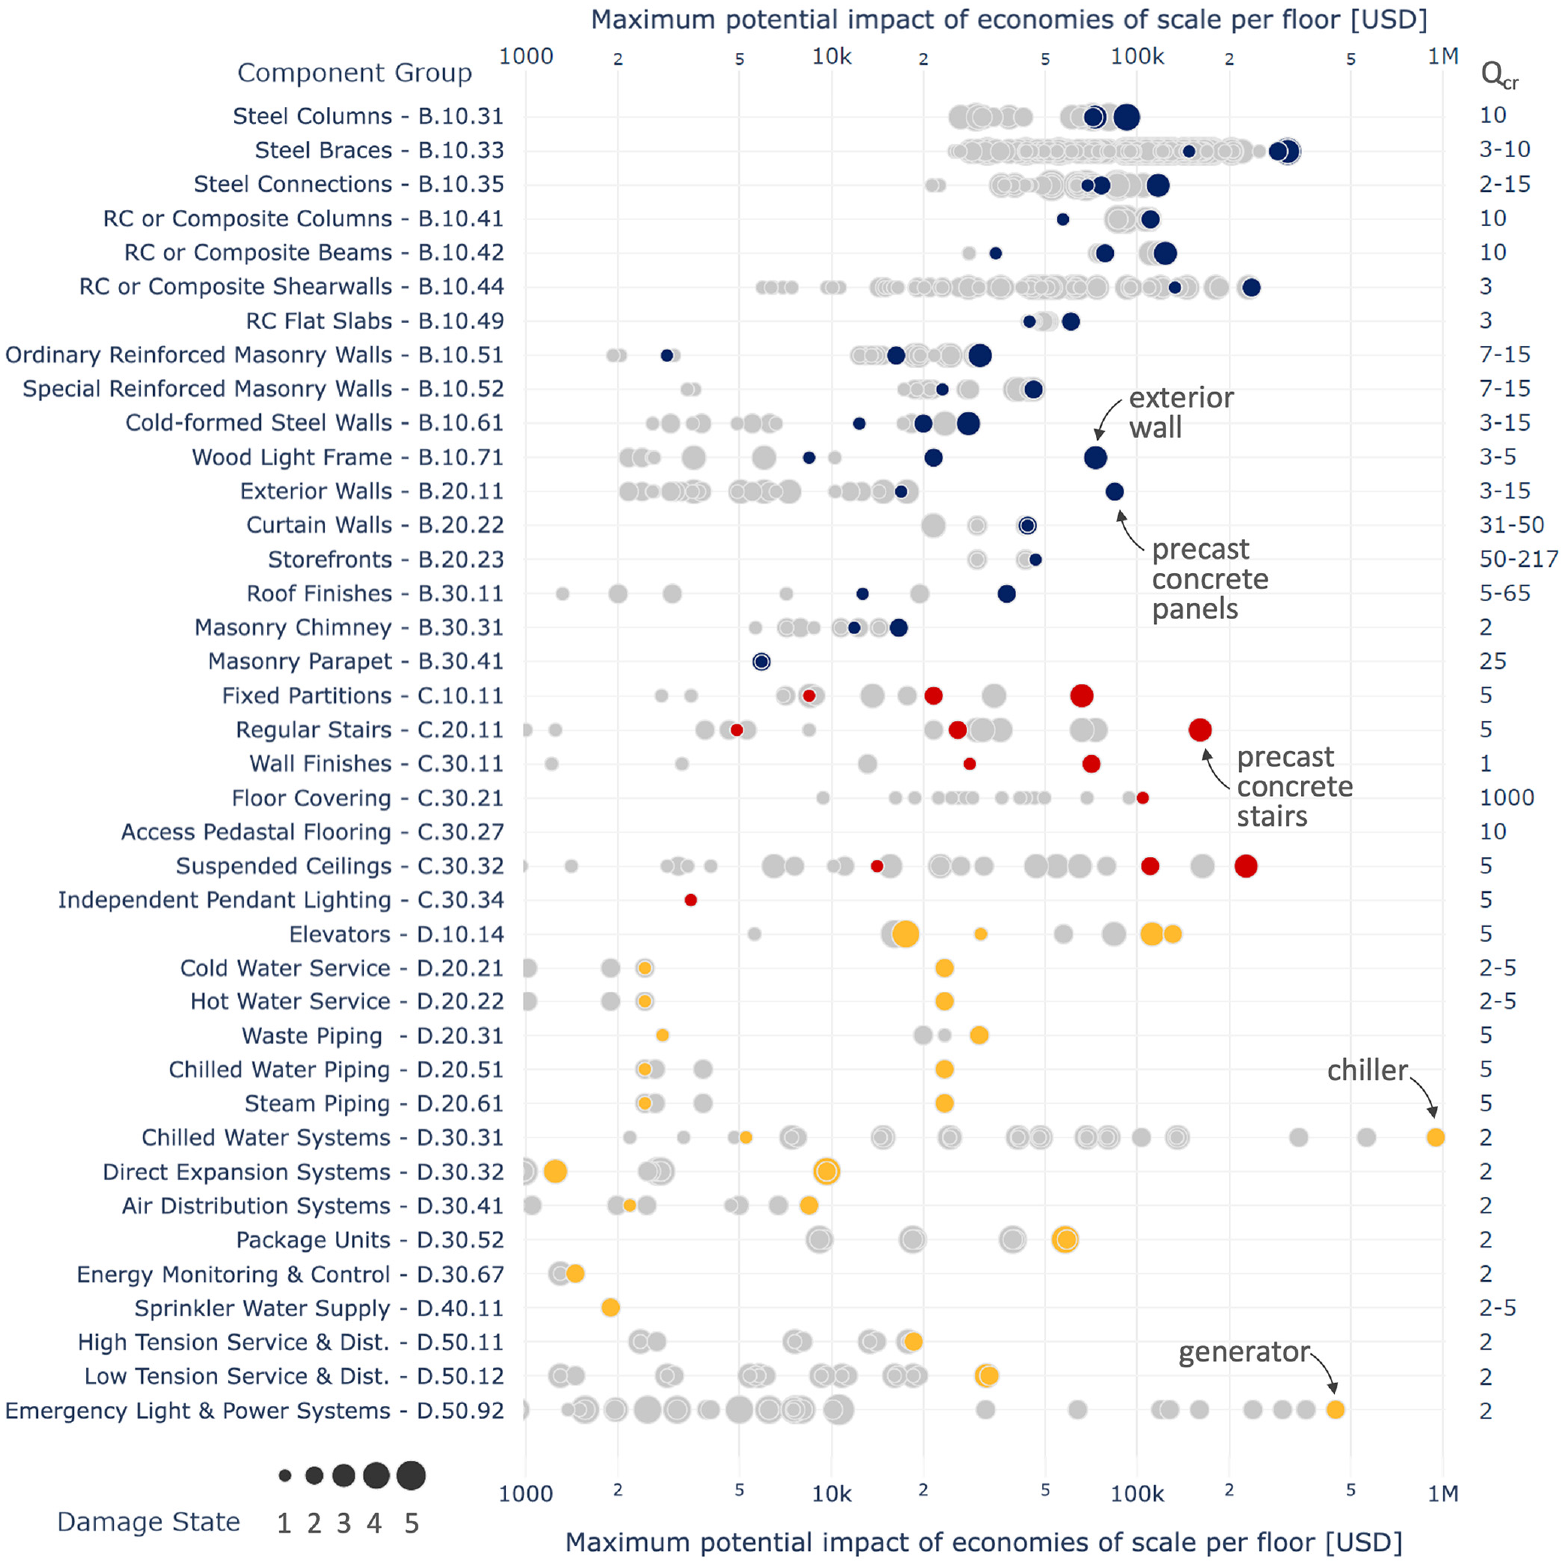
Maximum potential impact of economies of scale per floor based on the FEMA P-58 repair cost model for components in various DSs. Marker sizes correspond to DSs; the highest impact in each row for each DS is highlighted with color. Critical quantities (in FEMA P-58 units) are shown on the right (the presented data are provided in tabular format for each component and DS as supplemental material). DS: damage state.
Figure 6 demonstrates that Imax of some components, such as steel braces, chillers, generators, suspended ceilings, and exterior walls, reaches hundreds of thousands of dollars per floor. Others, such as independent pendant lighting and sprinkler water supply, have low Imax. For these latter groups of components, damage aggregation and the resulting economies of scale will have negligible impact on repair costs. This second step of the proposed procedure aims to filter CGs that will not exceed a predefined minimum Imax threshold. For example, one could argue that the performance assessment of a building with a replacement cost of US$4M per floor will not be considerably affected by a difference in repair cost per floor that is guaranteed to be less than US$40,000. Using the data in Figure 6 and the US$40K limit lead to the recognition that piping components (D.20.21–D.20.61) and air distribution systems (D.30.41) can be neglected when evaluating the impact of damage aggregation. The chosen Imax threshold is a function of the desired absolute accuracy and should be determined on a case-by-case basis considering the total loss ratio (i.e. total repair cost over replacement cost) because an assessment with a smaller total loss ratio is more sensitive to the same absolute difference in the repair cost calculation. For CGs with Imax greater than the defined threshold, the following third step can be used to determine how much of the potential maximum impact is realized given the actual structural response and corresponding damage quantities. The results of this calculation for every FEMA P-58 component are provided as supplemental material in a tabulated data file. The peak impact threshold can be defined based on the acceptable absolute error in repair costs per floor.
Step 3—critical damage quantity
This third, and final, step compares Qcr to the damaged component quantities (Qd) given the demands (EDPs) each component experiences in a particular seismic performance assessment scenario. The impact of damage aggregation is negligible if Qd is either close to zero or greater than QL = 2Qcr, the lower-bound quantity limit introduced in Figure 5 (Qcr for each CG is shown in Figure 6). Similarly, for components with a total quantity across all floors below QU (the upper-bound quantity limit), there cannot be a sufficiently large number of damaged units to trigger economies of scale regardless of which damage aggregation method is used. Hence, they can be removed from the list of impactful components. For example, QU = 5 units for elevators allows the filtering of these components in small- and mid-size buildings that have only a few elevator units.
For every other remaining component, the decision-making is specific to the structural design and seismic event under investigation and requires significantly more information than previous steps. Component quantities, structural response, and fragility functions are needed to determine Qd in each seismic scenario for a particular structural design (Figure 4).
Figure 7 uses an example to illustrate how these inputs affect Qd and how the calculated damage quantity is used to evaluate components in this third step. Figure 7(a) and (a′) show histograms of story drift distributions for one floor of a multistory building at two seismic intensity levels: design earthquake (DE) and maximum considered earthquake (MCE). The corresponding median interstory drift ratios are 1.4% and 2.1%, respectively. The first DS of the glass curtain wall component B2022.002 from FEMA P-58 is used to provide the damage and consequence models for this example. The fragility function in Figure 7(a) and (a′) defines the probability of glass falling from the frame of the curtain wall as a function of interstory drift. The probability of such damage is 0.10 and 0.38 at the median interstory drifts for the DE and MCE intensities, respectively. Considering a floor plan area of 3300 m2 and the normative quantities published with FEMA P-58, a total of 357 curtain wall panels are estimated to be installed along the perimeter of each floor. This yields 36 and 136 damaged panels (Qd) at the DE and MCE levels, respectively. Figure 7(b) and (b′) shows how these damage quantities compare to the critical quantity (Qcr) that is 50 panels for this component.
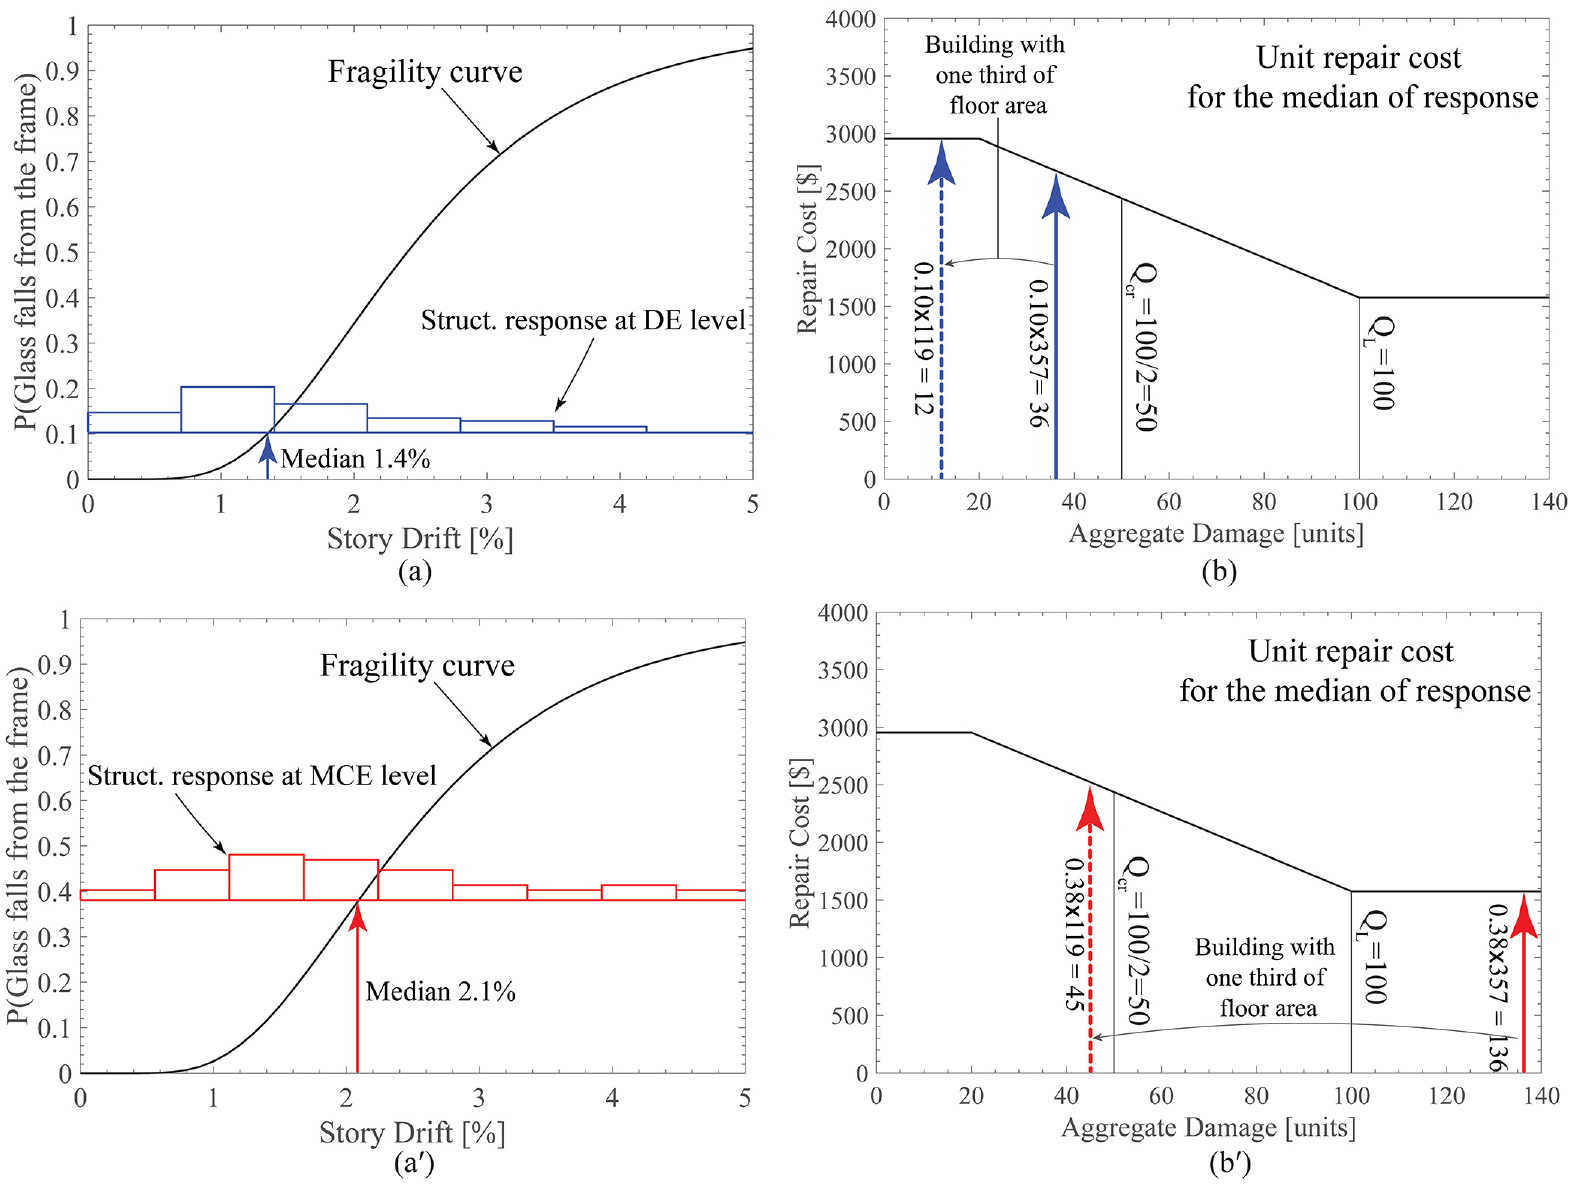
Influence of structural response and component quantity at design earthquake and maximum considered earthquake level on unit repair cost estimation in the damage calculation (a) (a′) and repair consequence calculation (b) (b′) steps.
In this example, the number of damaged curtain wall panels at the MCE intensity is sufficiently large to achieve maximum economies of scale. Consequently, their repair cost will not be affected by how damage from other floors or DSs is aggregated in the calculation. On the contrary, the number of damaged panels at the DE intensity is close to Qcr, and the choice of damage aggregation has a considerable impact on the repair cost of these components and the total repair cost of the building. Specifically, the repair cost of the 36 panels is reduced by US$39,700 if the maximum economies of scale are triggered through damage aggregation. Note that this is slightly below the potential maximum Imax = US$43,000 for this component. Since repair costs at the DE intensity are typically only a small fraction of the replacement cost, US$39.7K can be a substantial difference and it suggests that the choice of damage aggregation method would deserve serious consideration for this assessment. Figure 7 also illustrates the importance of the floor area by showing results for a case with a smaller 1100 m2 floor plan. The smaller area leads to a substantial reduction in the number of installed wall panels (through normative quantity assignment) and, consequently, the number of damaged panels. In this smaller building, the number of damaged curtain wall panels at the DE intensity is significantly below Qcr. The maximum cost saving on these repairs due to economies of scale is considerably reduced (12 × US$1500 = US$18,000), and oftentimes, there will not be sufficient damage in other floors and DSs to reach the 100-panel QL threshold that triggers maximum economies of scale, regardless of which damage aggregation method is used. As for the MCE intensity, the number of damaged panels is close to Qcr. The impact of damage aggregation in this scenario can be close to the potential maximum of US$45K, which typically warrants further investigation.
When evaluating design variations for a building, different structural designs can lead to different structural responses, and changes in the nonstructural configuration of the building can change the total component quantities. These changes, as the above example illustrates, alter the quantity of damaged components and, therefore, can also affect the impact of the selected damage aggregation method. Thus, the relative performance of design variations can be influenced by how economies of scale are considered, thereby influencing design decisions that depend on performance comparisons.
Illustrative example: repair cost estimation of a 9-story building
This section illustrates how the strategy presented earlier is used to evaluate the impact of damage aggregation on the performance assessment of a case study building. A 9-story office building with a story height of 15 ft was designed with concentrically braced frames (CBFs) for a high-seismicity location with stiff soil and mapped short-period and 1-s spectral accelerations of Ss = 1.5 g and S1 = 0.5 g (ASCE/SEI 7-16, 2016), respectively. The building contains two structural and 18 nonstructural components. Nonstructural component quantities were assigned to each floor using the FEMA P-58 normative quantity estimation tool (FEMA P-58-3, 2018). Two performance models were created: a larger building with a footprint area of 21,600 ft2 and a smaller one with a 10,700 ft2 footprint. Table 2 summarizes the component quantities assigned to each floor and the roof of these buildings. Replacement costs were estimated using US$210 per ft2 based on RSMeans data from 2020 (RSMeans, 2020). As the reference time of costs in FEMA P-58 consequence functions is 2011, the replacement cost estimates were scaled to a 2011-equivalent value by a factor of 0.8 based on the Historical Cost Index for the construction industry (RSMeans, 2020).
Performance model summary for the 9-story buildings in the illustrative example
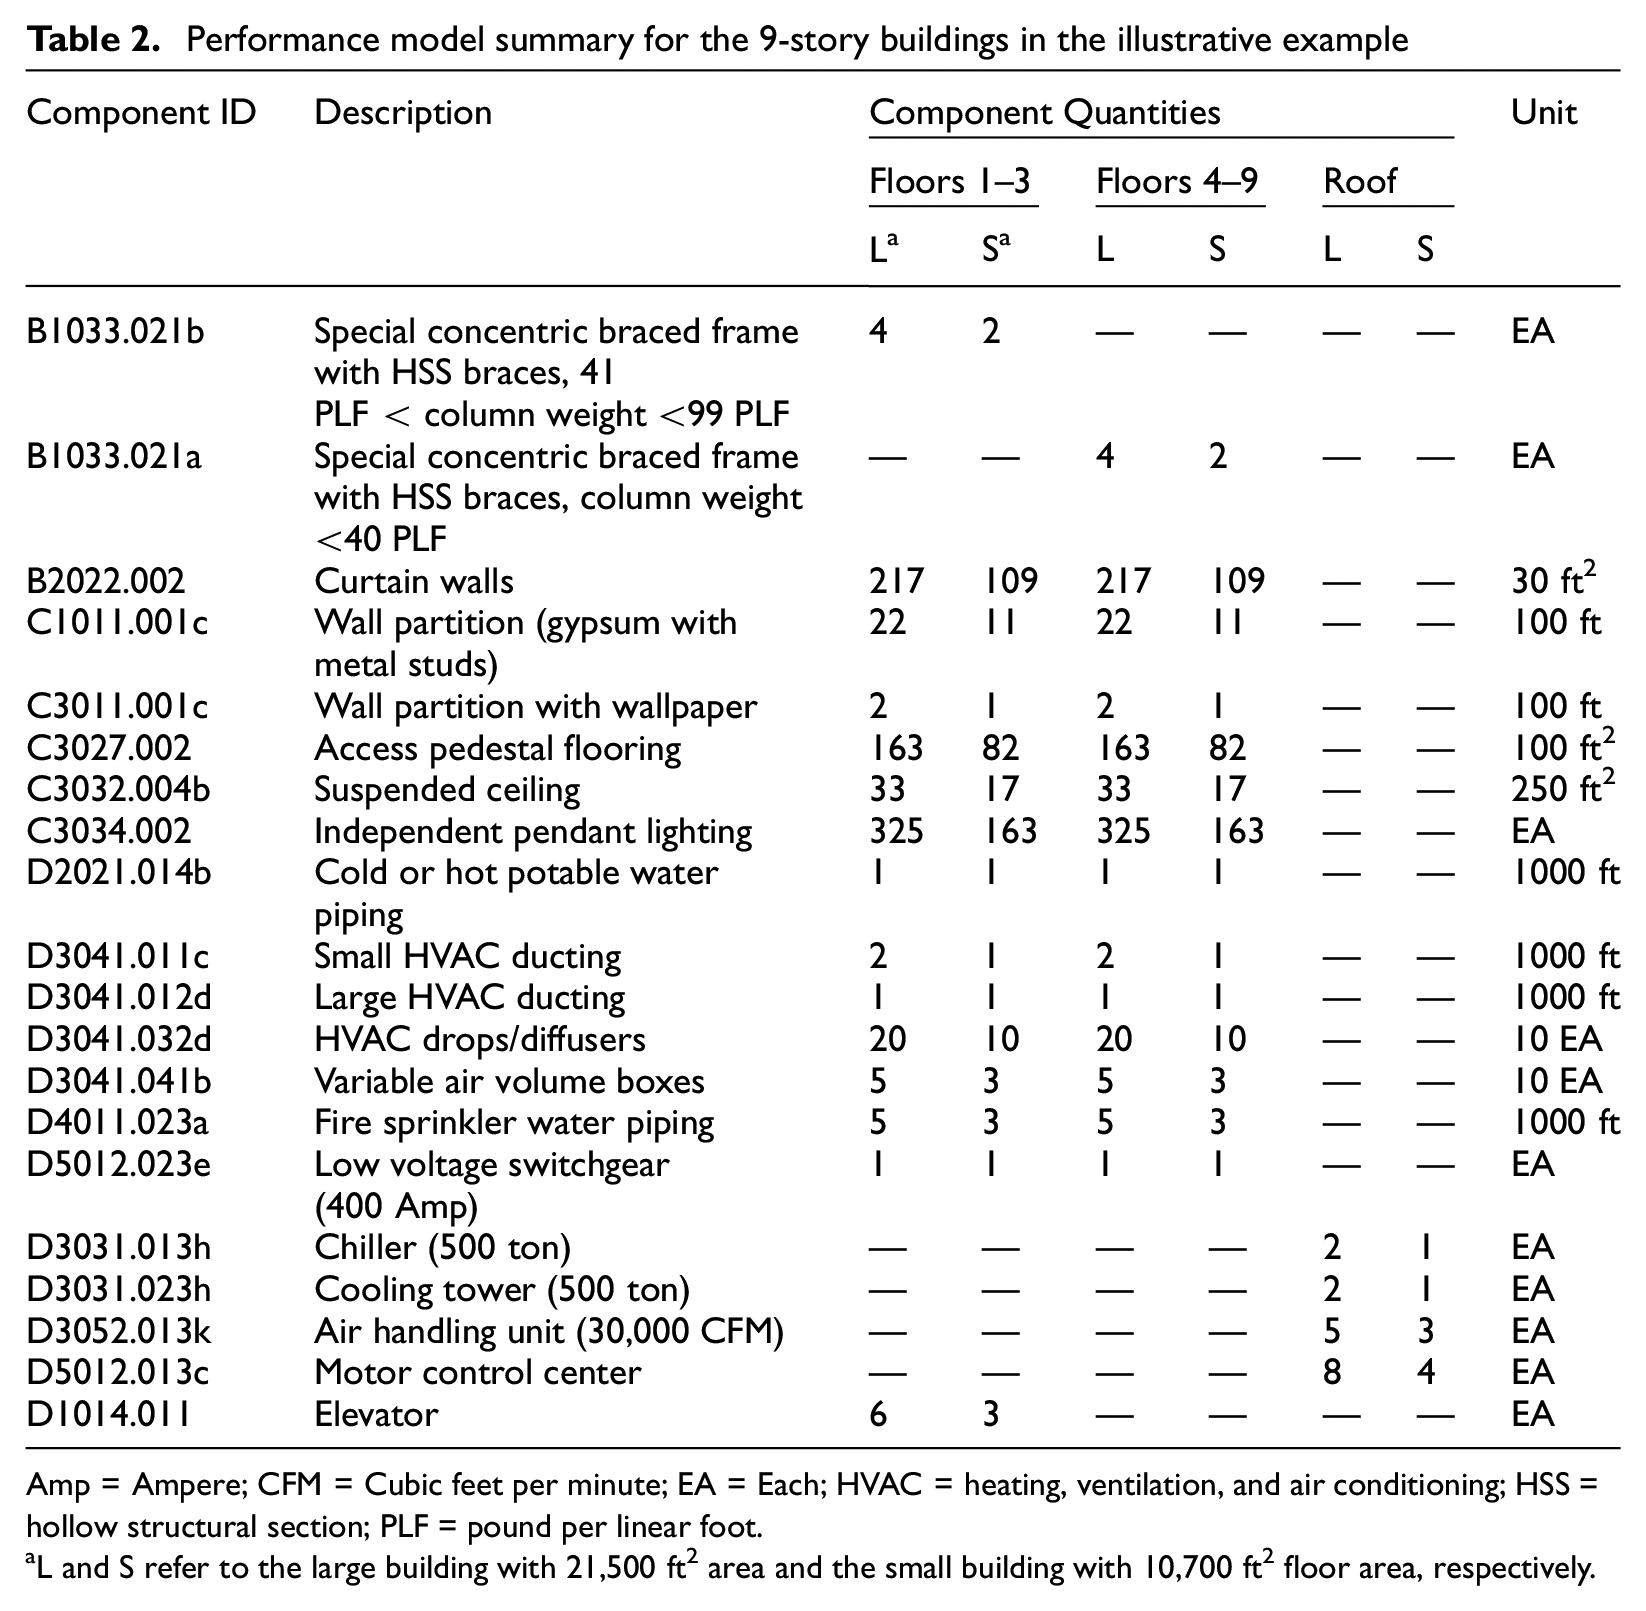
Amp = Ampere; CFM = Cubic feet per minute; EA = Each; HVAC = heating, ventilation, and air conditioning; HSS = hollow structural section; PLF = pound per linear foot.
L and S refer to the large building with 21,500 ft2 area and the small building with 10,700 ft2 floor area, respectively.
The large and small versions of the building were designed to the same structural specifications and assumed to exhibit similar floor responses and global collapse probability. These assumptions ensure that the differences observed in the results are due only to the differences in the damage and loss assessment methodology. Nonlinear time-history analyses were conducted using the set of far-field ground motion records recommended by FEMA P695 (2009). The median drift and acceleration demands are shown in Figure 8 for all floors at three seismic intensity levels: 50% DE, DE, and MCE according to ASCE 7–16 (ASCE/SEI 7-16, 2016).
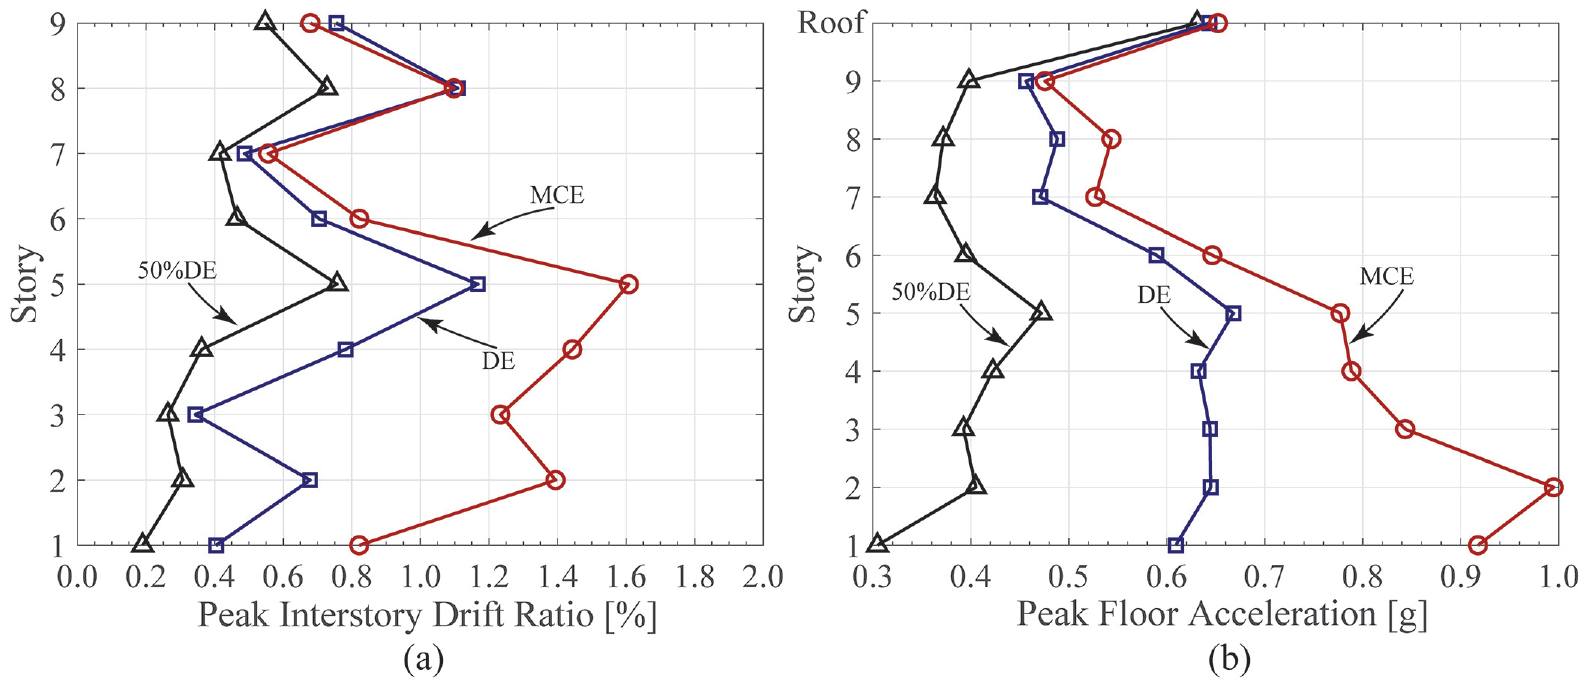
Median (a) peak interstory drift ratio and (b) peak floor acceleration demands for all floors of the 9-story building.
Each building is analyzed in one direction, using the four edge cases for damage aggregation introduced earlier to capture the range of possible total repair cost outcomes. Figure 9 shows the CDF of total repair cost for the two buildings and three intensity levels. Results are in line with expectations: Case 1 (i.e. “All DSs, all floors”) yields the lowest total repair cost for all buildings and intensity levels, whereas Case 4 (i.e. “Individual DS, individual floor”) yields the highest.
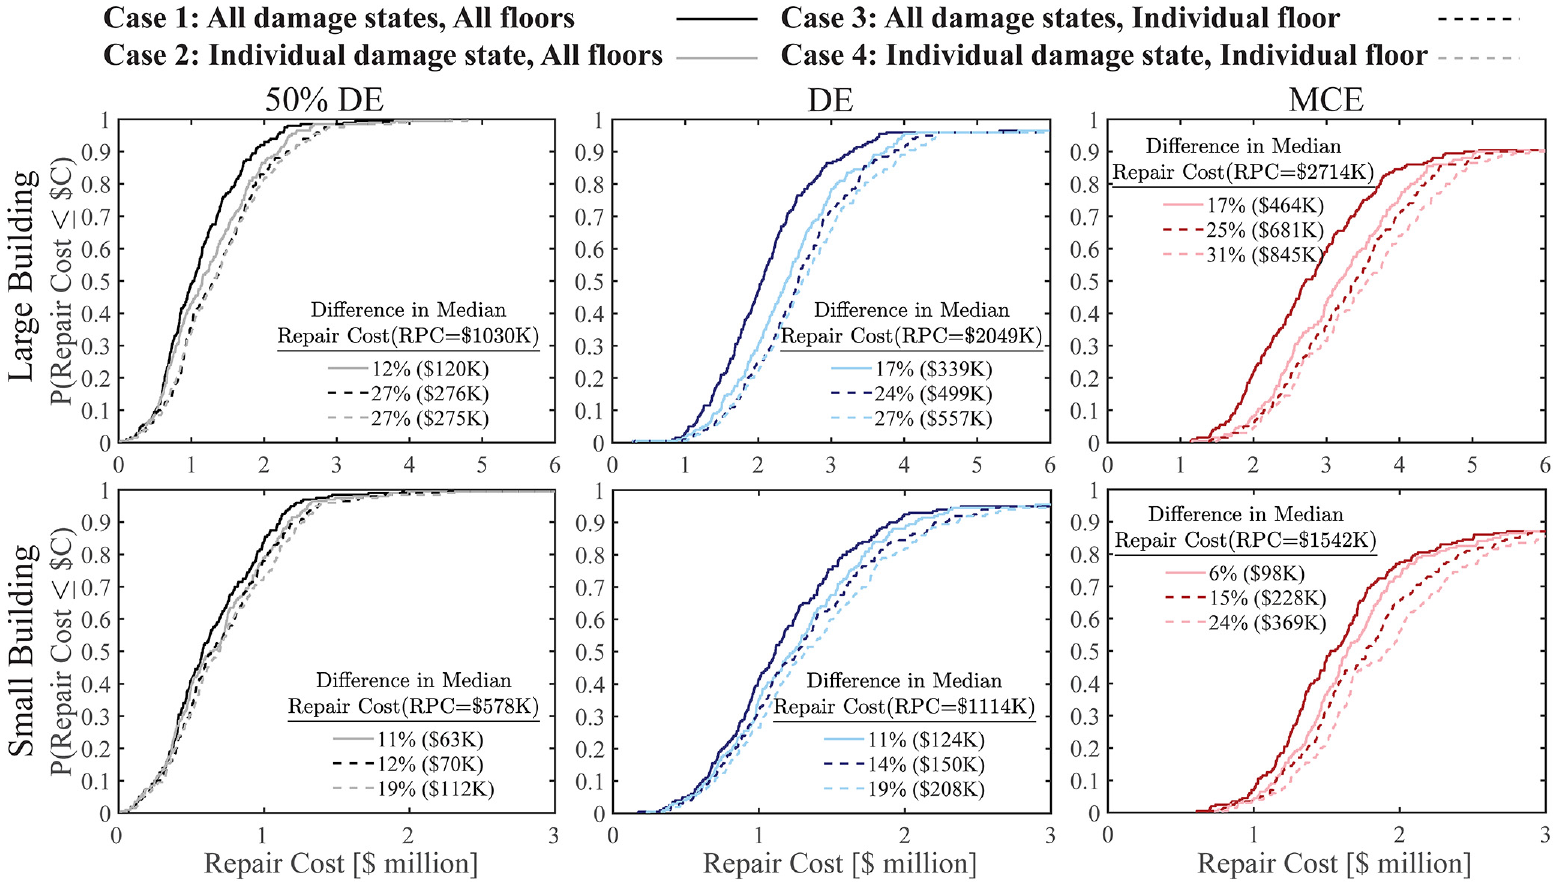
Comparison of total repair costs using four edge cases for two building footprints and different intensity levels. The range of displayed repair costs is limited to focus on outcomes of repairable realizations. At the design earthquake and maximum considered earthquake levels, a proportion of realizations correspond to irreparable damage or collapse, leading to a step in the fragility curves beyond the limits of the figure.
Comparing the median repair costs from different edge cases for the large and small building illustrates that the differences grow in absolute value with increasing intensity levels. For example, Cases 1 and 2 (i.e. solid lines in Figure 9, considering damages from all floors, but either all or only from one DS) for the large building yield median repair costs that are US$120,000, US$339,000, and US$464,000 apart at the 50% DE, DE, and MCE intensities, respectively. This corresponds to a relative difference of about 12%–17%. The relative differences are in the range of 5%–30% across all cases, and they are generally larger for the building with the larger floor area.
Application of the proposed evaluation strategy
For this example, the following paragraphs illustrate how the strategy proposed previously can help recognize whether there is a substantial impact of damage aggregation, identify which components are responsible for the majority of differences in repair costs, and estimate the magnitude of the total differences shown in Figure 9 without running analysis for the four edge cases. The following description focuses on the large building and the DE intensity for the sake of brevity.
Starting with a comprehensive list of all components from Table 2, the first step checks if there is an opportunity to aggregate damage for each component across floors or DSs. This leads to the removal of the chiller, cooling tower, and motor control center components because they have one DS and are placed only on the roof.
In the second step, the peak impact of each component is compared with a US$10,000 threshold. This limit is chosen by targeting 0.5% of the approximately US$2 million total repair cost at the DE level. Considering that there are 9 stories in the building and most of the damage will be concentrated to a few of those, a 0.5% maximum difference per story per component DS is not expected to add up to more than a few percent difference in total repair costs. Based on Figure 6, the access pedestal flooring, independent pendant lighting, air distribution systems, and sprinkler water supply CGs have lower Imax than the threshold and can be removed from the checklist.
At this point, it is worth obtaining Imax for each specific remaining component, rather than looking only at the peak Imax of their CGs. This information is readily available in the table provided as supplemental information to this article, or it can be calculated from consequence function data using Equation 2. Components with Imax < US$10,000 in all DSs can be identified and removed from the checklist. In this example, wall partitions with wallpaper and cold or hot potable water piping fall into this category. These components were not removed earlier because they are part of CGs with at least one other component that has a larger Imax as shown in Figure 6.
In the last step of the proposed strategy, the quantity of damaged components (Qd) is compared with the critical damage quantity (Qcr). Assuming that the median Qd for each component on each floor in each DS is not directly available, Figure 10 shows the results of a proposed simplified calculation. Four demand levels (indicated by markers of different colors and symbols) were identified within the range of story drift and acceleration demands in the building at the DE and MCE intensities (Figure 8). The quantity of components is identical on all floors in the performance model of this example, as is often the case when normative quantities are assigned. Given the component quantity and the controlling demand value, Qd for each DS can be calculated using the CS fragility functions (Figure 7). Figure 10 shows how the results of this calculation illustrate the changes in the amount and severity of damage with increasing demands and highlight the components that experience damages close to Qcr in the investigated seismic scenarios.
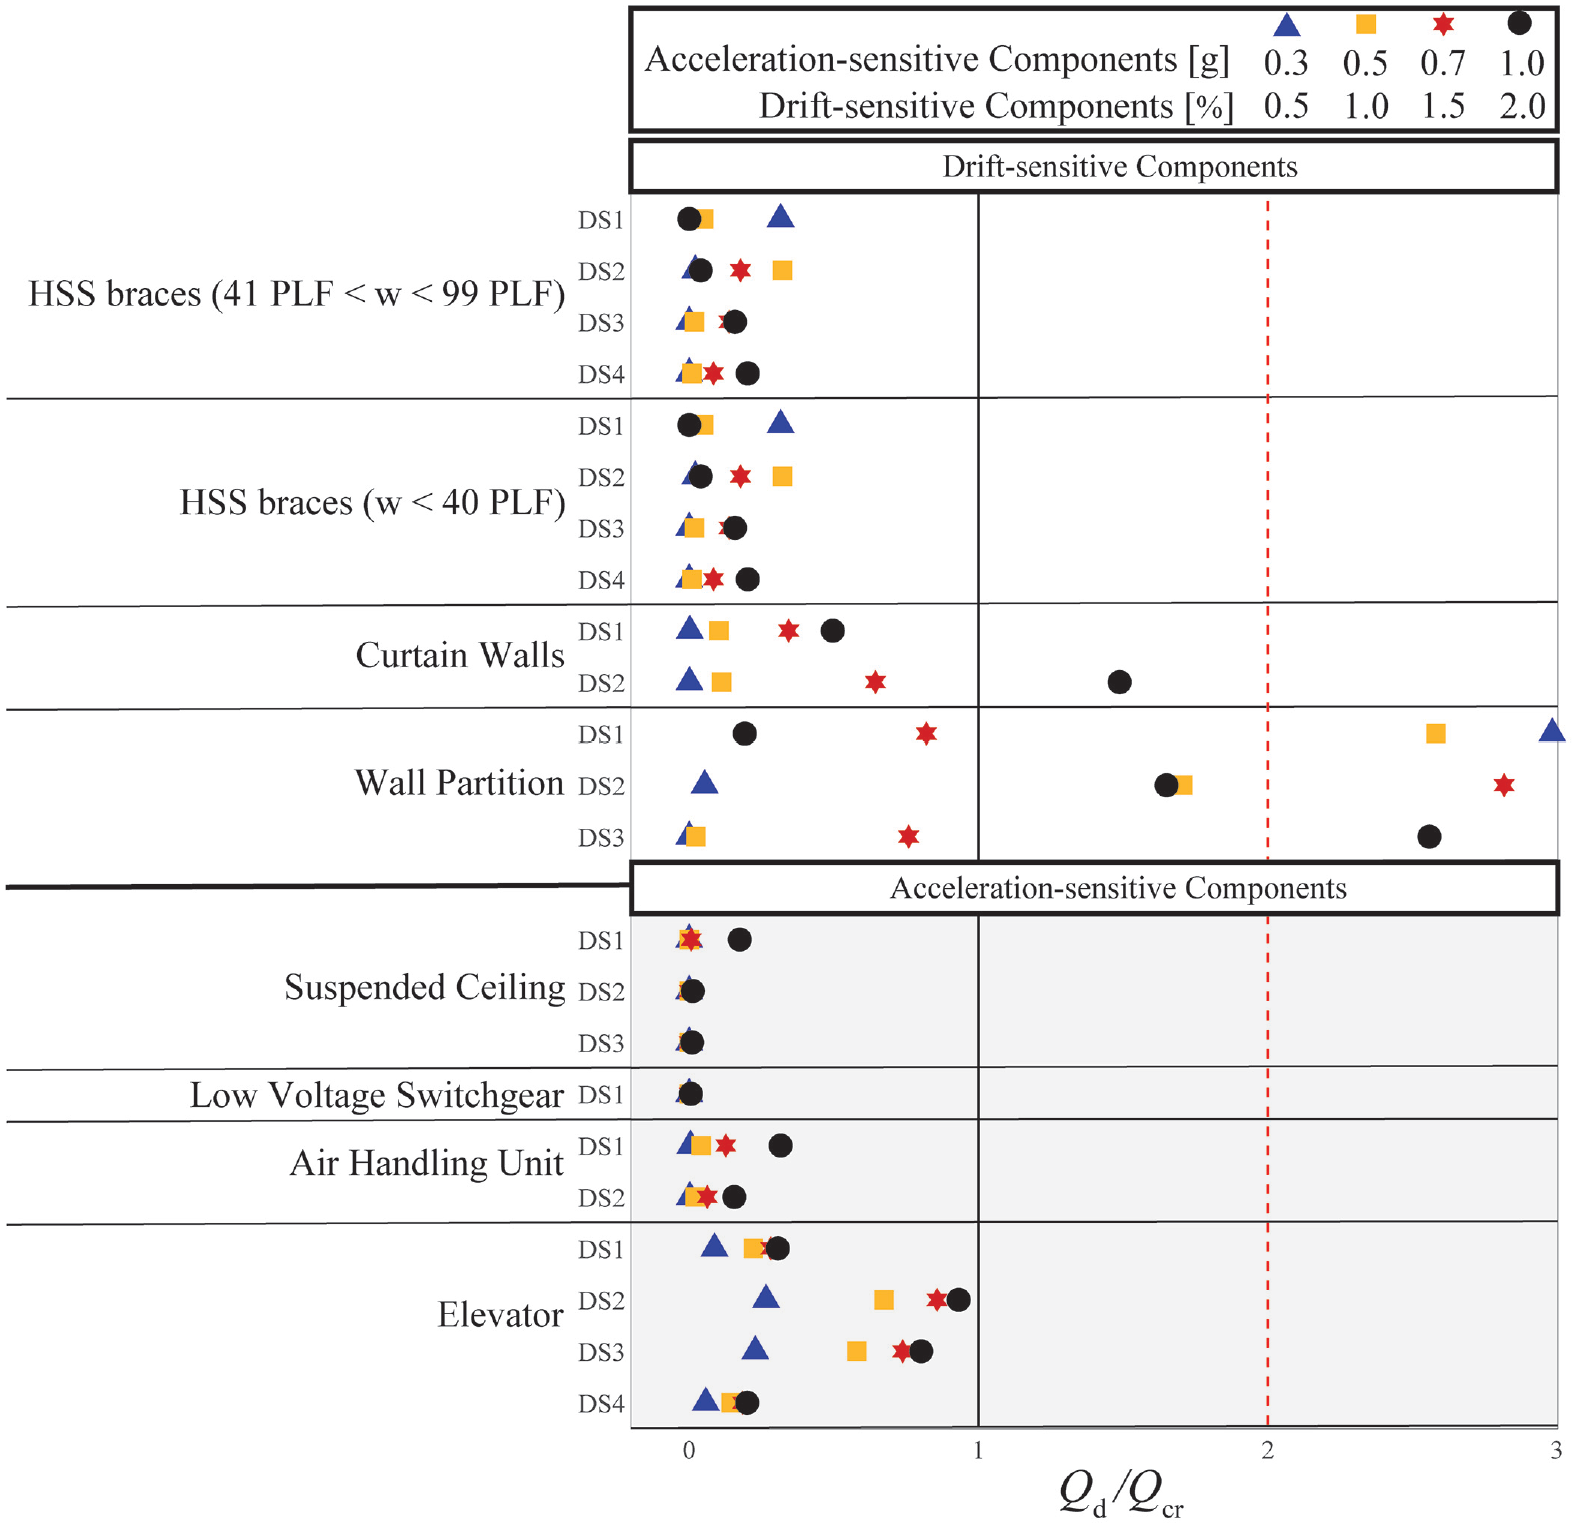
Quantity of damaged components at four demand levels compared with the critical damage quantity across the components remaining in the checklist for step 3.
Components with a Qd/Qcr≅ 0 at all four demand levels have high capacity and experience barely any damage. This consideration allows the removal of suspended ceiling and low-voltage switchgear from the checklist. Components with a Qd/Qcr > 2 at all four demand levels have very low capacity and experience so much damage that it triggers maximum cost savings already on a single floor and DS and does not benefit from additional damage aggregation. This can occur when a single, high-seismicity scenario is investigated, but it is rare to observe such high damage when lower-intensity scenarios, such as the DE level, are included in the performance assessment. Hence, none of the components in this example can be removed for consistently experiencing excessive damage.
Out of the remaining six components, elevators and air handling units can be removed by considering a few additional details about them. Although the potential maximum impact of elevators is substantial (Imax = US$130,000 in DS2), even if all elevators are damaged, only a small fraction of Imax will be realized in this example. There are only six elevators in the building, and the cost savings for elevators start at five damaged units with 10 units required to maximize savings. Air handling units are installed on the roof where the median acceleration demand does not exceed 0.7 g in the highest intensity scenario. At that demand level, even less than one unit is expected to be in DS1 or DS2 (see red star markers in Figure 10 given Qcr = 2.5). DS1 has negligible impact, and the single unit in DS2 will experience at most US$18,600 cost savings from damage aggregation across DSs. This is considered negligible compared with the US$2 million total reference point cost (RPC).
The four remaining components (two types of HSS braces, curtain walls, and wall partitions) are expected to have substantially different repair costs depending on the chosen damage aggregation method, and these components are expected to be the primary contributors to the differences observed in Figure 9. This is confirmed in Figure 11, which shows the total repair cost from all but the remaining four components in the large building under the DE and MCE intensities. The maximum difference between the median costs from the four edge cases is less than US$57,000 and US$28,000, which are 2.8% and 1% of the median total repair costs including all components at the DE and MCE levels, respectively. The elevator component is the main contributor to this difference.
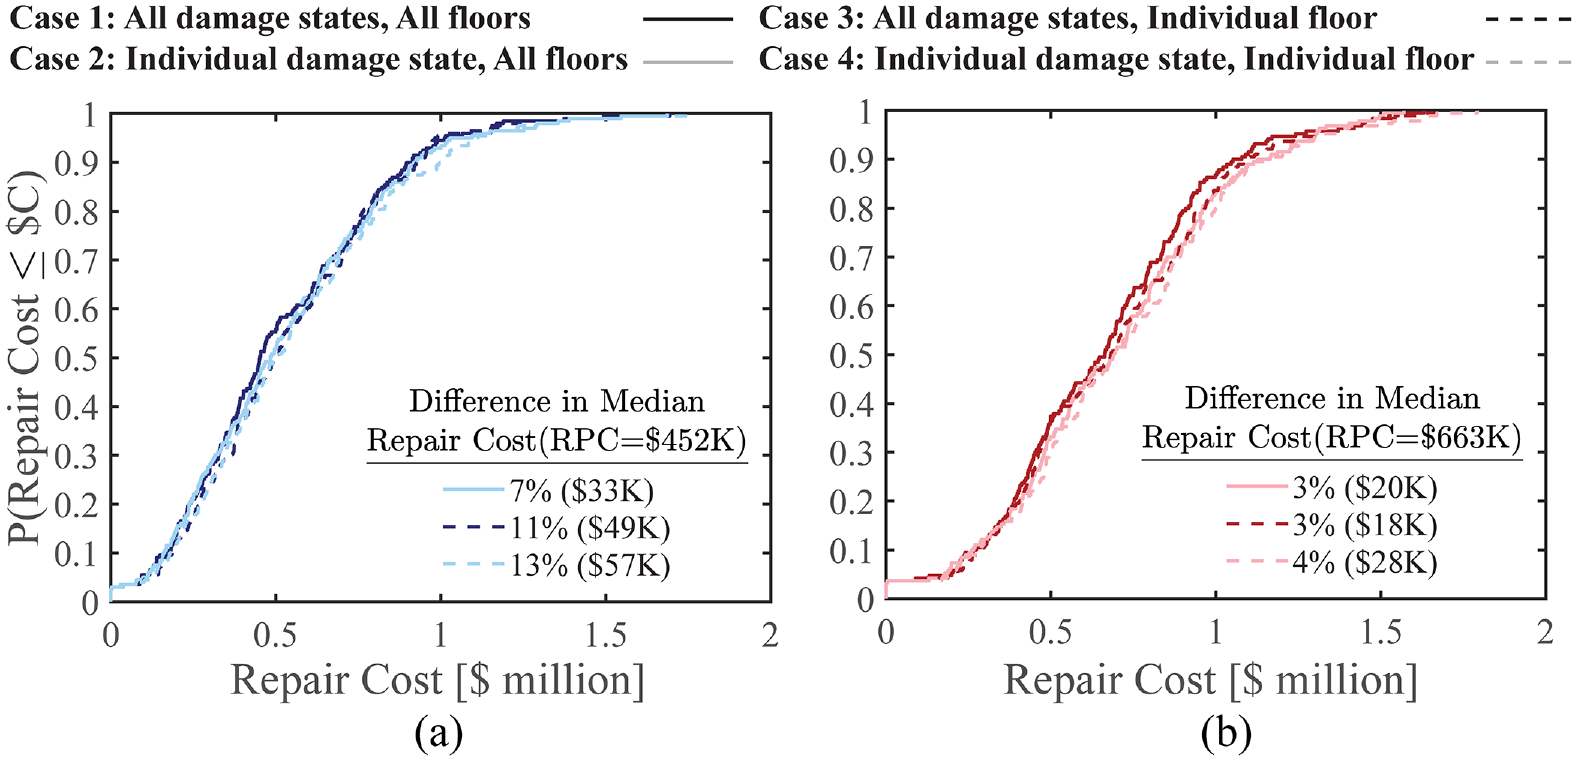
Total repair costs of all components that the proposed evaluation identified as having only minimal contribution to the repair cost differences at the: (a) design earthquake (DE) and (b) maximum considered earthquake (MCE) levels.
Estimation of the impact of damage aggregation
The impact of various damage aggregation methods on the total repair cost is the sum of the additional cost savings achieved through damage aggregation across floors and DSs for the components that remain after the filtering process described above. These additional cost savings can be estimated through a simple calculation that is summarized in Tables 3 to 6 for the remaining four components in this 9-story example building. Additional cost savings for each component are made up from repair costs saved on each floor, which are the product of costs saved per unit and the number of damaged units per floor.
Estimation of the impact of damage aggregation on repair cost savings for small HSS brace components (B1033.021a) in large building at MCE level
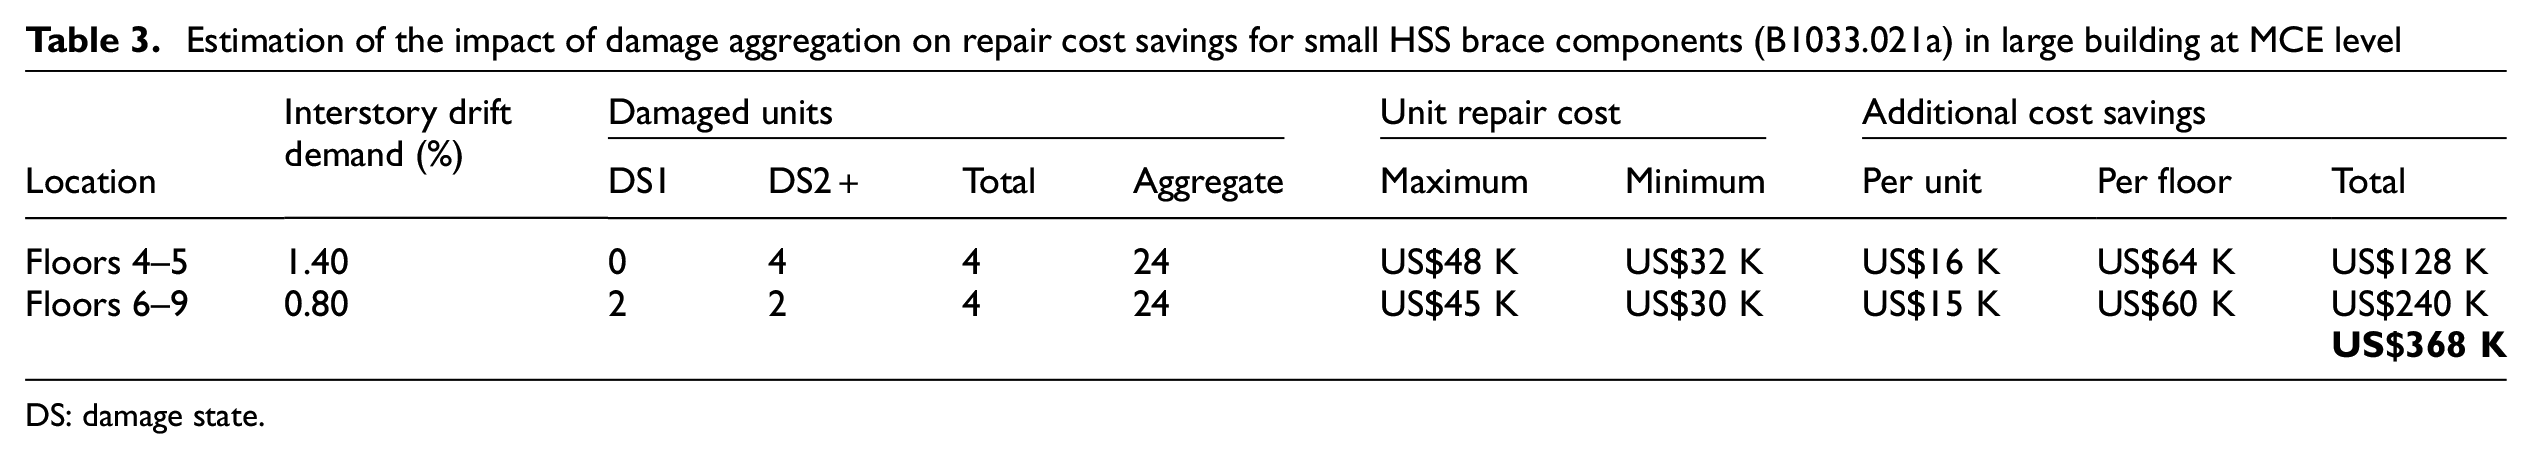
DS: damage state.
Estimation of the impact of damage aggregation on repair cost savings for large HSS brace components (B1033.021b) in large building at MCE level
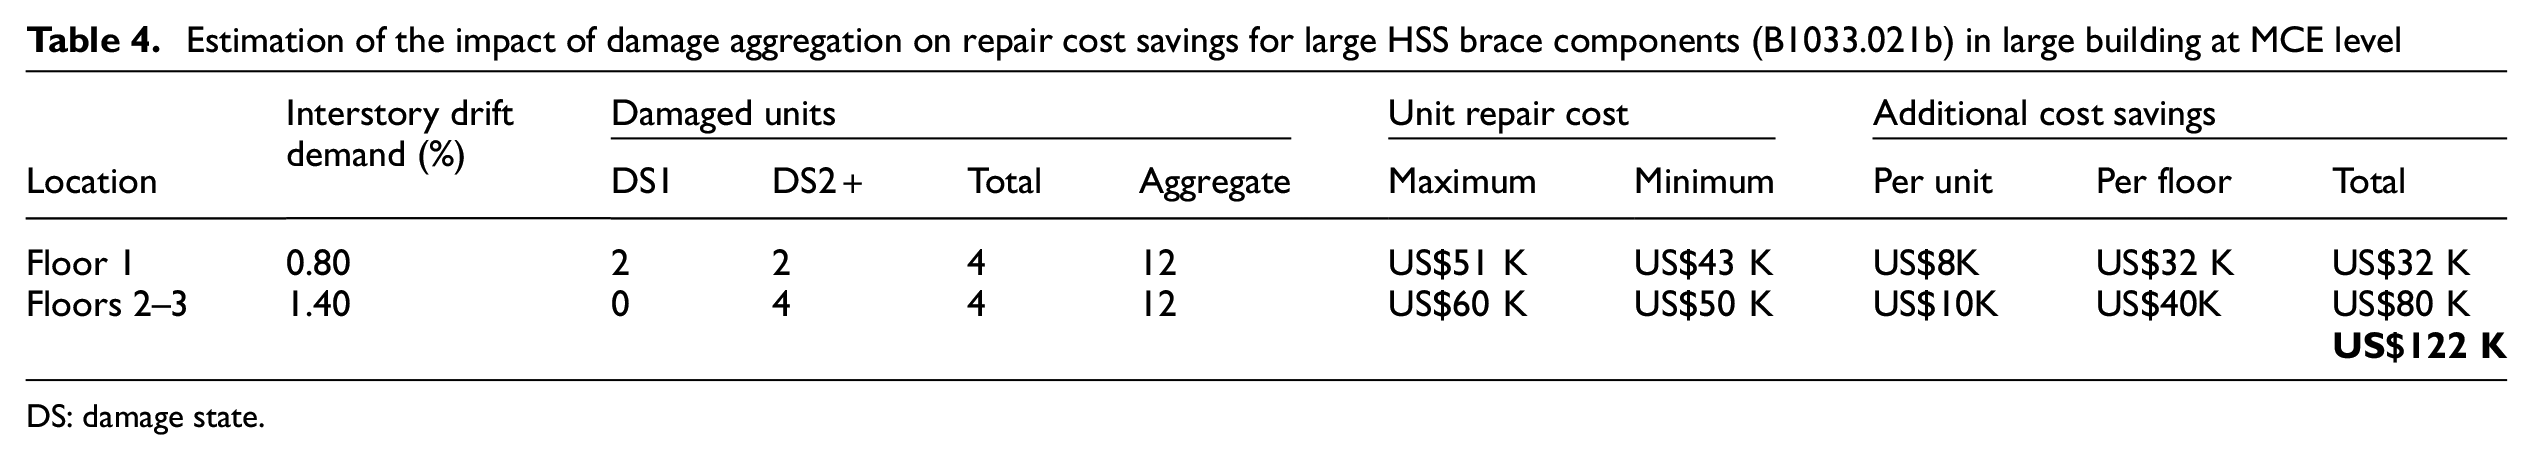
DS: damage state.
Estimation of the impact of damage aggregation on repair cost savings for curtain wall components (B2022.002) in large building at MCE level
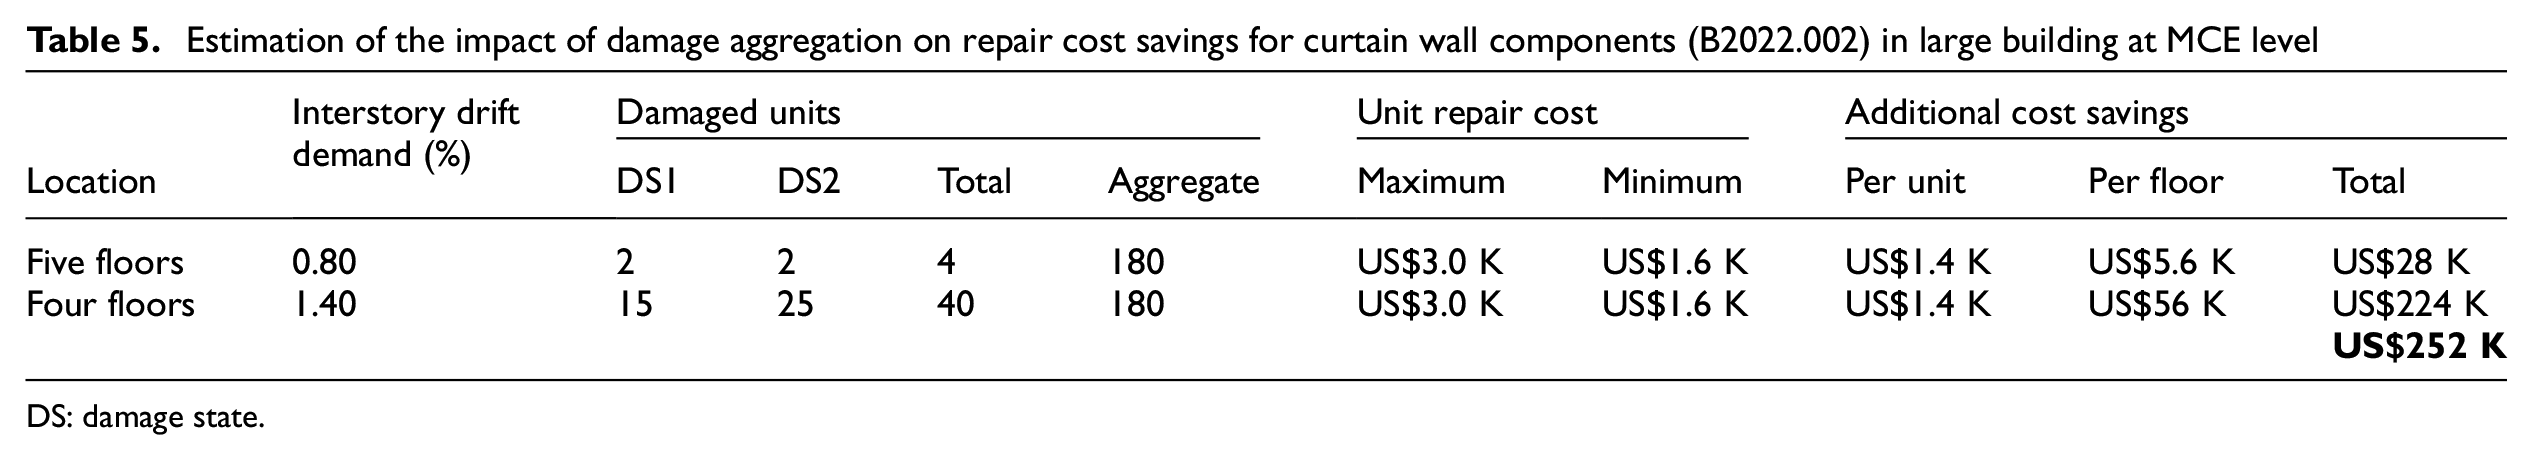
DS: damage state.
Estimation of the impact of damage aggregation on repair cost savings for wall partition components (C1011.001c) in large building at MCE level
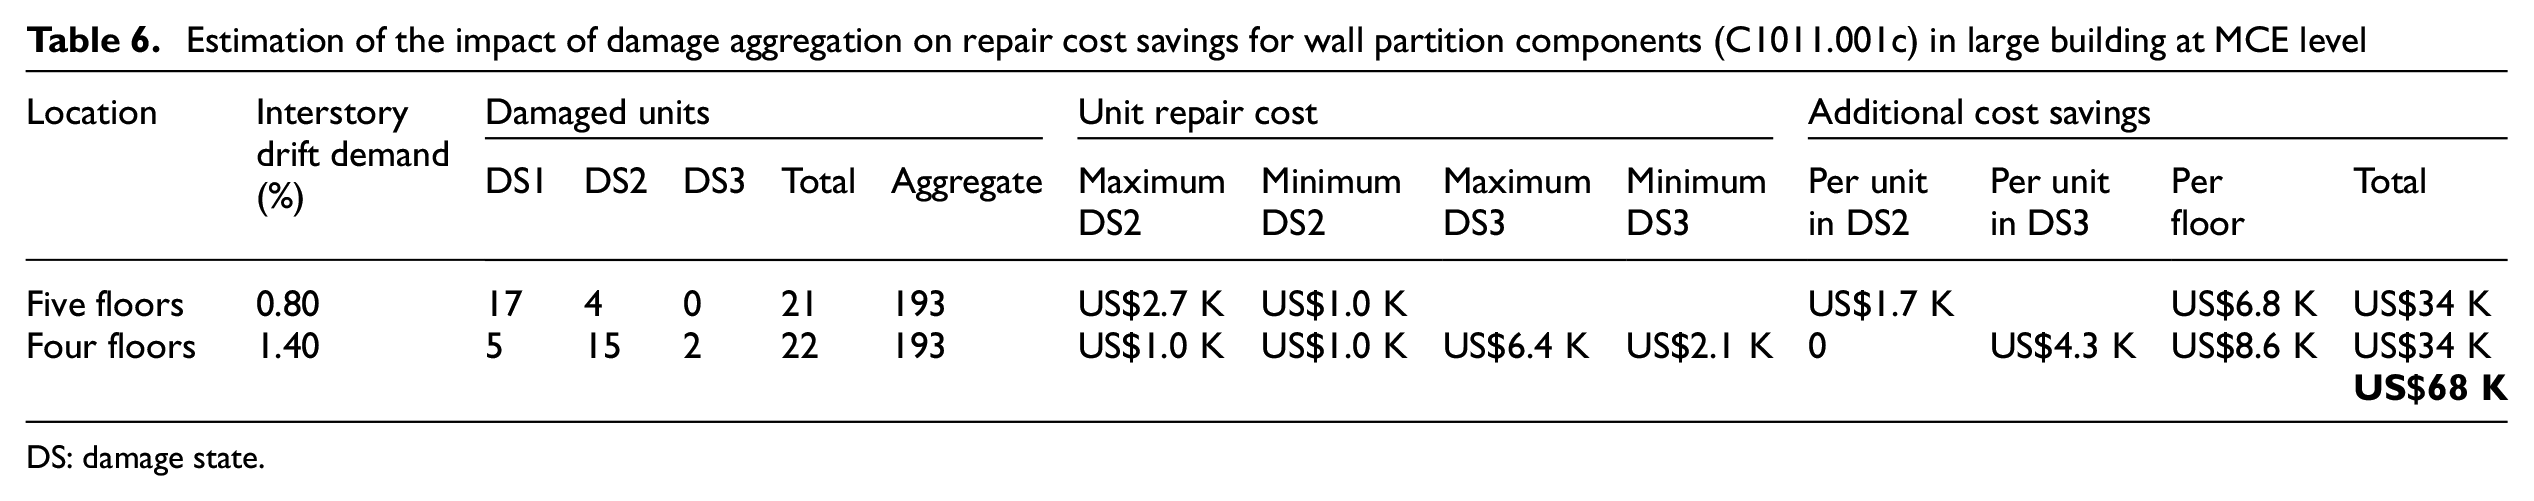
DS: damage state.
The calculation for the small braces installed on floors 4–9 of the example building under the MCE intensity is presented first in detail (Table 3). Using the drift profile shown in Figure 8, we can classify the floors into two groups: floors 4–5 experience approximately 1.40% median interstory drift demand, while the drift in the upper floors is around 0.80%. This approximation of drifts leads to substantially simpler calculations and the results below illustrate that it still provides sufficiently accurate estimates. More complex drift profiles might need more than two groups to be captured faithfully and, in general, the more groups are used, the more accurate the calculations will become. Given these median demands, the fragility functions of the component are used to estimate the number of damaged units on each floor following the logic shown in Figure 7.
The results for DSs 2–4 are combined in Table 3 only for the sake of brevity. The total number of damaged units on each floor is summed to find the maximum aggregate damage that could be applied for economies of scale calculation. For this component, four damaged units on each of the six floors yield a maximum aggregate damage of 24 units. The consequence functions of this component start considering economies of scale at QU = 5 damaged units and the maximum cost savings are reached at QL = 20 units of aggregate damage. If every DS and floor is evaluated independently, these damaged components are always assigned the maximum unit repair cost because fewer than five units are damaged at each floor and DS. On the contrary, if the damage is aggregated across all floors and DSs, the 24 units are sufficient to maximize the economies of scale, producing the minimum repair cost for every damaged unit.
The entries under unit repair cost in Table 3 are the maximum and minimum costs based on the consequence function parameters. Recognizing that the repair cost savings are very similar for DS2 to DS4 for this component and that floors 4–5 only have damage in these higher DSs, the unit repair costs for those floors are based on the DS2 consequence function. The values for floors 6–9 are the mean of DS1 and DS2 consequence function parameters because an equal amount of damaged units are in these DSs there. Such approximations are made to keep this a hand calculation that aims only to provide an estimate of the impact on repair costs. The additional cost savings per unit is the difference between the maximum and minimum unit repair costs. These savings express that the repair cost of each of damaged unit is reduced by US$15,000 to US$16,000 when damages on other floors of the building are considered. These cost savings add up to US$60,000–US$64,000 per floor (considering the four damaged braces per floor) and an estimated US$368,000 considering all six floors with such braces in the building. Hence, these brace components alone can be responsible for shifting the total repair cost of the building by 15% depending on which damage aggregation method is chosen.
The calculations of additional cost savings for the other three components are presented below because they provide a diverse set of cases and demonstrate how to approximate cost savings under various circumstances. The repair of large braces has only 12 aggregate damaged units across three floors, which is not enough to trigger the maximum cost savings for that component (Table 4). This needs to be considered when the minimum unit repair cost is calculated based on the consequence function (Figure 5) and it significantly reduces the potential impact of these components. The US$8K to US$10K savings per unit add up to only US$122K total savings for these braces.
Curtain walls have identical consequence functions assigned to both of their DSs in FEMA P-58, which simplifies the calculation and allows to enter only one maximum and minimum unit repair cost for each row in Table 5. The situation is similar to the smaller braces: damaged unit quantities on individual floors and DSs are less than or near QU = 20, while the aggregate damage across all floors is above QL = 100. Even though the additional cost savings per unit are relatively small, the large number of damaged units in the building yields a substantial impact on the total repair cost.
Wall partitions present a case where large differences between the consequences of various DSs necessitate separate calculations for unit repair costs in each DS. The only simplification made in Table 6 is removing DS 1 because the corresponding cost savings are negligible. There are large numbers of units in DS1 and DS2 below 0.80% and 1.40% drift demands, respectively, and these numbers are already more than the QL = 10 for the component and trigger the maximum cost savings. In such cases, the component repair unit cost does not benefit from additional aggregate damage from other floors or DSs and there are no additional cost savings. On the contrary, since QU = 1 for this component, the maximum unit repair cost for DSs with more than one damaged unit is interpolated using the linear portion of the consequence function. The introduction of economies of scale at low damage quantities prevents the upper-bound unit cost from being reached with any damage aggregation approach, thus reducing the potential impact on the total repair cost. The potential impact on the total repair cost is small not only because the additional cost savings per unit are relatively small, but also because the number of damaged units for which additional cost savings can be applied is small.
Figure 12(a) shows the total repair cost CDFs for only the four components discussed above. The results under MCE intensity confirm that the calculated approximate impacts in Tables 3 to 6 are sufficiently accurate to characterize the magnitude of the impact on total repair costs. The sum of estimated differences for the four components (US$810K) is close to the difference in total repair costs when all components are considered in Figure 9 (US$845K). This observation further supports the approximations suggested in the above calculations. A similar hand calculation can provide estimates of the impact of aggregating only across DSs or only across floors. Figure 12(a) illustrates that these impacts might be substantially smaller than the maximum.
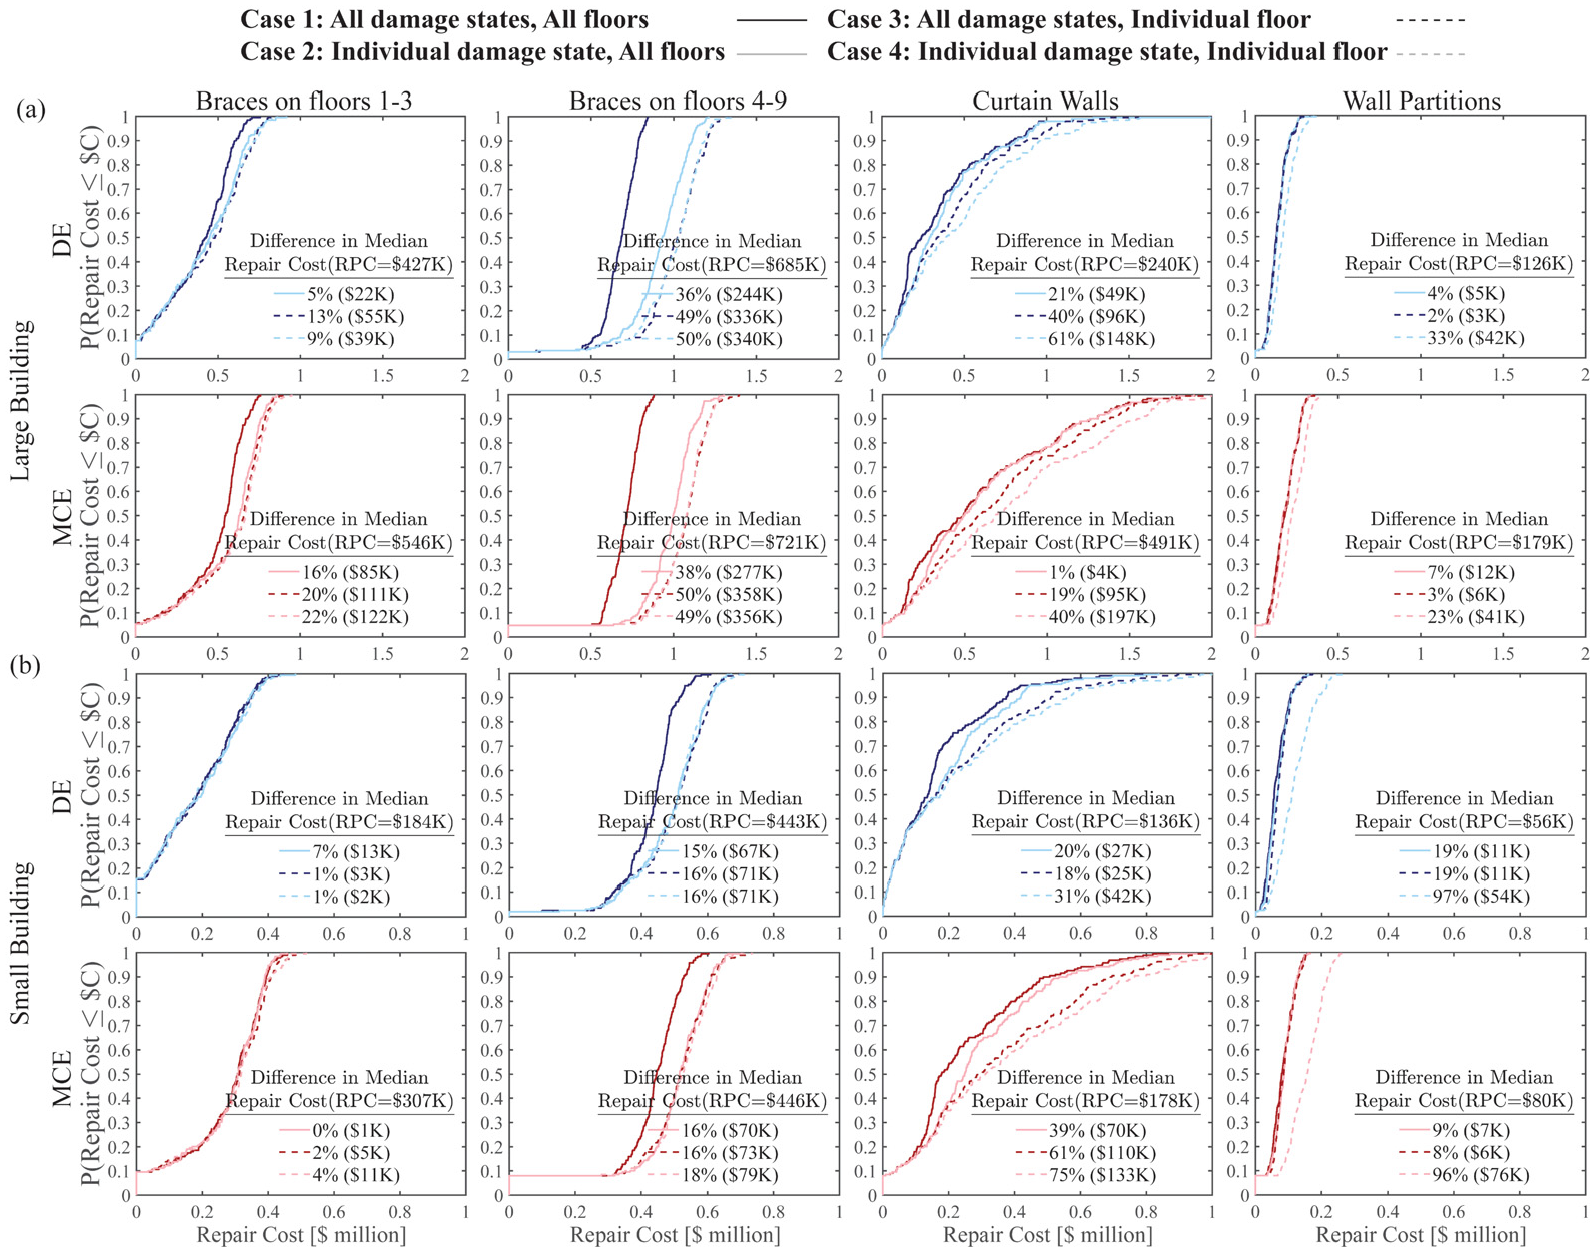
Comparison of total repair costs for each of the four components that are the main contributors to the impact of damage aggregation on the total repair cost of the example building. Results are shown at design earthquake (DE) and maximum considered earthquake (MCE) intensity levels for the large (a) and small (b) building footprint.
The results for the smaller building are shown in Figure 12(b) to highlight how the contribution of each of the four components changes when only half the quantity is assigned to each floor. Brace damage in the smaller building, for example, contributes substantially less to the additional cost savings because the total number of damaged braces in the building is not large enough to minimize the unit repair cost. Conversely, the contribution of curtain wall and wall partitions to median repair costs sometimes increases because the number of damaged units is closer to Qcr. This illustrates that it is not trivial to determine the significance of damage aggregation on the total repair cost in a performance assessment. It is recommended to perform the steps of the proposed evaluation strategy to arrive at a reliable estimate.
Recommendations for damage aggregation
The discrepancy between the estimated losses obtained using the different edge cases in the examples presented above suggests that analysts need to know which damage aggregation method is implemented in popular tools so that they can determine whether to adjust their results. In addition, the developers of consequence models need to provide information on how the parameters of the models are calibrated based on various potential edge cases. This information is also critical to ensure a fair comparison when benchmarking different tools. Therefore, the authors recommend developers of performance assessment tools to describe their approach to damage aggregation in the documentation and, if possible, provide multiple options for their users. Also, due to the modularity of the FEMA P-58 framework, different components used in a calculation could have been developed by different research groups using different assumptions on damage aggregation. It would be useful to document these assumptions for future studies, as such information is not currently available.
If the damage aggregation method has substantial impact on the repair cost consequences in a seismic performance assessment, the analyst must decide which aggregation method to use in their evaluation. Without knowing how the consequence functions of FEMA P-58 were developed, it is not possible to pick the one that will lead to realistic results. Using any other assumption than the one used when the consequence functions were calibrated will lead to biased results. Hence, the authors cannot recommend any of the approaches for general application. Instead, we recommend analysts to be explicit about this epistemic uncertainty by calculating and communicating the range of possible results using the edge cases presented in this article and adjusting the median of the total repair cost CDF accordingly. Alternatively, engineers can use their own judgment and assign an aggregation method to each repair action of each component considering the cost savings modeled by the corresponding consequence functions and how they map to local construction practices at the building’s site. This requires a substantial effort and would best be accomplished through collaboration that leads to a consensus in the engineering community around component-specific assignments. Such a consensus would provide a short-term solution if the widely used analysis tools are enhanced to support component-specific damage aggregation when considering economies of scale.
Although the above recommendations would improve how economies of scale are quantified within the existing framework that relies on edge cases, the examples provided earlier in this article illustrate that none of the edge cases is a trivial best choice to model the repair of components. Given the importance of repair cost and repair time modeling in performance-based engineering, the authors believe that the repair consequence estimation framework in FEMA P-58 would benefit from fundamental enhancement to model economies of scale more appropriately. In the following subsections, two recommendations are made for improved modeling of consequence functions to better estimate economies of scale. Any enhancement in this part of the methodology should be developed and calibrated in collaboration with contractors to capture their experience.
Economies of scale across components
One recommendation that could be implemented relatively easily is to recognize that damage should also be aggregated across different component types when the damaged units of those components require identical repair actions. FEMA P-58 components that only differ in design details that do not affect the repair process are a good example. For instance, the two types of braces used in the analyses earlier in this article (B1033.021a and B1033.021b) have identical DSs, corresponding drift capacities and repair actions, and quantity limits in their consequence functions. The same conditions apply to seven additional B1033-type braces, and these nine components could form a so-called component group. Numerous other CGs can be defined similarly within the FEMA P-58 component library. The repair consequence calculation of such components would become more realistic by the following simple extension of the methodology: when evaluating economies of scale, every component type within a CG should be considered during damage aggregation.
Figure 13 illustrates the impact of such a modification on the calculated total repair costs of the two brace components in the large building configuration evaluated at the MCE intensity in the case study presented earlier. The modification only affects the cases that aggregate damage across floors because only one type of brace was used on each floor—large braces for the first three floors and smaller braces for the remaining six floors. Hence, the results of Cases 3–4 are identical in Figure 13. On one hand, when all damaged units are aggregated following Case 1 (solid lines in the figure), the small braces already have sufficient damaged units to maximize economies of scale without the contribution of damage from large braces. On the other hand, there are only 12 large braces in the first three floors, which is not sufficient to maximize economies of scale. When the additional damage on upper floors is also considered within Case 1, the repair cost of the large braces is reduced by US$117K, which is approximately 4% of the total repair cost of the building for this scenario. For Case 2 (dashed lines in the figure), which aggregates damage across floors but not across DSs, both brace types benefit, with a total reduction in median repair costs of US$199K due to aggregating across similar components.
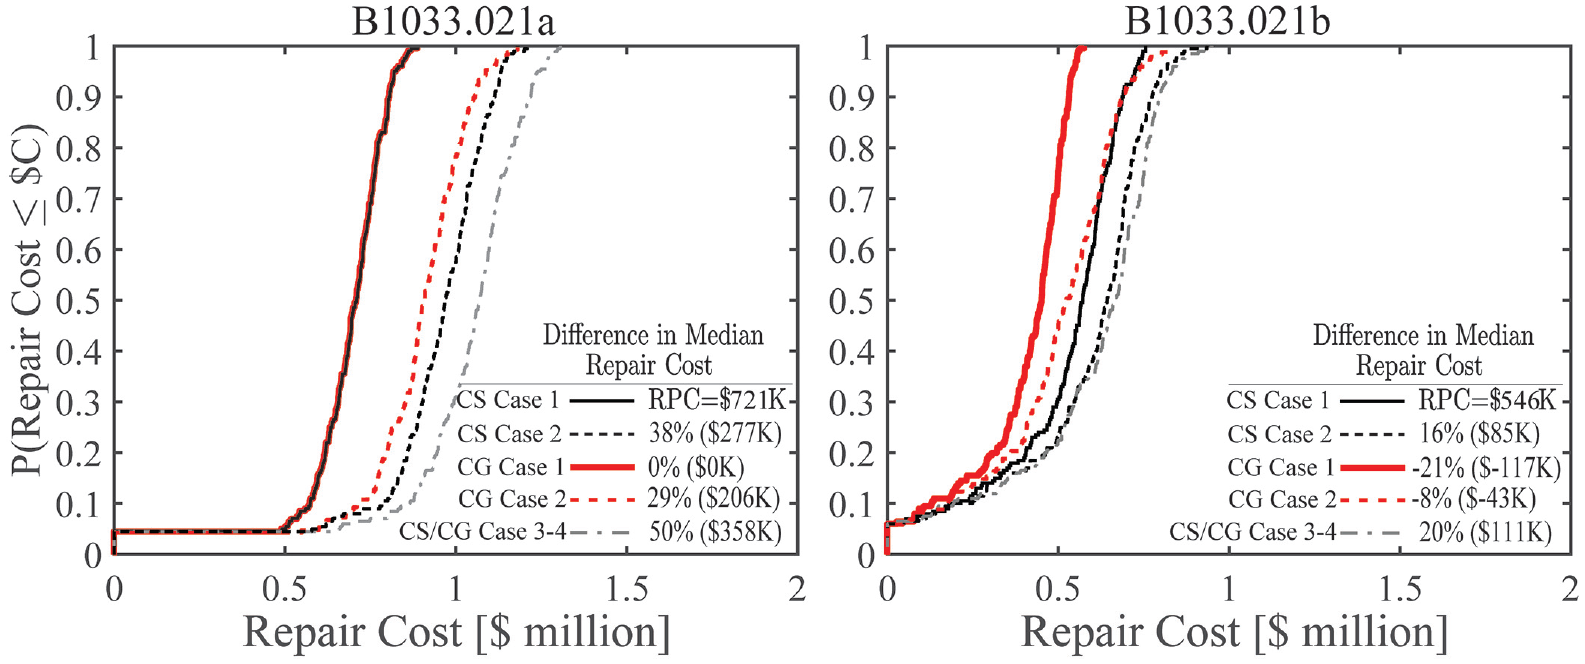
Comparing the impact of component-specific (CS) and component-group (CG) damage aggregation methods on the repair costs of small (B1033.021a) and large (B1033.021b) braces that belong to the same component group in the case study building.
Economies of scale across tasks
The similarities between repairs of different components could be modeled more accurately through the following generalization of the component-group (CG) approach. The background documentation of FEMA P-58 already breaks down repair actions into a series of tasks. Each task is performed by a particular type of contractor. Economies of scale apply when the same task is performed many times by the same contractor, regardless of which particular component’s repair is supported by them. For example, the various pipe components behind suspended ceilings share the repair tasks that involve removing the ceiling panel. Savings and also costs would be easier to measure, model, calibrate, and validate at the specific, explicitly described task level. Some of the tasks might limit damage aggregation to a single floor, while others might use aggregated damage from the entire building to calculate their cost. After determining the cost of each task in the building, the repair costs could be calculated by aggregating the cost of tasks that make up the repair action of each damaged component unit. The types of contractors required to repair each component in the FEMA P-58 library are already assessed and characterized within the scope of the ATC-138 project (ATC 138-3, 2021) for the sake of realistic impeding time calculation and repair sequencing. The outcomes of that project could be incorporated into the FEMA P-58 methodology as part of the more sophisticated model for economies of scale that is proposed here.
Conclusions
This study focused on the robustness of the high-resolution FEMA P-58 seismic performance assessment methodology for modeling economies of scale in repair consequence simulation. FEMA P-58 is important not only because it is ubiquitous in earthquake engineering research and practice, but also because it serves as a template for high-resolution approaches under other hazards. Neither the published methodology nor its background documentation describes the process of aggregating damaged component units across floors and DSs when evaluating potential repair cost or time reduction due to economies of scale. This article highlighted the highly variable and often substantial impact of this ambiguity on total repair costs. The results illustrate that the impact varies across seismic intensities and designs. This is especially concerning when the relative performance of various designs is sought because the outcomes of the evaluation could be dependent on the chosen damage aggregation approach. Similar outcomes for repair times could heavily influence functional recovery time calculations. The authors proposed an approximate calculation to estimate this impact and suggested future extensions to the FEMA P-58 consequence model and its documentation to address the problem.
Four so-called edge cases were presented to cover the range of possible aggregate damage values within the scope of FEMA P-58. The four edge cases are a combination of two binary decisions: consider one floor or aggregate across all floors, and consider one DS or aggregate across all DSs. Several examples illustrated that the difference between edge cases ranges from less than 1% to more than 25% of the total repair cost of the building.
To the authors’ knowledge, Pelicun (Zsarnóczay et al., 2022) is the only widely available performance assessment tool that supports multiple damage aggregation methods. To support the large number of analysts who use other tools, and the review of past assessments where the model might no longer be available, a three-step strategy was proposed that helps quickly evaluate the impact of this phenomenon on a specific performance assessment. The proposed method was supported by a detailed investigation that demonstrates the complex relationship between performance assessment input data and the observed differences in repair costs. The number of DSs, the quantity of components on each floor, the consequence function parameters, and the quantity of damaged components were identified as key drivers of the outcomes. The proposed strategy provides three steps of increasing complexity to test each component in a performance model and evaluate whether its repair costs can be affected by how damage is aggregated. This strategy helps identify the few components responsible for the majority of the differences in repair costs, and a simplified calculation was proposed to approximate their impact.
A case study of a 9-story steel frame structure was presented to illustrate the application of the proposed strategy and to demonstrate the impact of damage aggregation on repair costs at three different seismic intensity levels and with two different floor areas. Braces, curtain walls, and wall partitions were identified as the main contributors, yielding up to 30% difference in total repair costs depending on how damage is aggregated in the analysis. The results of the proposed evaluation strategy were verified by performing detailed simulations with all four edge cases.
This article highlights that economies of scale often have significant influence on repair costs in practical cases. Due to the lack of information about the assumptions made by various consequence function developers, it is not possible to select a single damage aggregation method as the correct one. Instead, stakeholders are encouraged to start a discussion and develop a consensus on how to address this problem in the short term. Until then, the authors recommend taking a conservative approach, quantifying the range of possible repair costs, and communicating this uncertainty in the results. In the long term, the authors suggest a more complex repair consequence model that disaggregates repair actions into individual tasks. Economies of scale at the task level would be easier to model, calibrate, and verify and promises a more robust calculation method for this important phenomenon.
Supplemental Material
sj-csv-1-eqs-10.1177_87552930231220001 – Supplemental material for Consequences of consequence models: The impact of economies of scale on seismic loss estimates
Supplemental material, sj-csv-1-eqs-10.1177_87552930231220001 for Consequences of consequence models: The impact of economies of scale on seismic loss estimates by MirAmir Banihashemi, Alessandra Miliziano, Ádám Zsarnóczay, Lydell Wiebe and Andre Filiatrault in Earthquake Spectra
Footnotes
Declaration of conflicting interests
The author(s) declared no potential conflicts of interest with respect to the research, authorship, and/or publication of this article.
Funding
The author(s) disclosed receipt of the following financial support for the research, authorship, and/or publication of this article: The National Science and Engineering Research Council of Canada was gratefully acknowledged for providing funding to the first author of the article under a Discovery Grant awarded to the fourth author of the article. The Italian Ministry of Education, University, and Research was also gratefully acknowledged for providing funding to the second author of the article under the project “Dipartimenti di Eccellenza,” at IUSS Pavia. The material presented in the article is based upon work conducted by the third author of the article supported by the National Science Foundation (grant nos 1621843 and 2131111). Any opinions, findings, and conclusions or recommendations expressed in this material are those of the authors and do not necessarily reflect the views of the National Science Foundation.
Supplemental material
Supplemental material for this article is available online.
References
Supplementary Material
Please find the following supplemental material available below.
For Open Access articles published under a Creative Commons License, all supplemental material carries the same license as the article it is associated with.
For non-Open Access articles published, all supplemental material carries a non-exclusive license, and permission requests for re-use of supplemental material or any part of supplemental material shall be sent directly to the copyright owner as specified in the copyright notice associated with the article.