
Abstract
This article proposes a model to quantify dependencies in component damage in the Federal Emergency Management Agency (FEMA) P-58 seismic performance assessment methodology and to simulate damage realizations with the desired dependencies. The model is compatible with the prior FEMA P-58 procedure and can quantify more realistic dependencies in component damage with only minor changes to the calculation algorithm and model parameters. This article introduces the proposed model and compares it with the prior procedure. Example calculations are then used to illustrate the quantitative impacts of component damage dependencies on building-level performance metrics. The model is relatively simple to conceptualize and parameterize, so that the degree of dependency can be easily estimated and documented. Given the improved conceptual framing of the problem, and the significant changes it sometimes produces in building-level performance predictions, this model represents an improvement to the general FEMA P-58 seismic performance assessment methodology.
Introduction
The Federal Emergency Management Agency (FEMA, 2018) P-58 seismic risk assessment procedure is appealing because it considers structure-specific features and quantifies a range of performance metrics relevant to decision-makers (Haselton et al., 2018). FEMA P-58 builds upon and standardizes prior performance-based and assembly-based loss assessment procedures (Cornell and Krawinkler, 2000; Moehle and Deierlein, 2004; Porter et al., 2001). Given a ground shaking amplitude (which can be specified as a single amplitude or probabilistically), the procedure assesses building response, damage to individual components of the building, and then the costs and recovery time of that damage. The procedure is Monte Carlo-based, where each stage of analysis is performed by sampling realizations from specified probability distributions, and the set of simulated results is used to quantify the distribution of predicted consequences.
This article is concerned with the component damage stage of the FEMA P-58 analysis. Component damage is simulated by utilizing an Engineering Demand Parameter (EDP), such as a displacement or acceleration at a given location in the building, and a fragility function to compute the resulting probability of a component experiencing a given damage state.
Dependencies in the damage states of individual building components are an important consideration in building damage, but the prior FEMA P-58 method does not comprehensively consider dependencies. To motivate this issue, consider the damage data and fragility function shown in Figure 1. The fragility function, represented by the solid line, specifies the probability that a gypsum wallboard partition experiences light cracking, as a function of the story drift ratio it experiences. The experimental data in the figure, as well as the resulting fragility function that was fit to these data, indicate that a partition wall may experience minor damage at drift ratios as low as 0.1%, but even at drift levels above 0.4%, damage is not certain.
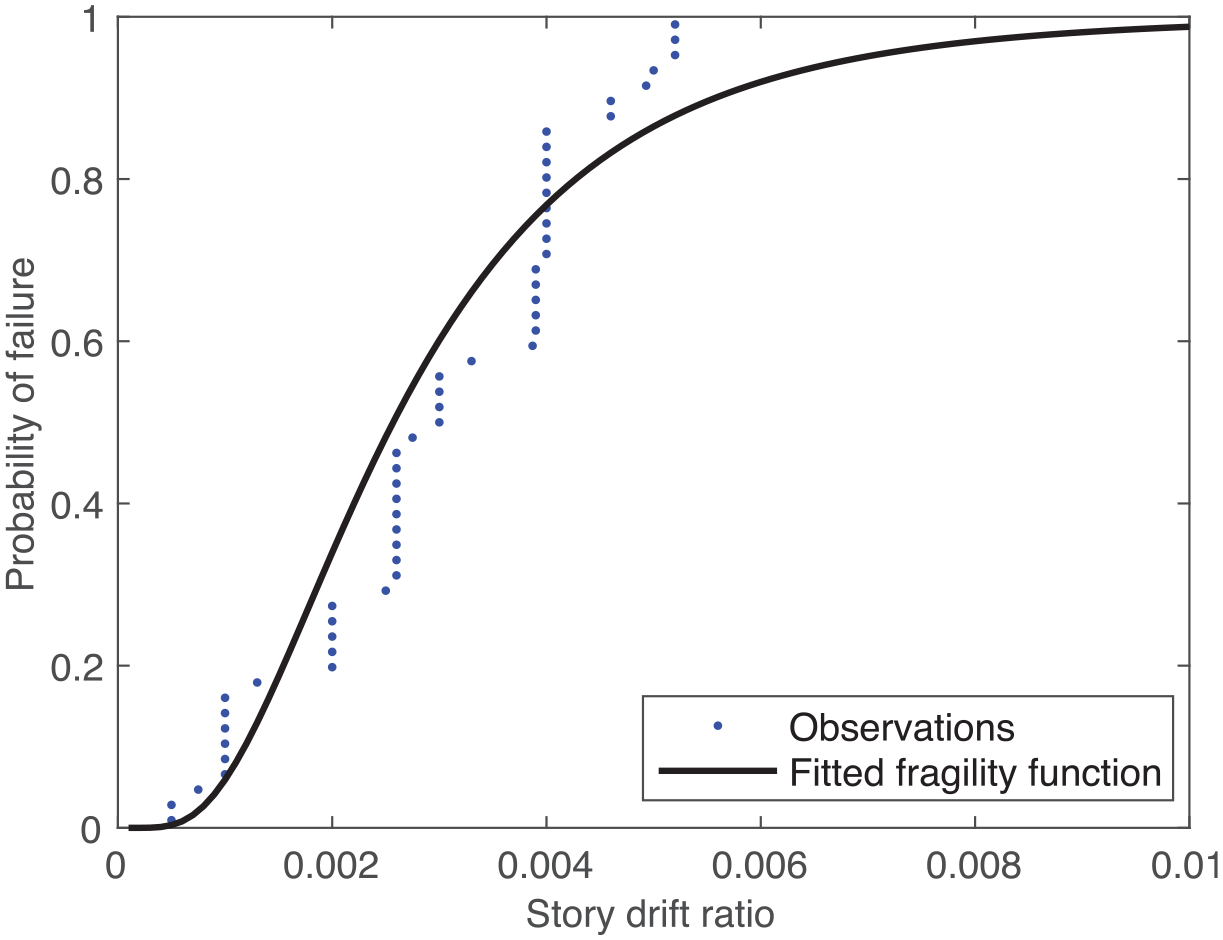
Experimental data and fragility function for gypsum wallboard partitions experiencing Damage State 1: first visible damage, light cracking. Points indicate the fraction of experimental components with observed damage at a given drift ratio, and the line indicates the fragility function that was fit to these data.
There are a number of potential causes for this observed variability in the demand levels that trigger component damage (e.g. FEMA, 2018, section 3.8.1): (1) Damage is predicted by a scalar demand metric (e.g. story drift ratio), but actual damage is caused by a complex sequence of displacements, accelerations, and velocities during shaking. The demand metric is thus an imperfect representation of the loading on the component. (2) Components of the same “type” have varying characteristics due to inherent randomness in the materials they are made of. (3) A particular contractor or subcontractor may do better or worse than typical when installing the component (e.g. in anchoring pipes and suspended ceilings). (4) A component fragility function represents a range of specific components and a range of construction means and methods, but a particular building will use a specific component (e.g. the “glass curtain wall” component types in FEMA P-58 represent general categories of components rather than one specific model and installation detail).
The above sources of variability will influence multiple components throughout a building, rather than affecting each component independently. For example, for a given component type, the construction quality and specific component type will likely be similar throughout a building, leading the components to be damaged at a similar level of demand. These can be accounted for by defining damage state dependencies. However, the prior FEMA P-58 method generally considers damage occurrence given EDP to be independent from component to component (with a limited exception for a few types of components that are assumed to all take the same damage state when co-located).
Furthermore, some building loss metrics are sensitive to assumptions about damage state dependencies. To illustrate, consider an idealized building with 100 components, each of which would cause building closure if damaged, and each having a 0.01 probability of being damaged. If the components’ damage occurrences are perfectly dependent (i.e. either all of the components are damaged or none are), then the building has a 0.01 probability of closure. But if the components’ damage occurrences are independent, then the building has a 0.63 probability of closure (each of the components has a 0.99 probability of functioning, so there is a
This article proposes a general model to consider dependencies in component damage that has the following characteristics: (1) It is compatible with the Monte Carlo simulation approach for propagating uncertainties utilized by FEMA P-58. (2) It allows for dependencies in damage among components of the same type located throughout a building (e.g. identical ceiling tiles at multiple locations in the building) and dependencies in damage among component types with similarities (e.g. concrete components that are all constructed by the same subcontractor). (3) Is simple to conceptualize and parameterize, so the degree of dependency can be estimated via judgment and easily documented.
These damage dependencies have been previously discussed in other risk analysis studies considering multiple components. Nuclear power plant risk assessment documents have noted the effect of component damage correlation on system failure probabilities since the 1980s (Smith et al., 1981). There have been multiple proposals for ways to address this. Reed et al. (1985) proposed bounding estimated system performance, but this approach has limitations (Segarra et al., 2021) and is not amenable to Monte Carlo analysis of the type used in FEMA P-58. Baker (2008) discussed Monte Carlo simulation of partially correlated component capacities, but only as a basic concept that did not consider multiple component types and multiple damage states. Segarra et al. (2021) proposed a Bayesian Network formulation that is more general, but is not compatible with the FEMA P-58 Monte Carlo simulation algorithm. Anup et al. (2022) recently proposed a parameterization of component fragilities similar to that proposed here, but with a focus on analytical system reliability calculations rather than Monte Carlo loss assessments, and without exploring numerical implementation or presenting system-level results to explore the impact of correlations.
Correlation of multiple spatially distributed components is also important to risk analysis of systems such as a portfolio of properties or a lifeline system with components located throughout a region (e.g. Bazzurro and Luco, 2007; Sousa et al., 2018). Several researchers have studied the importance of correlations in this context. Shome et al. (2012) proposed a model for spatial correlation of loss ratios that has the rare advantage of being empirically calibrated, but it is relevant for continuous-valued loss ratios rather than discrete damage states, and it was only calibrated for losses to wood houses. Lee and Kiremidjian (2007) and Heresi and Miranda (2022) proposed applying correlation to the discrete outcomes for each component, but their approaches are somewhat unwieldy to calibrate and implement and are not designed for use in Monte Carlo simulations. The proposal presented here thus builds upon some concepts in the aforementioned prior literature, presenting a model that is straightforward to implement for multiple component types and damage states and compatible with the Monte Carlo assessment approach utilized in the FEMA P-58 methodology.
The remainder of this article first describes the prior FEMA P-58 component damage methodology. The proposed model with partial damage dependencies is then described and contrasted with the prior model. An idealized simple example is then presented, to build intuition regarding the impact of these dependencies. Finally, results from a realistic building analysis are presented, to quantify the practical impact of these dependencies, and to assess the sensitivity of the results to alternative parameter values for correlations.
Prior FEMA P-58 method
Here, we describe the prior FEMA P-58 method for simulating component damage, in order to highlight the adjustment made in the proposed method. This section also defines relevant model parameters and documents the prior method so that it can later be used to produce example results.
The FEMA P-58 methodology uses a fragility function to estimate the probability of component damage from an EDP,

where
Once the probability
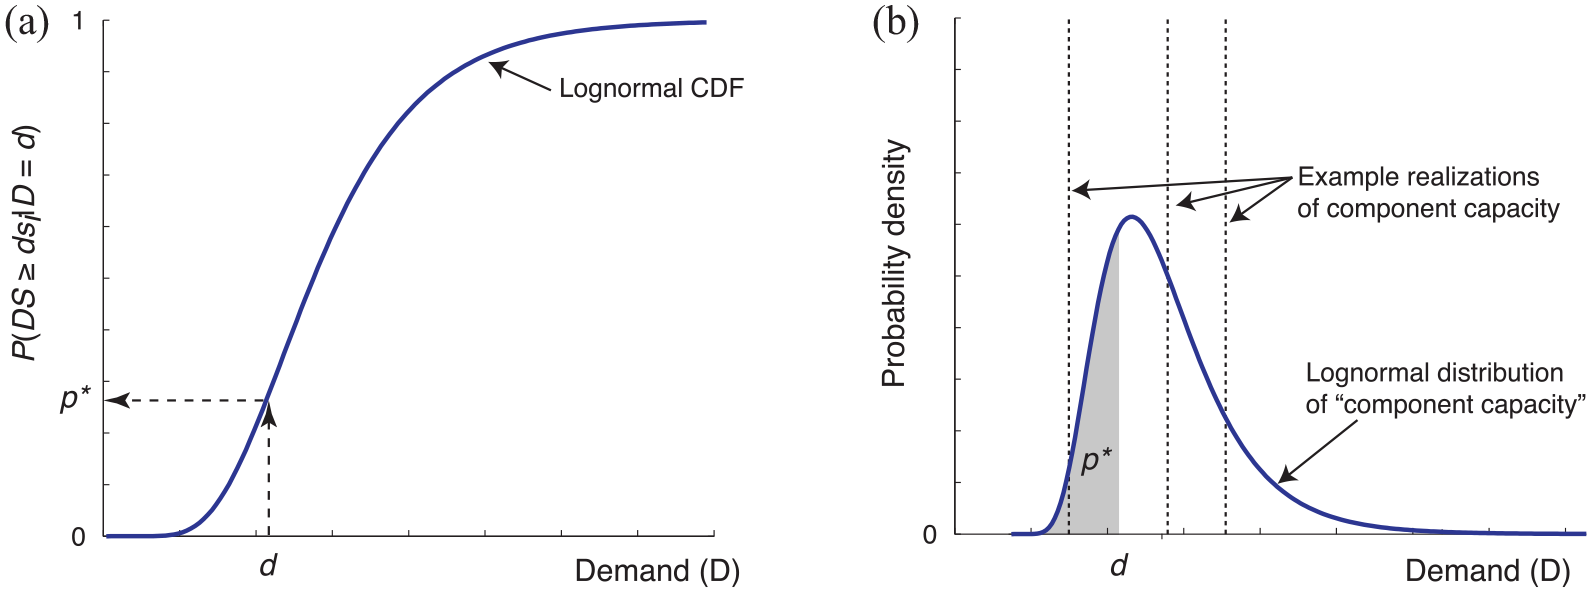
(a) Traditional method for sampling damage states for a given level of seismic demand,
Proposed method
Here, we describe the proposed method for sampling of component damage, first for a single component, and then for multiple components.
Capacity sampling for a single component
The proposed approach treats the capacity of the component to withstand damage as the random variable to be sampled. This is in contrast to the prior method, where the binary outcome of damage or no damage is the sampled random variable.
The capacity of the component is defined as:

where
With this formulation, damage is simulated by generating a Monte Carlo simulation of
When a component has multiple damage states (and multiple associated

where
Capacity sampling for multiple components
When considering multiple components, it is now straightforward to introduce dependence in their damage outcomes via the parameter
To introduce partial dependence in damage outcomes, and to facilitate the parameterization of dependence, we decompose the

where
We propose the following groupings of component capacity sources, in order to increasing specificity:
The “all” and “system” groupings are motivated by the sources of component damage correlation discussed in section “Introduction.” Example groupings of components into systems are provided in Table 1. These groupings follow the system groupings used in the Cook et al. (2022) methodology for functional recovery and disaggregate structural components by trade. These approximately represent groups of components likely to be built by the same subcontractor.
Sample component groupings for (a) structural and (b) non-structural components
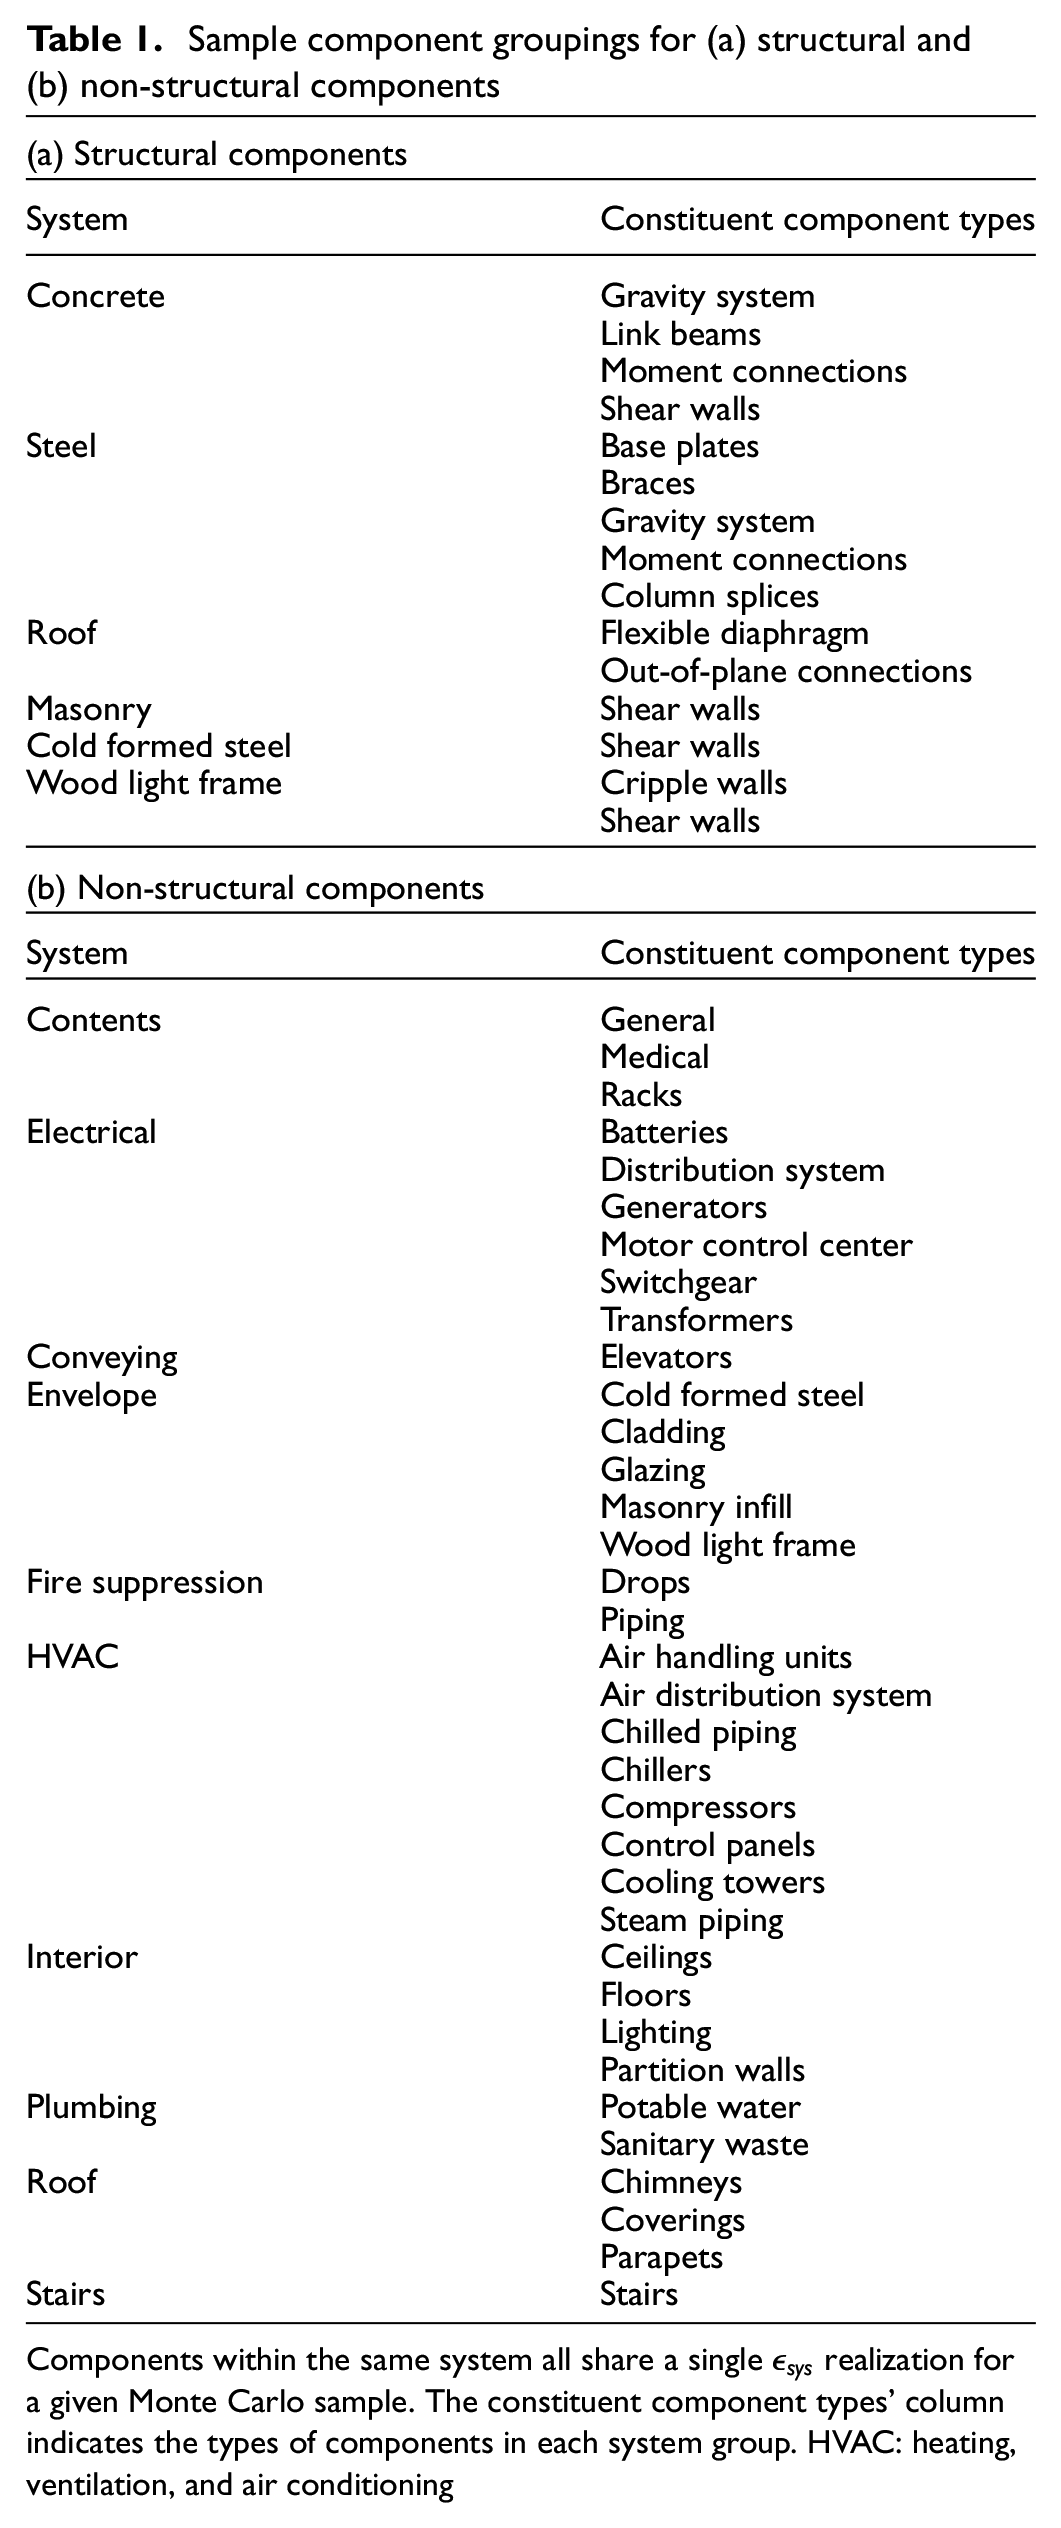
Components within the same system all share a single
When simulating damage to multiple components, some terms contributing to capacity variability will be shared among components. To illustrate, consider two components in the building which fall into the same system category (Figure 3). When the capacities of these components are simulated, a single realization of
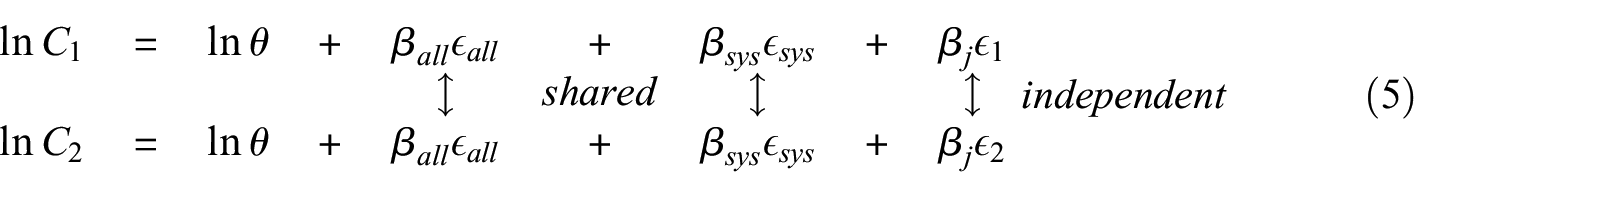
where
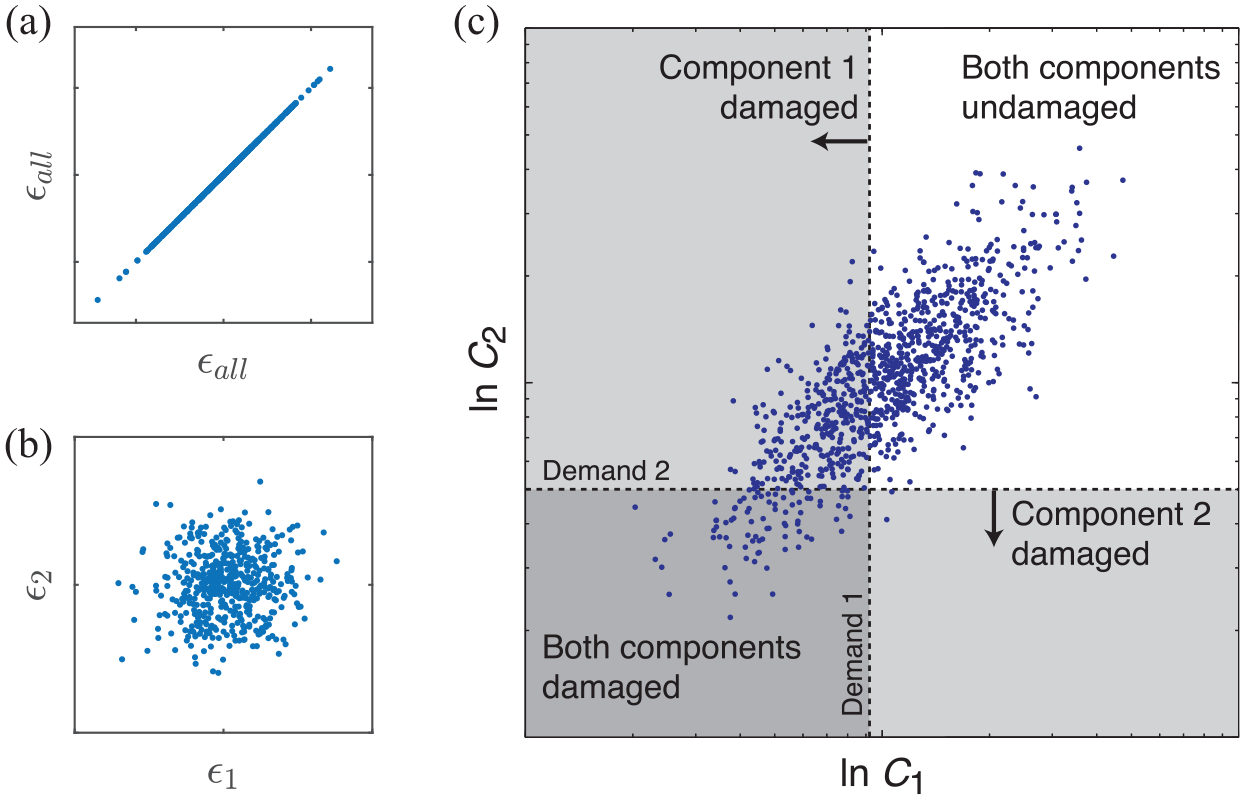
Monte Carlo simulations of residual terms and component capacities for two components. (a) Simulations of the
The approach of decomposing the
Parameterization
This section utilizes the model from the previous section and reframes the equations into a format that is easy to implement and facilitates intuitive parameterization of correlations. The variance of

This variance should equal
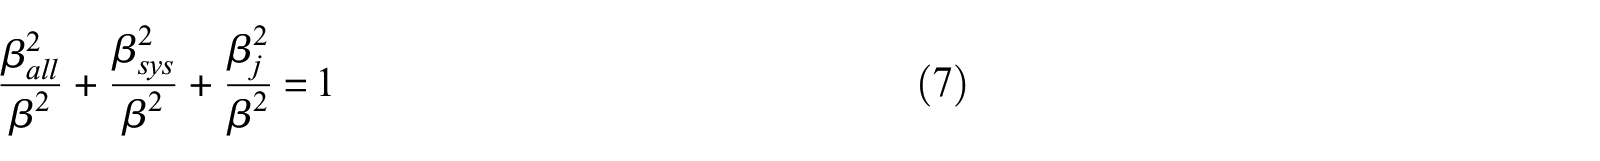
The relative contributions of each uncertainty group can thus be quantified by relative “weights,”
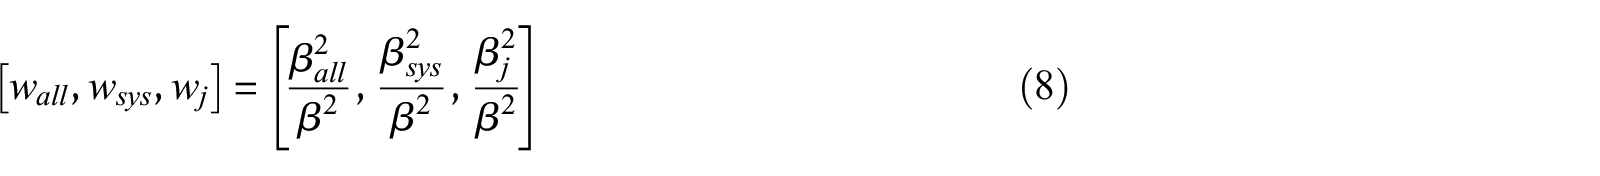
Substituting Equation 8 into Equation 4 to specify the capacity

The relative weights therefore determine how correlated the component capacities are with capacities of components of other types.
Fully independent component capacities would be achieved by placing weight only on the

Fully dependent component capacities would be achieved by placing weight only on the

Even with the fully dependent capacity model, the damage states could still differ among components with differing demands, but this model would produce much more similarity in damage states than that of Equation 10. Partially dependent component capacities can be produced by other combinations of weights.
Proposed model weights
We propose using the following weights for the purpose of FEMA P-58 assessments:

This model assumes that some of the uncertainty is shared by all components (20%), and some is shared by all components of the same system (60%), with the remainder unique to each component. Equation (12) is motivated by the observation that most sources of component damage variability that were described in section “Introduction” will vary by system (e.g. subcontractor construction quality and the specific component in a building relative to a broader set of components of that type), suggesting that the largest weight should be on
Example results presented below suggest that some building performance metrics are strongly affected by the choice of fully independent, fully dependent, or partially dependent component damage. However, for a partially dependent component damage model such as Equation 12, modest changes to the relative weights have much lesser impact (see the Supplemental Materials for results to support this statement). The proposed model is thus believed to capture the important characteristic of partially dependent damage, without being highly dependent on the specific choice of weights.
Model generalizations
Equation 4 was presented to be compatible with the proposed model weighting. But the equations and model weights can be generalized in several ways if desired, while still maintaining the general characteristic of partial correlations.
First, the number of
Second, the weight vector of Equation 8 does not need to be fixed for all components in the building. Components of different types can have unique weight vectors. This might be appropriate if one believed, for example, that concrete components and mechanical components had differing within-system correlations in their capacities. This is straightforward from an algorithmic perspective and numerically valid. Nevertheless, the lack of empirical data to constrain these models led to a preference for the simpler proposed model at present.
Third, dependence in component capacities does not need to be specified via the above decomposition of
Simple example
To illustrate the impact of this formulation, we first present results for a highly idealized case. We consider a four-story building, with story drift ratio
Figure 4 shows component damage statistics for three permutations of analyses. In all three cases, the model parameters in the mentioned above are used. The only difference among the three cases is the assumed component correlations. We use the
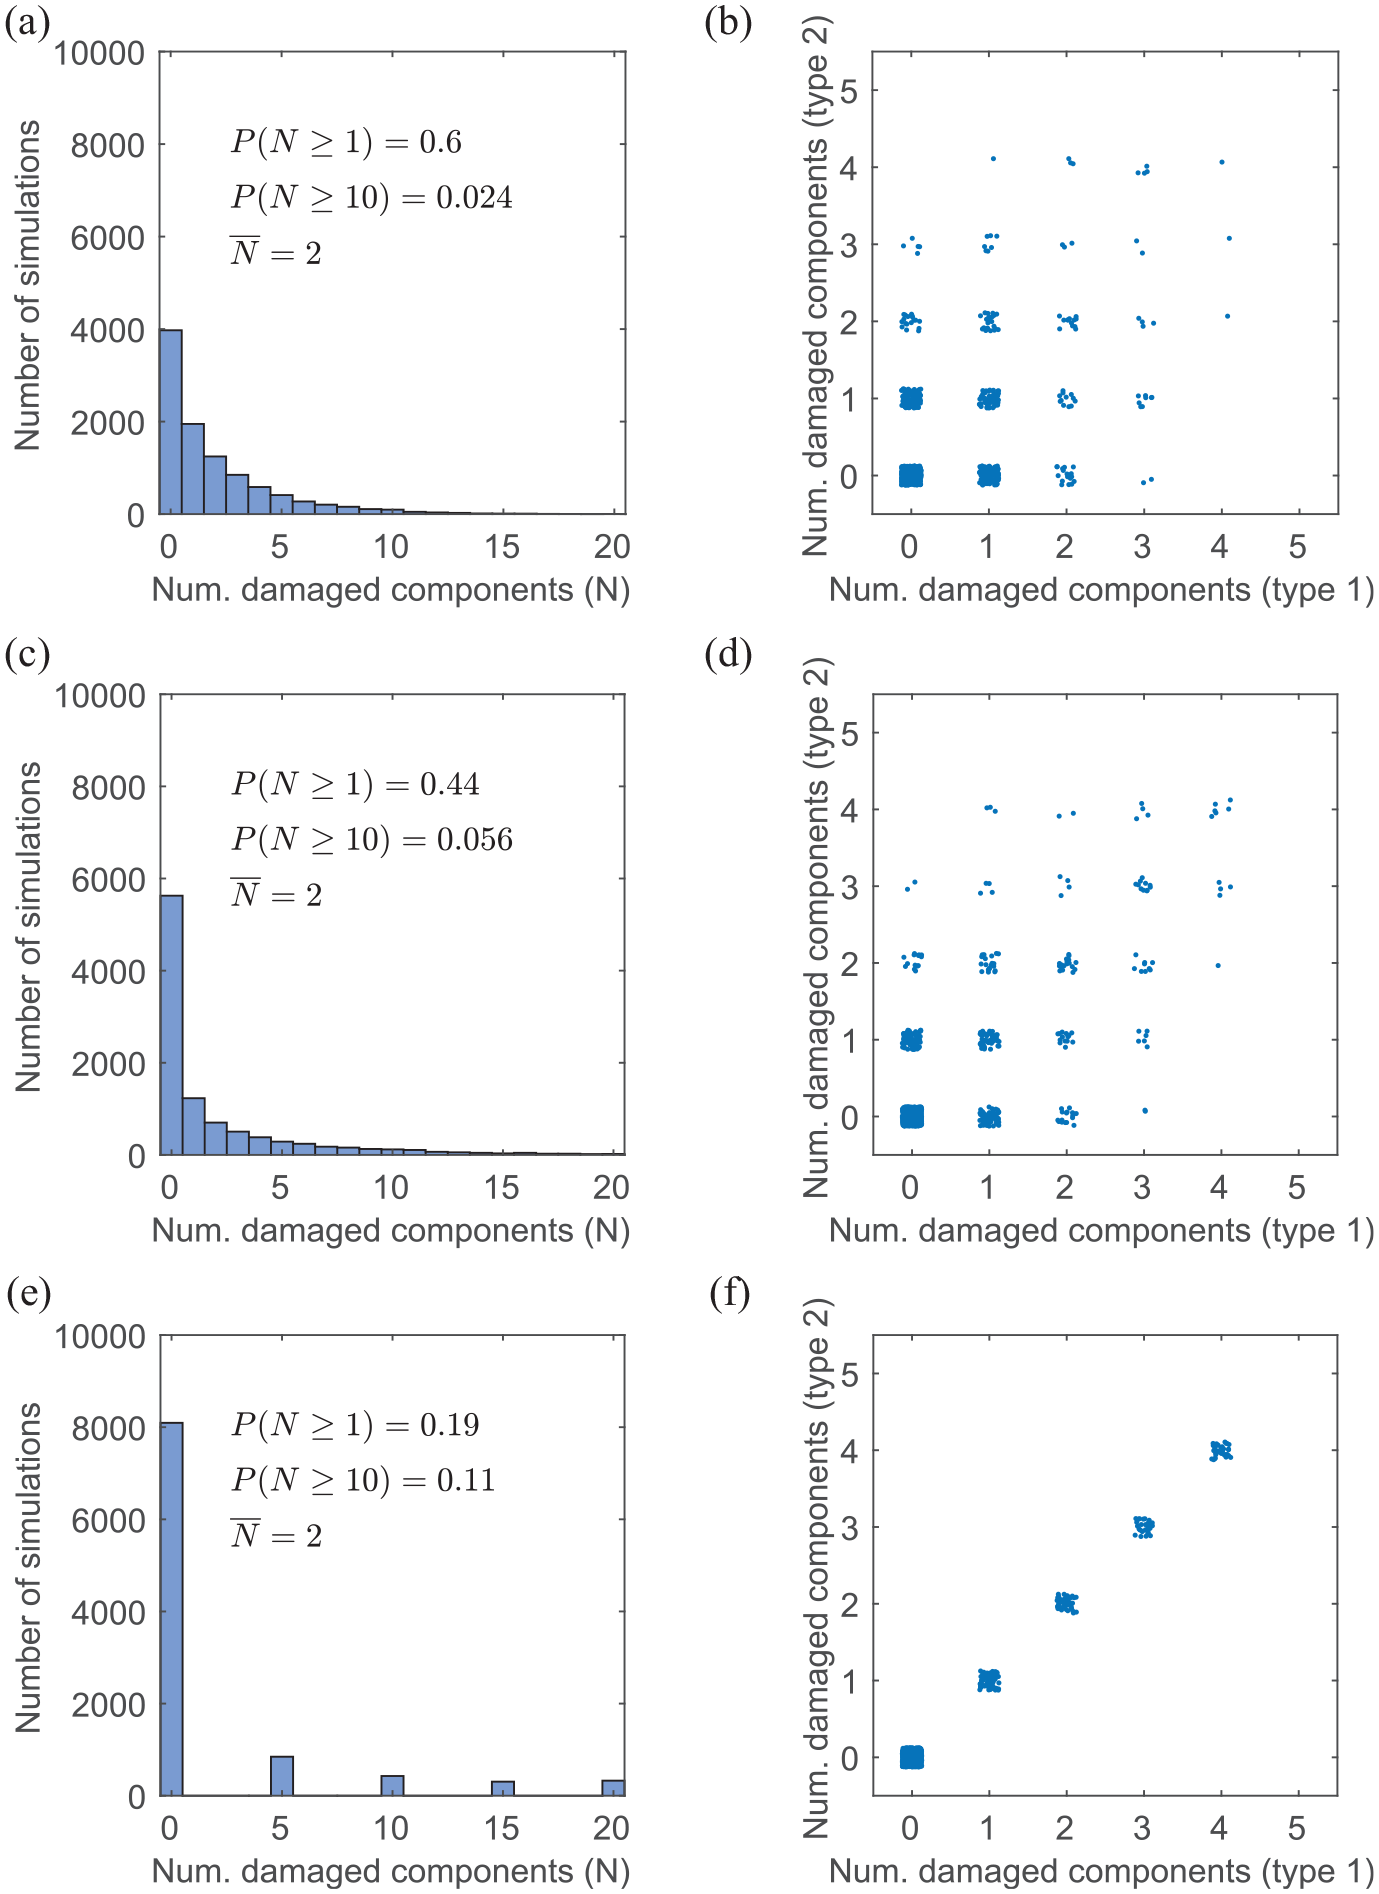
Component damage statistics for the simple example, under varying component damage correlation models. (a and b) No correlation:
Figure 4a and b shows results for
Figure 4c and 4d shows results for
Finally, Figure 4e and f shows results for
These cases provide an indication of how component capacity correlation affects building-level damage features. In all three cases, the mean number of damaged components,
This simple example is intended to build intuition about the role of component capacity correlations on predicted building-level impacts and to demonstrate that the impact of correlations depends upon the building-level metric of interest.
Realistic example
To illustrate the impact of these component correlations in more complex and realistic cases, we present results for several performance metrics of a case study building. We consider a 20-story steel moment frame office building located in Los Angeles, CA, following ASCE 7-16 seismic design requirements (American Society of Civil Engineers (ASCE), 2016). Ground motion hazard is computed using U.S. Geological Survey probabilistic hazard results (Petersen et al. 2014). The quantities and types of damageable components in the building are based on the office occupancy, and on building code requirements, as embedded in the FEMA P-58 normative quantities. Joint probability distributions of drifts and accelerations at all floors, for a range of
Table 2 describes several
Summary of weighting schemes used to produce building-level performance metrics for the realistic example building
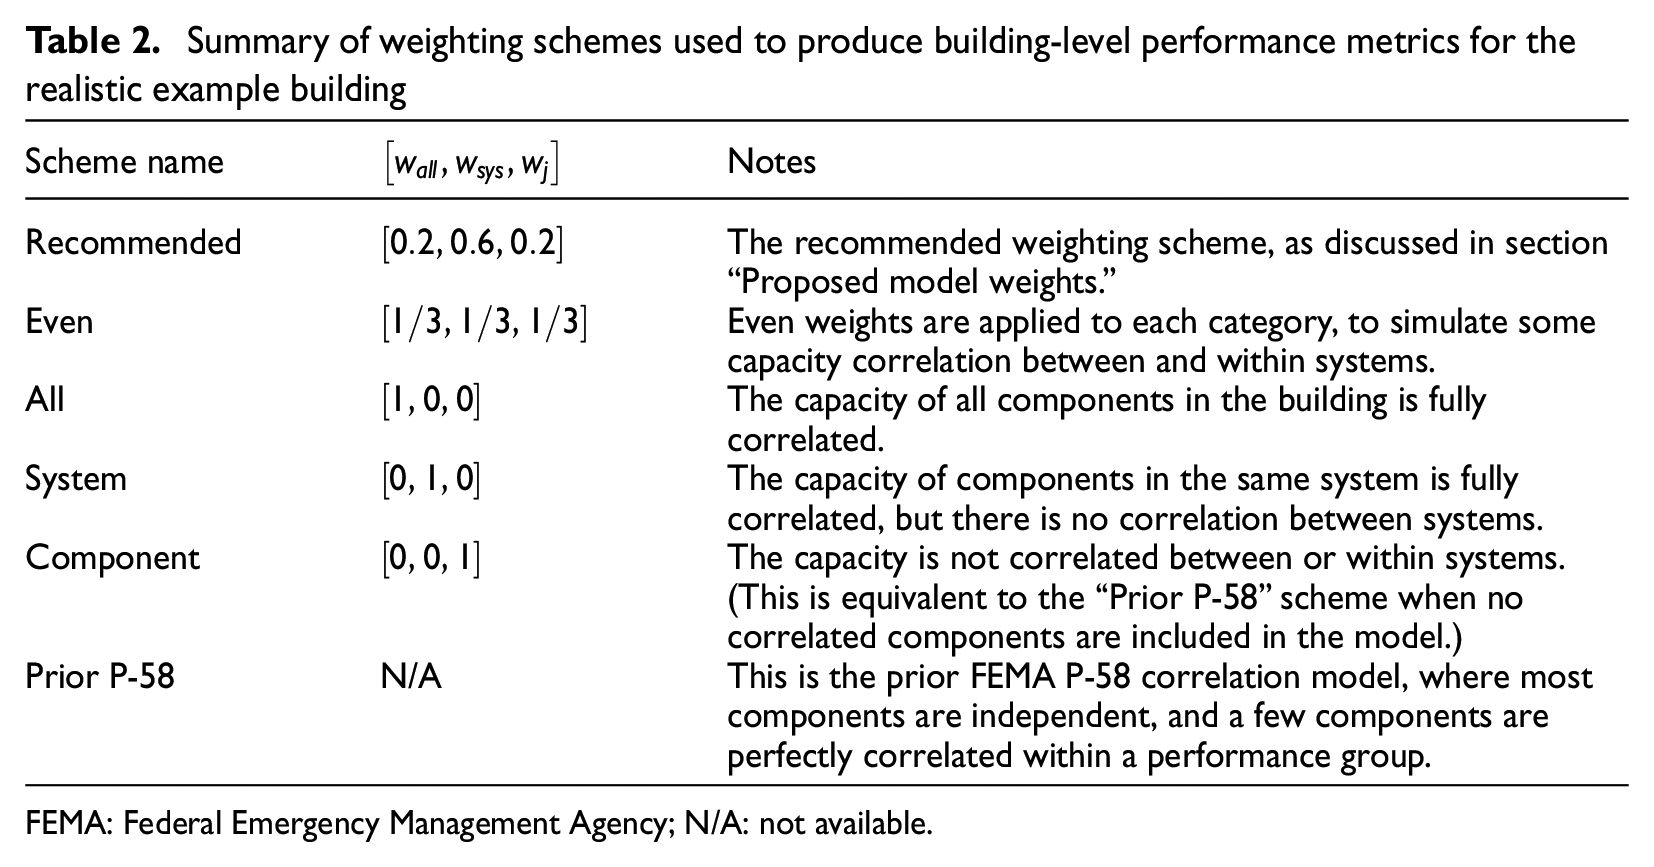
FEMA: Federal Emergency Management Agency; N/A: not available.
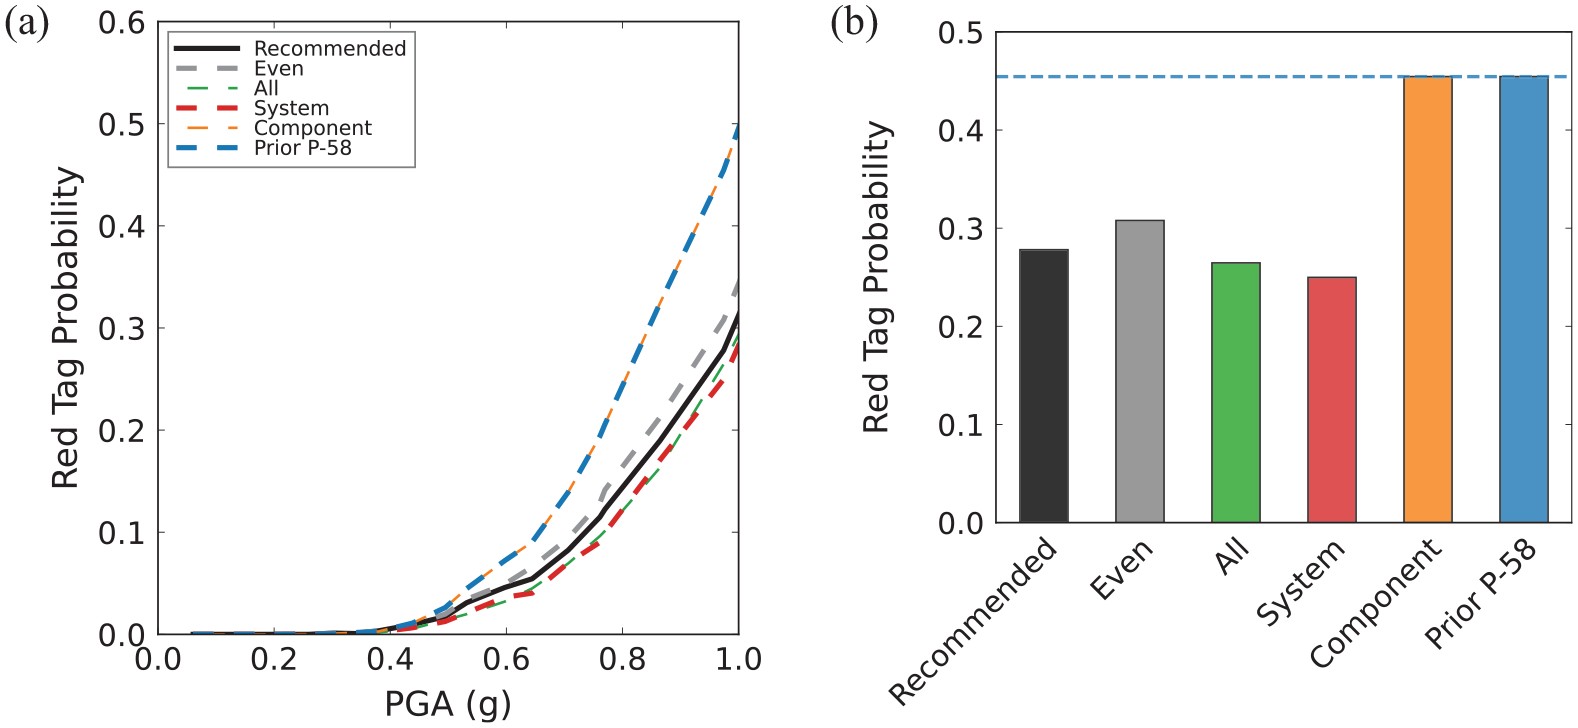
Red-tagging metrics for the 20-story steel perimeter moment frame building for various
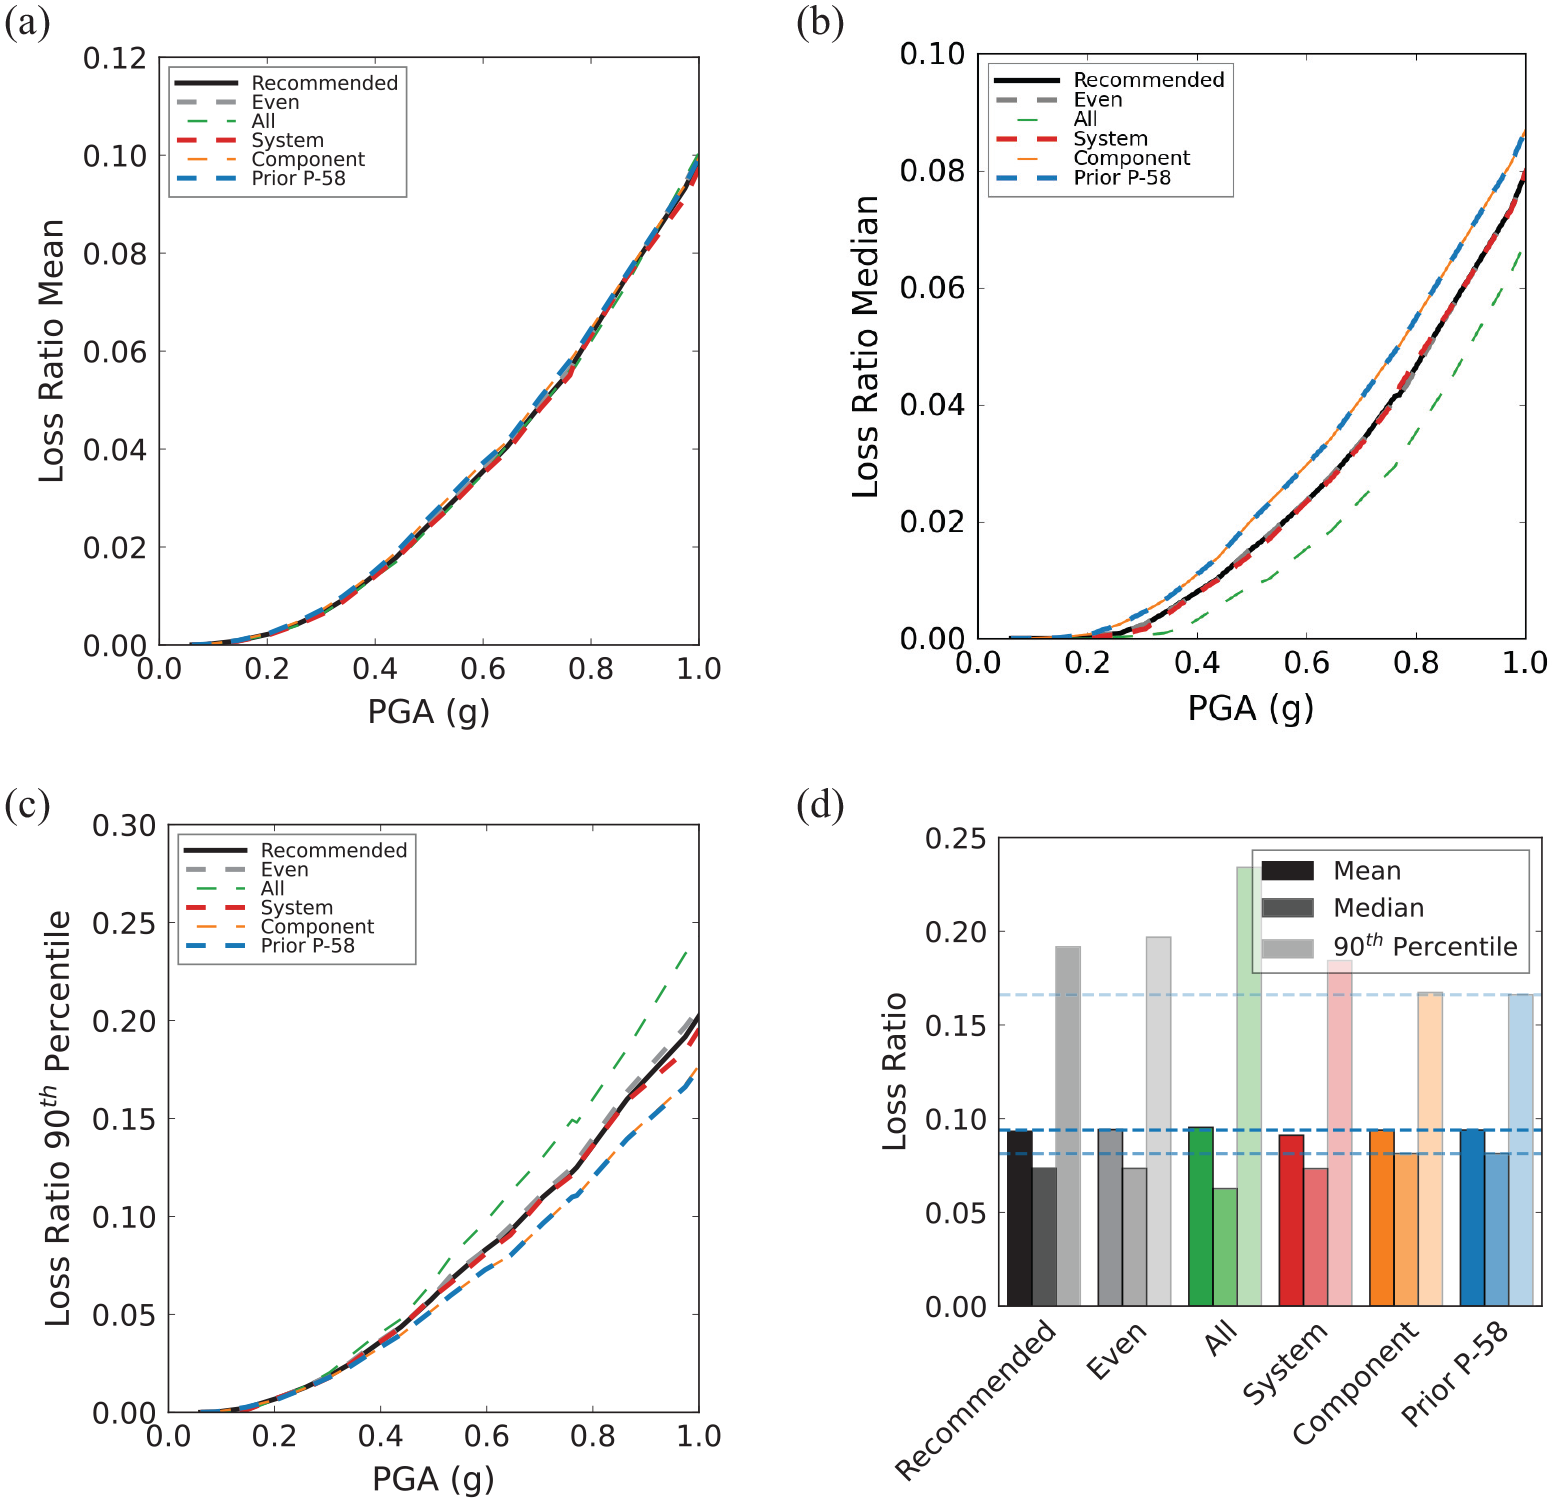
Loss metrics for the 20-story steel perimeter moment frame building for various
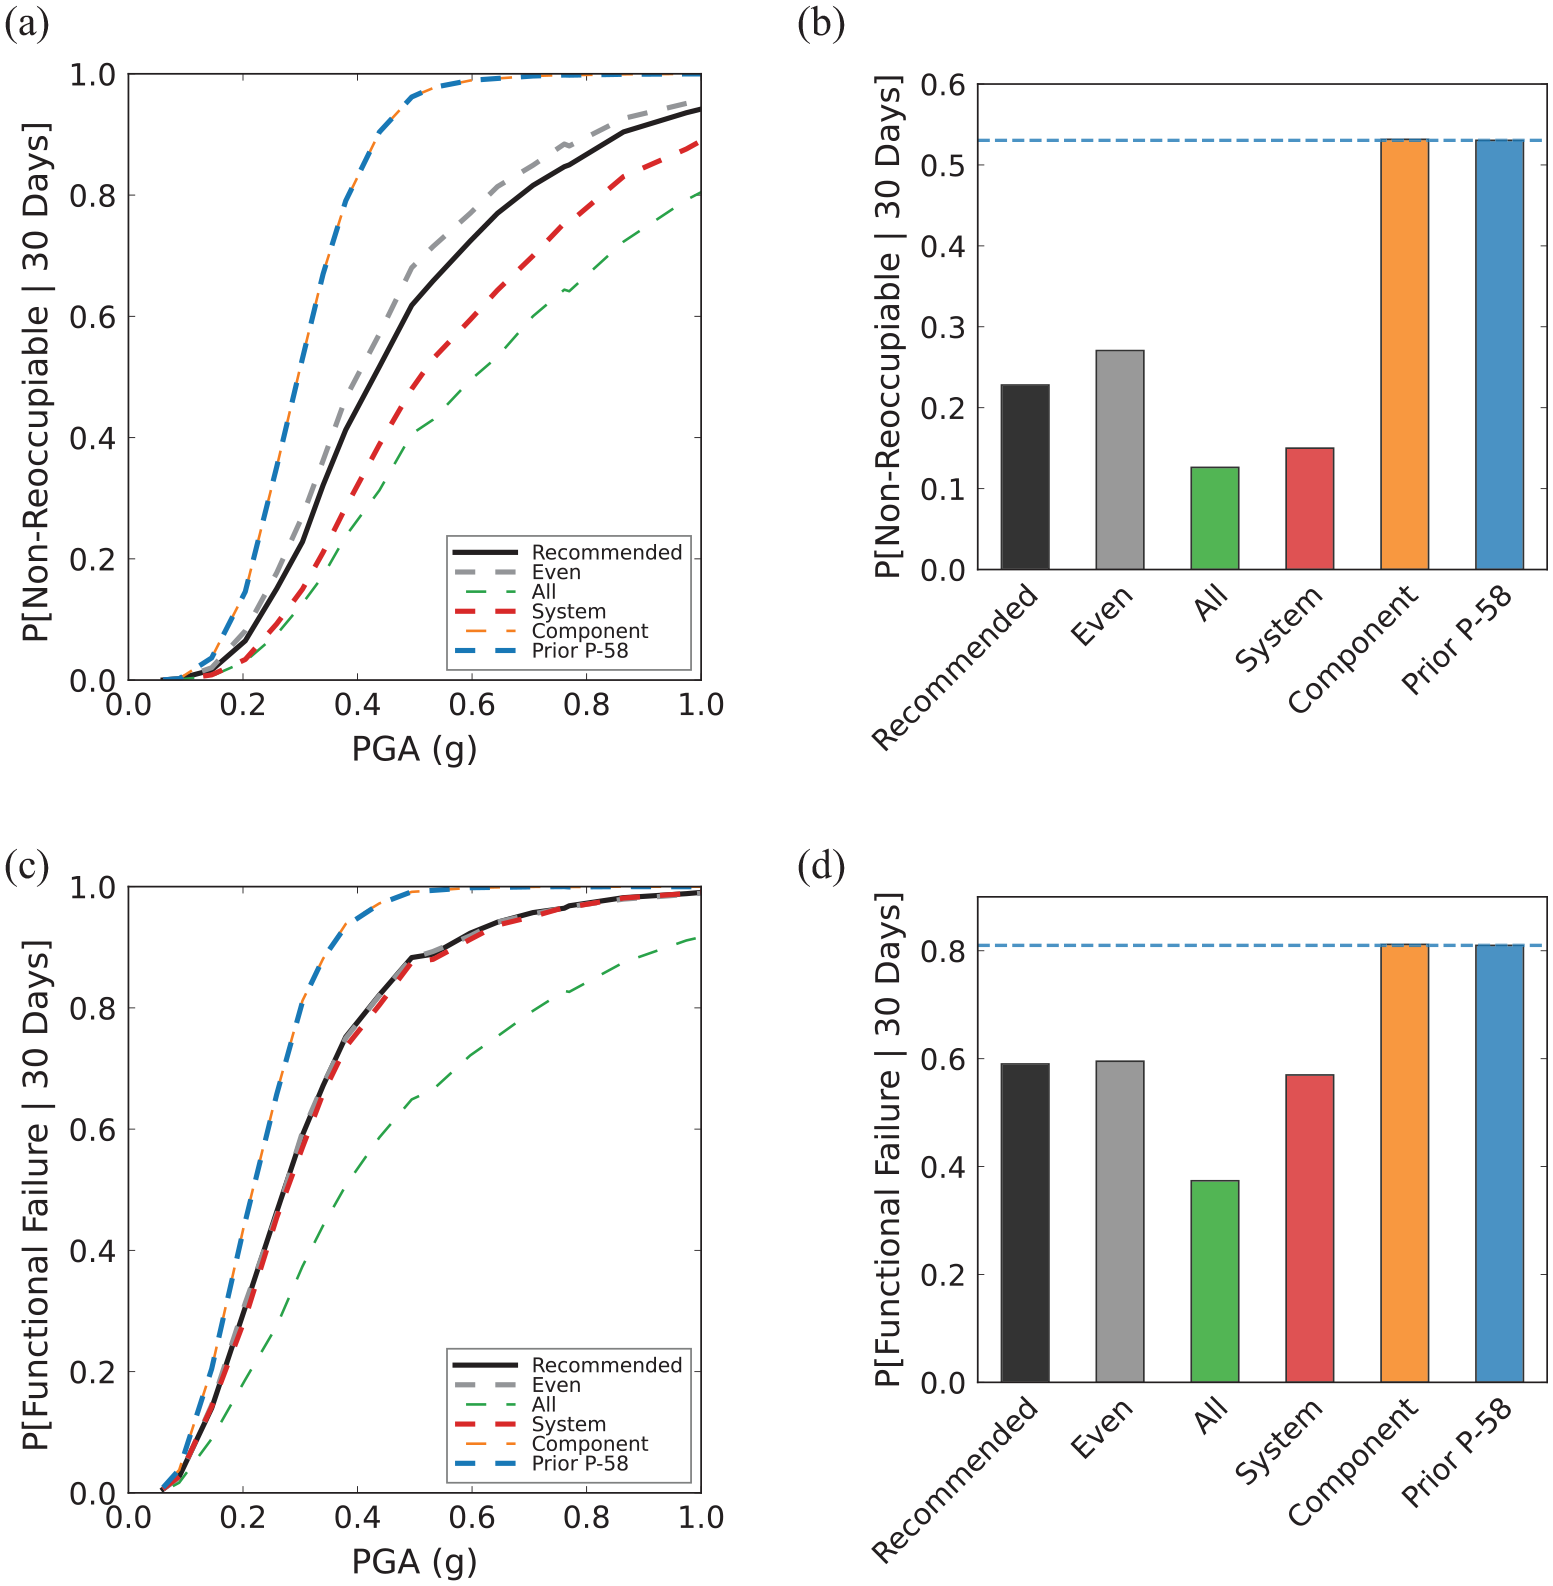
Functional recovery time metrics for the 20-story steel perimeter moment frame building, using the Cook et al. (2022) and various
Figure 5 shows the sensitivity of red-tagging results to various correlation models. In this and the following figures, damage simulations are run conditional on uniform hazard spectra at varying amplitudes. The horizontal axis of Figure 5a plots Peak Ground Acceleration as the intensity measure, for ease of interpretation, although any other spectral ordinate from the uniform hazard spectra could be used instead.
Figure 5 shows that, as expected, the “Prior P-58” and “Component” schemes are identical (because there are no components categorized as “correlated” using the prior P-58 scheme). These fully uncorrelated cases are the upper bound for red-tag probability because the lack of correlation results in more cases where just a few components are damaged, but this still triggers a red-tag, as discussed in section “Simple example.” Conversely, the other extreme is the fully correlated case, “All,” which sees more zero-damage realizations and therefore predicts the lowest red-tag probabilities. The “System” scheme produces equivalent red-tag results to the “All” scheme because the structural system components remain fully correlated, and the other component types do not affect the red-tagging outcome. Between these two extremes are the “Even” and “Recommended” cases, which each put partial weights all of the three weight categories. As discussed in section “Proposed model weights,” there are insufficient empirical data to precisely calibrate these weights, but the reasonable agreement between the “Even” and “Recommended” cases (less than 0.05 difference in probability) indicates the low sensitivity of results to the specific weights considered.
Figure 6 shows the case study building’s mean, median, and
Figure 6b and c shows the median and
Figure 7 shows the effect of correlation models on reoccupancy and functional recovery time calculated using the methodology of Cook et al. (2022). With this methodology, to maintain occupancy, most structural components should be in low-to-moderate damage states such that the building is not tagged as unsafe; cladding, ceilings, and equipment should not pose falling hazards; and stairs should maintain vertical load carrying capacity to support building egress. For building function, critical mechanical, electrical and plumbing (MEP) equipment and distributed components, such as air handling units, potable and sanitary piping, and electrical switchgear, should continue to operate to support basic tenant function. The plots show the probability that the building is not reoccupiable at 30 days (Figure 7a and b) and not functional (Figure 7c and d) 30 days after shaking of the given intensity occurs. The plots demonstrate that the “Prior P-58” and “Component” weighting schemes result in the highest probability of failure of the functional recovery measures due to the lack of correlation, which produces the lowest amount of “no damage” (or acceptably low damage) realizations as discussed in section “Simple example.” Conversely, the “All” variant results in the lowest probability of failure because the correlation between all components is high and results in a larger number of “no damage” (or acceptably low damage) realizations. Here, acceptably low damage implies damage that does not trigger function or reoccupancy problems. In terms of component capacity, the high correlation ensures that the capacities are all relatively low or relatively high in the same realization, so there is less likely to be an outlying “low” capacity component that prevents use of the building. Between these extremes are the other variants “System,”“Even,” and “Recommended.” The “System” variant for reoccupancy is closer to the “All” variant because there are fewer systems that matter for reoccupancy than function, so the correlations across systems have less impact on this metric. The results of this case study demonstrate that a reasonable distribution of weights over the three sources of variability will produce a reasonable result bounded by the fully correlated and fully uncorrelated cases.
Conclusion
This article proposes a practical method for incorporating partial dependencies in component damage outcomes when using Monte Carlo simulation to estimate risk to systems composed of multiple components. The method is flexible in allowing dependencies that vary based on location in the building, component type, and other factors. For individual components, the probabilities of damage obtained with this method are identical to prior approaches. For multiple components, this approach can reproduce traditional approaches if desired, but can be generalized to more plausible formulations that allow partial dependencies. Example results illustrate the impact of component capacity correlations on loss results.
The proposed method requires the specification of numerical correlation values. While direct empirical data to constrain dependencies remain elusive, the formulation does provide a conceptually appealing parameterization of the problem. That is, the analyst must specify how much of the variance in outcomes results from various sources (as opposed to specifying less-intuitive metrics of dependence). A parameterization for use in FEMA P-58 analysis is proposed that improves the realism of loss simulations relative to the prior approach.
While a parameterization has been proposed here based on current judgment, further study of damage data offers the opportunity to refine the parameterization. One data analysis approach that would be informative would be to perform component damage tests that hold some conditions fixed (e.g. construction method) and vary another (e.g. loading protocol), in order to quantify how much component capacity variability comes from each source of uncertainty. Another approach would be to use random effects models to study data sets like that in Figure 1 and attribute observed variability to the tests’ varying component configurations, loading conditions, and other factors. From a modeling perspective, some components’ damage could be studied using high-fidelity numerical models (e.g. for steel connection fractures) and varying component and material characteristics, as well as loading time series.
The method was presented with a focus on the FEMA P-58 assessment methodology, but it is relevant to other assessment situations that consider multiple components and fragility functions. Only the grouping of elements and correlation structure would need to be revisited to apply the method in other contexts focused on components with lognormal fragility functions, given the widespread use of this formulation. However, the method could be applied in other situations with other distribution types, as long as the capacity distribution for the component can be decomposed into shared and independent contributions to capacity.
Supplemental Material
sj-pdf-1-eqs-10.1177_87552930231205790 – Supplemental material for A model for partially dependent component damage fragilities in seismic risk analysis
Supplemental material, sj-pdf-1-eqs-10.1177_87552930231205790 for A model for partially dependent component damage fragilities in seismic risk analysis by Jack W Baker, Ed Almeter, Dustin Cook, Abbie B Liel and Curt Haselton in Earthquake Spectra
Footnotes
Acknowledgements
The authors acknowledge valuable feedback from the ATC-138 Project Technical Committee, including Greg Deierlein, Bob Hanson, Ron Hamburger, Jon Heintz, John Hooper, Ryan Kersting, and David Mar. Certain commercial software may have been used in the preparation of information contributing to this paper. Identification in this paper is not intended to imply recommendation or endorsement by National Institute of Standards and Technology (NIST) or Federal Emergency Management Agency (FEMA) nor is it intended to imply that such software is necessarily the best available for the purpose.
Declaration of conflicting interests
The author(s) declared no potential conflicts of interest with respect to the research, authorship, and/or publication of this article.
Funding
The author(s) disclosed receipt of the following financial support for the research, authorship, and/or publication of this article: This work was supported in part by the Applied Technology Council, under project ATC-138, funded by FEMA.
Code and data availability
Supplemental material
Supplemental material for this article is available online.
References
Supplementary Material
Please find the following supplemental material available below.
For Open Access articles published under a Creative Commons License, all supplemental material carries the same license as the article it is associated with.
For non-Open Access articles published, all supplemental material carries a non-exclusive license, and permission requests for re-use of supplemental material or any part of supplemental material shall be sent directly to the copyright owner as specified in the copyright notice associated with the article.