
Abstract
Balloon-type cross-laminated timber coupled-wall (CLT-CW) structure is an emerging and sustainable option for constructing tall timber buildings. The structure features buckling restrained brace (BRB) hold-downs, balloon-type CLT walls, and coupling beams with replaceable shear links. This study investigates the probabilistic seismic performance (including economic loss, downtime, and resilience index) of a 20-story CLT-CW building. A three-dimensional (3D) structural model is developed to perform incremental dynamic analysis using 30 pairs of ground motion records that represent the seismicity of Vancouver, Canada. Intensity- and time-based loss assessments are conducted to estimate probability distributions of seismic losses according to the FEMA P-58 methodology. Post-earthquake recovery trajectories of the housing function are also presented to calculate the seismic resilience indices under different intensities. The results reveal that the coupling beams contribute the most to repair cost among all structural components. In light of the replaceability and energy dissipating role of coupling beams, the efficiency and resiliency of the CLT-CW building are validated.
Keywords
Introduction
With increase in greenhouse gas emissions, global resource consumption and energy use, there is a demand for cost-effective and sustainable construction materials (Harte, 2017; Svatoš-Ražnjević et al., 2022). In the move toward sustainable construction, timber and timber-based products are becoming viable solutions (Harte, 2017; Milaj et al., 2017). Recent technical advancements in engineered timber products (e.g. glue-laminated timber (GLT), cross-laminated timber (CLT), nail-laminated timber) enabled timber-based construction to be the primary building material in low- to mid-rise residential buildings (Karacabeyli and Gagnon, 2019; Svatoš-Ražnjević et al., 2022). The 2020 National Building Code of Canada (NBC, 2020) and the 2021 International Building Code (Breneman and Richardson, 2019) have increased the mass-timber building heights to 12 and 18 stories, respectively. Tesfamariam et al. (2021a), and Teweldebrhan and Tesfamariam (2022) have recently proposed and designed novel 20-story CLT coupled-wall (CLT-CW) building system. With increase in building height, the need to assess the continuous operation of the system and reduce economic losses under strong earthquake ground shaking becomes a critical design consideration (Di Cesare et al., 2020; Tesfamariam, 2022; Wilson et al., 2021). Thus, in this article, the seismic loss (in terms of monetary repair cost and downtime) and resilience (i.e. the capacity of function recovery in post-event phase) of the 20-story CLT-CW building system reported in literature (Tesfamariam et al., 2021a; Teweldebrhan and Tesfamariam, 2022) are computed. Performance- and resilience-based seismic designs are two philosophies that appropriately address this need.
Prescriptive seismic design aims at preventing collapse and loss of life, but is insufficient to realize a resilient community (Bruneau and MacRae, 2017). After 2011 Christchurch earthquake, for example, a number of buildings in Central Business District area were demolished due to high repair costs although most did not collapse. On the contrary, performance-based earthquake engineering (PBEE) framework emphasizes the importance of loss assessment, which provides results more understandable to clients and stakeholders (Gunay and Mosalam, 2013; Mitrani-Reiser, 2007; Moehle and Deierlein, 2004). Accordingly, based on the early research by the Pacific Earthquake Engineering Research (PEER) Center, a comprehensive state-of-the-art methodology has been formulated to assess the economic losses, downtime, and casualties due to earthquake damage of buildings (FEMA 2006, 2018). Correlated engineering demand parameters (EDPs) can be simulated by assuming multivariate lognormal distribution, and based on the component fragility database, damage states and other consequences of structural and nonstructural components can be derived. The resilience-based evaluation and design is gaining traction in the field of earthquake engineering (Bruneau et al., 2003; Cimellaro et al., 2010). The seismic resilience of a building is its ability to absorb earthquake effects and restore its function (e.g. housing, healthcare, business) to the pre-earthquake normal state. It provides a quantitative measure that considers not only the initial losses right after earthquakes but also the post-earthquake function recovery process. Some research explored the ways of incorporating PBEE into the framework of resilience assessment (Almufti and Willford, 2013; Burton et al., 2016, 2018; Cook et al., 2022; Mieler et al., 2015).
With the increase in popularity of timber-based construction, limited studies are reported on seismic loss and resilience of mass timber buildings. Using the FEMA P-58 methodology, Guan et al. (2018) evaluated the earthquake-induced economic losses of six-story self-centering and welded moment-resisting frames. Pei et al. (2017, 2018, 2019) presented development and validation of a seismic design philosophy for resilient tall wood buildings. Wilson et al. (2021) implemented the loss assessment for two (5- and 12-story) prototype post-tensioned CLT buildings using the FEMA P-58 procedure. Integrating the FEMA P-58 methodology and REDi™ rating system, Furley et al. (2021) assessed the downtime of a two-story mass timber building. Medel-Vera and Contreras (2021) proposed a seismic resilience-based model to predict economic and environmental losses, and used the tool to assess a six-story CLT building equipped with base isolation devices.
Using the FEMA P-58 procedure, this study presents intensity- and time-based loss assessments to estimate seismic loss and resilience of a 20-story CLT-CW system reported in literature (Tesfamariam et al., 2021a; Teweldebrhan and Tesfamariam, 2022). The system examined in this article was designed considering a coupling ratio (CR) of 30% and seismic modification factor (
Building model and design details
Building model
Layouts of the CLT-CW building are shown in Figure 1. The structural model comprises glulam beams and columns, CLT floor panels, CLT core shear walls, BRB hold-downs, and steel coupling beams with replaceable shear links. Timber species Spruce–Pine–Fir and Douglas–Fir–Larch are used for the CLT (wall and floor) panels and glulam frame elements, respectively. The glulam beams and columns are designed to support the vertical gravity load of the system, while the balloon CLT shear walls and coupling beams resist the lateral loads. The balloon shear-wall system, which consists of continuous walls over the entire height of the building with the intermediate floor panels framed to the walls at each floor, is chosen over the platform-type construction to prevent the buildup of compression on the floor panels (Chen and Popovski, 2020; Shahnewaz et al., 2021). In the proposed system, the CLT floor panels are supported by the glulam frame elements (beams and columns) and, when applicable, by the CLT shear walls (Structurlam, 2021). The height of the first story is 3.2 m, while the height of the rest stories is 2.96 m. The maximum spans between the gravity columns are 7.315 and 7.204 m in the X- and Y-directions, respectively. The complete architectural drawing of the system with all the dimensions is provided in the study by Tesfamariam et al. (2021a). The apartment building is designed considering four load cases: dead load (D), live load due to use and occupancy (L), load due to snow and rain (S), and earthquake load (E). The maximum load obtained from the combination of the above-mentioned load cases was used to design the members. As per the NBC (2020), the building is designed with an L = 2.4 kPa and a superimposed load = 2.8 kPa to account for the weight of floor finishes and partition load. The prototype building is located in Vancouver—British Columbia (BC), and the corresponding snow and seismic loads are determined based on the provisions of NBC (2020). The CLT floor panels are designed as a one-way slab using a five-ply CLT Grade E1 per ANSI/APA PRG 320 (2012) and CSA 086-19 (2019). The force parameters for the gravity load design of the GLT columns, beams, and CLT wall piers are then extracted from ETABS analysis of the structure and are designed following the CSA 086-19 (2019) standard. The reason why the grade E1 CLT panels are chosen is because the spacing between the columns and the column to the shear walls is large, and there is a high flexural demand in the floor panel.
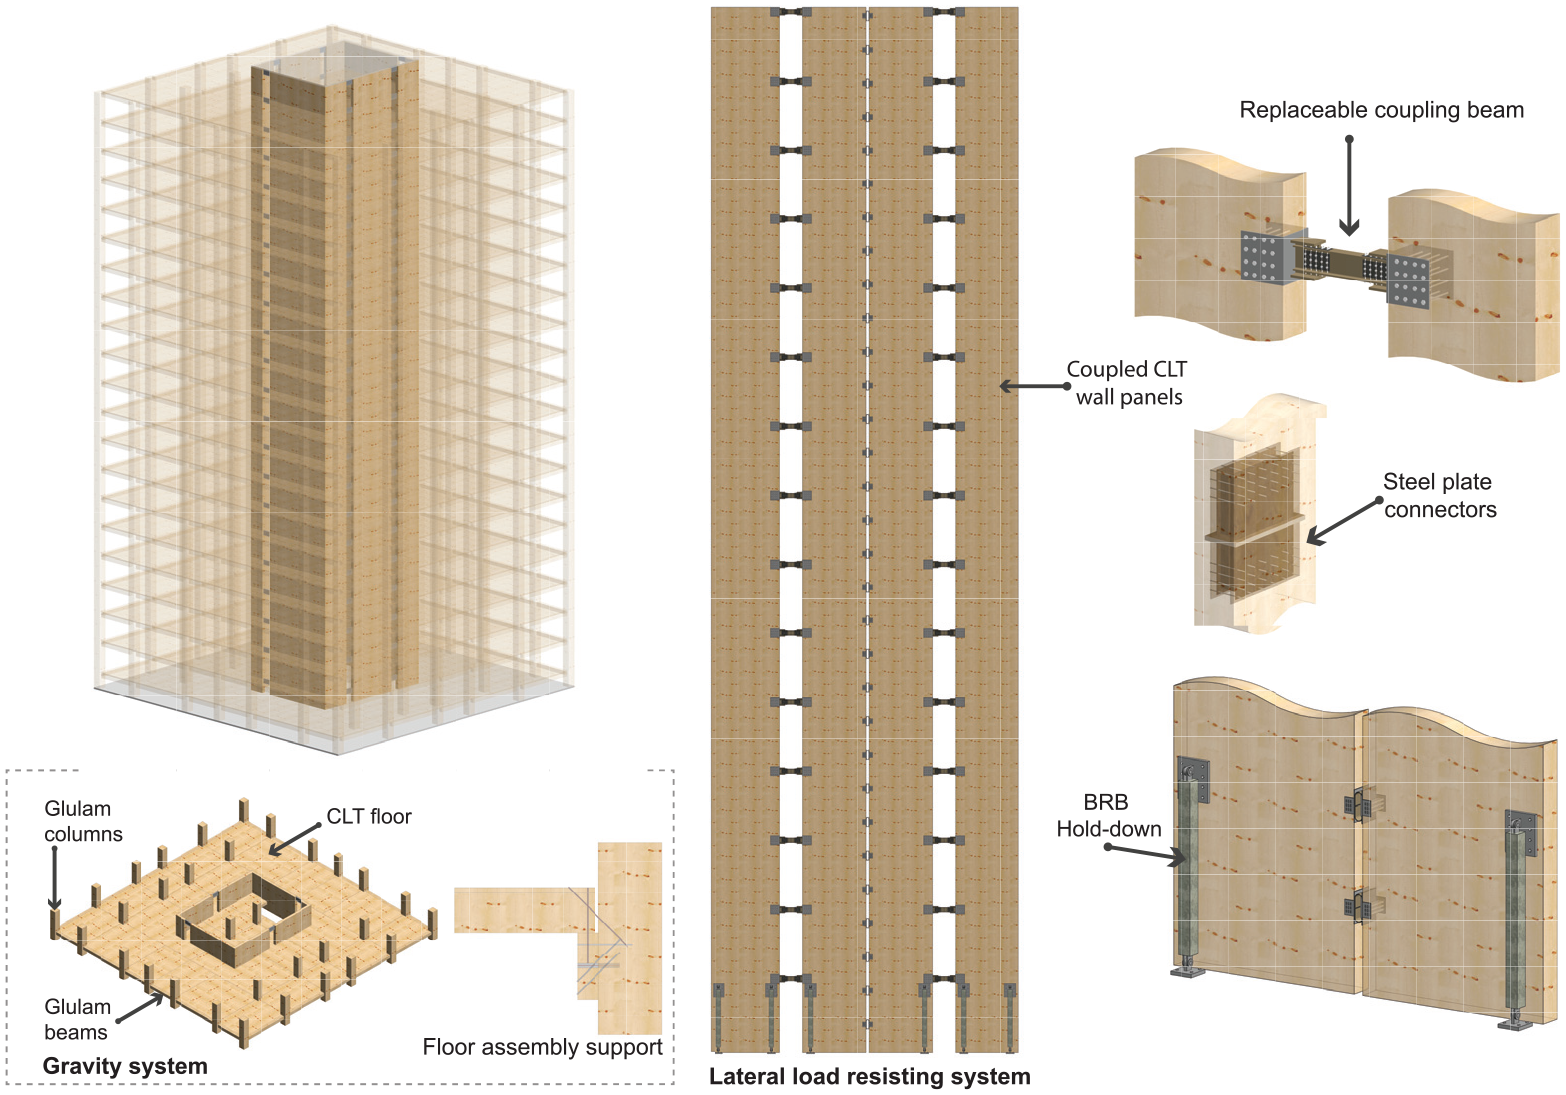
3D view and structural components of the prototype model.
Seismic design
The seismic design of the CLT-CW system is carried out using continuous medium method (CMM; Smith and Coull, 1991). The method is a simplified elastic method that can be used to analyze and design the preliminary geometries of CW systems for a uniform or quasi-uniform structure. The design, using the simplified method, provides a good approximation for preliminary designs of regular CW systems and should be accompanied by a more accurate nonlinear analysis method to evaluate the system’s performance. Accordingly, in this article, the CMM and FEM are used to design the parameters of the lateral load resisting system and to study the nonlinear responses of the structure under the action of different GM records, respectively. The summary designed cross-section of the different structural components of the proposed system is summarized in Table 1. The complete design procedure for a two-wall system, along with a numerical example, is provided in the studies by Tesfamariam et al. (2021a), and Teweldebrhan and Tesfamariam (2022).
Designed section details
CLT: cross-laminated timber; W: wall.
Numerical model and GM selection
Numerical model
A finite element (FE) model for a 3D CLT-CW building was developed using Open System for Earthquake Engineering Simulation (OpenSees; McKenna et al., 2000). The model is formed by assembling the model components: CLT shear-wall elements, GLT frame elements, hold-downs, and coupling beams. All the timber elements are modeled as elastic. The connections between the CLT to coupling beams and CLT to hold-downs are modeled as rigid connections. The CLT wall panel possesses high elastic stiffness, and it essentially behaves as a rigid body during in-plane response. Consequently, the CLT wall panels are modeled as elastic using ElasticIsotropic material and quad elements (Demirci et al., 2018). GLT frame elements (beams and columns) are modeled using the OpenSees elasticBeamColumn element feature. The two ends and central “fuse” of the coupling beams are modeled using OpenSees elasticBeamColumn elements as rigid offsets and Steel01 UniaxialMaterial with zeroLength nonlinear vertical springs, respectively. To satisfy the high axial demand, BRB hold-down (Tesfamariam et al., 2021b) is modeled using OpenSees Steel01 uniaxialMaterial. The contact between the CLT wall and the base is modeled using OpenSees uniaxial elastic notension (ENT) material. A large elastic stiffness value is assigned to the ENT spring under compression. However, fracture or deterioration of hold-downs or coupling beams is not explicitly modeled. Damage levels of these components are determined from peak axial strain and peak link rotation angles. The CLT floor panels are assumed as rigid diaphragms and simplified OpenSees’ multi-point constraints feature is used to capture the desired behavior without compromising the actual phenomenon (Fairhurst et al., 2014). The detail modeling and modeling parameter values can be obtained in the study by Tesfamariam et al. (2021a).
GM selection
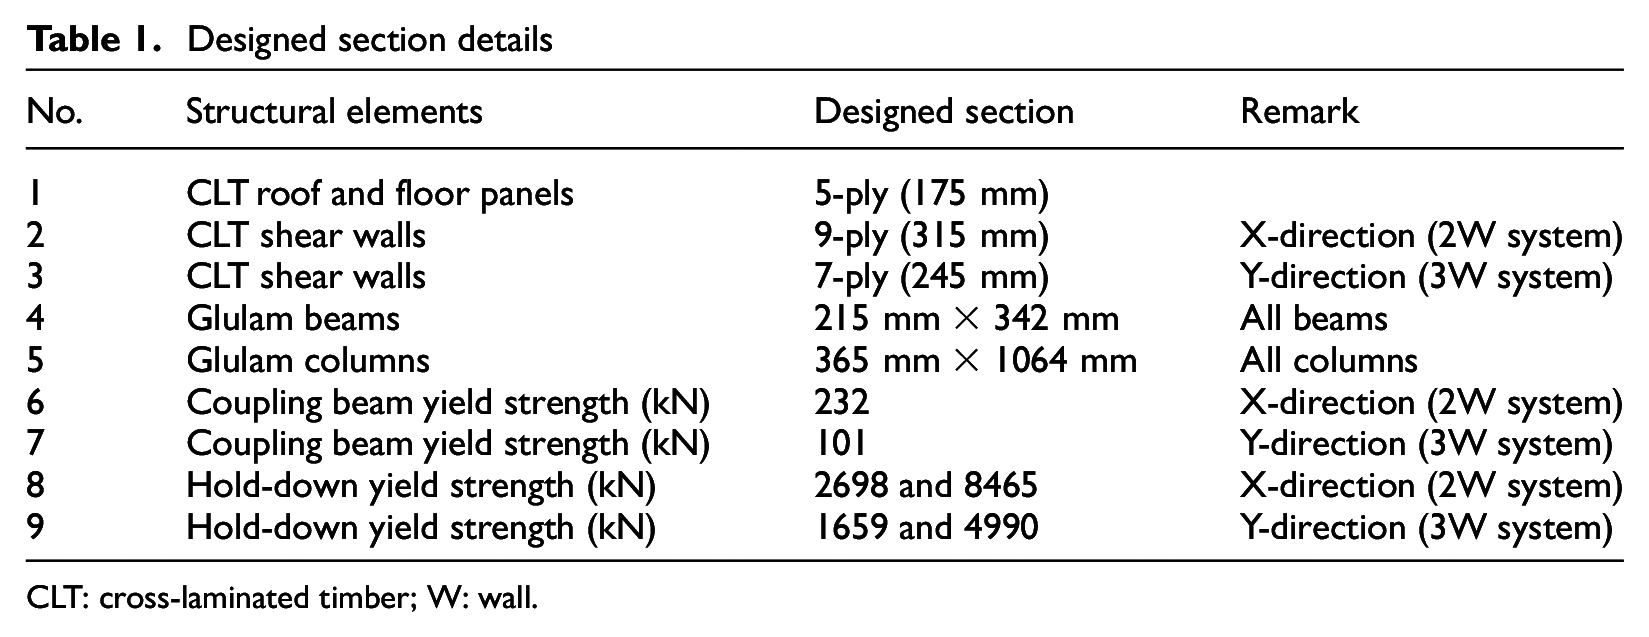
The building was design for the seismicity of Vancouver, BC—Canada. GM records are selected by matching the response spectra of the selected records to a target response spectrum of Vancouver with a return period of 2475 years. In this study, conditional mean spectrum (CMS) is used to define the target response spectrum (Baker, 2011). Three major seismic sources (crustal, inslab, and interface) contribute most significantly to the overall seismic hazard of Vancouver (Goda and Atkinson, 2011; Halchuk et al., 2016). Accordingly, multiple-CMS-based record selection method is used to select a suite of GM records that possess key features (e.g. magnitude, frequency content, and duration) of the considered seismic sources (Goda and Atkinson, 2011). The number of GM records selected from each source reflects the proportion of their seismic hazard contribution. Same selection method has been successfully implemented to develop the seismic fragility curves of different limit states for buildings (Tesfamariam et al., 2021b; Tesfamariam and Goda 2015, 2022). Their analyses were based on a two-dimensional FE model, while a 3D model is developed in this study for the proposed system. As a result, the coupled GM selected were used for bi-directional input. As part of the GM selection process, it is important to determine the first three fundamental periods of a structure. In this study, an eigen analysis was performed and the first three fundamental periods of the building were found to be 2.87, 1.52, and 0.57 s. Hence, a set of 30 GM records (bi-directional) were selected based on regional seismic hazard characteristics at the anchor period of
Spectral acceleration (in g) at 3.0 s. for Vancouver, BC—Canada.
Performance assessment
Time history responses
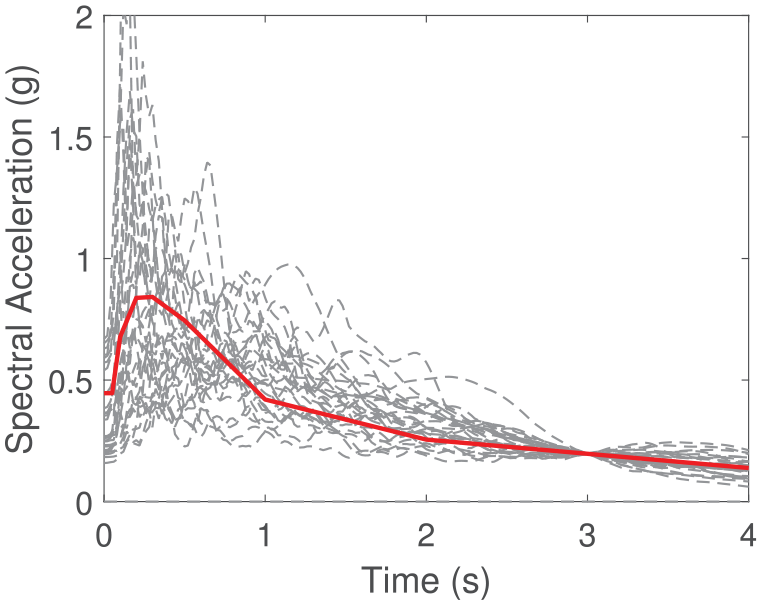
The nonlinear time history analysis (NLTHA) at the 2475-year return period intensity is used to assess the nonlinear response of the systems under the action of seismic excitation. It is found that the CLT-CW system exhibits higher responses (e.g. inter-story drifts, floor accelerations, and shear forces of coupling beams) in the weakest (X) direction, and the results for this direction are discussed below. Figure 3 illustrates the inter-story drift ratio (ISDR), floor acceleration time series, and coupling beam response for GM (#30) in the X-direction. For the examined system, there are a total of 40 coupling beams (2 coupling beams at each story level) in the X-direction (two-wall system) and 80 coupling beams (4 coupling beams at each story level) in the Y-direction (three-wall system). Accordingly, the shear force demand of coupling beams in the X-direction is higher than the coupling beams in the Y-direction. As a result, the coupling beams in the X-direction have a higher strength and lower response in contrast to those in the Y-direction that have lower strength and higher responses. In both directions, uniform coupling beam capacity is provided throughout the height of the building (Figure 3c) and thus, coupling beams at higher stories experience a higher drift demand (due to cantilever action of the wall) and exhibit higher hysteresis responses than those in the lower stories. Moreover, Figures 4 and 5 show the response of the BRB hold-downs, provided at the base of the CLT shear walls, in the X- and Y-directions at selected GM records. In Figure 4,
Time-history responses: (a) ISDR, (b) floor acceleration, and (c) coupling beam response for GM #30 along the X-direction.
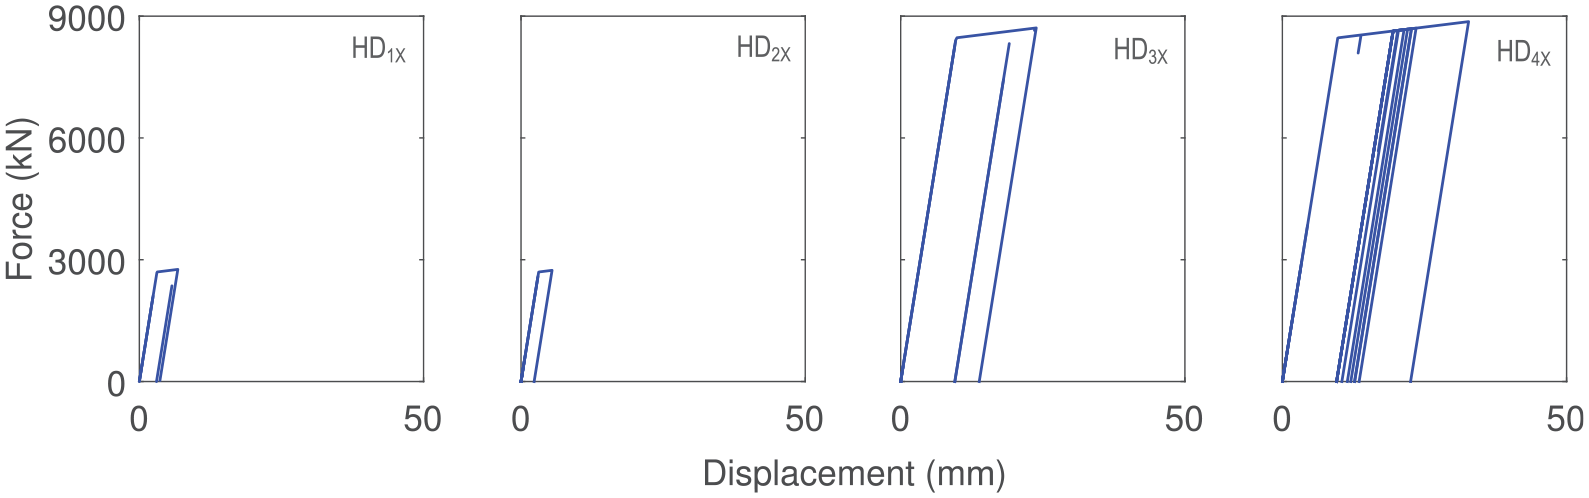
Hold-down response for GM #30 along the X-direction.
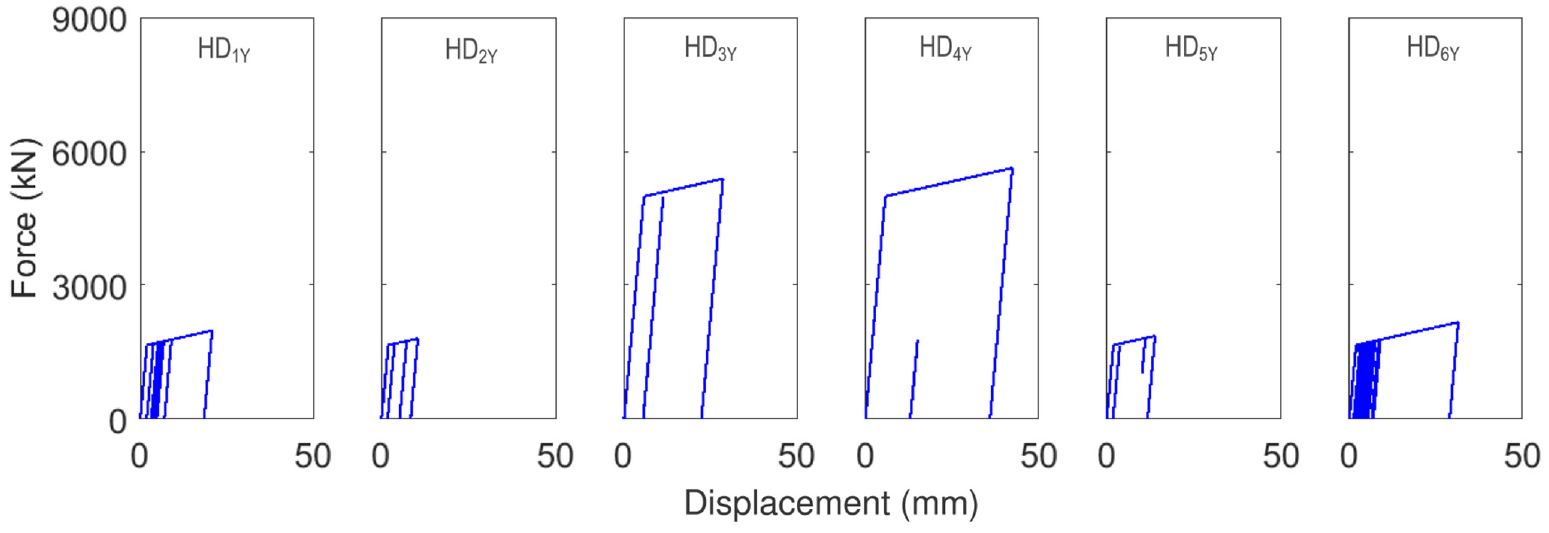
Hold-down response for GM #30 along the Y-direction.
Incremental dynamic analysis
IDA is performed to examine the performance of the CLT-CW system under the action of different seismic hazard levels. The GM records are scaled up until a spectral acceleration value that triggered the collapse of the system (MaxISDR = 5%). The typical IDA curves for the CLT-CW system (in the X- and Y-directions) are shown in Figure 6a and b, respectively. The horizontal and vertical axes represent the MaxISDR and 5% spectral acceleration at the fundamental period of the system (
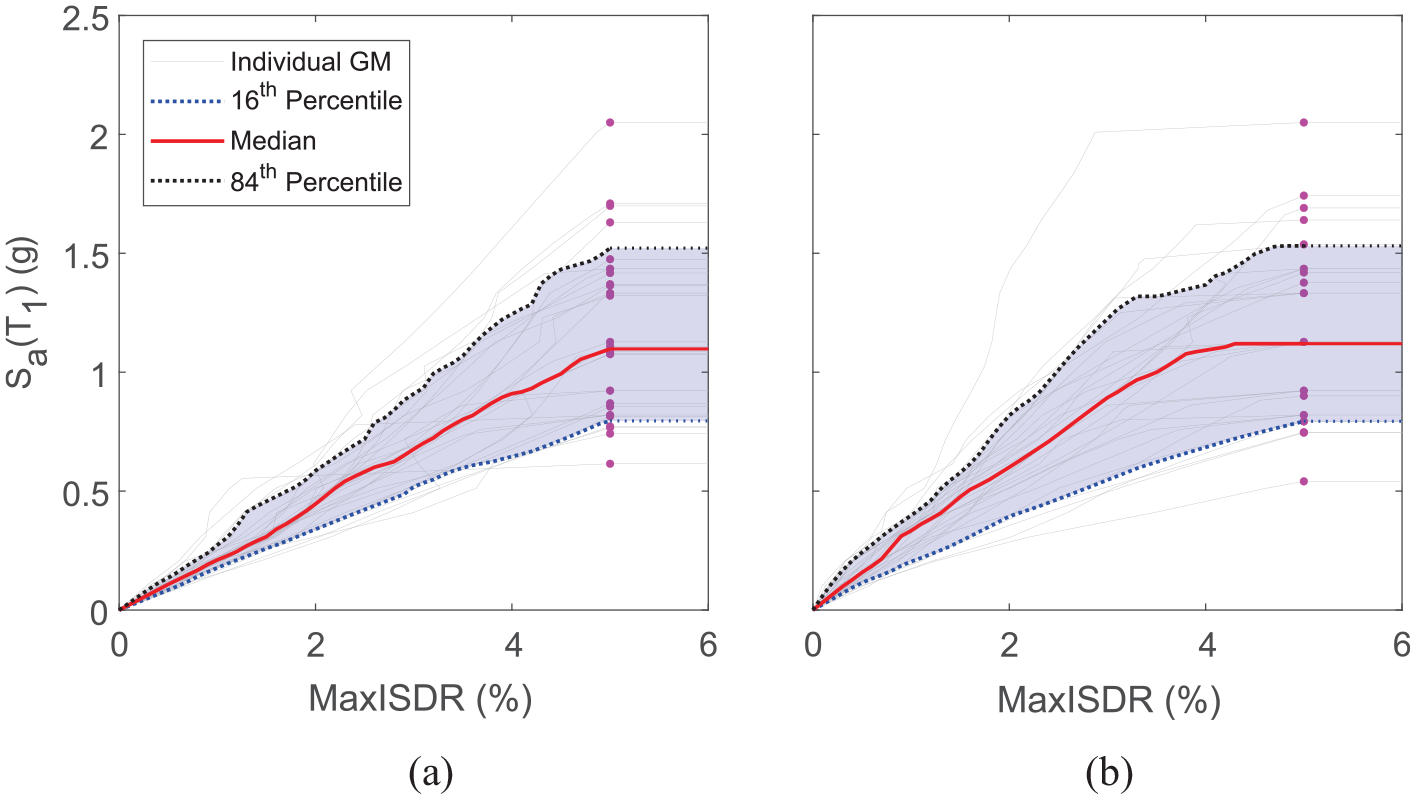
IDA curves along (a) X- and (b) Y-directions.
Seismic loss assessment
Methodology of probabilistic seismic loss assessment
The methodology in FEMA P-58 (2018) is applied to perform probabilistic seismic loss assessment of the CLT-CW building. Intensity- and time-based loss assessments are conducted in turn. An intensity-based assessment is to estimate the probability distribution of seismic losses under a certain seismic intensity. In a time-based assessment, losses from different intensities are combined into MALs based on their probability of occurrence. The spectral acceleration at the building fundamental period is selected as the intensity measure herein. The examined target intensities range from 0.05 to 0.6g, to consider the seismic losses incurred by different levels of intensities.
An intensity-based assessment consists of five steps, as shown in Figure 7. (1) A set of GM records (the same 30 records as in the previous section) are scaled to the target spectral acceleration to perform dynamic analyses, and EDPs, such as ISDR, peak floor acceleration (PFA), peak floor velocity (PFV), and residual ISDR (RISDR), are obtained. (2) Assuming that the obtained EDPs are multivariate lognormal (Yang et al., 2009), a large number of additional EDPs are generated. Each realization of EDPs is a single Monte-Carlo simulation. (3) The damage states of structural and nonstructural components are estimated based on the simulated EDPs. (4) The seismic losses, including repair cost and repair time, of each component are determined based on its damage state and the FEMA P-58 database of componential seismic losses. (5) Component-level seismic losses are integrated into the seismic losses of the entire building.
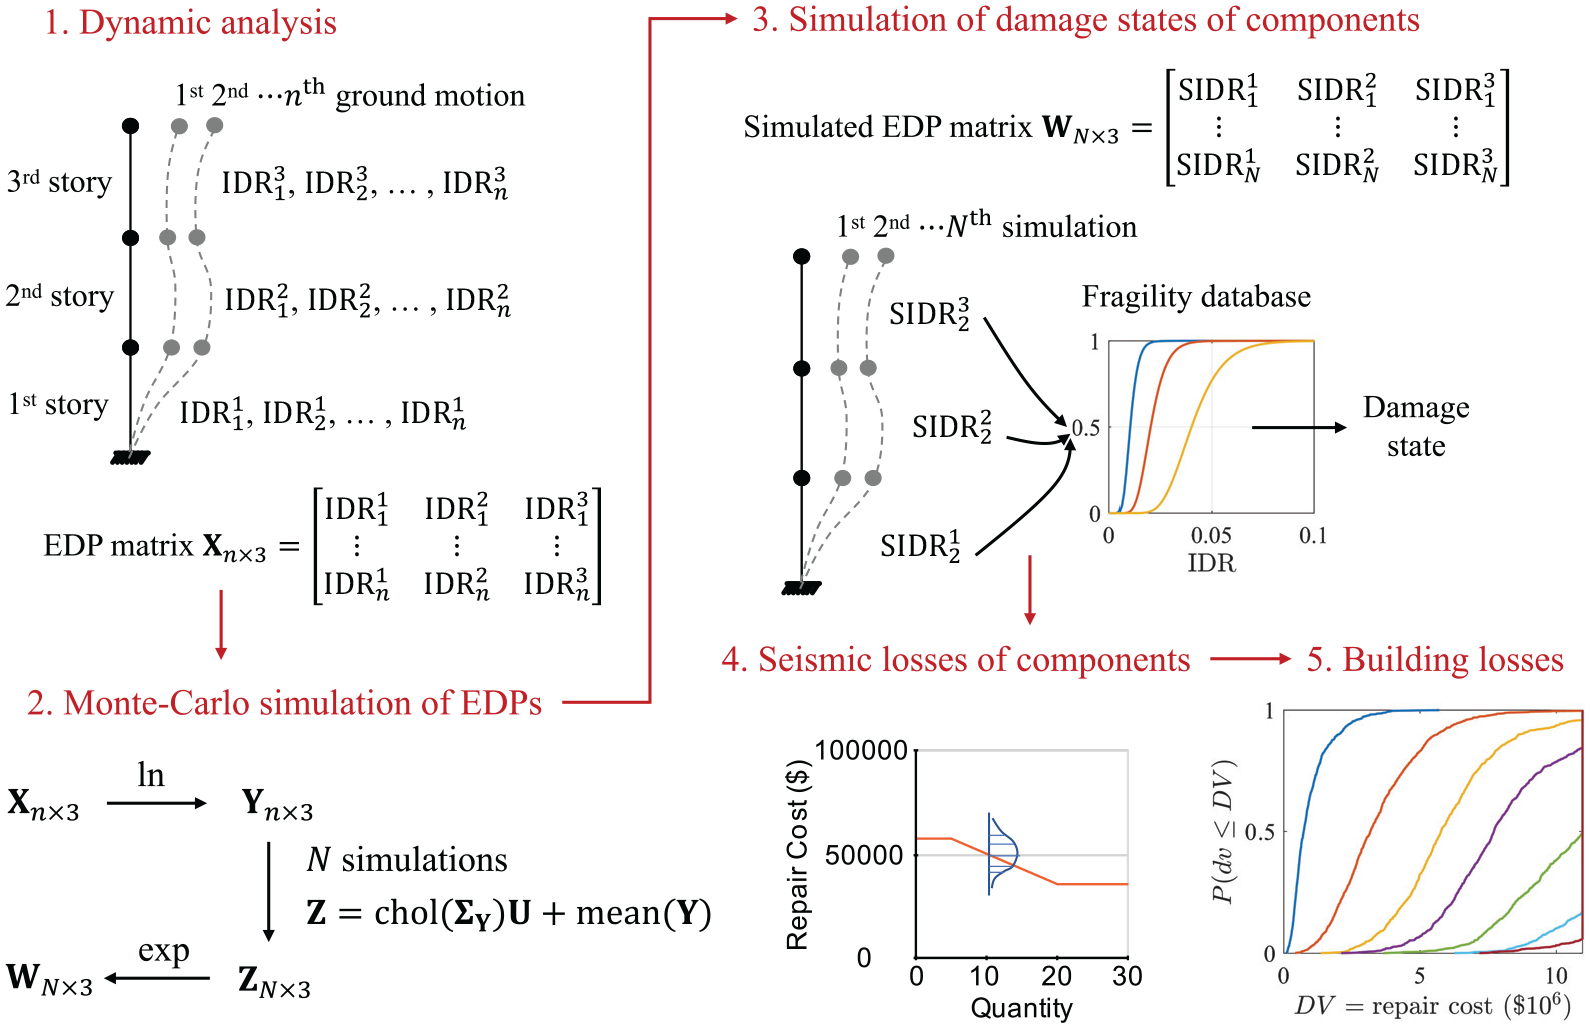
Flowchart of performing intensity-based loss assessment (adapted from FEMA P-58).
A time-based loss assessment combines the intensity-based results and the SHC of the building, that is, mean annual frequency of exceedance (MAFE) of intensities. A series of seismic intensities, ranging from minor to major earthquakes, are considered. The seismic losses from different intensities are weighted by their probabilities of occurrence to calculate the MALs of the building.
Structural components
Structural components vulnerable to earthquakes include BRB hold-downs, balloon-type CLT shear walls, and replaceable steel coupling beams. The fragility curves of these structural components are either available in FEMA P-58 database or derived from previous experiments in the literature (Ji et al., 2017, 2018; Shahnewaz et al., 2021).
All BRB hold-downs are located on the first floor. There are 8 BRB hold-downs in the X-direction and 12 in the Y-direction. Maximum axial strain is the EDP that determines the damage states of hold-downs. Fragility curves of BRB hold-downs are derived from those curves of commonly used BRB in FEMA P-58 database. The median ISDR of BRB corresponding to DS1 is 2% in FEMA P-58 (FEMA, 2018). Note that the commonly used BRBs are diagonal braces, but the BRB hold-downs are in vertical position. Assuming the angle between a common BRB and a horizontal line is equal to 45°, it can be derived that the ratio of ISDR to axial strain of a diagonal BRB is 1 to 2. This geometric relationship between ISDR and BRB axial strain is illustrated in Figure 8, assuming that deformations are infinitesimal and the axial strain of beams and columns are negligible. ISDR equals
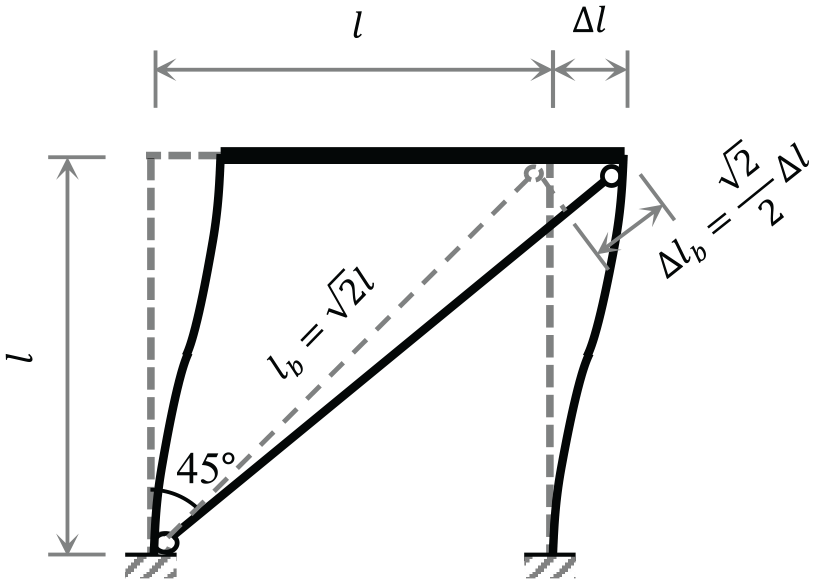
Geometric relationship between inter-story drift ratio and axial strain of a diagonal brace.
Fragility of BRB hold-down
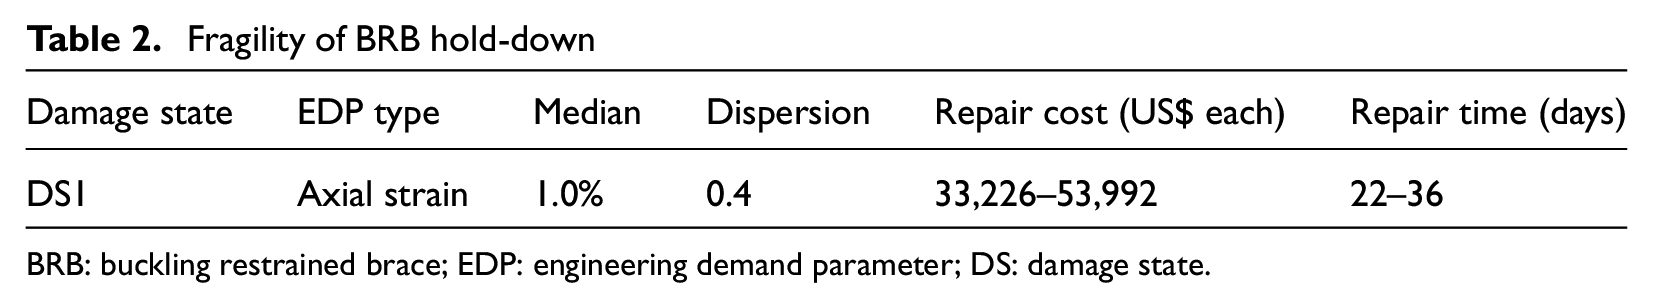
BRB: buckling restrained brace; EDP: engineering demand parameter; DS: damage state.
There are 24 m2 of CLT shear walls in the X-direction and 37.5 m2 in the Y-direction for each story. Fragility curves are derived from the experiments (Shahnewaz et al., 2021) of balloon-type CLT shear walls. The average drift ratio of 2.7% that corresponds to the ultimate strength is considered as the EDP threshold of DS3; and 0.5% and 0.3% are the EDP thresholds of DS2 and DS1, respectively. For comparison, the EDP of DS3 of light framed wood walls in FEMA P-58 is 2.5%. DS3 of CLT shear walls indicates fracture of bolts or steel plates; DS2 indicates plastic deformation of steel joints; DS1 indicates that bolts come loose. Repair measures involve replacing the damaged joints or fastening the loose bolts. The fragility data of CLT walls are shown in Table 3.
Fragility of balloon-type CLT walls
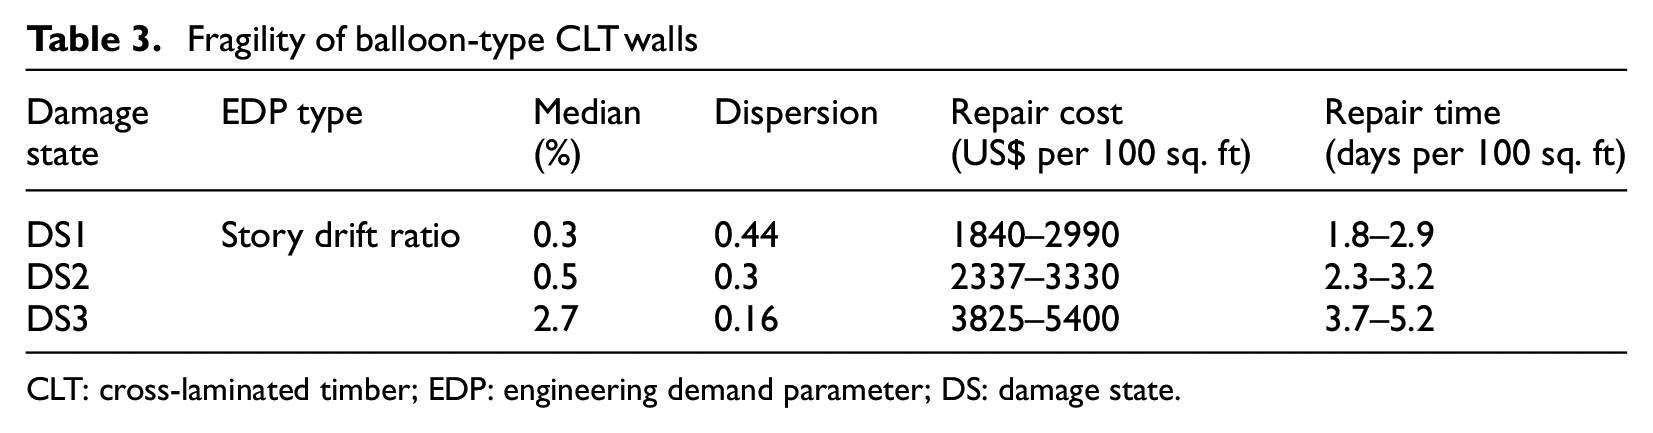
CLT: cross-laminated timber; EDP: engineering demand parameter; DS: damage state.
There are two replaceable steel coupling beams in X-direction and four in Y-direction for each story. The rotation angle between two ends of a coupling beam is the EDP that determines its damage state. Fragility parameters of coupling beams are the same as those by Ji et al. (2017, 2018), listed in Table 4. DS3 indicates link fracture and the corresponding repair measure is to replace the damaged shear link; DS2 indicates link web of flange buckling and repair measures include heating or replacing shear link; DS1 indicates slab damage.
Fragility of replaceable steel coupling beams
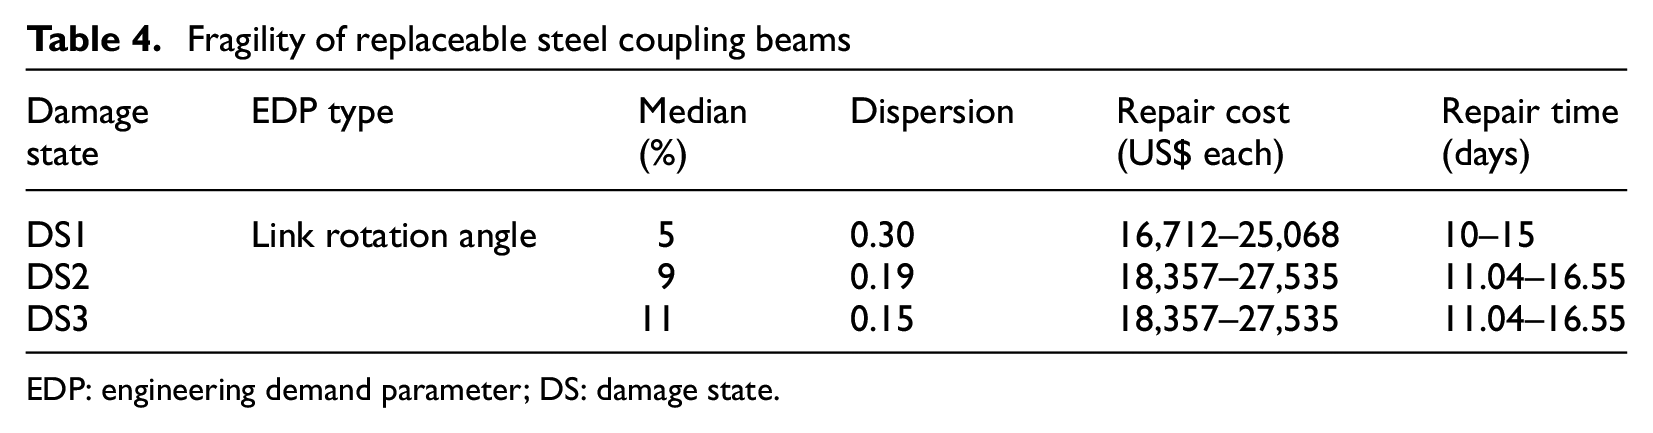
EDP: engineering demand parameter; DS: damage state.
Nonstructural components
FEMA P-58 Normative Quantity Estimation Tool is utilized to estimate the quantity of nonstructural components according to the building plan area and occupancy type. Occupancy types for all stories are apartment. The total quantity of each nonstructural component is listed in Table 5. Some components are directional, such as wall partitions and curtain walls, which means a single component of this type is only sensitive to vibration in either X- or Y-direction. Other components are nondirectional, which means their damage states depend on the maximum EDP in two directions.
Quantity of nonstructural components
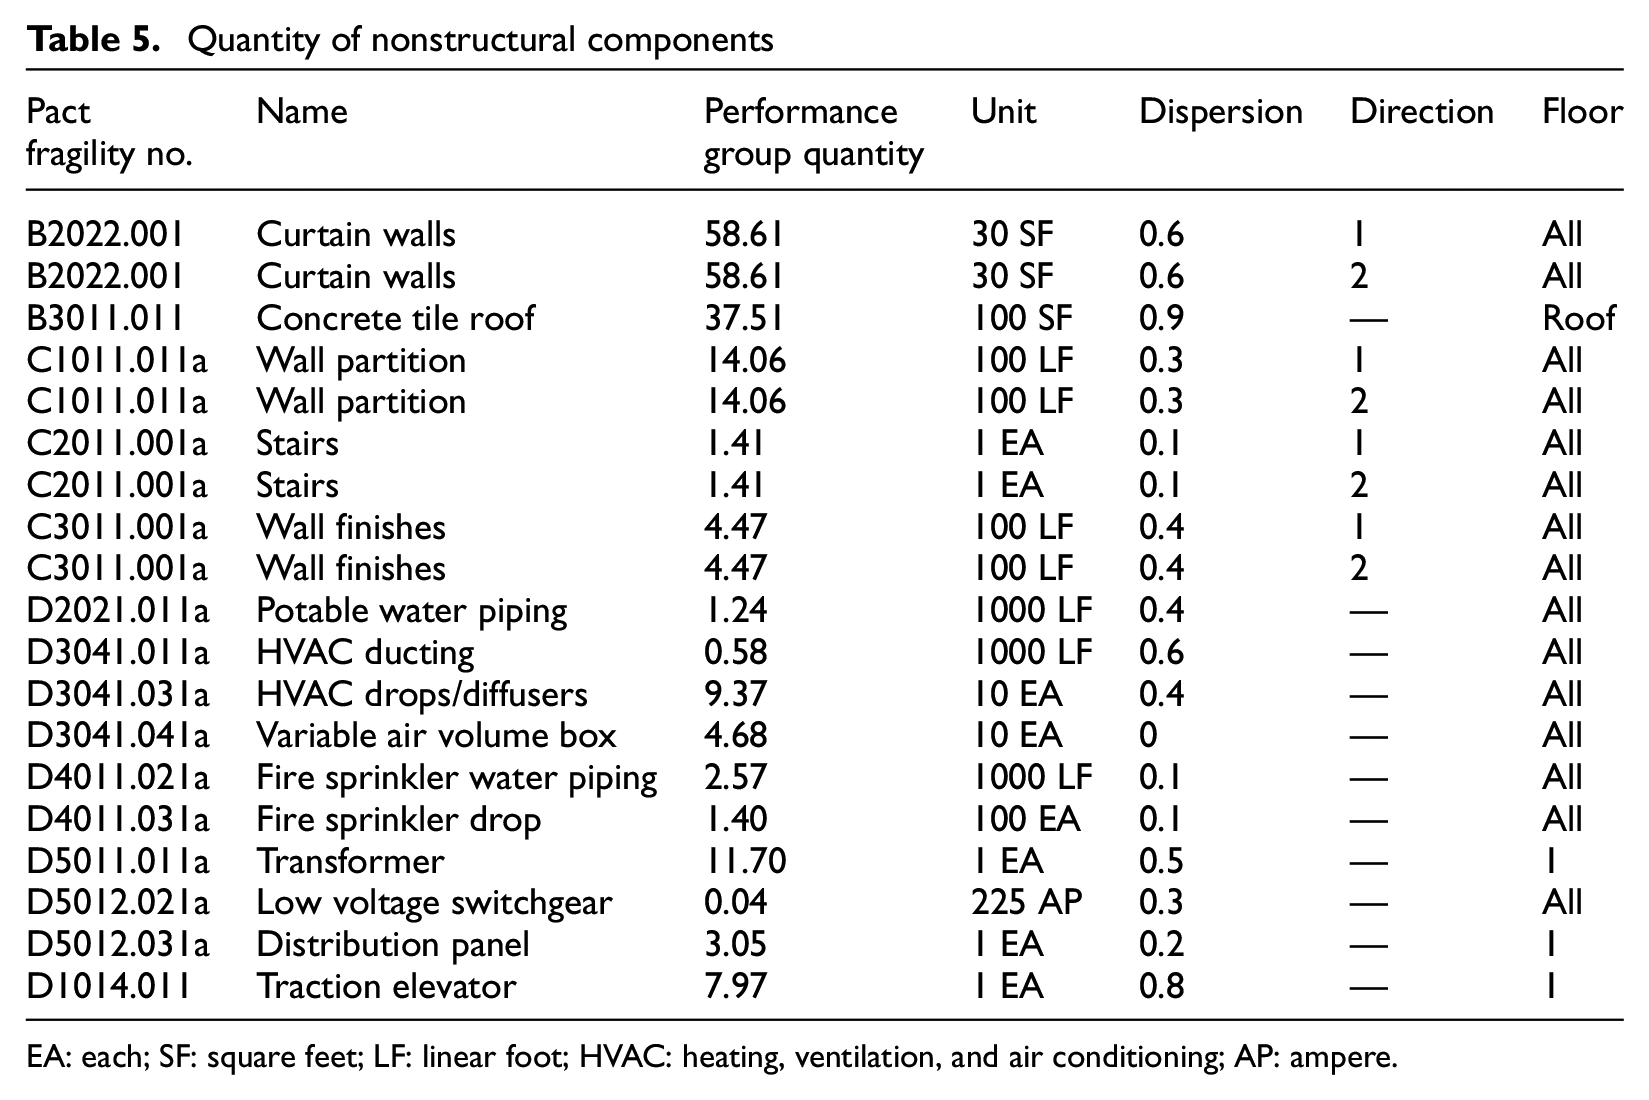
EA: each; SF: square feet; LF: linear foot; HVAC: heating, ventilation, and air conditioning; AP: ampere.
Intensity-based loss assessment
The spectral accelerations corresponding to return periods of 475 and 2475 years are equal to 0.094 and 0.24g, respectively. Using the Python library PELICUN developed by SimCenter (Zsarnóczay and Zhong, 2020), intensity-based probabilistic seismic loss assessments are conducted for a series of different intensities ranging from 0.05 to 0.6g (0.25 to 2.5 times the 2475-year return period intensity). A total of 1000 Monte-Carlo simulations of EDPs are generated for each intensity. If the simulated maximum ISDR is larger than 5% (Teweldebrhan and Tesfamariam, 2022), the building is considered as collapse. The median RISDR threshold for being irreparable is 1% and dispersion is 0.3 (FEMA, 2018). If the building collapses or is irreparable due to large ISDRs or RISDRs, its repair cost is equal to reconstruction cost of the entire building and repair time is equal to reconstruction time. Otherwise, the building is repairable and its repair cost is calculated by accumulating the repair costs of all vulnerable structural and nonstructural components.
The reconstruction cost of the building is estimated to be US$216 per sq. ft (Sorathiya, 2019) and reconstruction time is 600 days. It is assumed that the maximum number of workers who are available for post-earthquake repairing is four on each floor. A parallel repair strategy is taken, which means repair on different floors can start simultaneously and the final repair time of the building depends on the longest one of all floors.
After performing intensity-based loss assessment, cumulative distribution functions (CDFs) of repair costs and repair times are shown in Figure 9 per level of spectral accelerations
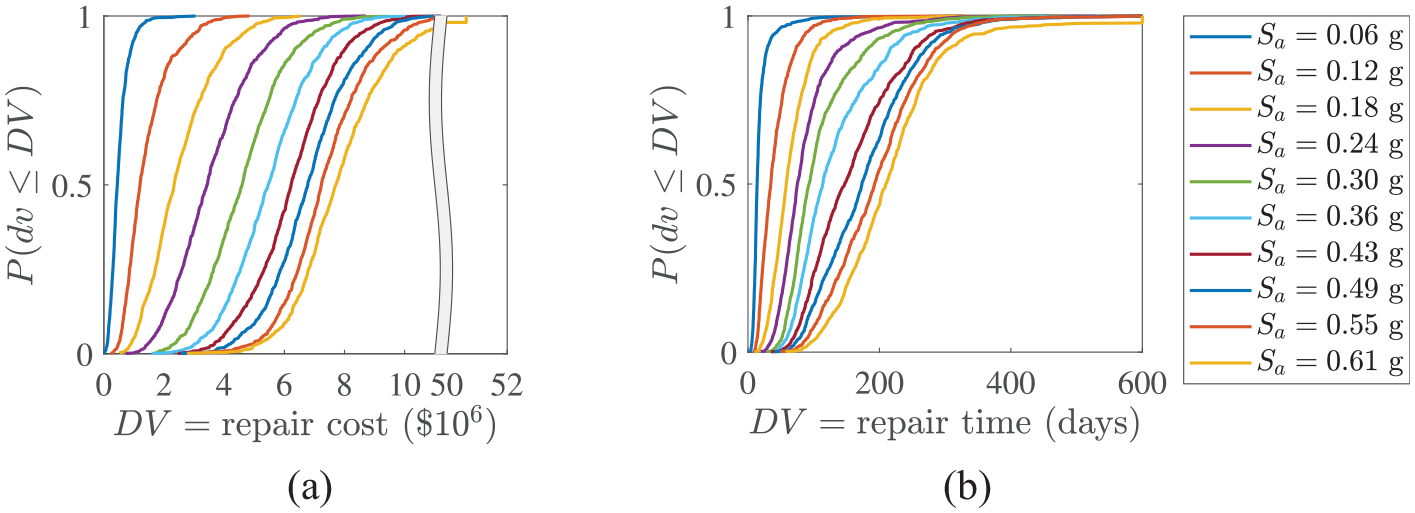
Cumulative distribution function of (a) repair cost and (b) repair time.
Mean repair cost and repair time with respect to spectral accelerations are presented in Figure 10. When
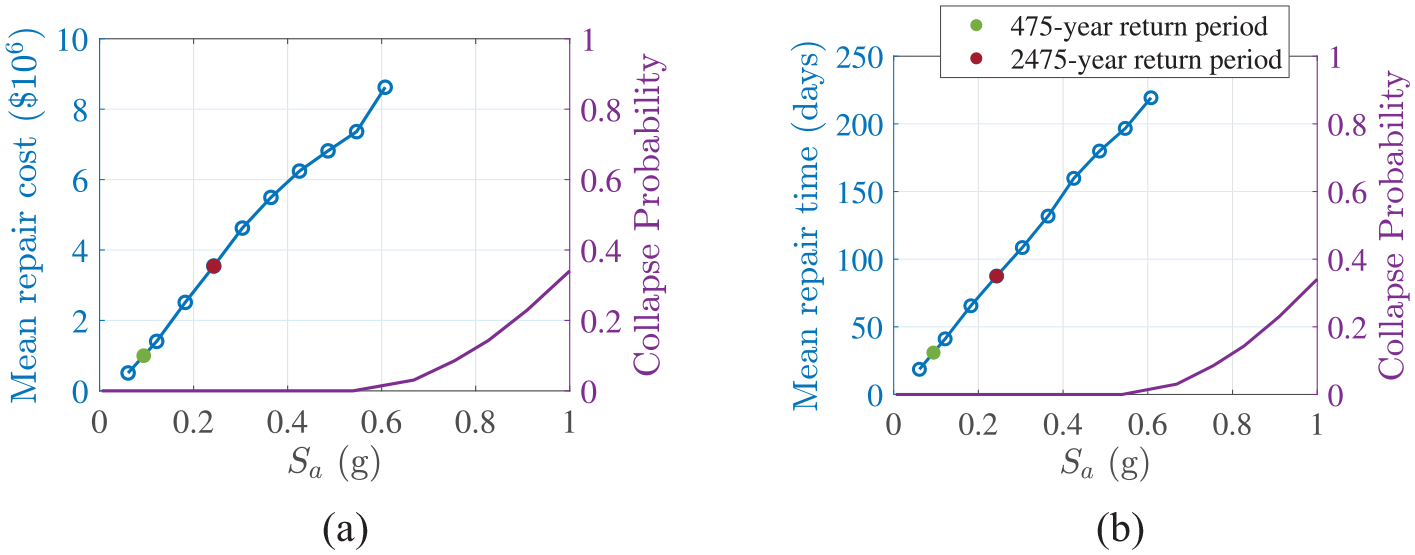
(a) Mean repair cost and (b) mean repair time with respect to spectral accelerations.
As the method utilized here is a component-level loss assessment, seismic losses from different components or stories can be readily obtained. Repair costs from different stories are shown in Figure 11a. For each story, there are four bars corresponding to four intensities of 0.12, 0.24, 0.36, and 0.49g. The first story has the highest repair cost because all hold-downs and some other nonstructural components (e.g. elevators and transformers) are located on the first floor. The 20th story has a relatively higher repair cost than other stories (except the first story) as some nonstructural components are only distributed on the roof. For other stories, repair costs rise with elevation, which is consistent with the trend of increasing deformation demand.
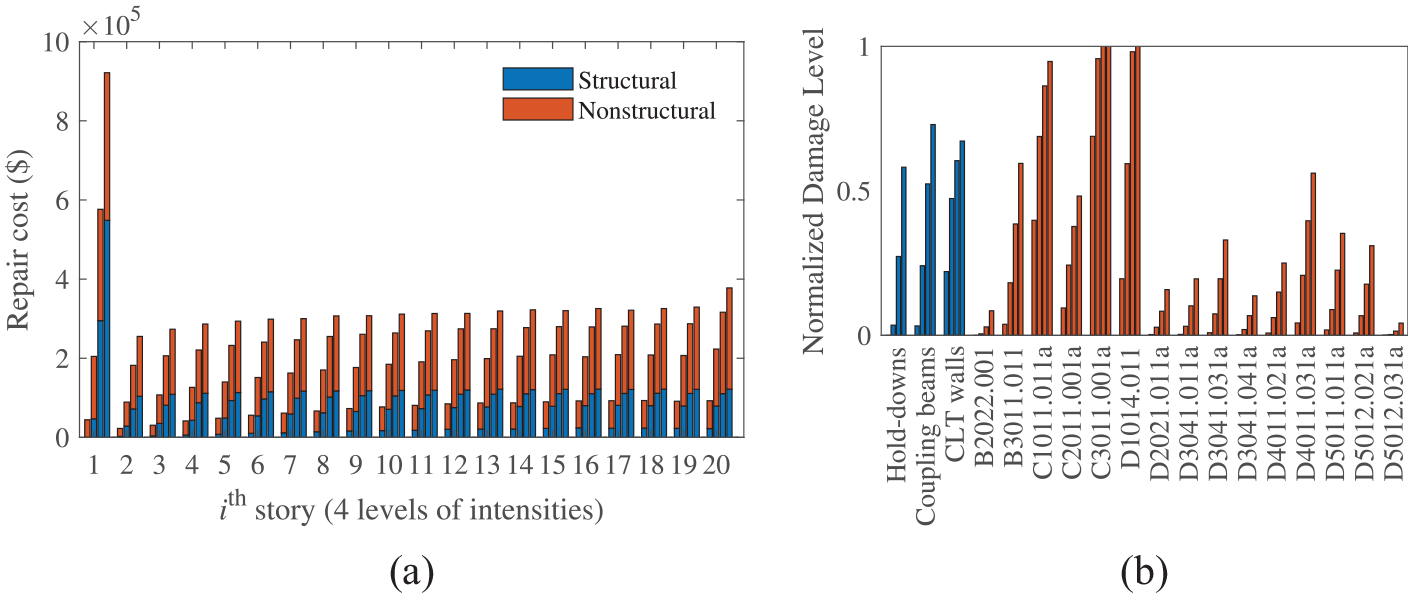
(a) Distribution of mean repair cost along elevation and (b) normalized damage levels (i.e. average damage states divided by the highest damage state) of different components. For each story/component, four seismic intensities (0.12, 0.24, 0.36, and 0.49g) are considered.
Damage levels of components, normalized by their maximum damage levels, are presented in Figure 11b. For example, the post-earthquake damage state of a component is DS2 and its highest possible damage state is DS3, then its normalized damage level would be
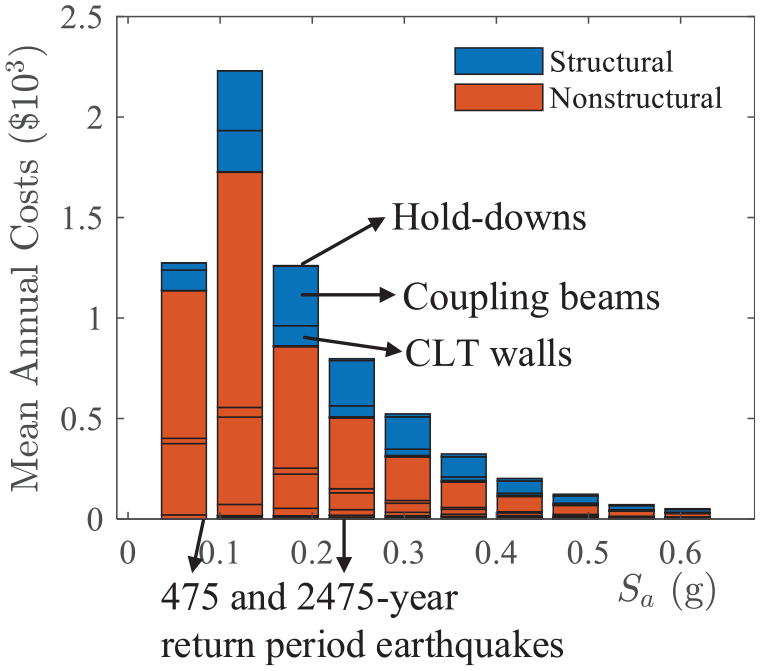
Contributions to repair cost from different components are shown in Figure 12. Under a 475-year return period earthquake, nonstructural components contribute about 80% of total repair costs. With the increase of seismic intensities, contribution from structural components rises and reaches the peak at the intensity of
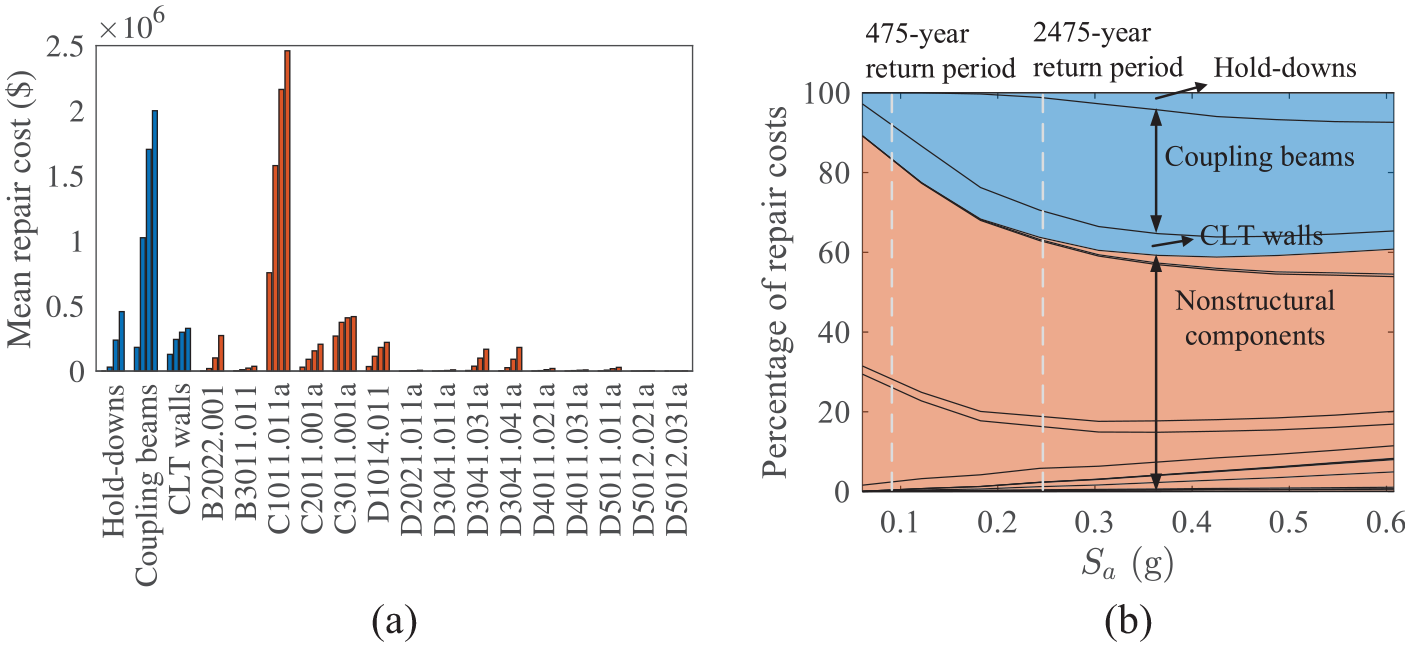
Mean repair costs of different components at given intensities. (a) Mean repair costs for seismic intensities of 0.12, 0.24, 0.36, and 0.49g and (b) percentage contribution of components.
Time-based loss assessment
Time-based loss assessment is performed by combining intensity-based results and the SHC that is accessed online from 2020 National Building Code of Canada Seismic Hazard Tool (Natural Resources Canada, 2020). Building location is Vancouver and site class is C. The obtained SHC, that is, MAFE of spectral accelerations, is shown in Figure 13a.
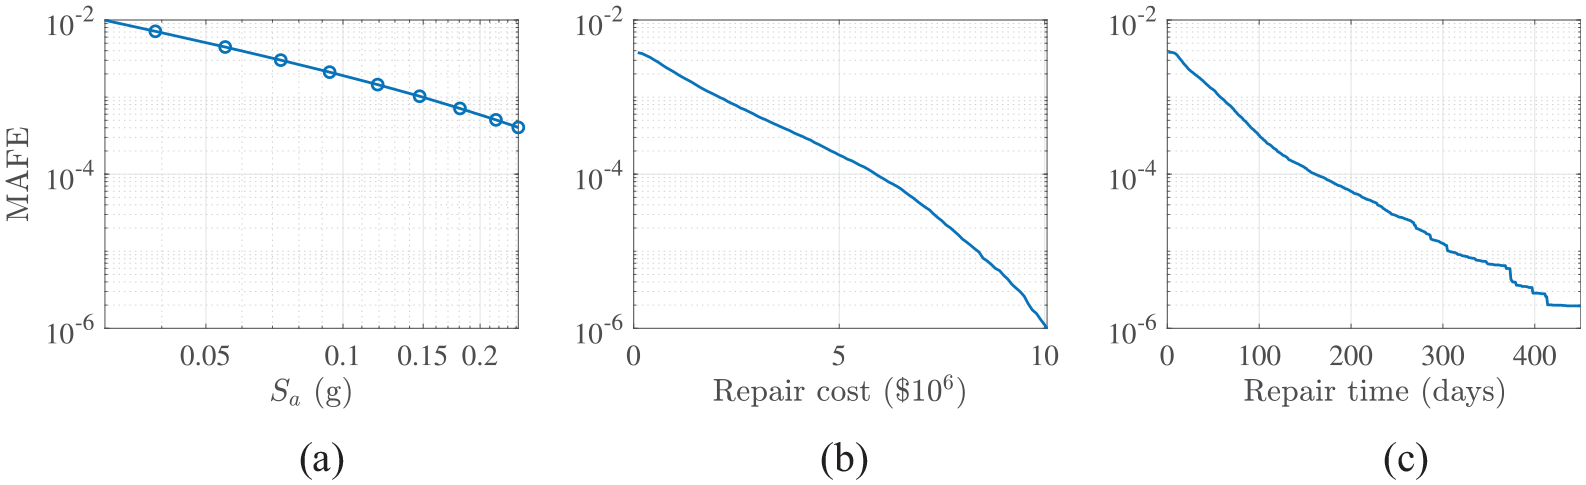
Mean annual frequency of exceedance of (a) spectral accelerations, (b) repair cost, and (c) repair time.
The probability of exceedance of a certain seismic loss given an intensity
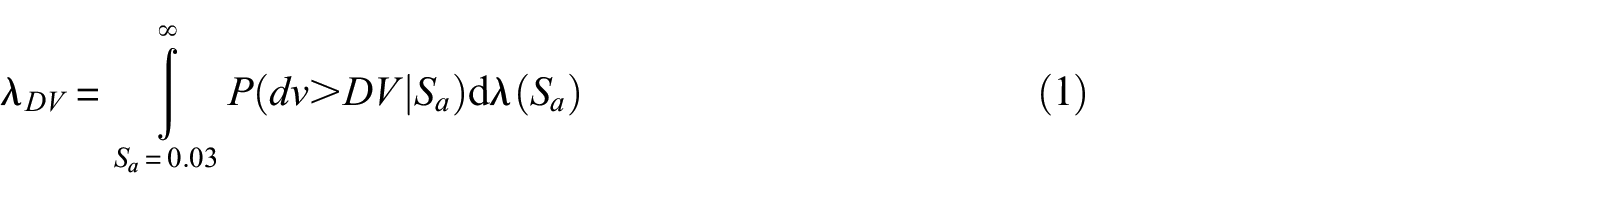
where DV denotes a type of decision variable (repair time or repair cost). Although the upper limit of integration is infinity, it does not mean numerous intensities should be examined. Actually, the contribution of a very high intensity is negligible due to its very small probability of occurrence. The maximum considered
MAL is calculated as follows:
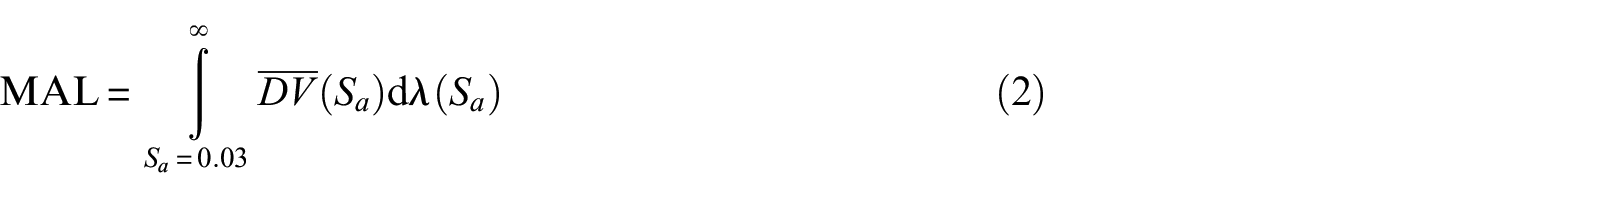
where
Mean annual repair costs from different intensities and components.
Seismic resilience assessment
While seismic loss is a measurement of the initial reduction of building function right after an earthquake, we can quantify seismic resilience of the building by examining the complete post-earthquake function recovery trajectory (Burton et al., 2018; Cimellaro et al., 2010). If the building function at a certain time after earthquake is denoted by
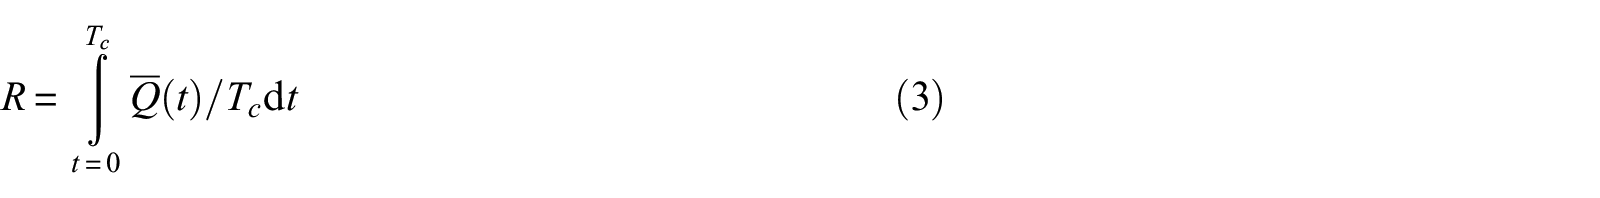
where
As the building in this study is a residential apartment, it has a housing function. The function
Building interruption time multiplier (FEMA, 2020)
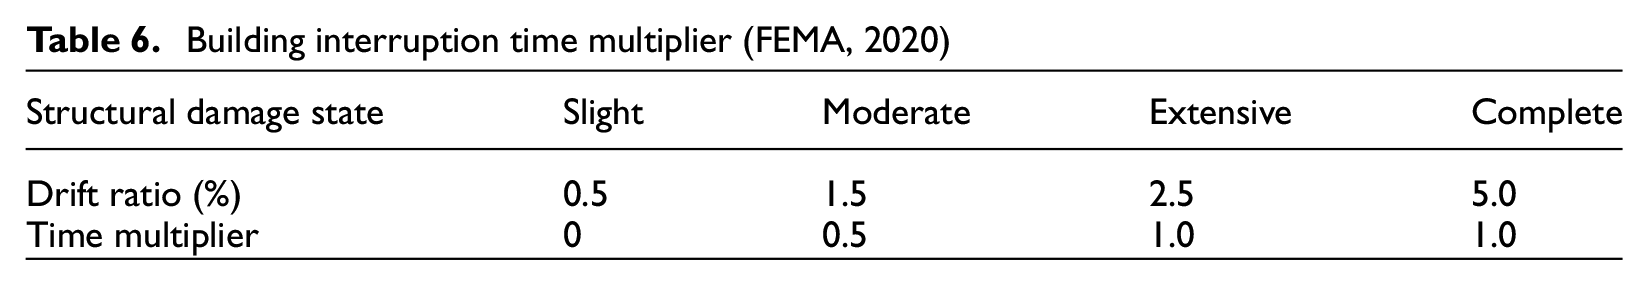
After conducting Monte-Carlo simulations, the mean recovery trajectories for different intensities are obtained, as shown in Figure 15. Although the recovery trajectory for a single simulation is a step function (because
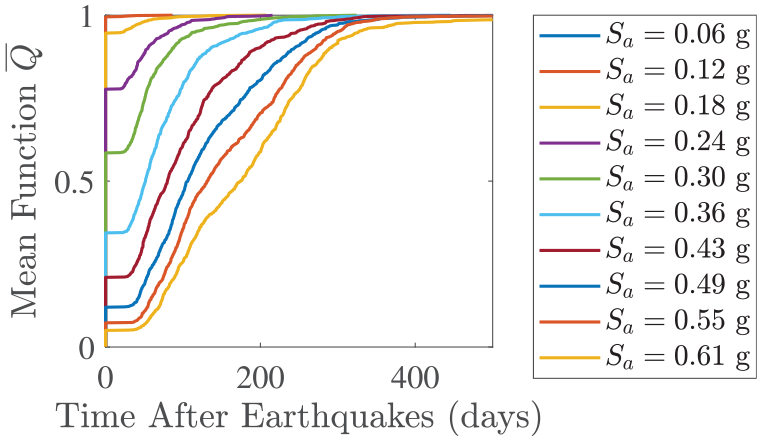
Mean function recovery trajectories after earthquakes.
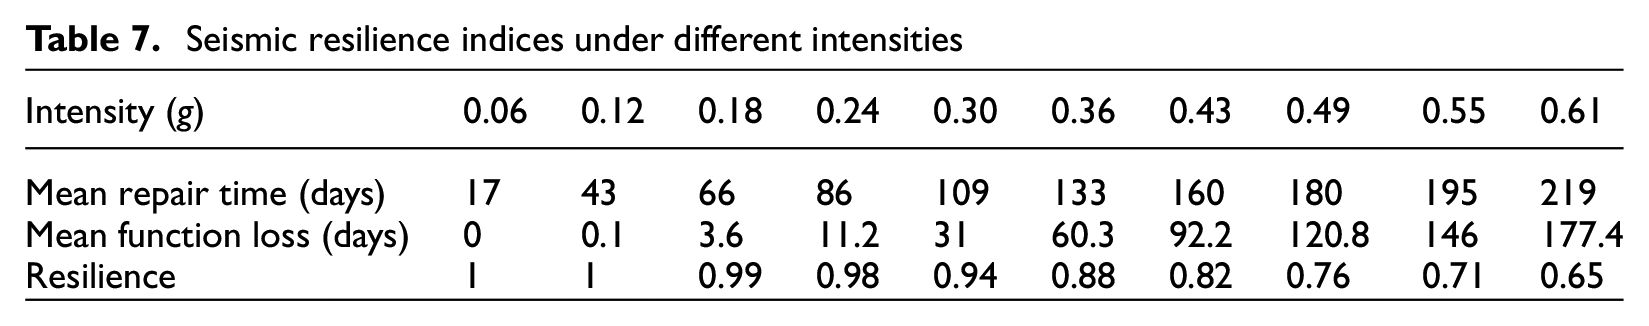
Seismic resilience indices under different intensities
Conclusion
This study examines the probabilistic seismic performance and resilience of a 20-story CLT-CW building. A 3D nonlinear OpenSees model is developed to perform IDA using a set of bi-directional GM records that are selected to represent the seismicity of Vancouver, Canada. The probability distributions of economic losses and repair time at a series of spectral accelerations are presented by conducting intensity-based assessment. Mean annual losses and contribution from different components are also estimated to validate the repairability and seismic resilience of the building. The following conclusions can be drawn:
The probability of being demolished due to unacceptable high repair cost is 0% under a 2475-year return period earthquake. The mean repair time and mean function loss time are 86 and 11.2 days, respectively, when a parallel repair strategy is taken.
Except for the first and top story that have the highest repair costs, repair costs increase with rising elevation.
The building has the highest mean annual loss under the 475-year return period intensity. Most repair costs are contributed from damaged components instead of building collapse.
Steel coupling beams contribute about 80% to total repair costs of damaged structural components under 2475-year return period earthquakes, while the costs of hold-downs are small at the same intensity. Therefore, the coupling beam is the most important structural component that influences seismic losses of CLT-CW building, and further the replaceability of coupling beams makes the CLT-CW building resilient.
Nevertheless, some issues remain to be resolved in future research. (1) The plastic behavior and damage of steel joints within timber wall panels are not considered in FE modeling. (2) The seismic damage to water piping can cause water leak, which in turn may lead to additional repair costs of timber walls. (3) The floor diaphragms are assumed as rigid. Moreover, they are not explicitly modeled; rather, OpenSees’ multi-point constraints feature is used to capture the desired behavior.
Footnotes
Declaration of conflicting interests
The author(s) declared no potential conflicts of interest with respect to the research, authorship, and/or publication of this article.
Funding
The author(s) disclosed receipt of the following financial support for the research, authorship, and/or publication of this article: This research was funded by the British Columbia Forestry Innovation Investment’s (FII) Wood First Program, the Natural Science Engineering Research Council of Canada Discovery Grant (RGPIN-2019-05013), and the Natural Science Foundation of China (NSFC) under Grant Nos 51820105013. The first author also wants to express his acknowledgment to the China Scholarship Council (CSC) for providing financial support to study at UBC Okanagan as a visiting student. Moreover, this research was supported in part through computational resources and services provided by Advanced Research Computing at the University of British Columbia.