
Abstract
Physics-based numerical simulations (PBS) have progressed to the level of providing a realistic description of earthquake ground motion and of its variability, both in time and space, thus enabling to fill the knowledge gaps due to the sparsity of recordings (especially in the near-source region of strong earthquakes). Nevertheless, to build confidence in the utilization of the PBS by the engineering community, simulated accelerograms need to be validated against recorded data from both seismological and engineering perspectives. This article aims at extending the validation of BB-SPEEDset, a data set of near-source broadband simulated accelerograms from multiple regions and faulting styles, obtained by the spectral element computer code SPEED. In addition to seismological checks of BB-SPEEDset proving the absence of systematic biases with respect to a near-source records data set, in this work, the validation is addressed in terms of engineering demand parameters (EDPs) of elastoplastic single-degree-of-freedom systems, taking advantage of a ground motion selection tool including simulated accelerograms. It is found that, when simulated and recorded accelerograms are selected according to the same spectral compatibility criteria, consistent statistical distributions of EDPs are obtained from the two sets. To highlight the potentialities of BB-SPEEDset for near-source analyses, an example of utilization of spectrum-compatible pulse-like motions for structural inelastic analyses is also given, resulting in a good agreement with literature solutions in terms of inelastic displacement demands.
Keywords
Introduction
The sparsity of ground motion recordings in the variety of source and site conditions controlling the seismic hazard at a site, in many cases related to near-source conditions, is still a challenge for many earthquake engineering applications ranging, for example, from nonlinear time history analyses (NLTHA) of structures, to seismic fragility assessment, to seismic analysis of geotechnical systems and soil instability effects. In this regard, despite the growing availability of recordings in strong motion databases, it is often hard to find records representative of high levels of ground shaking, typically corresponding to large magnitude earthquakes in near-field, and obtained in a similar geologic and tectonic framework as the target area.
A rational alternative is to use physics-based numerical simulations (PBS), aiming at producing ground motion time histories reflecting the specificity of the seismogenic fault, of the propagation path and of the local site conditions. Indeed, according to some international seismic norms, such as the US provisions ASCE/SEI 7-16 (2016), the Italian Technical Norms—Norme Tecniche per le Costruzioni (NTC, 2018) and the new draft of Eurocode 8—EC8 (CEN, 2021), it is permitted to supplement the earthquake records with simulated accelerograms, including those generated through the physics-based simulation of the seismic wave propagation process, from the source to the site. Quoting ASCE/SEI 7-16 (§16.2.2), where the required number of recorded ground motions is not available, it shall be permitted to supplement the available records with simulated ground motions. Ground motion simulations shall be consistent with the magnitudes, source characteristics, fault distances, and site conditions controlling the target spectrum.
Although numerical simulations have become, starting from the 60s of the past century, the core of most engineering activities, including earthquake engineering, approaches for PBS are still relatively young, owing, on one side, to the high computational burden to deal with large multi-scale domains (Chen et al., 2023; Gatti et al., 2018; Infantino et al., 2021a; Mazzieri et al., 2013) up to fault-to-structure frameworks (Kato and Wang, 2021; McCallen et al., 2021) and, on the other side, to the complexity in modeling, within a broad frequency range, the coupled effect of the seismic source, the propagation path (including models for P- and S-waves quality factors), and the shallow geological layers (possibly including nonlinear soil response).
In this context, simulated accelerograms should undergo a validation procedure, as the sine qua non condicio to build confidence in the engineering utilization of results from numerical approaches. Quoting Bradley et al. (2017), the validation activity aims at “assessing whether a computational simulation is representative of reality as measured using experimental observations.” The realism of ground motion simulations needs to be assessed both in terms of median values and of dispersion for a twofold validation, proving that: (1) simulations are collectively unbiased and (2) simulation ensembles produce realistic estimates of the different components of ground motion variability, following the partitioning in between-event, site-to-site, and within-event systematic effects (Lee et al., 2020; Neill et al., 2021). Despite this common background, it should be pointed out that validation is application-specific (Rezaeian et al., 2023), since validation metrics and acceptance criteria depend strongly on the objective, as well as on the type and the frequency range of the application under study.
We propose in Figure 1 a multi-level, multi-objective validation framework for the utilization of simulated ground motions. Three levels of validation are defined in the rows of Figure 1 and, for each level, two validation metrics are considered in the corresponding columns: on one hand, ground-motion intensity measures (IMs, first column), which quantify the severity of the ground shaking (e.g. spectral acceleration, peak ground velocity, Arias intensity, 5%–95% duration, among others) and, on the other hand, engineering demand parameters (EDPs, second column), to measure the structural performance (e.g. peak ductility, peak inter-story drift ratios, peak floor accelerations, among others). In a nutshell, the seismological validation is based on IMs, while the engineering validation is based on EDPs.
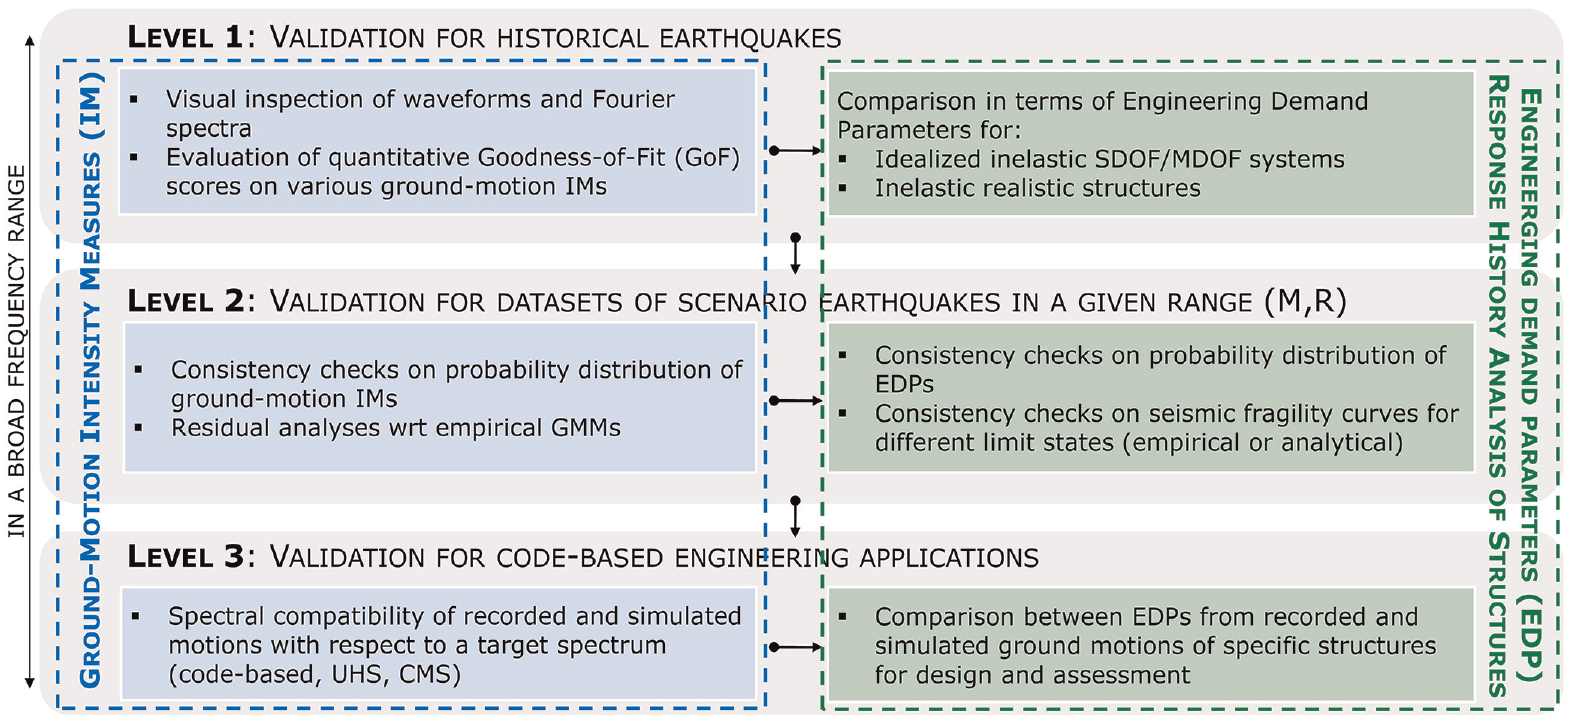
A multi-level validation framework for the engineering utilization of simulated ground motions.
The first validation level (first row in Figure 1) refers to simulation of historical earthquakes where records are available at selected stations. At this level, the seismological validation implies a site-by-site comparison of the simulations with the available ground motion records, typically in terms of waveforms, as well as of Fourier and response spectra, supported by the computation of quantitative goodness-of-fit scores (Anderson, 2004). Note that, contrary to the validation for non-historical earthquakes, the availability of records at multiple sites offers a baseline for model calibration and parameter tuning. For pre-instrumental earthquakes, a qualitative validation could be made based on the distribution of macroseismic intensities (such as in Paolucci et al., 2016). In turn, the engineering validation aims at checking whether simulated motions, when applied as input excitation in NLTHA of structures, provide EDPs that are consistent with those obtained from the corresponding recordings.
The second validation level (second row in Figure 1) extends from individual earthquakes to sets of simulated ground motions, representative of a sufficiently wide range of magnitude, distance, and site conditions (M, r, S). The rationale behind this validation step is to provide evidence that the data set of simulated accelerograms can predict, without any systematic bias, the main statistical distributions of both IMs (seismological validation) and EDPs/risk metrics (engineering validation), as provided by records or empirically based relationships (e.g. Ground Motion Models, GMMs), in a range of (M, r, S) that is suitably covered by both simulated and recorded ground motions.
Finally, the third validation level is linked to code-based engineering applications of simulated ground motion data sets, which can provide the basis for the selection of spectrum-compatible accelerograms for seismic design and assessment of real structures.
Referring more specifically to the engineering validation of simulated ground motions, that is the focus of this article, Table 1 provides a selection of literature studies, where a variety of simulation approaches have been considered together with different structural typologies, EDPs, as well as fragility curves and/or the consequent risk metrics. Simulation approaches encompass PBS, stochastic finite-fault (SFF) and artificial generation from stochastic models (ART). Note that the selection criteria of the simulated/recorded sets considered for the validation are not always the same: they are generally taken either from the same historical earthquakes (but at different locations), or from earthquakes of similar M and tectonic context, or from spectral compatibility considerations. The degree of confidence on simulated accelerograms is evaluated using structural models of different complexity, from idealized elastoplastic single-degree-of-freedom (SDoF) to inelastic multi-degree-of-freedom (MDoF) systems and real steel or reinforced concrete (RC) buildings and/or bridges, and quantified in terms of EDPs representative of peak (e.g. peak inter-story drift ratios, peak floor accelerations, maximum ductility demand, and so on) and cyclic response (e.g. equivalent number of cycles, inelastic energy), at both global (e.g. peak base shear) and local (e.g. peak chord rotations) structural level. Among the validation activities summarized in Table 1, some of the most recent works have focused on assessing the capability of simulations to describe the structural response in a wide range of intensities, as required by performance-based risk and loss assessments (see Bijelić et al., 2018; Ozsarac et al., 2023; Zhong et al., 2021).
Selected literature studies on the engineering validation of simulated ground motions
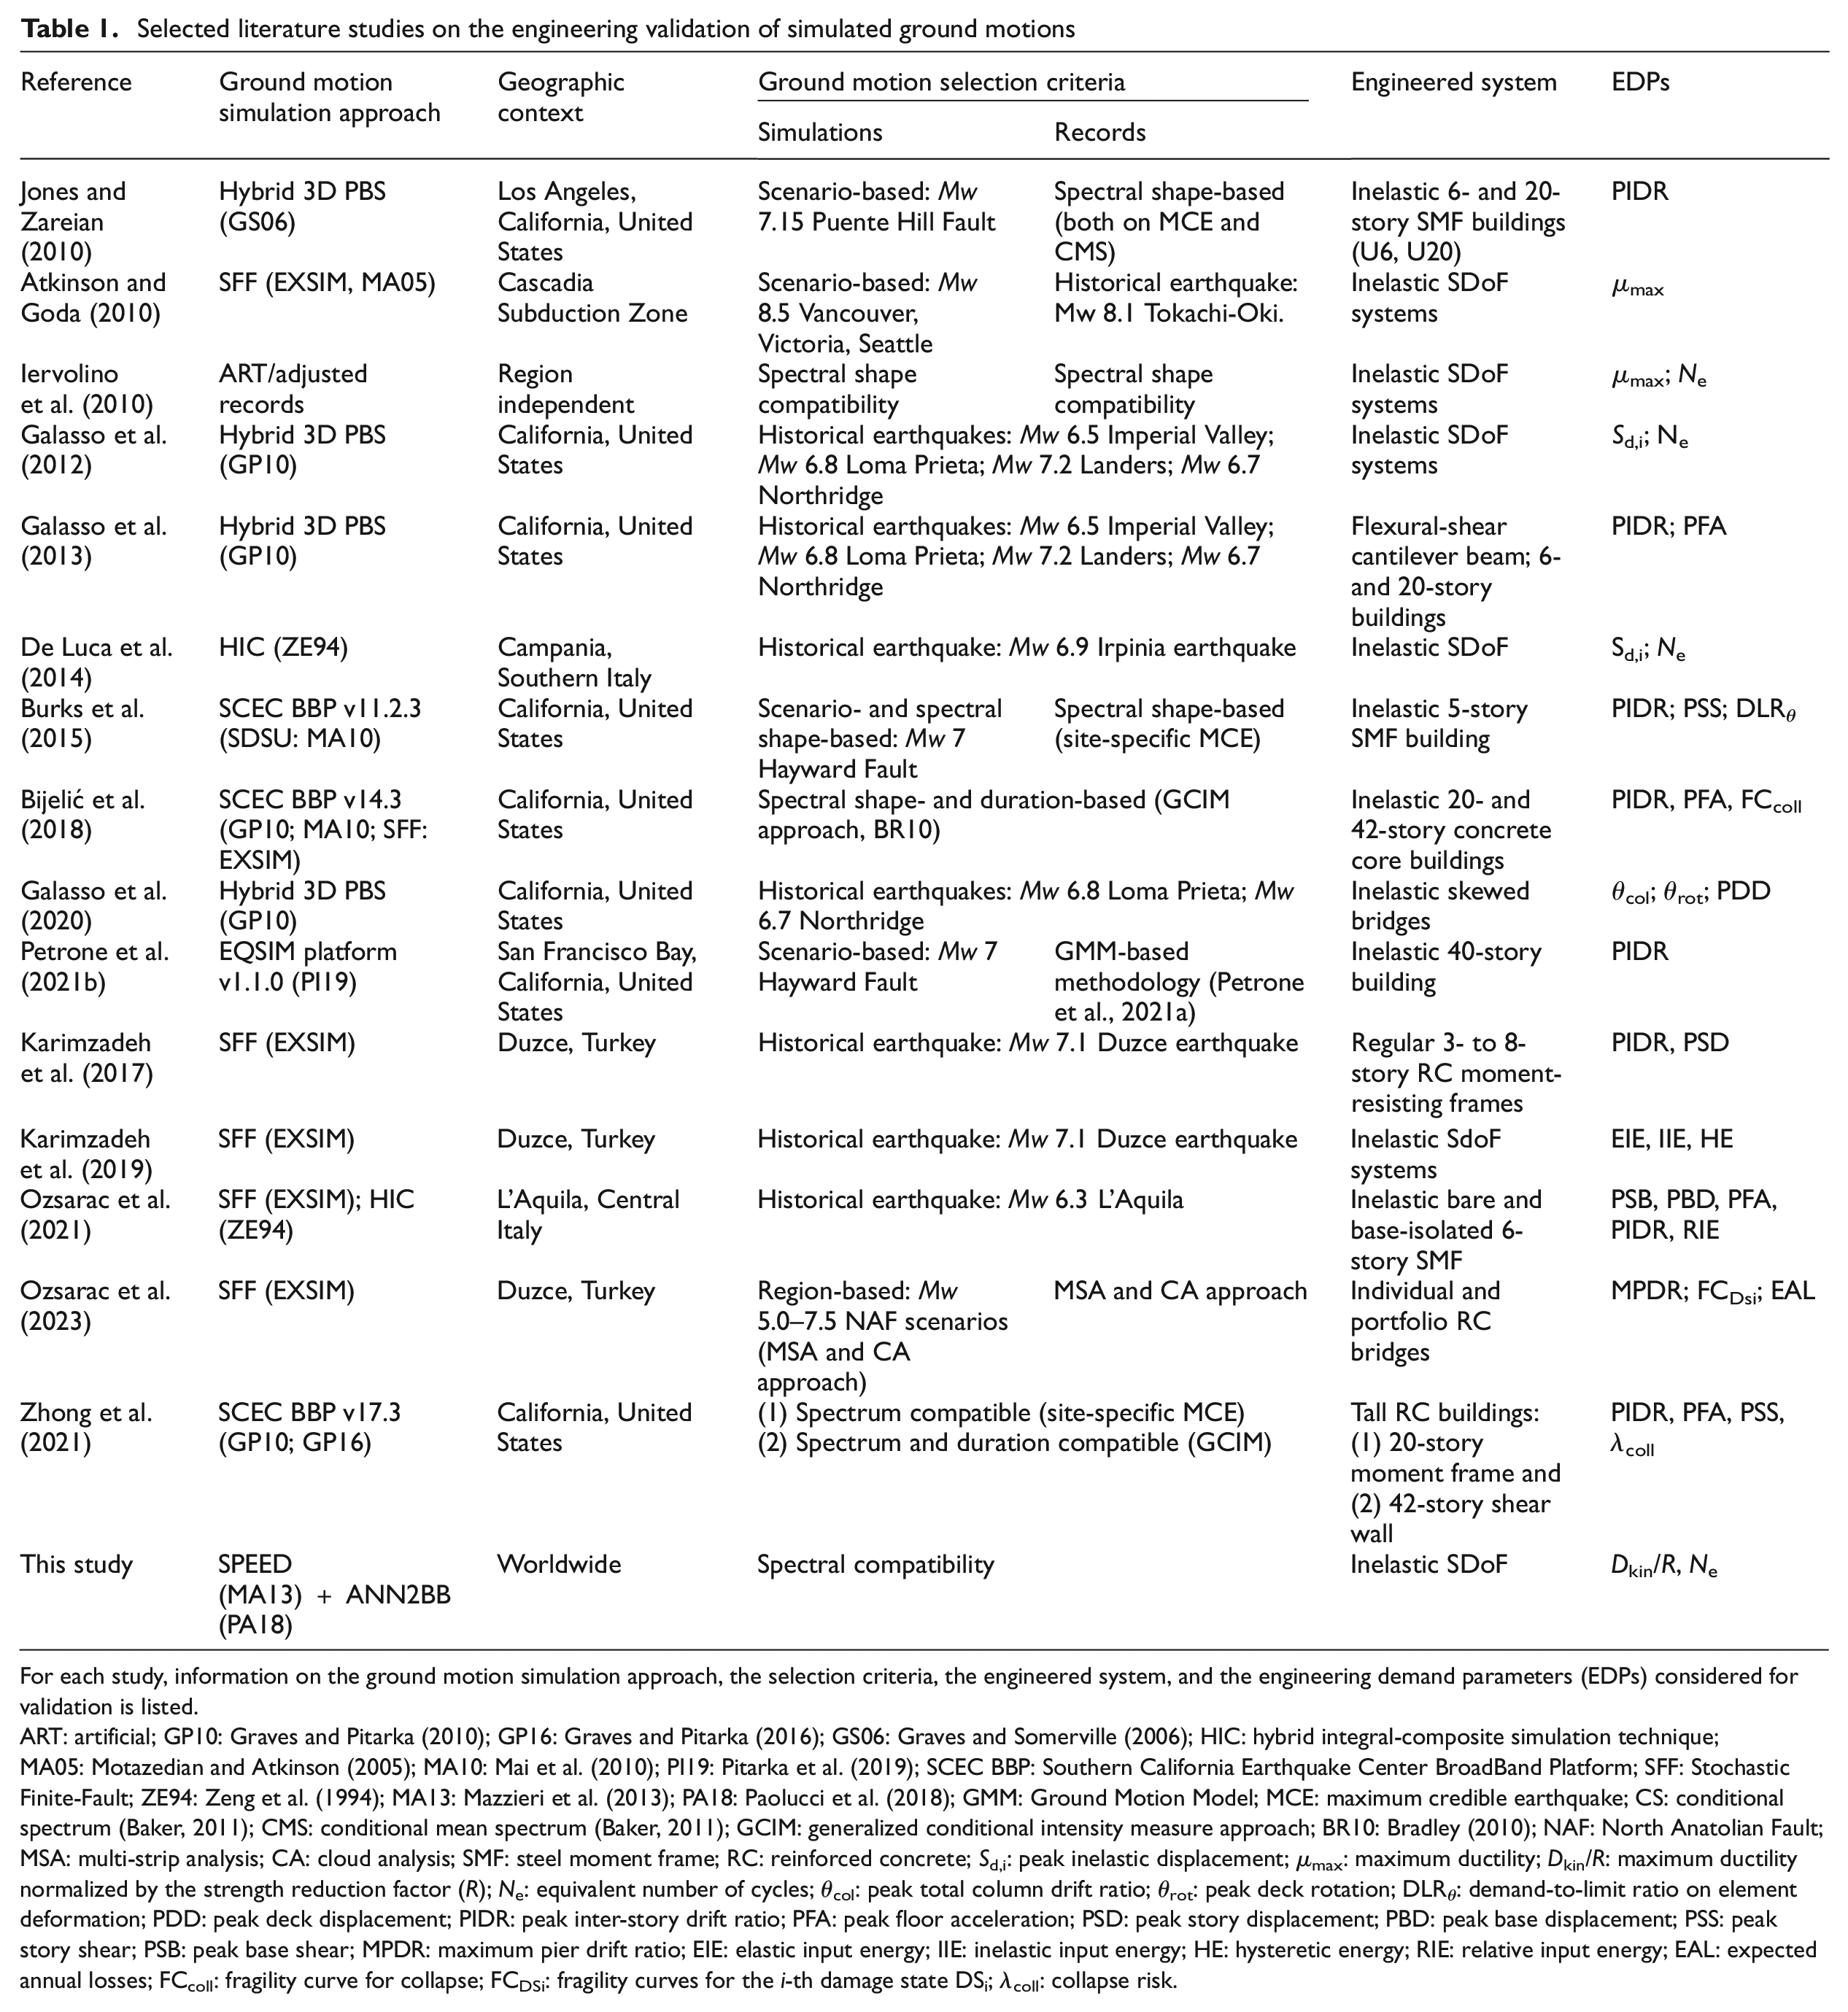
For each study, information on the ground motion simulation approach, the selection criteria, the engineered system, and the engineering demand parameters (EDPs) considered for validation is listed.
ART: artificial; GP10: Graves and Pitarka (2010); GP16: Graves and Pitarka (2016); GS06: Graves and Somerville (2006); HIC: hybrid integral-composite simulation technique; MA05: Motazedian and Atkinson (2005); MA10: Mai et al. (2010); PI19: Pitarka et al. (2019); SCEC BBP: Southern California Earthquake Center BroadBand Platform; SFF: Stochastic Finite-Fault; ZE94: Zeng et al. (1994); MA13: Mazzieri et al. (2013); PA18: Paolucci et al. (2018); GMM: Ground Motion Model; MCE: maximum credible earthquake; CS: conditional spectrum (Baker, 2011); CMS: conditional mean spectrum (Baker, 2011); GCIM: generalized conditional intensity measure approach; BR10: Bradley (2010); NAF: North Anatolian Fault; MSA: multi-strip analysis; CA: cloud analysis; SMF: steel moment frame; RC: reinforced concrete; Sd,i: peak inelastic displacement; µmax: maximum ductility; Dkin/R: maximum ductility normalized by the strength reduction factor (R); Ne: equivalent number of cycles; θcol: peak total column drift ratio; θrot: peak deck rotation; DLRθ: demand-to-limit ratio on element deformation; PDD: peak deck displacement; PIDR: peak inter-story drift ratio; PFA: peak floor acceleration; PSD: peak story displacement; PBD: peak base displacement; PSS: peak story shear; PSB: peak base shear; MPDR: maximum pier drift ratio; EIE: elastic input energy; IIE: inelastic input energy; HE: hysteretic energy; RIE: relative input energy; EAL: expected annual losses; FCcoll: fragility curve for collapse; FCDSi: fragility curves for the i-th damage state DSi; λcoll: collapse risk.
Despite the favorable validations resulting from these studies, utilization of PBS ground motions is still limited in engineering practice, where generally input ground motions are selected solely from recorded data sets, on the basis of different spectrum compatibility criteria with respect to either design, or conditional, or uniform hazard spectra, and eventually, further modified by linear scaling or spectral matching techniques.
To cope with this problem, activities are under way by several research groups to promote the engineering application of simulated ground motions (Baker et al., 2021; Paolucci et al., 2021a; Rezaeian et al., 2023). With the experience gained at Politecnico di Milano throughout a number of PBS applications performed by the computer code SPEED (Mazzieri et al., 2013), Figure 2 provides an overview of the SPEED case studies, in most cases validated on historical earthquakes (highlighted in red and corresponding to level 1 of Figure 1), both in Italy and worldwide, in a relatively broad range of magnitude, tectonic styles, and site conditions. Results of such PBS were organized within the BB-SPEEDset, a data set of broadband near-source simulated accelerograms, which already underwent a successful seismological validation (Paolucci et al., 2021a).
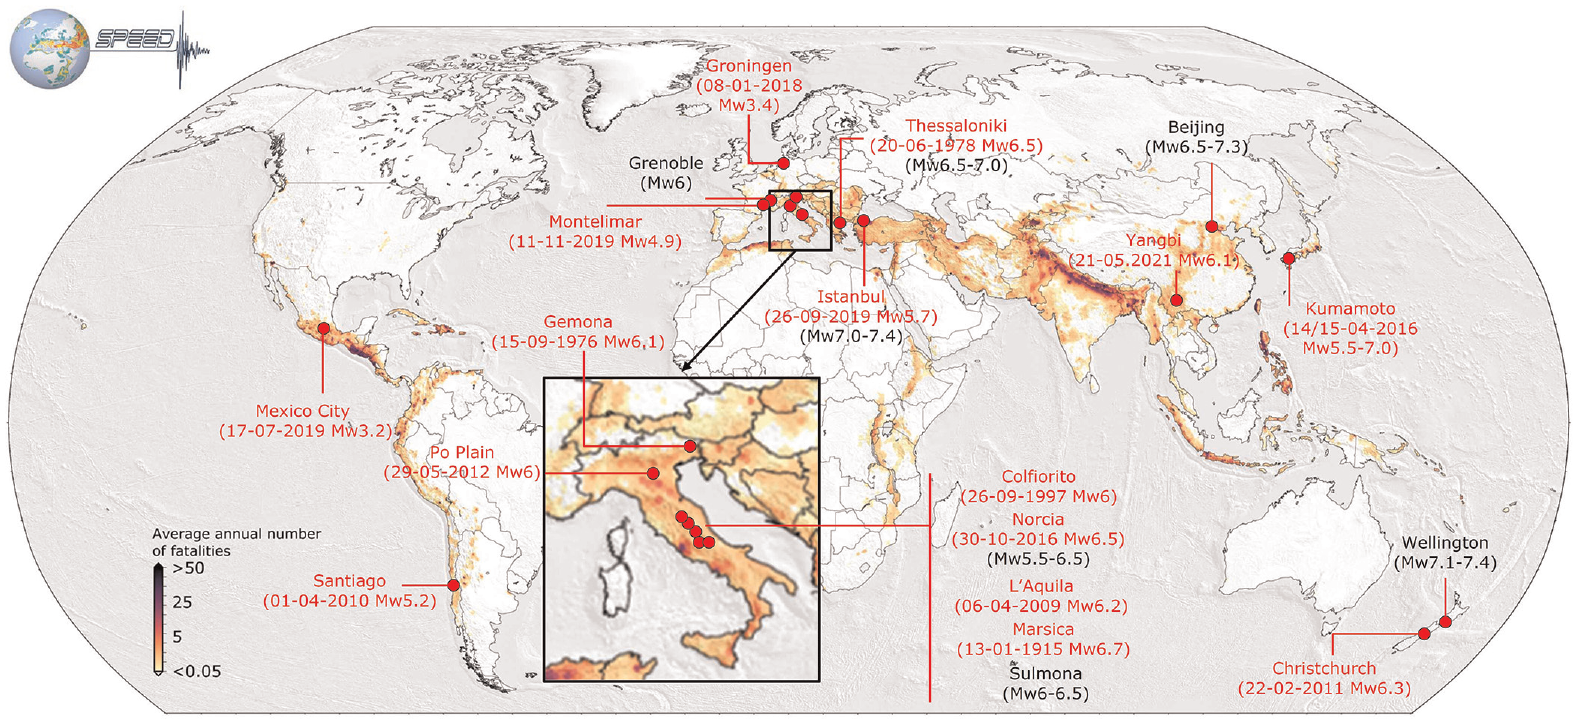
Overview of PBS performed by SPEED and included to a large extent in BB-SPEEDset (v. 1.0). Highlighted in red are the PBS validated against historical earthquakes (level 1 in Figure 1). The background map is the risk map released by the Global Earthquake Model (Silva et al., 2018).
The main aim of this article is to integrate the validation of BB-SPEEDset from an engineering perspective. For this purpose, an all-in-one workflow is developed, taking advantage of a ground motion selection tool (Select&Match, S&M) which embeds both recorded and simulated data sets. One set of simulated accelerograms and one set of unscaled records are extracted from S&M, with the same spectral compatibility criteria, and used as input motions for the analysis of inelastic SDoF systems with different vibration periods, hysteretic behavior, and strength reduction factors. The results in terms of median EDPs, as well as their standard deviation, are then compared. As a further application, inelastic displacement demands are computed for a suite of spectrum-compatible pulse-like motions from BB-SPEEDset and compared with empirical formulae from the literature, specifically calibrated on near-source impulsive recordings.
BB-SPEEDset: a data set of physics-based simulated accelerograms from multiple seismic regions and faulting styles
As discussed in the “Introduction” section, a key step to support the engineering utilization of ground motion simulations is the availability of vetted data sets of simulated ground motions, such as the Cybershake set (Baker et al., 2021, following the original work by Graves et al., 2011), BB-SPEEDset (Paolucci et al., 2021a), EQSIM-PEER (Pacific Earthquake Engineering Research Center, 2022), or Synthesis (http://synthesis.mi.ingv.it/), as well as their dissemination through web infrastructures specifically developed to search, select, analyze, and download strong-motion data. In this section, we briefly recall the most salient features of BB-SPEEDset, in relation to the application addressed in this work.
BB-SPEEDset contains broadband accelerograms obtained by the ANN2BB approach (Paolucci et al., 2018), that exploits the capabilities of artificial neural networks (ANNs), suitably trained on records, to produce realistic high-frequency ground motions correlated, through the ANN, with the low-frequency results from PBS. As specified in the flatfile of BB-SPEEDset providing the transition period T* for the ANN2BB procedure, the frequency resolution of the PBS (SPEED) signals included in the data set falls typically in the range between 1 and 2 Hz. Paolucci et al. (2018) also showed that, with the ANN2BB procedure, the simulated ground motions for a given earthquake produced a spatial variability consistent with record-based spatial correlation models.
The version of BB-SPEEDset considered here (v. 1.0) includes around 12,000 three-component broadband accelerograms from earthquakes with moment magnitude MW between 5.5 and 7.4 at Joyner–Boore distance RJB up to around 80 km (as shown in Figure 3a) and with variable site conditions (VS30 between 200 and 2000 m/s). In addition to the most representative IMs, for each accelerogram, the flatfile contains a tag for the identification of velocity pulses and the corresponding pulse period (TP) according to the algorithm by Shahi and Baker (2014). This feature will be exploited for the near-source application, as discussed in the section “Insights from pulse-like ground motions.”
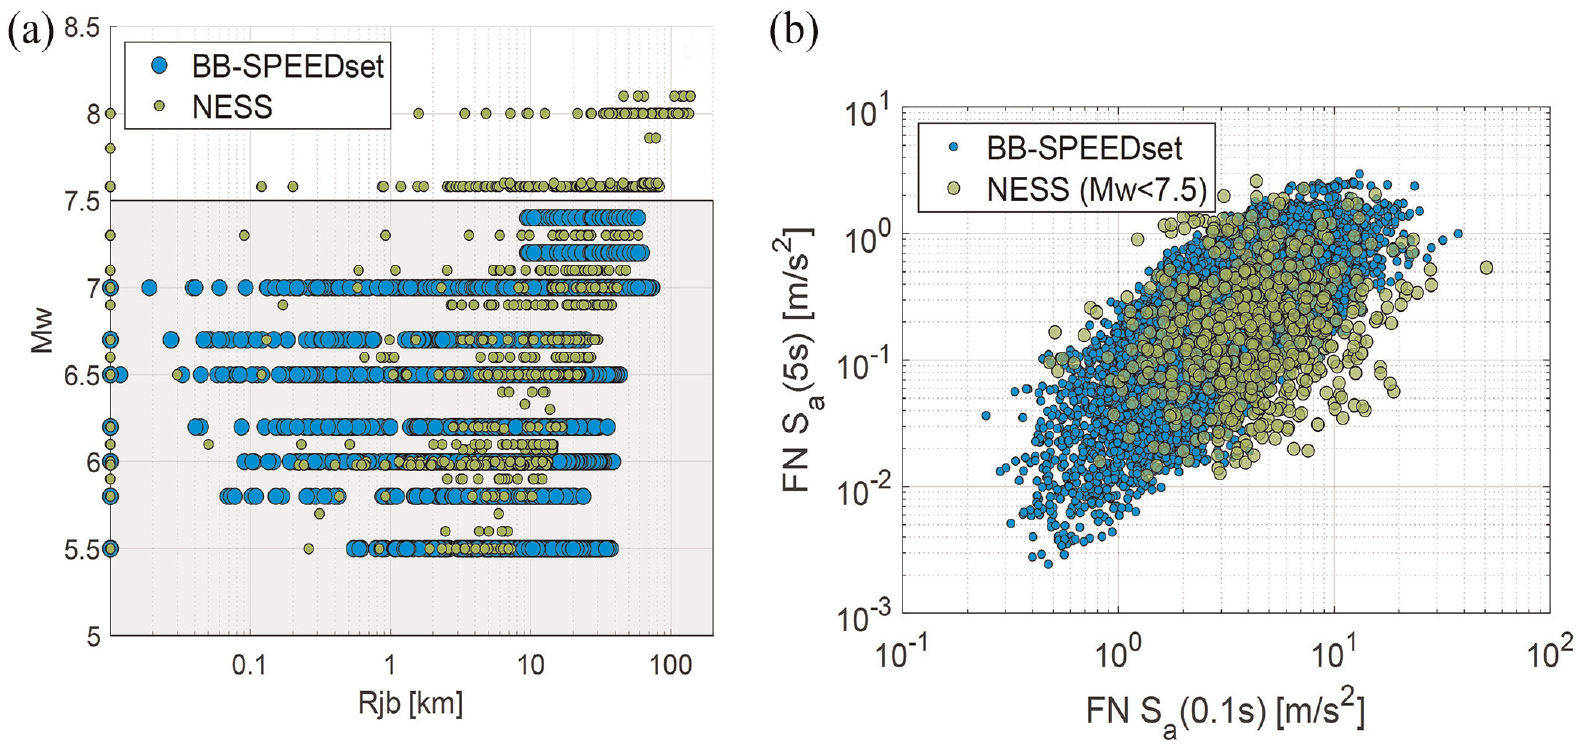
BB-SPEEDset (v. 1.0), in comparison with NESS2: (a) MW-RJB distribution and (b) correlation between short (0.1 s) and long (5 s) period response spectral acceleration Sa on the FN component.
Paolucci et al. (2021a) compared the statistical distributions of different IMs (e.g. response spectral acceleration Sa, peak ground acceleration PGA, peak ground velocity PGV, Housner Intensity HI, among others), including those related to impulsive near-source waveforms (distribution of TP), from the BB-SPEEDset with those obtained from the near-source records data set NESS2 (Sgobba et al., 2021), within the same (M, r) interval and in a broad range of frequencies. As an illustrative example, Figure 3 shows the comparison of BB-SPEEDset with NESS2 in terms of: (a) MW-RJB distribution and (b) correlation between short (0.1 s) and long (5 s) period Sa on the Fault Normal (FN) component. Referring to Paolucci et al. (2021a) for a thorough discussion on the validation outcomes, we remark herein that, considering that the two data sets have in common only similar ranges of MW = 5.5–7.5 and RJB≤ 80 km, the consistency between the simulated and recorded sets is remarkable, both in median and standard deviation, with no evidence of systematic biases.
Engineering validation of BB-SPEEDset
Methodology
The approach adopted for the engineering validation of PBS ground motions is depicted in Figure 4 and summarized in the sequel. First, the software tool S&M for ground motion selection and matching (Manfredi et al., 2022) is employed to select two sets of ground motions, one from a recorded database (NGA-West2, Ancheta et al., 2013) and one from BB-SPEEDset, according to the same spectrum compatibility criteria. Figure 5 shows a flowchart pointing out the main features of the up-to-date version of S&M adopted in this work. Details of the S&M selection and scaling algorithms, which are beyond the scope of this work, can be found in Manfredi et al. (2022). As highlighted in Figure 5, the key feature of S&M, relevant for the objective of this work, is indeed the integration of data sets of recordings, such as NGA-West2 or SIMBAD (Smerzini et al., 2014), and BB-SPEEDset, allowing the selection of hybrid suites of N multi-component ground motions compatible with a target spectrum (in terms of either a site-specific user-defined spectrum or a code-compliant design spectrum) in a flexible way. Furthermore, additional search options were introduced for the selection of pulse-like motions.
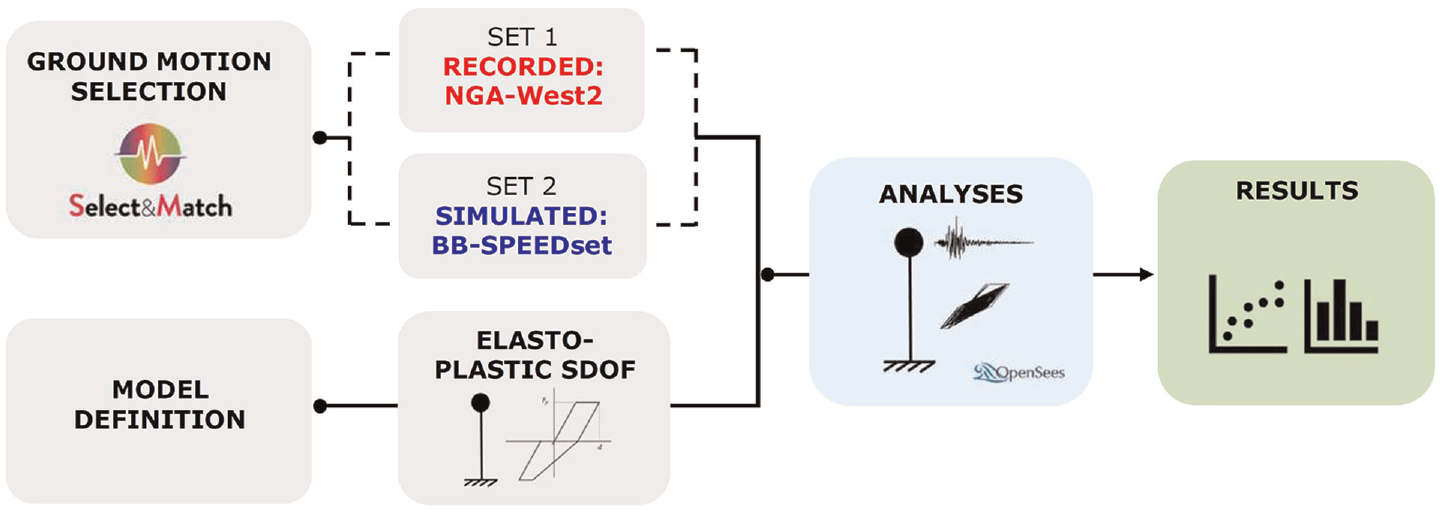
Approach for the engineering validation of PBS ground motions.
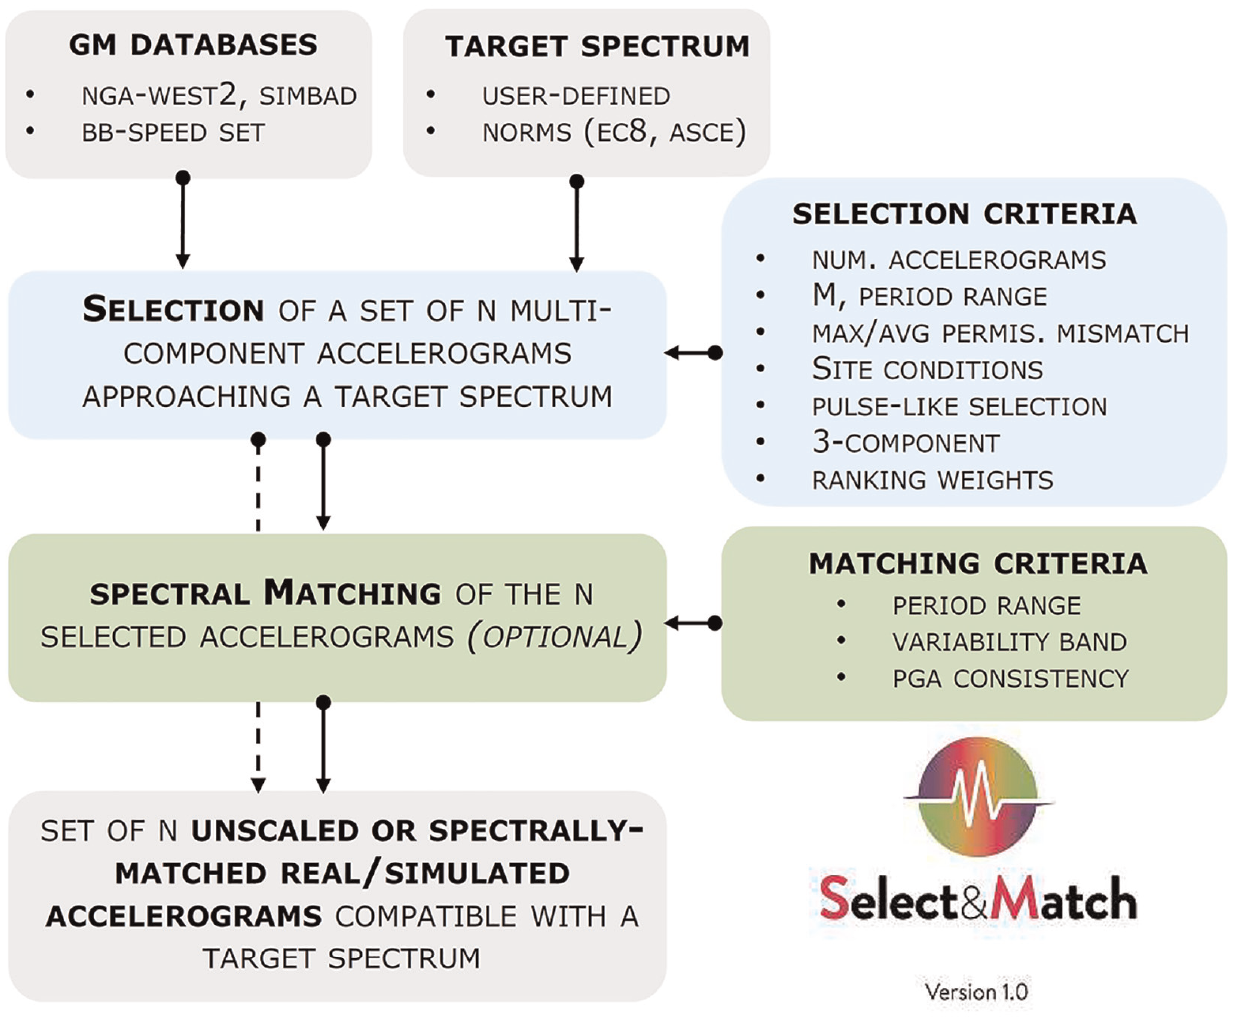
Main options of the software Select&Match (Manfredi et al., 2022), designed for the selection and spectral matching of ground motions from both recorded and PBS databases.
Then, the two sets of accelerograms are used as input motions for the NLTHA of inelastic SDoF systems with idealized elastoplastic backbone curve and hysteretic behavior. All NLTHAs are performed using the OpenSees software (Mazzoni et al., 2006). Structural response is quantified in terms of selected EDPs, representative of both peak and cyclic seismic demand. The variability of SdoF response as a function of the elastic vibration period, the degree of nonlinearity (measured by the strength reduction factor) and the effect of different hysteretic laws is also considered. Finally, consistent with literature studies on engineering validation, the seismic demands on SDoF systems, under both sets of recorded and simulated motions, are quantified and systematically compared via statistical post-processing.
Seismic input: real and simulated ground motion sets
The selection criterion adopted in this work is based on spectral compatibility, implying that all ground motions (simulated and recorded) are selected to approach the same target spectrum and, hence, possess a similar spectral shape. The target spectrum, illustrated in Figure 6, is defined according to EC8 for a high-seismicity site with peak ground acceleration ag = 0.38 g and for site class A (VS30≥ 800 m/s according to EC8 ground categories).
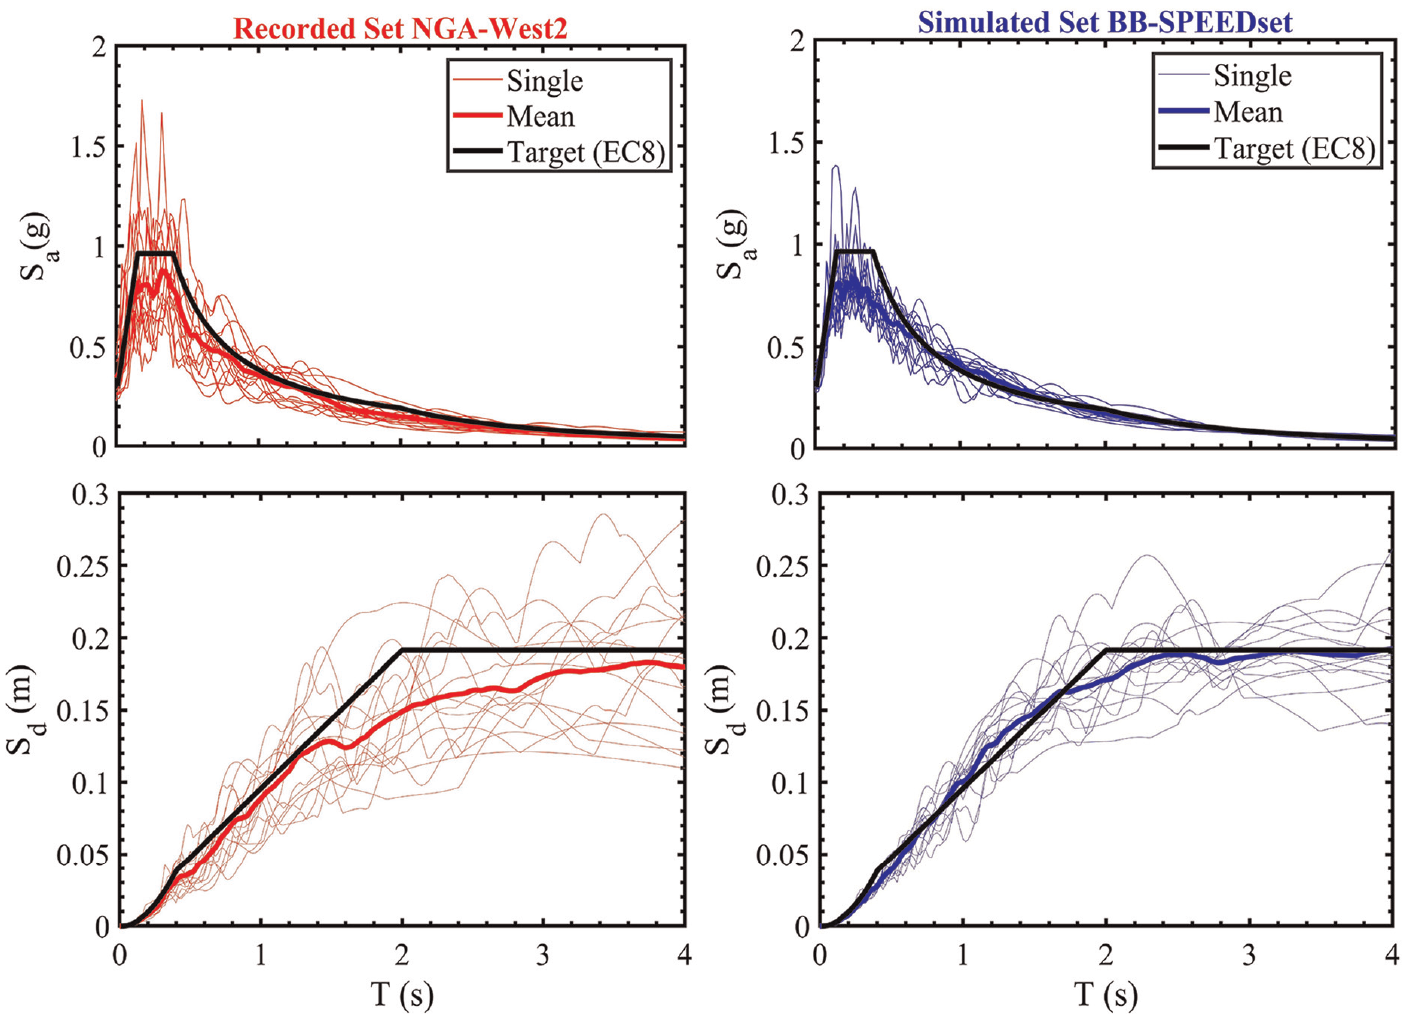
Elastic acceleration (Sa, top) and displacement (Sd, bottom) response spectra of the two sets of recorded (left) and simulated (right) ground motions (see Table 2).
Two sets of 15 recorded (from NGA-West2) and simulated (from BB-SPEEDset) ground motion time series were selected using S&M to approach on average the target design spectrum in a broad period range, that is, T = [0.1–4.0] s, with prescribed average and maximum permissible mismatches equal to 0.25 and 0.4, respectively (for further details about these parameters, the reader is referred to Manfredi et al., 2022). Note that the selection of the sets of input accelerograms does not follow strictly code-compliant criteria (such as those related to the admissible upper and lower tolerance), because the scope of this application is finding sets of recorded and simulated motions with average broadband spectral shapes that are consistent to each other. Note that no scaling factors were applied to the selected motions, meaning that, for all analyses, unscaled signals are adopted, and that the primary horizontal component (i.e. the best-matching component) is selected. Due to the difficulties in finding unscaled recorded motions satisfying these restraints, a maximum of two accelerograms from the same event was permitted, and regarding soil conditions, site class B was allowed together with class A. As expected, when considering BB-SPEEDset, it was much easier to satisfy the search criteria, as demonstrated by the smaller scatter with respect to the target spectrum that can be achieved by the set of simulated accelerograms. This is illustrated in Figure 6, which compares the individual and average elastic acceleration Sa (top) and displacement Sd (bottom) response spectra of the two sets of recordings (left) and simulations (right) with respect to the target design spectrum. Note that PBS provide non-ergodic estimates of earthquake ground motions, constrained by the region- and site-specific modeling of source, path, and site effects, having therefore the potential of improving their accuracy and reducing the sources of variability for seismic hazard and risk assessment (Stupazzini et al., 2021). Furthermore, the availability of wider sets of candidate accelerograms, within the same target (M, r, S) range, allows for optimization in the selection of the final suite of accelerograms.
Table 2 lists a selection of metadata and IMs of the two sets. A graphical representation of the distribution of MW-Repi (epicentral distance), D5-95 (i.e. time interval between 5% and 95% of the total Arias intensity, IA), Sa (0.1 s) and Sa (1 s) is provided in Figure 7. Both recorded and simulated time series span similar ranges of MW between about 6 and 7.6, and Repi from about 2 to 35 km. Such a consistency of the (MW-Repi) range of the two sets is an important, not obvious, outcome, as no specific constraints on MW and Repi were imposed in the selection procedure. Rather, this was indirectly ensured by the broadband spectral compatibility, as discussed by Smerzini et al. (2014). As a consequence, the Arias intensity and duration parameters, IA and D5-95, lie within a consistent range for the two sets. Note that, as a further advantage of enforcing a broadband spectral compatibility, the same ground motion set can be applied to elastoplastic SDoF with different vibration periods.
Details on the two sets of recorded (NGA-West2) and simulated (BB-SPEEDset) ground motions used for validation
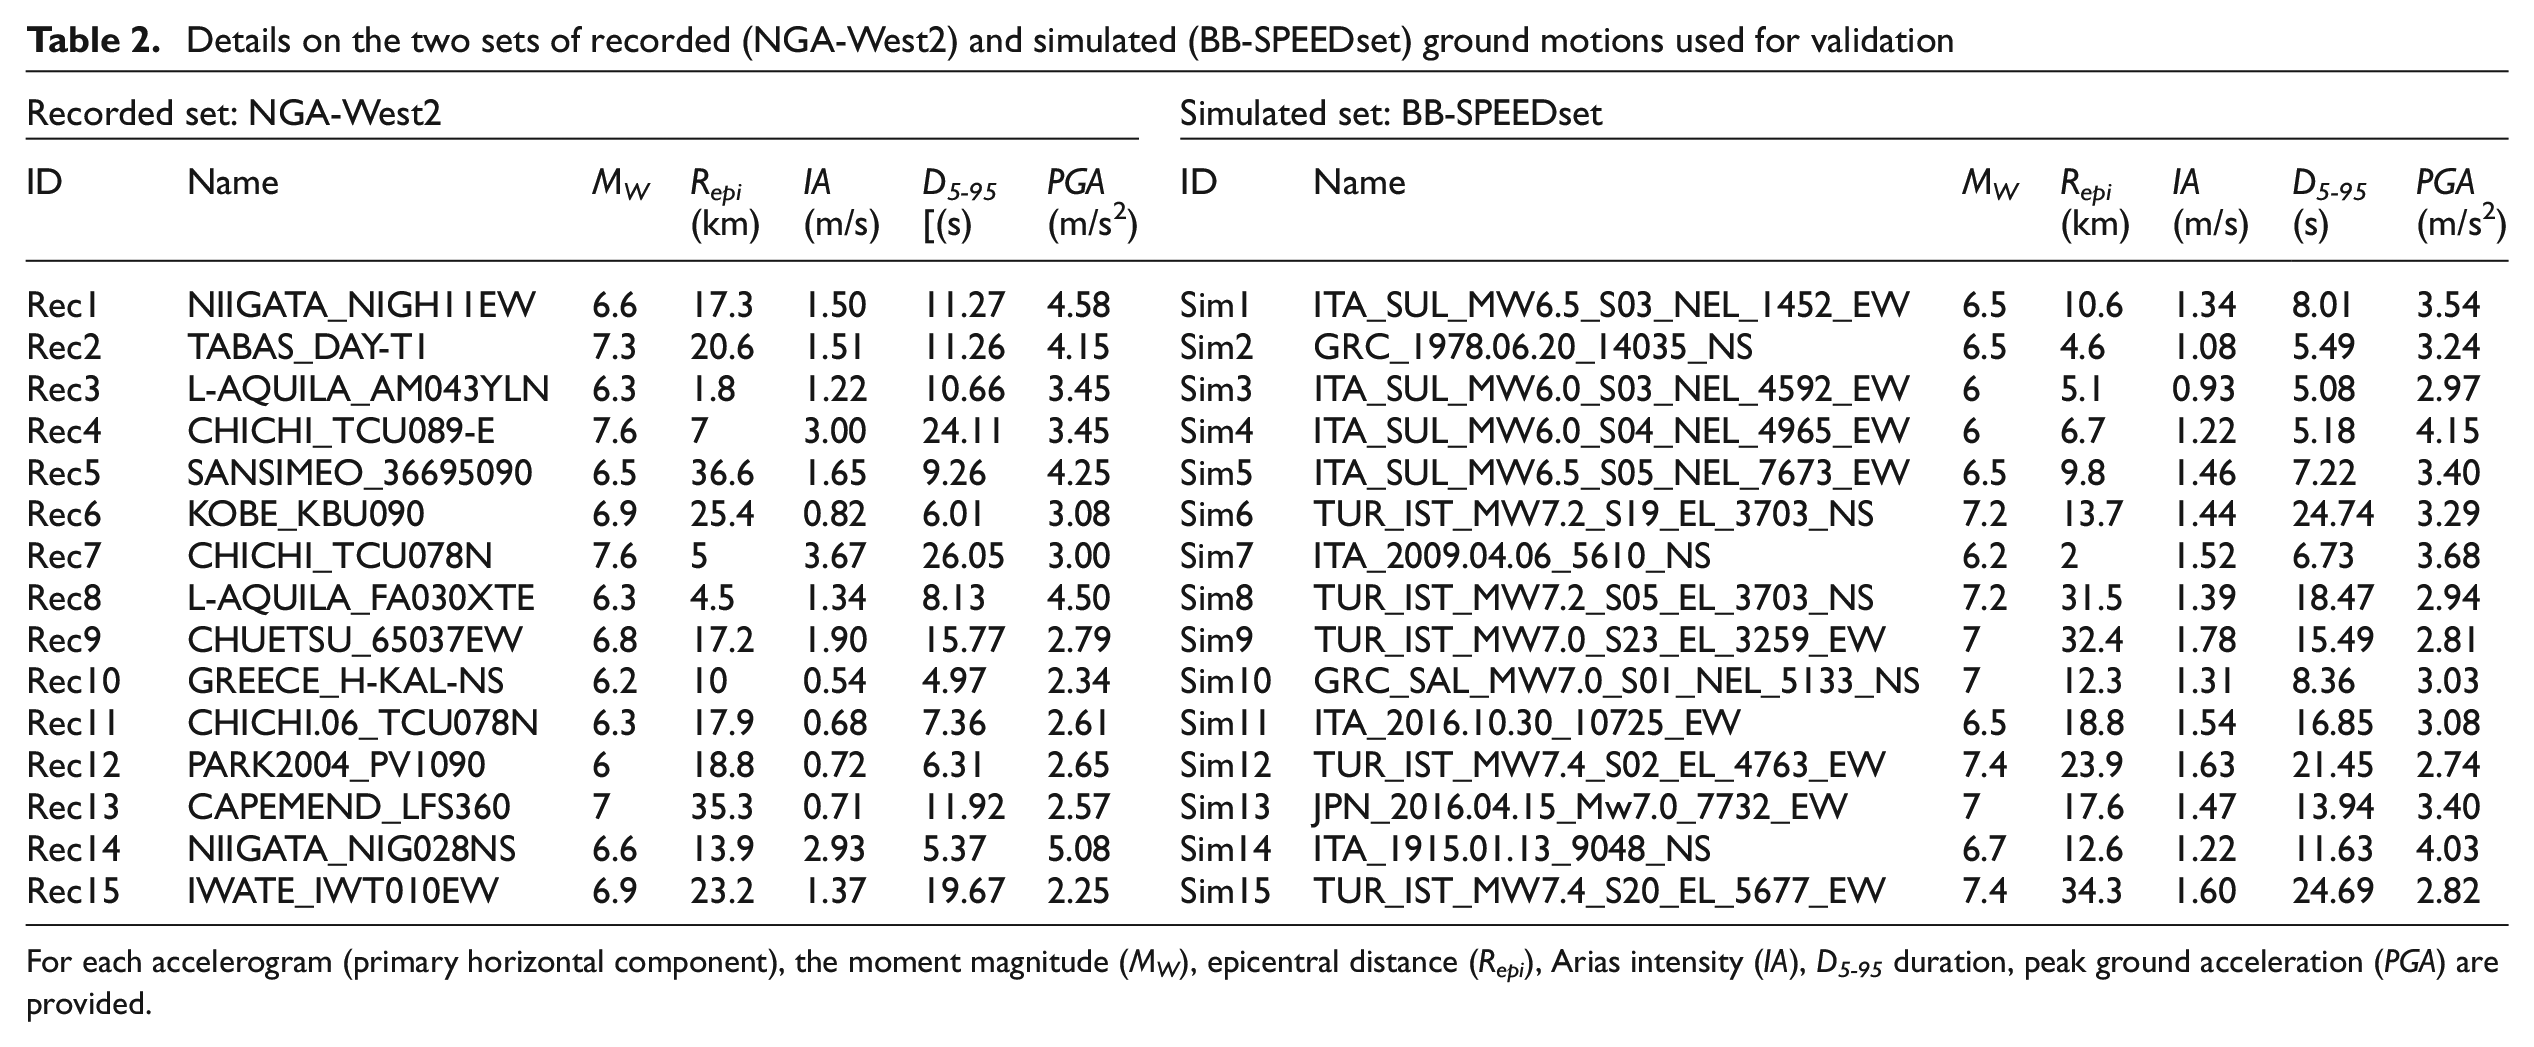
For each accelerogram (primary horizontal component), the moment magnitude (MW), epicentral distance (Repi), Arias intensity (IA), D5-95 duration, peak ground acceleration (PGA) are provided.
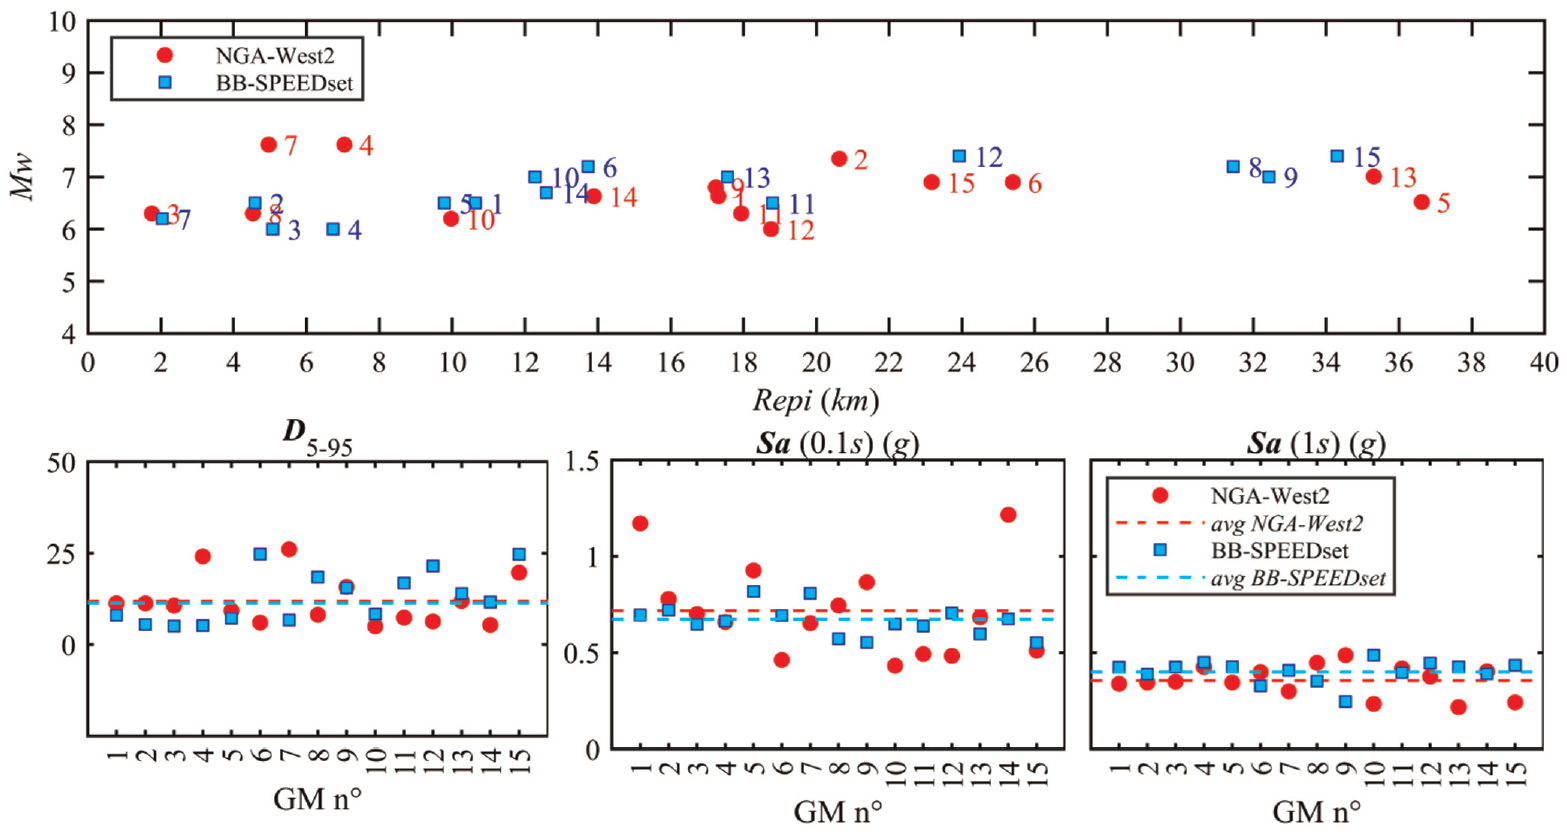
Distribution of the recorded (red) and simulated (blue) ground motion sets (see Table 2) in terms of: MW-Repi distribution, D5-95, Sa (0.1 s) and Sa (1 s). The dashed horizontal lines in the bottom plots denote the average IM values from the two sets of accelerograms.
Nonlinear SDoF systems and engineering demand parameters
The considered nonlinear SDoF systems are characterized by the same backbone elastoplastic (EPP) force–displacement relationship, defined by a bilinear shape with yield strength, Fy, and ductility capacity, µC (see Figure 8). The latter, evaluated as the ratio between the ultimate displacement (du) and yielding displacement (dy), is set equal to 10 (ductility limit). Note that, for simplicity, no hardening effects are considered in this study. A parametric study is carried out by varying the following parameters:
Fifteen elastic vibration periods, T, ranging between 0.1 and 1.5 s, sampled at 0.1 s step;
Four different strength reduction factors, R (defined as the ratio of the maximum force of the corresponding linear-elastic SDoF system, Fe, over the yield strength, Fy), investigating multiple nonlinearity levels, from mildly inelastic to severely inelastic systems (R = 2, 4, 6, 8);
Three hysteretic relationships, as shown in Figure 8, namely, (a) EPP-nn: representing non-degrading and non-evolutionary structures, that is, without stiffness and strength degradation during unloading cycles; (b) EPP-dn: with stiffness degradation but without strength degradation; (c) EPP-dd: representing more realistically degrading and evolutionary structures, with both stiffness and strength degradation.
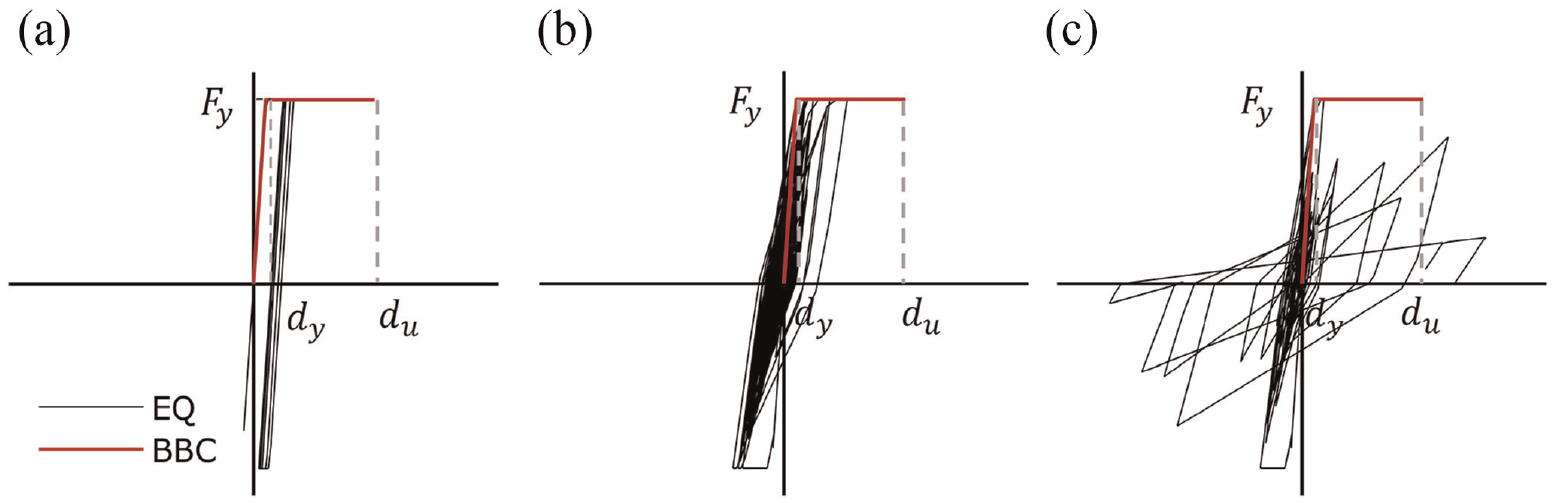
Hysteretic models for the characterization of the SDoF systems with elastoplastic backbone curve (BBC): (a) EPP-nn: non-degrading and non-evolutionary structures, (b) EPP-dn: degrading and non-evolutionary structures, and (c) EPP-dd: degrading and evolutionary structures.
Recalling that R = Fe/Fy and that Fe is a ground motion specific quantity, a constant value of Fy can be computed for each SDoF system with a given R in an average sense, as ratio of the mean Sa (at the given oscillation period) over the R value:
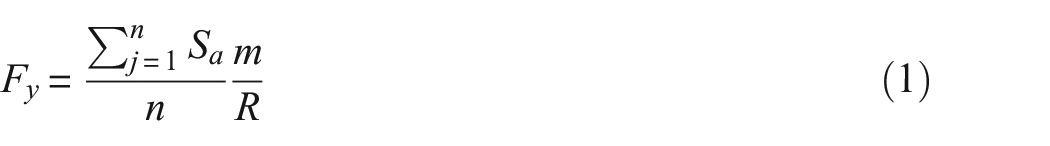
where n is the number of accelerograms and m is the mass of the SDoF system. This implies that the backbone curve is not motion-specific, instead it may slightly change between the two sets of ground motions, since the numerator of Equation 1 is not constant. This implements a “constant-strength approach” (Iervolino et al., 2010) and it is adopted in this case because it is more appropriate to assess the effect of different sets of accelerograms on the same structure.
The EDPs are selected to investigate both the peak and cyclic seismic demand (graphically illustrated in Figure 9), specifically:
For the peak response, the ductility demand normalized with respect to R:
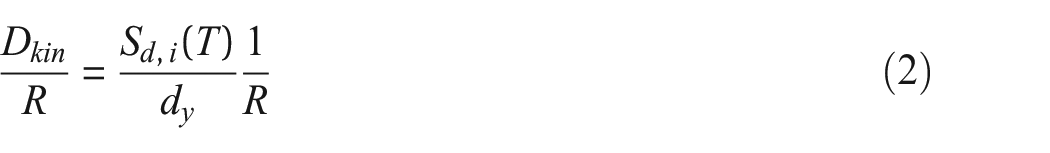
where Sd,i (T) is the peak inelastic displacement computed for the EPP SDoF at vibration period T for a given value of R (see Figure 9a) and dy is the yield displacement. Note that the normalized ductility of Equation 2 coincides with the ratio between the maximum inelastic displacement and the elastic one, that is,
For the cyclic response, the equivalent number of cycles, Ne, is defined as follows:
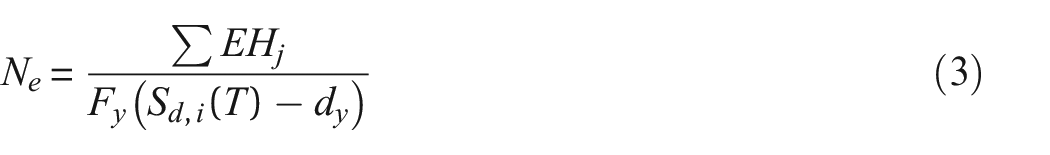
where EH is the hysteretic energy calculated by the area of a loading–unloading hysteresis cycle. Therefore, Ne is an energy-based parameter provided by the EH cumulated over all cycles, normalized by energy stored in the largest cycle, evaluated as the area underneath the monotonic backbone curve from the yield displacement to the peak inelastic displacement.
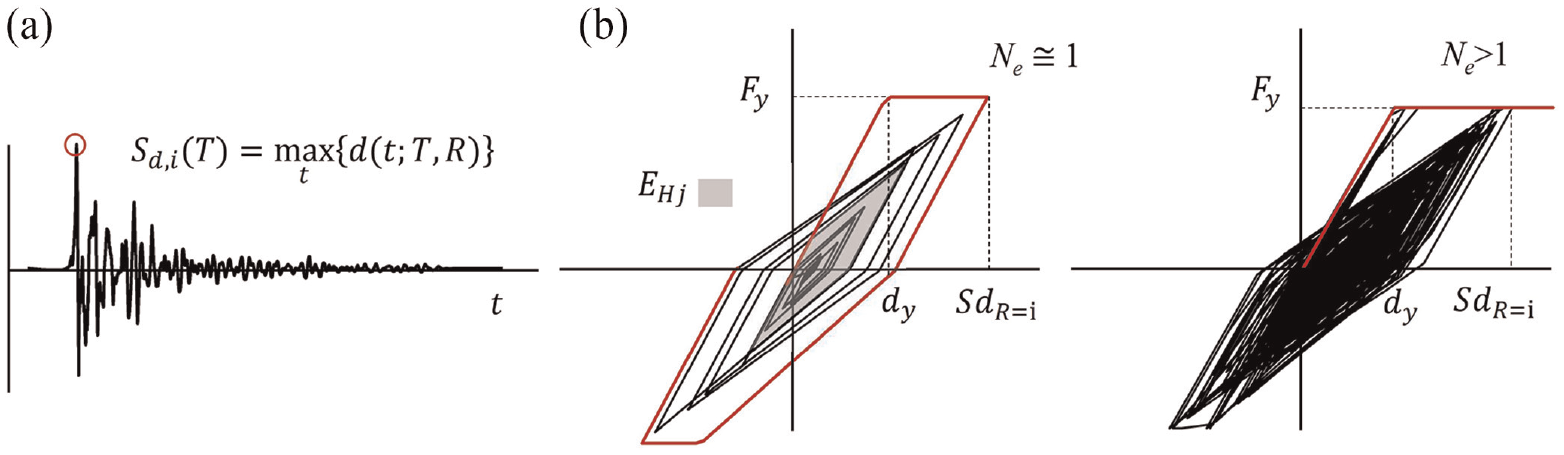
EDPs selected to be representative of both peak and cyclic seismic demand: (a) ratio between displacement ductility and strength reduction factor, Dkin/R and (b) equivalent number of cycles, Ne.
Results
This section focuses on the presentation and discussion of the results of the engineering validation introduced in the previous section, reminding that the validation objective is to assess whether the simulated ground motions provide predictions of inelastic structural response consistent with that from recordings, under similar working assumptions.
To better illustrate the validation outcomes, Figure 10 shows the response of the EPP-nn SDoF with T = 1 s, when subjected to a pair of spectrally consistent accelerograms, recorded (left) versus simulated (right), in terms of displacement time history, d(t), and displacement-base shear, d-Vb, hysteresis cycles. For each base accelerogram, results obtained for R = 2 and R = 6 are compared. On each plot, the resulting values of the two selected EDPs, Dkin/R and Ne, are also indicated. Note that the response histories under recorded and simulated accelerograms are not directly comparable, since the input ground motion time histories, albeit spectrally consistent (on average for the entire set), are different. Results in Figure 10 point out that: (1) regardless of the level of R, because of the relatively large value of T of the SDoF, the equal displacement rule holds, yielding to
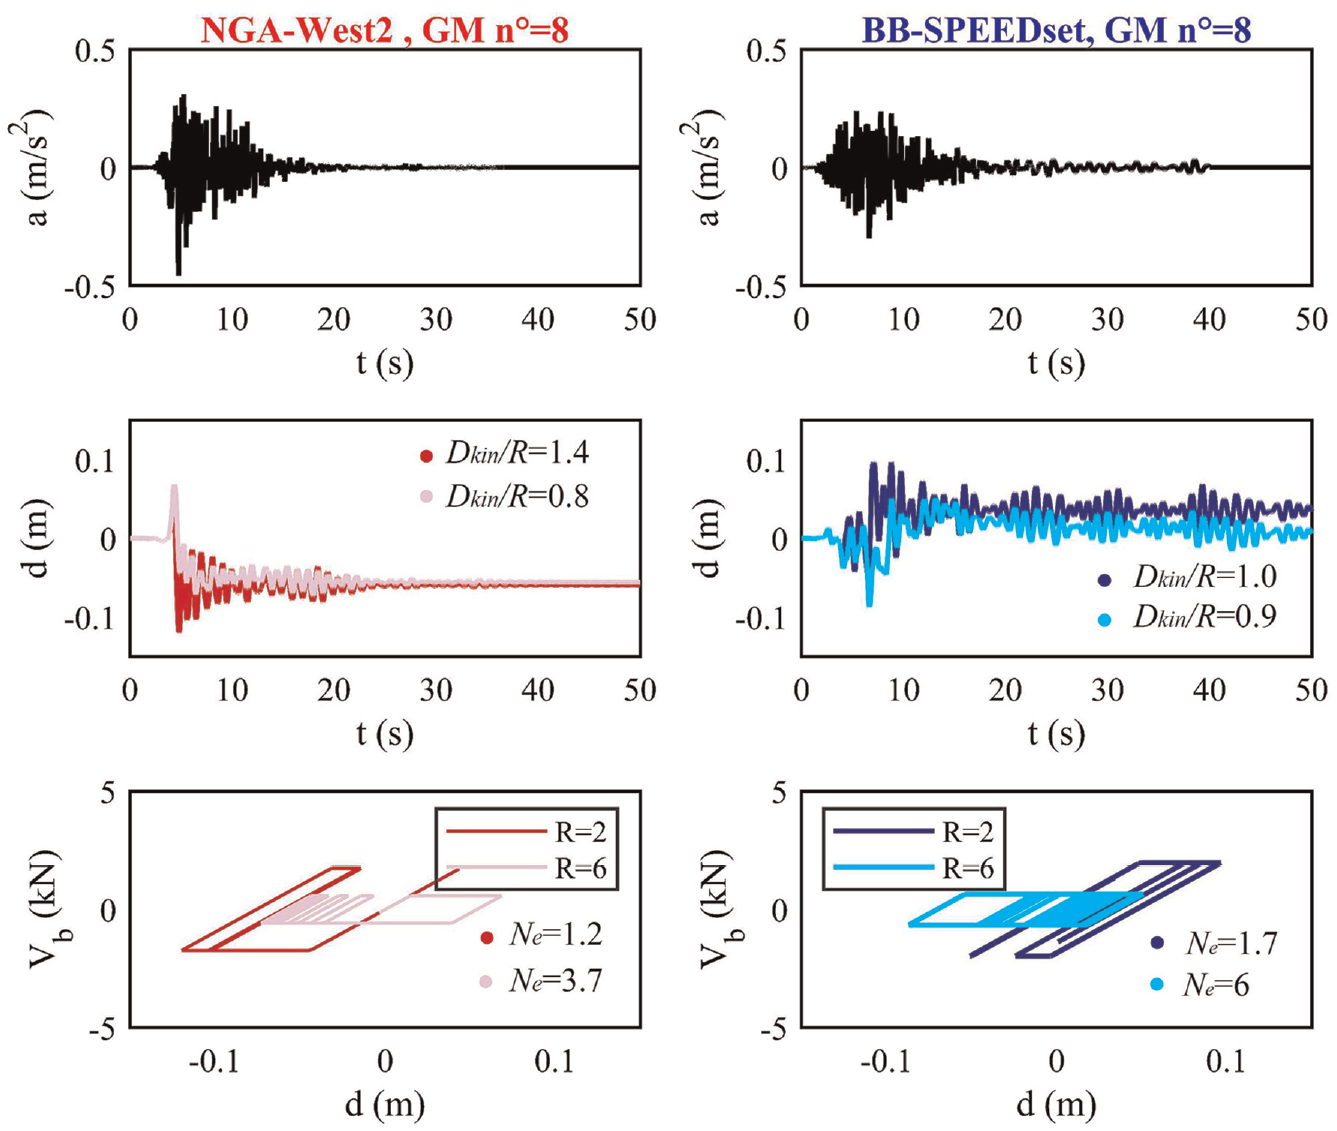
Response of the SDoF system (EPP-nn) with T = 1 s, for both R = 2 and R = 6, subjected to selected recorded (left) and simulated (right) accelerograms (as shown in top panel): time history of displacement (d, center) and displacement-base shear (d-Vb, bottom) hysteresis cycles.
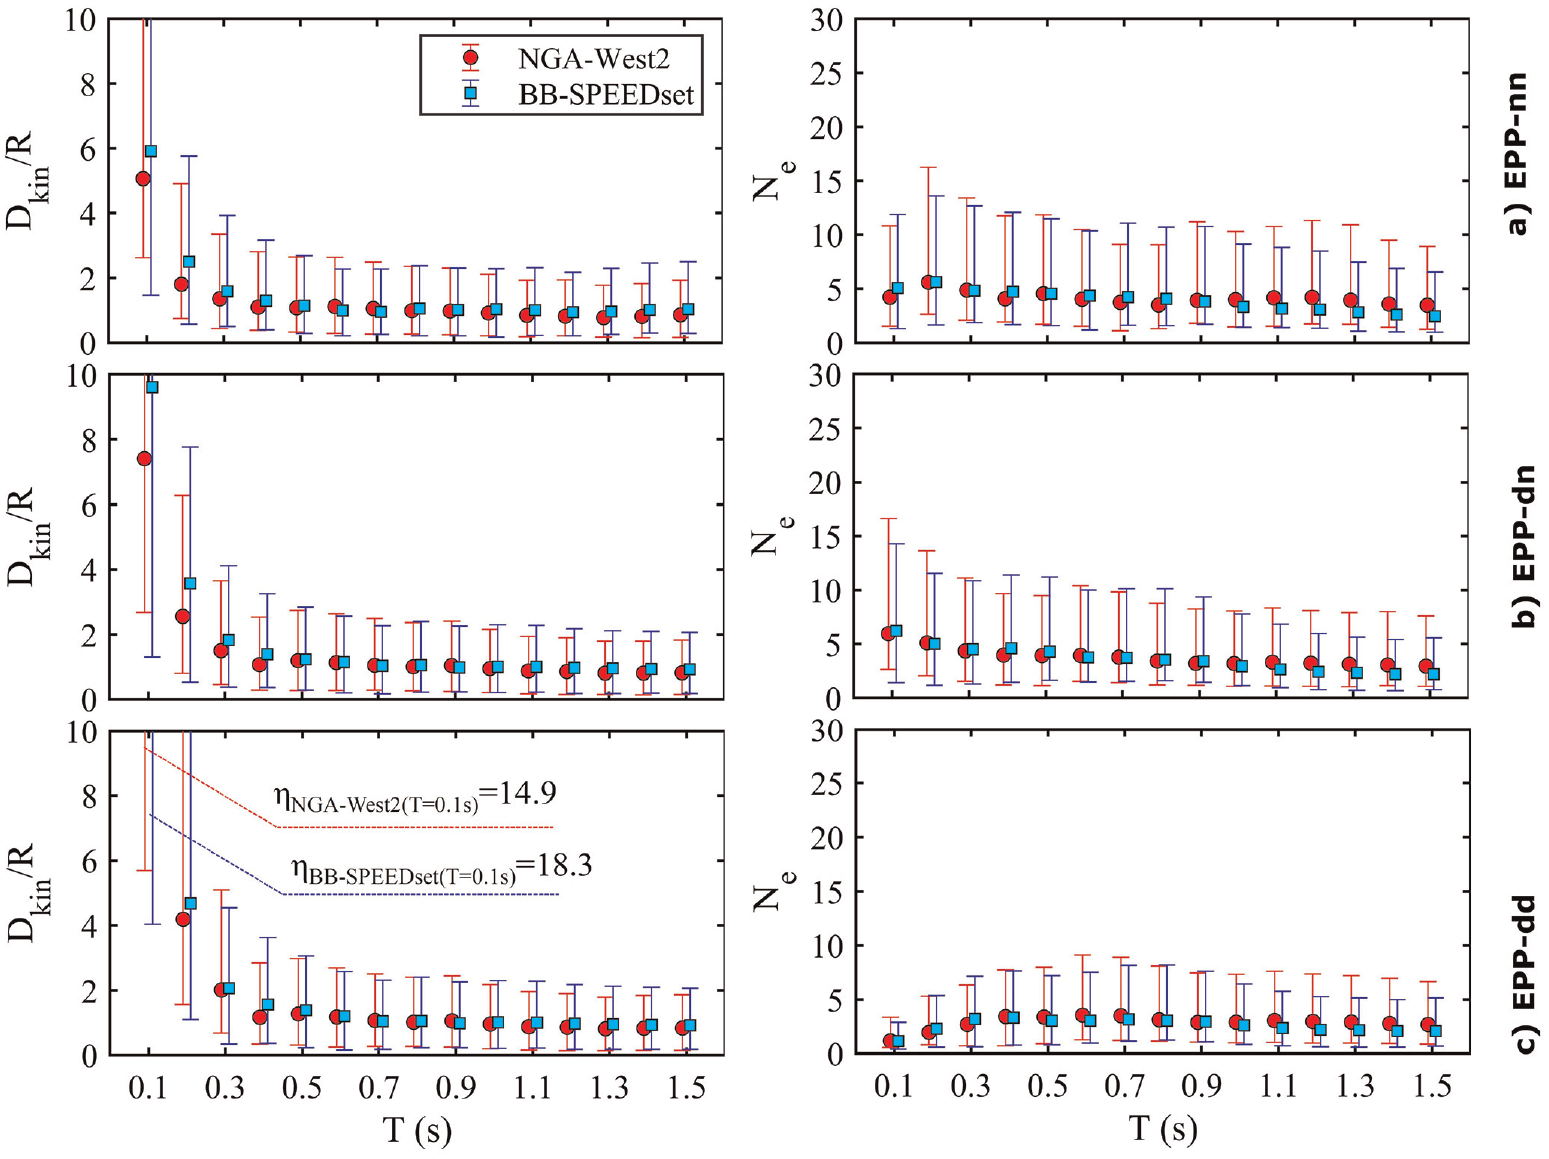
Results obtained for all vibration periods, R values, and for the three hysteretic laws were processed to compute the statistical distribution of the two EDPs under consideration for both sets of recorded and simulated ground motions. Figure 11 shows the median, 16th and 84th percentiles of both Dkin/R (top) and Ne (bottom), as obtained from the recorded and simulated accelerograms, as a function of the vibration period, for two levels of nonlinearity (left: R = 2: right: R = 6). In this figure, the EPP-nn law is considered.
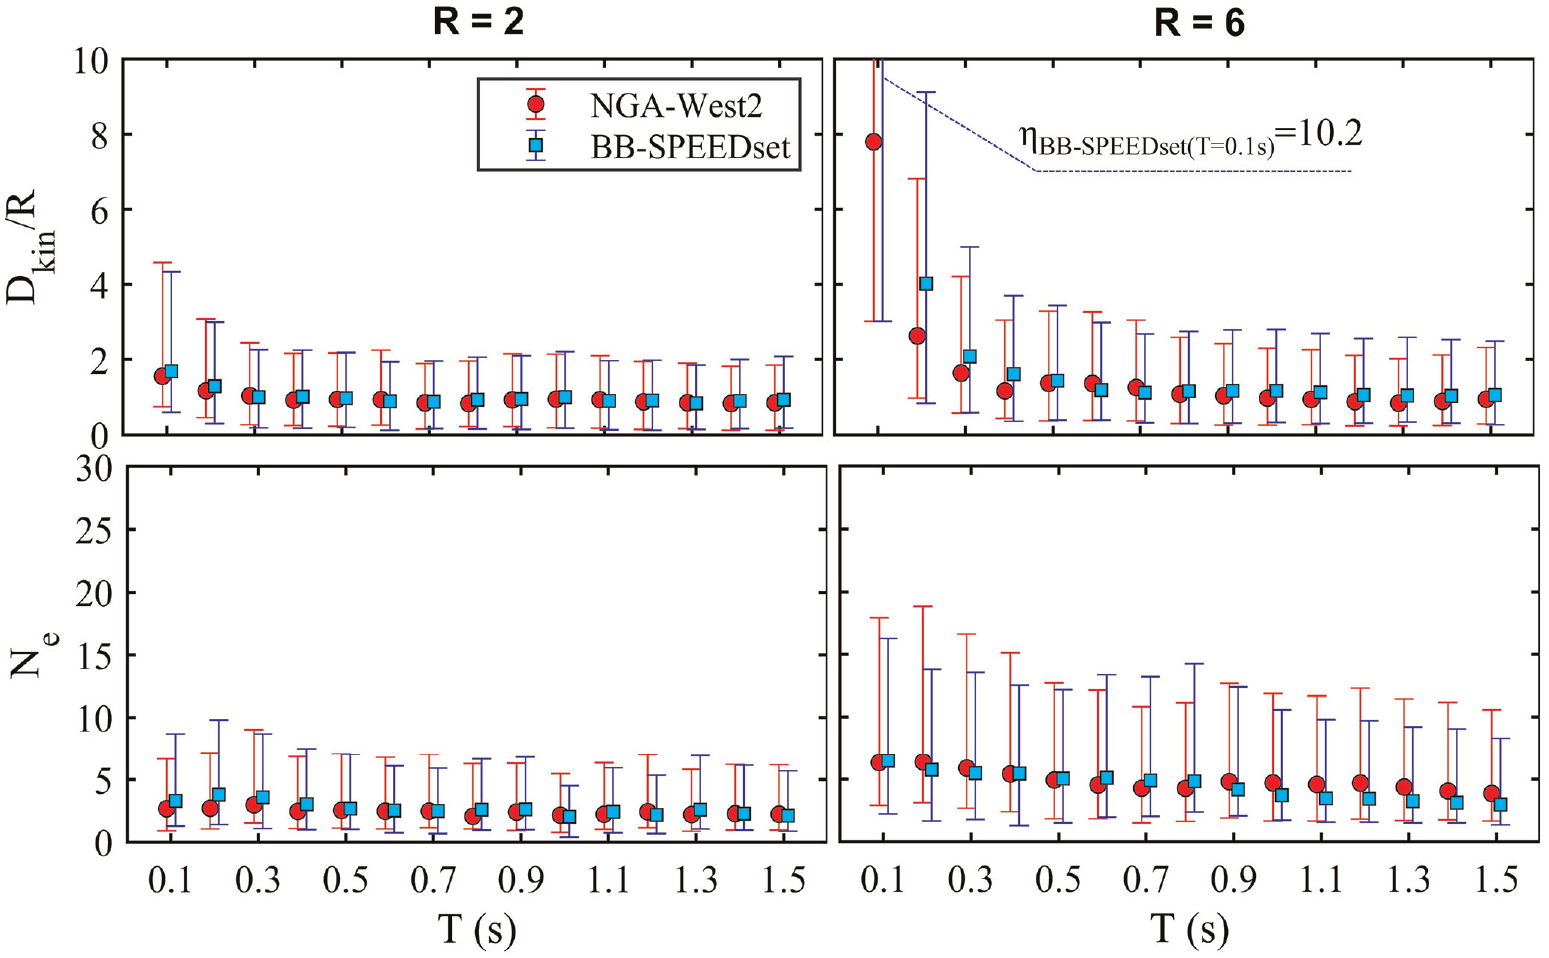
Statistical distribution (dots/squares: median; bars: 16th and 84th percentiles) of Dkin/R (top) and Ne (bottom) for the EPP-nn SDoF systems from recorded (dots, red) and simulated (squares, blue) sets of input motions, for two R values (left: R = 2; right: R = 6).
The behavior of Dkin/R as a function of T reflects the well-known features of inelastic response. At long periods, in the displacement-sensitive region, the peak displacement of an elastoplastic system is independent of R and it is essentially equal to the peak elastic displacement (i.e. equal displacement rule). At short periods, in the acceleration-sensitive region, the peak inelastic displacement is always larger than the elastic one and the ductility demand may be significantly larger than R.
In general, a good agreement is found between recordings and simulations for both peak and cyclic seismic demands, not only in terms of median values (dots/squares in Figure 11) but also in terms of standard deviation (vertical bars). Discrepancies on median estimates are limited to maximum overpredictions of simulations of 40%, which occurs in a very limited period range (≤ 0.2 s) and for large values of R (≥ 4). Furthermore, differences for all other periods are below around 20% and no systematic biases are found for both EDPs. As expected, the match between the two sets of input motions is excellent for low values of R (see R = 2, where differences are practically negligible), while it tends to reduce slightly for higher levels of R, owing to stronger contribution of nonlinear effects to the overall response, especially in the short period range (< 0.5 s). In such conditions, we note that the variability of Dkin/R, as estimated from the simulations, tends to be slightly larger than that obtained from the recordings, although the recorded set shows a larger dispersion in terms of input Sa with respect to the simulated one (see Figure 6, top). Instead, a reverse trend is found for Ne, that is, the dispersion from recordings is slightly higher than that from BB-SPEEDset. Although differences are small and hardly relevant from a practical point of view, sensitivity studies on a larger set of ground motions and more complex structural types are planned to point out potential biases.
Figure 12 shows the effect of the hysteretic model on the validation. Specifically, in this figure, the median (±standard deviation) of Dkin/R (left) and Ne (right) as a function of T, for R = 4, from both recorded and simulated signal sets, is illustrated for the three hysteretic models under consideration: (1) EPP-nn, (2) EPP-dn, and (3) EPP-dd (see Figure 8). No particular dependency on the hysteretic model is found, at least for these simplified EPP SDoF systems. We note that at shorter periods (≤ 0.2 s), passing from the EPP-nn (see Figure 12a) to the EPP-dd (see Figure 12c) system, Dkin/R tends to increase and, instead, Ne decreases. Such a reduction of Ne is due to the significant strength degradation occurring at high nonlinearity levels, leading the EPP-dd systems to reach more easily the residual strength branch of the backbone curve, hence limiting the number of hysteresis loops. In all three cases, as commented previously with reference to Figure 11, no systematic biases are found between simulations and recordings, confirming the validity of the analyses obtained from simulated input motions.
Effect of the hysteretic model: statistical distribution (dots/squares: median; bars: 16th and 84th percentiles) of Dkin/R (left) and Ne (right), for R = 4, from recorded (dots, red) and simulated (squares, blue) sets of input motions, for: (a) EPP-nn, (b) EPP-dn, and (c) EPP-dd (see Figure 8).
Insights from pulse-like ground motions
Ground motions recorded in the proximity of the source of an earthquake can have significantly different features than those recorded at large distances in terms of amplitude, directionality, duration, and frequency content owing to the strong influence of the fault rupture process (see Pacor et al., 2018 in relation to the NESS data set of near-source recordings). Such features can adversely affect the seismic performance of structures and thus be crucial for the estimation of earthquake impacts. Typically, sites located in front of the fault rupture may be affected by forward-directivity effects, experiencing pulse-like motions in which much of the seismic energy is concentrated in one intense velocity cycle with pulse period TP (Somerville et al., 1997). Different methods have been proposed to identify pulse-like waveforms and to estimate the corresponding TP, using mainly wavelet transform analysis (Baker, 2007; Shahi and Baker, 2014) as well as to predict empirically TP and related peak IMs as a function of selected scenario earthquake variables (Bray and Rodriguez-Marek, 2004; Somerville, 2003; Spudich et al., 2013).
With this premise, this section aims at gaining some insights into the capability of PBS to capture the inelastic structural behavior, also when the structure is subjected to pulse-like accelerograms. To this end, using S&M, a set of seven BB-SPEEDset signals, compatible with the same EC8 target spectrum as adopted for previous analyses, are selected with the additional constraint that waveforms are identified as pulse-like with TP falling in the range [1–3] s, according to the algorithm by Shahi and Baker (2014). Note that this classification algorithm provides the pulse period and the corresponding orientation in which the pulse is the strongest. This implies that the selection is performed on the pulse orientation component, that is, the horizontal component projected along the azimuth, which maximizes the impulsive behavior. The same spectral compatibility criteria as adopted previously for ordinary motions (see the section “Seismic input: real and simulated ground motion sets”) are considered also herein for the impulsive motions.
Figure 13 shows the set of seven spectrum-compatible impulsive ground motions in terms of Sd (mean and individual curves) in comparison with the target code spectrum as well as in terms of (MW-Repi-TP) distribution. Note that a rather narrow distribution is found with MW in the range [5.8–7], Repi in the range [4–14] km and TP between 1.4 and 2.2 s. Further details on the set of impulsive motions are provided in Table 3.
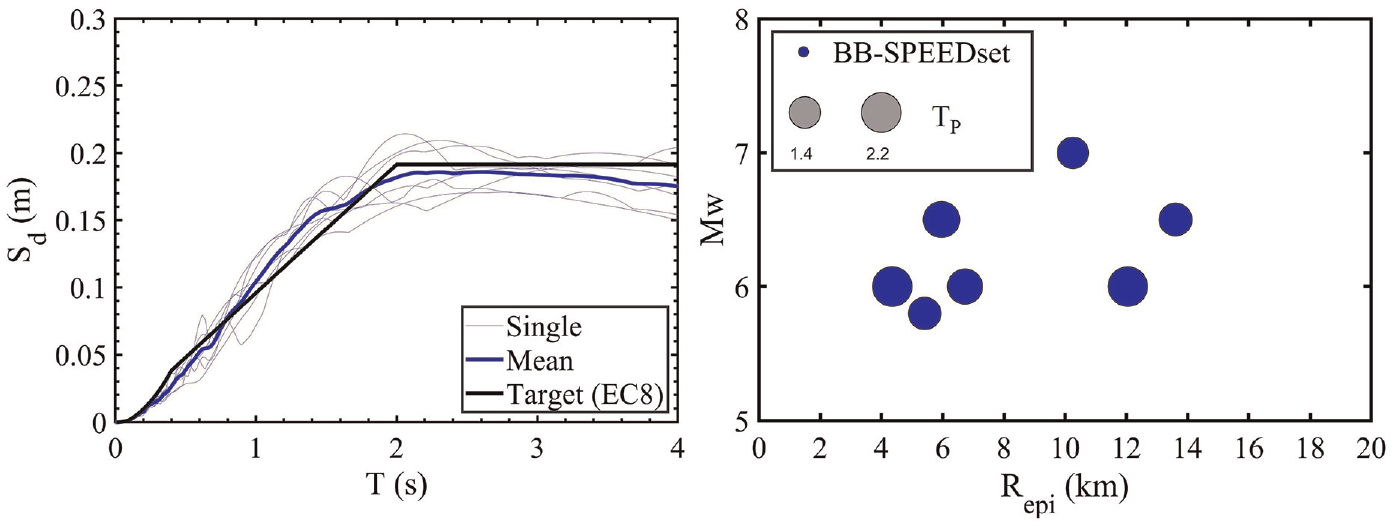
Set of spectrum-compatible pulse-like waveforms from BB-SPEEDset: Sd of the set with respect to the target (left) and (Mw-Repi-TP) distribution (right, gray dots at top left are for TP scale reference). Further details on input motions can be found in Table 3.
Details on the set of seven spectrum-compatible simulated waveforms with pulse-like features
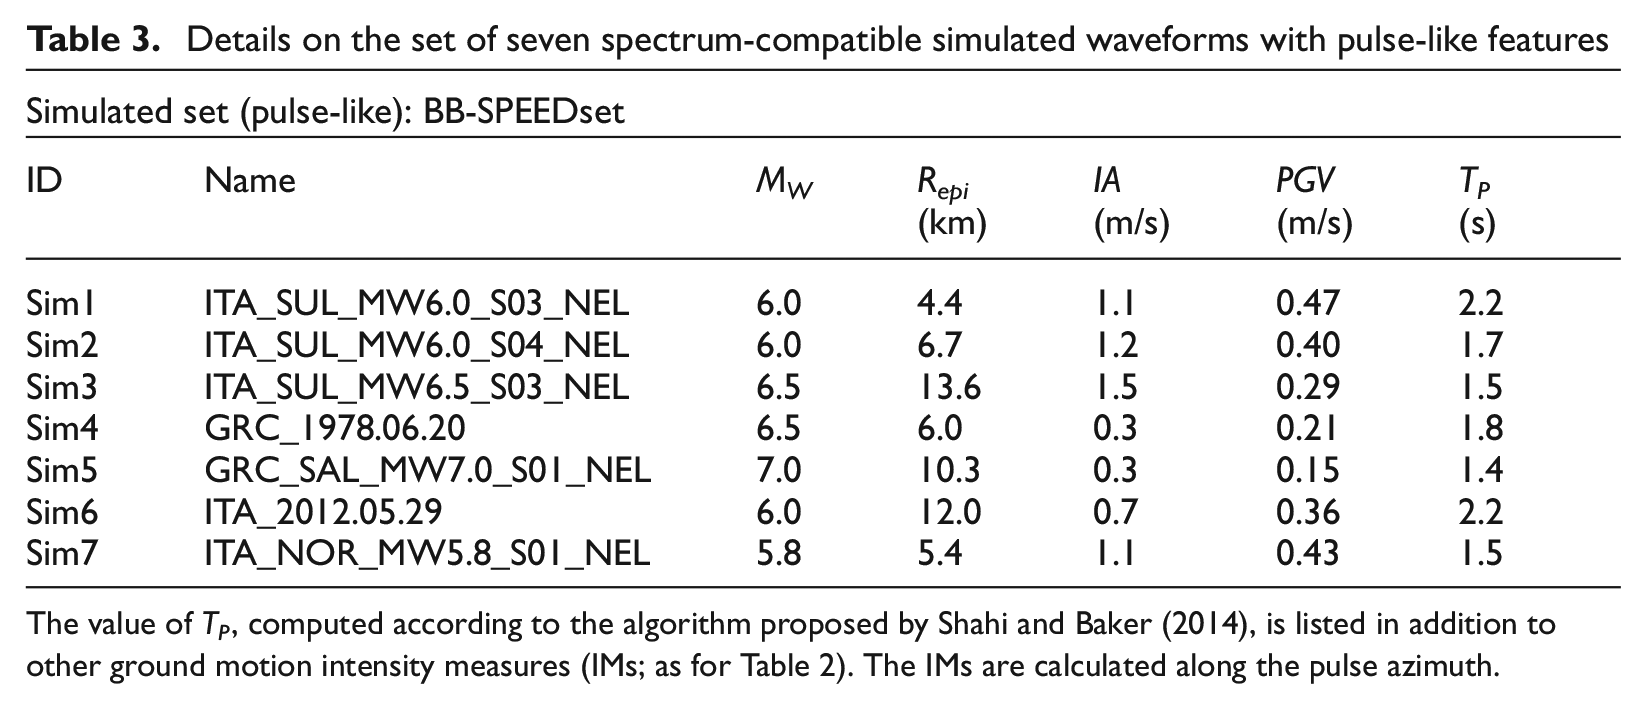
The value of TP, computed according to the algorithm proposed by Shahi and Baker (2014), is listed in addition to other ground motion intensity measures (IMs; as for Table 2). The IMs are calculated along the pulse azimuth.
Each impulsive simulated accelerogram is then considered as base excitation of a suite of SDoF systems (EPP-nn) with variable T and R. Figure 14 shows the trend of Dkin/R (median ± standard deviation), for R = 2, 4, and 6 (from left to right), as a function of the ratio T/TP, in comparison with the empirical relationship (Equation 5 cit.) proposed by Iervolino et al. (2012), referred to as IE12 (black line). Note that Dkin/R corresponds to the inelastic displacement ratio, CR, in IE12. The IE12 relationship was derived by a two-step nonlinear regression using a data set of 81 NGA records, identified as pulse-like along the FN component, with MW in the range [5.2–7.9]. The functional form of such relationship was defined to reflect the higher inelastic-to-elastic displacement ratios, which are observed for impulsive motions, in the range of periods between about 30% to 50% of TP, with respect to non-impulsive (i.e. ordinary) motions.
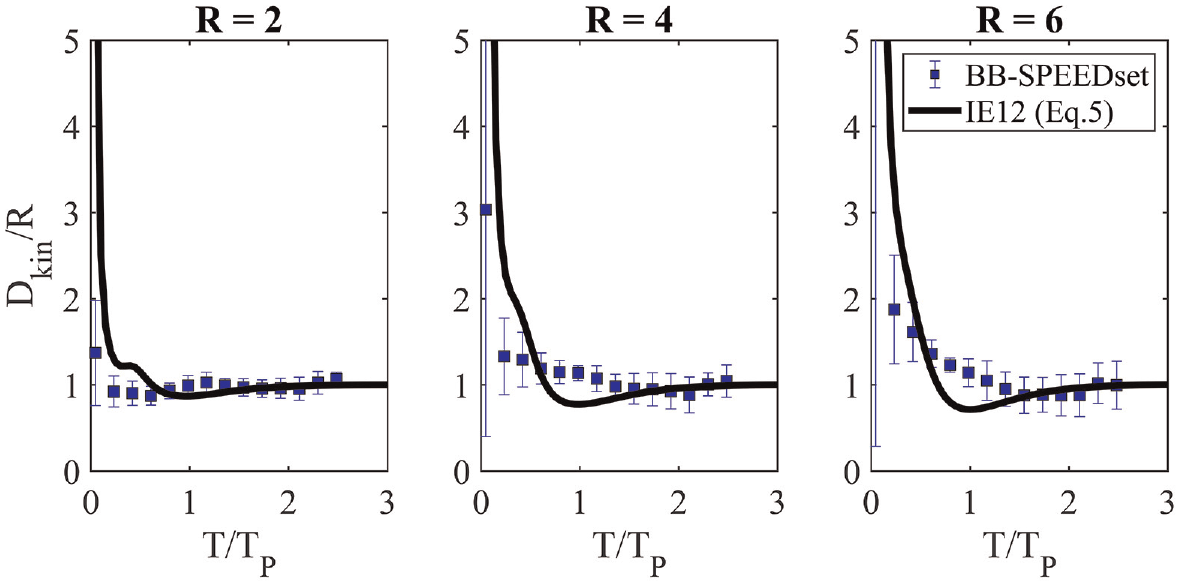
Behavior of Dkin/R (for R = 2, 4, and 6, from left to right) as a function of T/TP, as obtained from the set of simulated pulse-like waveforms (median ± σ), in comparison with the empirical relationship derived by Iervolino et al. (2012), referred to as IE12.
The analyses support the validity of the equal displacement rule for T/TP larger than about 1–1.4, depending on the R factor. Furthermore, results indicate that there is a satisfactory agreement between the statistical trend of the results from PBS with the IE12 relationship, for the different levels of R factors, in spite of the limited number of simulated motions considered for this analysis. Some discrepancies are found at low T/TP values, below about 0.5, where IE12 provides higher estimates than PBS, owing to the inherent tendency for the CR to reach very large values in the acceleration-sensitive region (i.e. T less than about 0.5 s). Furthermore, also in the range of T/TP between about 0.5 and 1 s, PBS give higher inelastic displacement demands (of about a factor of 20%–30%), especially for larger R factors. Although the investigation of such dependency requires a larger amount of accelerograms, expected to be available in future releases of BB-SPEEDset, this may be due to an aggravation of pulse-like behavior of the simulated motions, which tend to be more coherent than real ones because of the oversimplifications of the source and velocity models. This is in line with the findings by Teng and Baker (2019), who also observed somewhat excessive pulse features in the near-fault seismograms simulated within the Southern California Earthquake Center BroadBand Platform (SCEC BBP) and explained them in terms of the strong coherence in some kinematic fault rupture models.
Conclusion
While there is a general consensus that PBS of earthquake ground motion are one of the most promising tools to face the sparsity of records in near-source and complex geological conditions, that often prevents a proper definition of seismic input, there is no similar consensus on the validation procedures and related acceptance criteria that simulated accelerograms should pass before being usable for engineering applications.
In line with similar efforts available in the literature (Bradley et al., 2017; Rezaeian et al., 2023), in this article, we have made an attempt to propose a common validation framework, enhancing the specific applications associated with the PBS. With respect to the framework proposed by Rezaeian et al. (2023), focused on the single simulation outputs, this article addresses the engineering validation of a whole data set of PBS ground motions. As a matter of fact, it is often recognized that the availability and open-source dissemination of validated data sets of simulated broadband accelerograms may be one of the keys to solve the problem of input ground motion selection, for either NLTHA of structures or for geotechnical earthquake engineering problems. This is especially true when the specific constraints for ground motion search, typically in terms of seismological, spectral and site compatibility, make it hard to find a sufficient number of records satisfying such constraints (e.g. near-source and complex site conditions, specific magnitude ranges and faulting styles), unless at the price of unphysical scaling/matching options on records.
The considered data set, BB-SPEEDset (Paolucci et al., 2021a), is obtained from the PBS of several earthquakes in a relatively broad range of magnitude, faulting styles and geological contexts, and is conceived to provide scientists and practitioners with broadband accelerograms complementary to recordings. While in the study by Paolucci et al. (2021a) a seismological validation of BB-SPEEDset was carried out with respect to a near-source records data set (NESS2, Sgobba et al., 2021), in this work, we have addressed the validation of BB-SPEEDset, in relation to the prediction of inelastic structural response quantities.
For this purpose, records from the NGA-West2 data set and BB-SPEEDset accelerograms were first selected according to the same spectral compatibility criteria with a common target design spectrum, taking advantage of the S&M software specifically developed for selection of ground motions from hybrid (recorded and simulated) data sets. Second, the two sets of accelerograms were used as input for NLTHA of elastoplastic SDoF systems. Finally, with reference to two representative EDPs, namely, the normalized ductility demand (i.e. inelastic-to-elastic displacement ratio) and the equivalent number of hysteresis cycles, an excellent agreement was found, showing that the utilization of the PBS data set does not yield any systematic bias with respect to records when as input motions for NLTHA.
As a further application of BB-SPEEDset, an example of selection of spectrum-compatible pulse-like simulated motions is provided, obtaining a set that would be hardly achievable with unscaled pulse-like records. Results of NLTHA of SDoF subject to this set of input motions show that inelastic-to-elastic displacement demands from PBS are in good agreement with empirical relationships available from the literature and calibrated on a relatively wide set of impulsive records.
The most relevant conclusion of this work is that the engineering use of broadband simulated accelerograms included in the BB-SPEEDset does not imply any significant bias with respect to recorded accelerograms, neither in terms of median values of EDPs nor in terms of their dispersion. The successful validation of BB-SPEEDset, from both a seismological and engineering perspective, in a broad frequency range, represents the seminal requirement for strengthening the utilization of data sets of simulated accelerograms by the engineering community. The availability of such data sets, covering sufficiently wide ranges of (M, r, S), may be useful for a variety of engineering applications, such as:
Provide accelerograms in place, or in addition, to records in those conditions that are still poorly sampled by recordings (e.g. near-source regions and very soft basin sites), without making use of either linear scaling or of spectral matching, which may alter significantly the physical nature of the input motions and, consequently, the meaningfulness of results;
Provide ensembles of input motions for NLTHA of critical structures (e.g. Nuclear Power Plants, see Abell et al., 2018; Castro-Cruz et al., 2021; Smerzini et al., 2023), containing those source-, region-, and site-specific features that may not be included in suite of motions extracted from global ground motion data sets;
Better constrain the input definition particularly for: (1) the calibration of both empirical and analytical fragility curves (Rosti et al., 2023; Zhang et al., 2023); (2) spatially variable multi-support excitations for the seismic analysis of infrastructure systems (Smerzini, 2018; Taslimi and Petrone, 2023); (3) specific near-field studies requiring sets of pulse-like ground motion series; (4) region-specific ground motions in large urban areas, including their spatial correlation (e.g. Chen and Baker, 2019; Infantino et al., 2021b; Schiappapietra and Smerzini, 2021).
We finally note that, similar to data sets of recorded accelerograms, the BB-SPEEDset is continuously updated as results of new PBS are made available to cover other geological and tectonic frameworks, such as low-magnitude shallow earthquakes from either induced seismicity (Paolucci et al., 2021b) or low seismicity regions (Smerzini et al., 2023), or from specific near-source conditions, such as pulse-like motions, fling step, and hanging wall effects.
Footnotes
Acknowledgements
This work was supported partly by the European Commission within the URBASIS Project “New challenges for Urban Engineering Seismology” H2020-MSCA-ITN-2018, grant agreement no. 813137, and by the Department of Civil Protection under the 2022–2023 DPC-ReLUIS WP4 and WP18 Projects. The authors are grateful to Manuela Vanini for her relevant contributions to the construction and maintenance of BB-SPEEDset and to all SPEED team for the efforts in the development and application of the code SPEED. This work has significantly benefited from the discussions within the COSMOS and the LBNL (Lawrence Berkeley National Laboratory) - PEER ground-motion simulation working groups. Remarks and suggestions from Ricardo Taborda and another anonymous reviewer contributed to the improvement of the article and are gratefully acknowledged.
Declaration of conflicting interests
The author(s) declared no potential conflicts of interest with respect to the research, authorship, and/or publication of this article.
Funding
The author(s) disclosed receipt of the following financial support for the research, authorship, and/or publication of this article: URBASIS Project “New challenges for Urban Engineering Seismology,” H2020-MSCA-ITN-2018, grant agreement no. 813137; 2022-2023 DPC-ReLUIS Projects WP4 “MARS—Seismic Risk Maps” and WP18 “Normative contributions related to seismic action.”
Data and resources
BB-SPEEDset (v1.0) is available at the following repository: https://speed.mox.polimi.it/bb-speedset/. Select&Match can be requested and downloaded using the following link: https://seismograph.me/s%26 m. The open-source Spectral Element code SPEED is available at ![]() . OpenSees models and data are available to any interested user on demand.
. OpenSees models and data are available to any interested user on demand.