
Abstract
Disparities in seismic risk mitigation programs can lead to uneven impacts during an earthquake and an increased burden on socially vulnerable and underserved communities. This article examines the extent to which the distribution of cripple wall retrofits in residential buildings (primarily one- and two-family units) located within the City of Los Angeles (LA), varies based on the sociodemographics of the affected populations. Utilizing multiple data sources including the LA Department of Building and Safety (LADBS) and LA Open Data Portal (LAOPD), a combination of spatial and statistical approaches are implemented at the regional, neighborhood, and census-tract scales. At each scale, the number of retrofitted buildings normalized by the total number of pre-1980 one- and two-family residential buildings (or retrofit rate) is the primary dependent variable. The effect of the Earthquake Brace and Bolt (EBB) program on the disparities in the retrofit rate distribution is also assessed. Despite having relatively older one- and two-family residential buildings, those neighborhoods with the highest representation of Black and Hispanic households are generally associated with lower retrofit rates. We also found that the neighborhoods with the lowest median income have retrofit rates that are less than the average for the entire City of LA. The rate among Black, Hispanic, and low-income households was found to increase significantly after the EBB program was instituted in 2013, suggesting that the initiative may have served as a mechanism to reduce the demographic and economic disparities in the cripple wall retrofits. However, to date, the average retrofit rate in the ten neighborhoods with the highest representation of Hispanic households is roughly one-third that of the rest of LA City.
Introduction
Background
Federal, state, and local authorities play an active role in reducing the impacts of earthquakes on communities. Public policies intended to mitigate seismic risk take on different forms, including ordinances that mandate the retrofit of buildings with known vulnerabilities and financial assistance to incentivise voluntary retrofits. These types of interventions are often accompanied by studies that assess the physical, economic, and, to a lesser extent, social impacts of the associated risk-reduction strategies. As an example, several California jurisdictions (e.g., San Francisco, Los Angeles, and Alameda) have enacted ordinances to mandate the retrofit of soft-story woodframe and non-ductile concrete buildings (Wiss, Janney, Elstner Associates, Inc., 2023). To strengthen the support for these policies, numerous investigations have quantified the reduced risk as well as cost-benefit implications of these retrofits at the individual building and portfolio scales (e.g., Burton et al., 2019; Liel and Deierlein, 2013; Yi et al., 2020). Comparatively, much less has been done to consider the potential sociodemographic disparities in the benefits provided by earthquake risk mitigation policies. Yet, many studies have shown that natural hazard events can have uneven impacts, especially among socially vulnerable and undeserved communities (e.g., Bolin and Stanford, 2006; Cutter et al., 2003; Fothergill et al., 1999).
The problem of older single-family dwellings (SFDs) with cripple walls has been underscored by several prior earthquakes. Cripple wall damage has been recorded for events dating back to 1983 (Coalinga, California) and as recent as 2014 (South Napa, California). A detailed survey of over 6000 buildings found that cripple wall damage was prevalent in pre-1960 SFDs following the 1989 Loma Prieta, California earthquake (Harris et al., 1991). A 1994 report by the United States Department of Housing and Urban Development (HUD, 1994) documented damage caused by the same vulnerability during the Northridge, California earthquake that occurred during the same year. Other reports such as the one by the Earthquake Engineering Research Center at the University of California, Berkeley, noted the common occurrence of sliding failure in cripple wall SFDs in the same earthquake (Stewart and Ashford, 1994). Following the 2014 South Napa earthquake, Rabinovici (2017) surveyed more than 600 households and found anecdotal evidence of the benefit (in terms of reduced likelihood of damage) provided by retrofit to cripple walls. In addition, a multi-university research project led by the Pacific Earthquake Engineering Research Center (PEER, 2020) used physical testing, structural response simulation, and probabilistic loss assessments to quantify the economic benefit of cripple wall retrofits in SFDs.
To reduce the seismic risk to SFDs with cripple wall construction, the California Earthquake Authority (CEA) created the Earthquake Brace and Bolt (EBB, 2022) program. Established in 2013, the grant-based EBB program gives eligible California homeowners up to $3000 to cover the cost of retrofitting SFDs with the cripple wall vulnerability. The grant funds are intended to cover the cost of two specific retrofit schemes: “bolting” the superstructure to the foundation and “bracing” the cripple walls using plywood or oriented strand board sheathing. However, seismic bracing or “strapping” of water heaters is also required as part of the retrofit. According to the EBB website, the cost of a retrofit performed by a licensed contractor can range from $3000 to $7000. To qualify for the EBB grants, several criteria must be met based on factors that include the specific zip codes covered by the program, the type of foundation, and the year of construction of the home.
For publicly funded programs such as the EBB, it is important to assess how the benefits are being distributed and whether specific groups are being systematically underrepresented. Patterns of social vulnerability are known to vary temporally and spatially, which requires a dynamic system of quantifying and incorporating these vulnerabilities into disaster risk mitigation programs, such as the EBB. Social vulnerability refers to a complex combination of demographic characteristics and social conditions that leads to a higher susceptibility to suffering harm from disasters for certain groups of population (Cutter and Finch, 2008). Therefore, having awareness of the characteristics of the population that is receiving mitigation assistance is valuable to gauge if some groups are being excluded or if they are getting covered proportionately by the programs. The neighborhoods in Los Angeles, as in many other metropolitan areas, have changed drastically (e.g., due to white flight and/or sprawling gentrification) over the past centuries, which in turn alters their sociodemographic make up. This leads to dynamic changes in social vulnerability that might converge or diverge from who is benefiting from seismic risk mitigation initiatives, thereby highlighting the need for assessments of representation within such programs.
Literature review
The intersection between social vulnerability and disasters has been studied from a number of different perspectives. An area that has received significant attention, especially in recent years, is the unequal impact of disasters on communities and the relationship to social vulnerability. A review of the literature by Fothergill et al. (1999) found that the consequences of disasters experienced by underserved communities were very different compared to those with greater access to resources. The authors cited prior works suggesting that these uneven impacts are often due to differences in the age and physical vulnerability of the residences that are occupied by under-resourced populations (Bolin and Bolton, 1986; Bolton et al., 1993). Other studies have examined the implications of social vulnerability to the reconstruction and recovery stages of the disaster cycle. Differences in the pace of disaster recovery by race and ethnicity have been observed across different hazard types including hurricanes (e.g., Finch et al., 2023; Flanagan et al., 2011), earthquakes (e.g., Bolin and Stanford, 2006; Comerio, 1998), and floods (e.g., Wilson et al., 2021). These differences have been attributed to lower incomes, lack of savings, higher rates of unemployment, minimal (if any) insurance coverage, and less access to information (Fothergill et al., 1999; Peacock et al., 1997).
Disparities in disaster risk reduction efforts have also been studied from the viewpoint of how aid is being distributed. Domingue and Emrich (2019) analyzed county-level data on the public assistance provided by the Federal Emergency Management Agency following major disaster declarations to determine whether there were procedural inequities that led to disparate outcomes. Wilson et al. (2021) utilized empirical knowledge from a review of academic and gray literature to synthesize existing information on disparities in access to flood disaster assistance and outcomes. In the engineering literature, frameworks have been developed to consider issues of equity and disparate impacts in disaster risk mitigation efforts. A related study by Kavvada et al. (2022) formulated a bi-objective optimization model to prioritize seismic retrofit such that the combination of economic and environmental impacts is minimized with explicit consideration given to vertical equity. With the goal of realizing equitable disaster outcomes, Kim and Sutley (2021) developed a framework for designing disaster resource distribution programs that uses both physical and societal indicators to predict population impacts.
When examining the link between population vulnerabilities and disasters, a choice must be made about which societal indicators are considered and if/how they will be aggregated. Some of the most commonly considered factors include age, race and ethnicity, employment, income, and education. While most studies incorporate multiple factors, some focus on their individual relationships to the outcome of interest (e.g., differences in recovery outcomes based on race) (e.g., Bolin and Bolton, 1986; Bolton et al., 1993; Peacock et al., 1997). For example, in data-driven investigations, the statistical significance of each factor is considered individually. An alternative approach is to aggregate a set of variables into one indicator whose relationship to the relevant disaster-related outcome is then evaluated. The social vulnerability index (SOVI) developed by Cutter et al. (2003) is one of the more commonly used aggregated indicators. The first SOVI was based on a combination of 42 variables that were reduced to 11 independent factors using principal component analysis. Since the development of that SOVI, several other related social vulnerability indexes have been proposed and used in the broader natural hazards literature.
As evidenced by this brief review of the literature, the association between equity, social vulnerability, and disasters is an area of growing interest. However, within this space, the question of how seismic retrofits are distributed among different sub-populations has not been examined.
Goals and objectives
The overall goal of this study is to determine the extent to which there are sociodemographic disparities in the distribution of cripple wall retrofits in the City of Los Angeles (LA City). The specific objectives are to (i) assess whether there are significant differences in the rate of retrofit among specific sub-populations, (ii) evaluate the relationship between the retrofit distribution and the Earthquake Brace and Bolt (EBB) Program eligibility criteria, and (iii) quantify the changes in the distribution of retrofits since the EBB was introduced. LA City was chosen as the place of focus because of the prevalence of single-family homes with unbraced and unbolted cripple walls and the ease of access to publicly available retrofit data.
Data for approximately 5400 buildings retrofitted during the period from 1999 to 2022 were obtained from the Los Angeles Department of Building and Safety (LADBS, 2022) and the Los Angeles County Open Data Portal (LAODP, 2022). The year 1999 is used as the start period because it is the earliest date for which retrofit permit information is electronically available. In addition to the retrofit data, relevant details on the approximately 2 million one and two-family residential buildings in LA City as well as other sociodemographic information, were obtained from various sources. Using the number of retrofitted and total number of one- and two-family residential buildings, the empirical and spatial distribution of the retrofit rate are also examined. The sociodemographic makeup of the neighborhoods with the highest and lowest retrofit rates is investigated along with the retrofit rate in neighborhoods that have the highest representation of specific groups (e.g., low-income households). In addition, associations between the retrofit rate distribution and several building (e.g., year of construction), demographic (e.g., race and ethnicity), and socioeconomic (e.g., education and income) variables, are quantified at the census tract level. To evaluate the impact of the EBB program, the aforementioned analyses are performed for the period before (pre-2013) and after (from 2013 onward) the program was introduced.
The first part of the article summarizes the retrofit, general building, and sociodemographic data used in the analysis. The geospatial, neighborhood level, and census-tract-level analyses are then presented along with the results. The article concludes with a summary of the key findings, the policy implications of those findings, the limitations of the study, and suggestions for future related efforts.
Summary of the data
This section describes the data used in the analysis, which includes information about the cripple wall retrofits, general building information as well as the sociodemographics of the relevant populations. The description of the three data types is presented in the following subsections.
Unbraced and unbolted cripple wall seismic retrofit data
Seismic retrofit data for unbraced and/or unbolted cripple wall buildings in LA City are obtained from the Los Angeles Department of Building and Safety (LADBS, 2022) and the Los Angeles County Open Data Portal (LAODP, 2022). Figure 1 summarizes the workflow used to acquire and process the seismic retrofit data. Initially, data sets comprising 590,914 and 86,034 entries were obtained from the LADBS and LAODP, respectively. The relevant data fields from both sources include the address of the dwelling, the type of permit, the application, approval, and completion dates for the permit, a description of the work performed, and the valuation amount. As a first step in the data processing, we used Python (Van Rossum and Drake, 1995) to filter the two data sets (separately) based on the permit type (and sub-type) as well as the work description. The following work description keywords were used in the filtering: retrofit, seismic, cripple wall, and foundation. Other keywords, such as windows, gas, electrical, bedroom, bathroom, pool, roof, soft-story retrofit, and detached (among many others), were used to remove irrelevant entries. For the entries in the LAODP data set, the building permit type, construction management plan code, and the statistical class code were also used to automate the filtering process. Together, these were used to obtain entries that solely correspond to residential buildings that have had alterations or repairs. The permit type and permit subtype parameters served a similar purpose for the entries within the LADBS data set. Because the filtering process removed most but not all of the unwanted entries, manual parsing of the remaining data was also needed. Following the automated and manual filtering, the two data sets—1398 and 8552 entries from the LAODP and LADBS, respectively—were merged and the duplicates were removed. Since the LAODP data included retrofits for all of Los Angeles County, the data for buildings outside of LA City were removed. After some additional manual filtering, a total of 5435 entries remained. Only 419 buildings in the final retrofit data set are for dwellings with more than two families. In other words, the overwhelming majority of the cripple wall retrofits are for single- and two-family homes. Also, 67% of the retrofits were performed before the introduction of the EBB program.
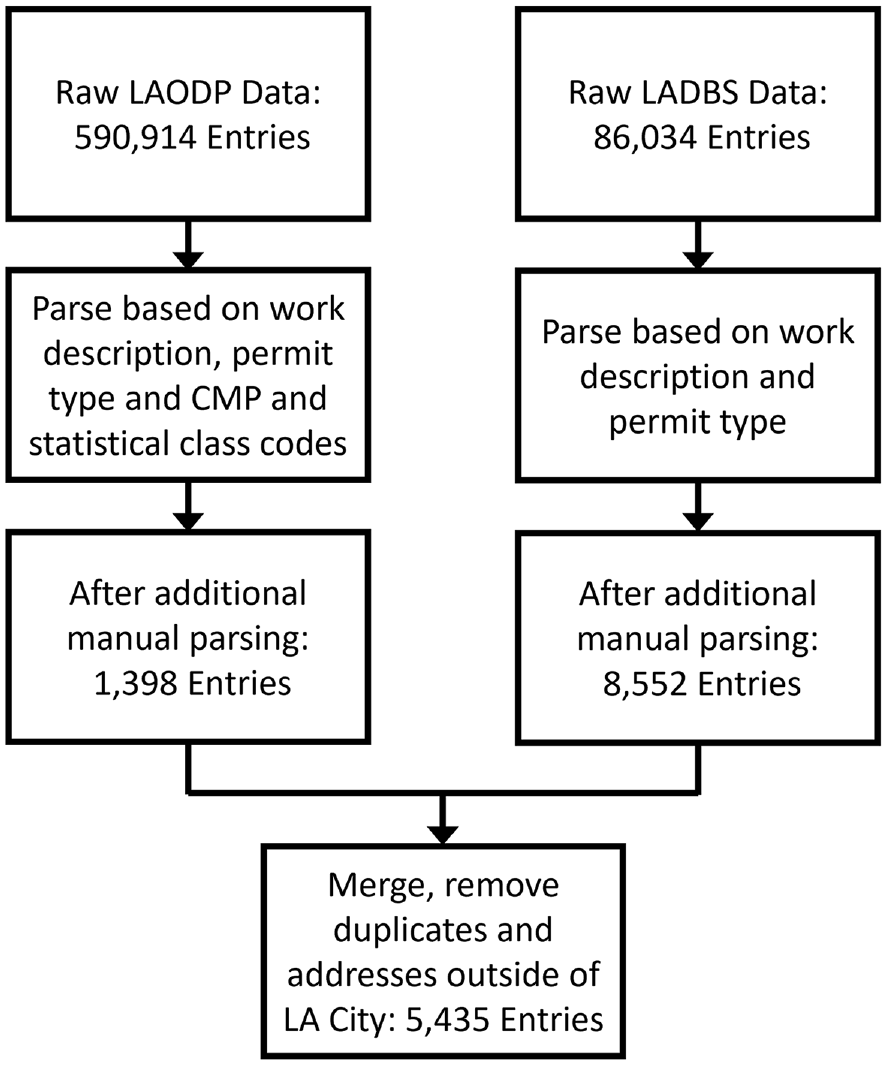
Summary of workflow for sourcing and processing of seismic retrofit data.
Data for all single and two-family dwellings in the LA City
In addition to the retrofit information, data on the approximately 1.9 million single- and two-family residences located within LA City are also obtained. These data are needed to convert the absolute retrofit numbers to rates, that is, normalized by the total number of residences. Buildings with more than two families are not considered because, as noted earlier, more than 90% of the retrofits are for one- and two-family homes. For the remainder of the article, the 5435 and 1.9 million buildings will be described as the “retrofitted” and “complete” inventories, respectively.
In addition to LADBS and LAODP, information for the complete inventory was obtained from the Los Angeles County Parcel Map Service (LACPI, 2022) and the United States Census Bureau (USCB, 2021). In particular, the Los Angeles County Parcel Map Service included data for a total of approximately 2.4 million buildings. To develop the complete inventory, we only considered buildings classified as residential with a maximum of two units, and located within the LA City boundary. The relevant entry fields for these buildings include the latitude and longitude and year of construction. Figure 2 compares the year of construction for the complete and retrofitted inventories. Relative to the complete inventory, the histogram for the retrofitted buildings is left-skewed. In other words, the retrofitted inventory is generally older, with a median building age of approximately 92 years compared to 66 years for the complete set of buildings. This is not surprising since, as noted earlier, cripple wall construction is mostly found in pre-1960 buildings.
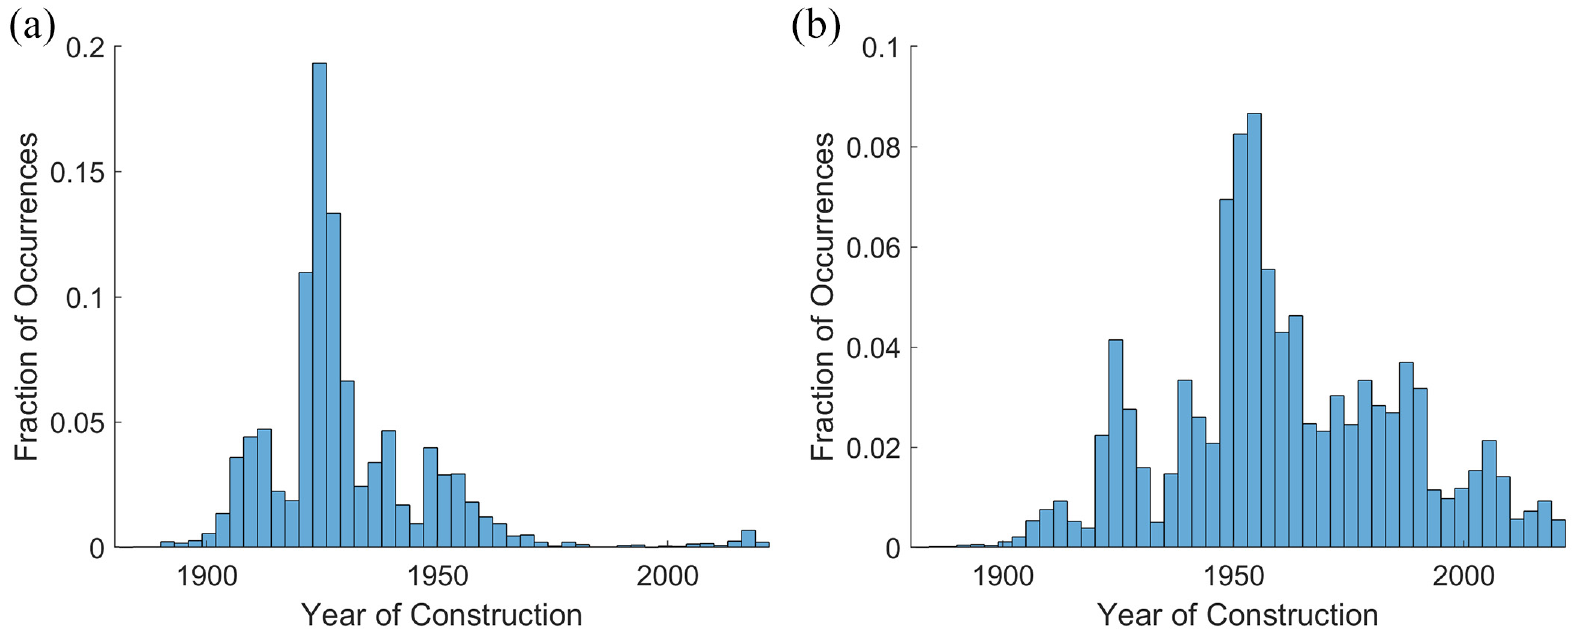
Empirical distribution of the year of construction for the (a) retrofitted and (b) complete inventories.
Sociodemographic data for the LA City
Sociodemographic data generated by the decennial census are obtained for LA City from the United States Census Bureau (USCB, 2021) and the Esri Demographics Database (Environmental Systems Research Institute (Esri), 2022). The relevant neighborhood and census-tract level data include the percentage of the population with higher education (i.e., an advanced degree or any education above high school), population distribution in terms of specific racial and ethnic groups (i.e., percentage of the population that is White, Black, Hispanic, and Asian), median household income, median home value, and home ownership. Figure 3 shows a map of Los Angeles with the names and borders of the 114 neighborhoods that fall within the limits of the city (Los Angeles Times, 2022). The map is also color-coded to identify the seven regions that make up the city (Los Angeles Times, 2022). The two neighborhoods in The Verdugos and the 31 neighborhoods in the San Fernando Valley were combined to form one single region. The three neighborhoods in The Eastside and the seven neighborhoods in Northeast LA are also combined into a single region. Although the statistical analysis is performed at the census tract level, the regions and neighborhoods, both of which are larger than census tracts, are used in the discussion of the results presented in the next section. Histograms with the empirical distribution of the eight variables are shown in Figures 4 and 5.
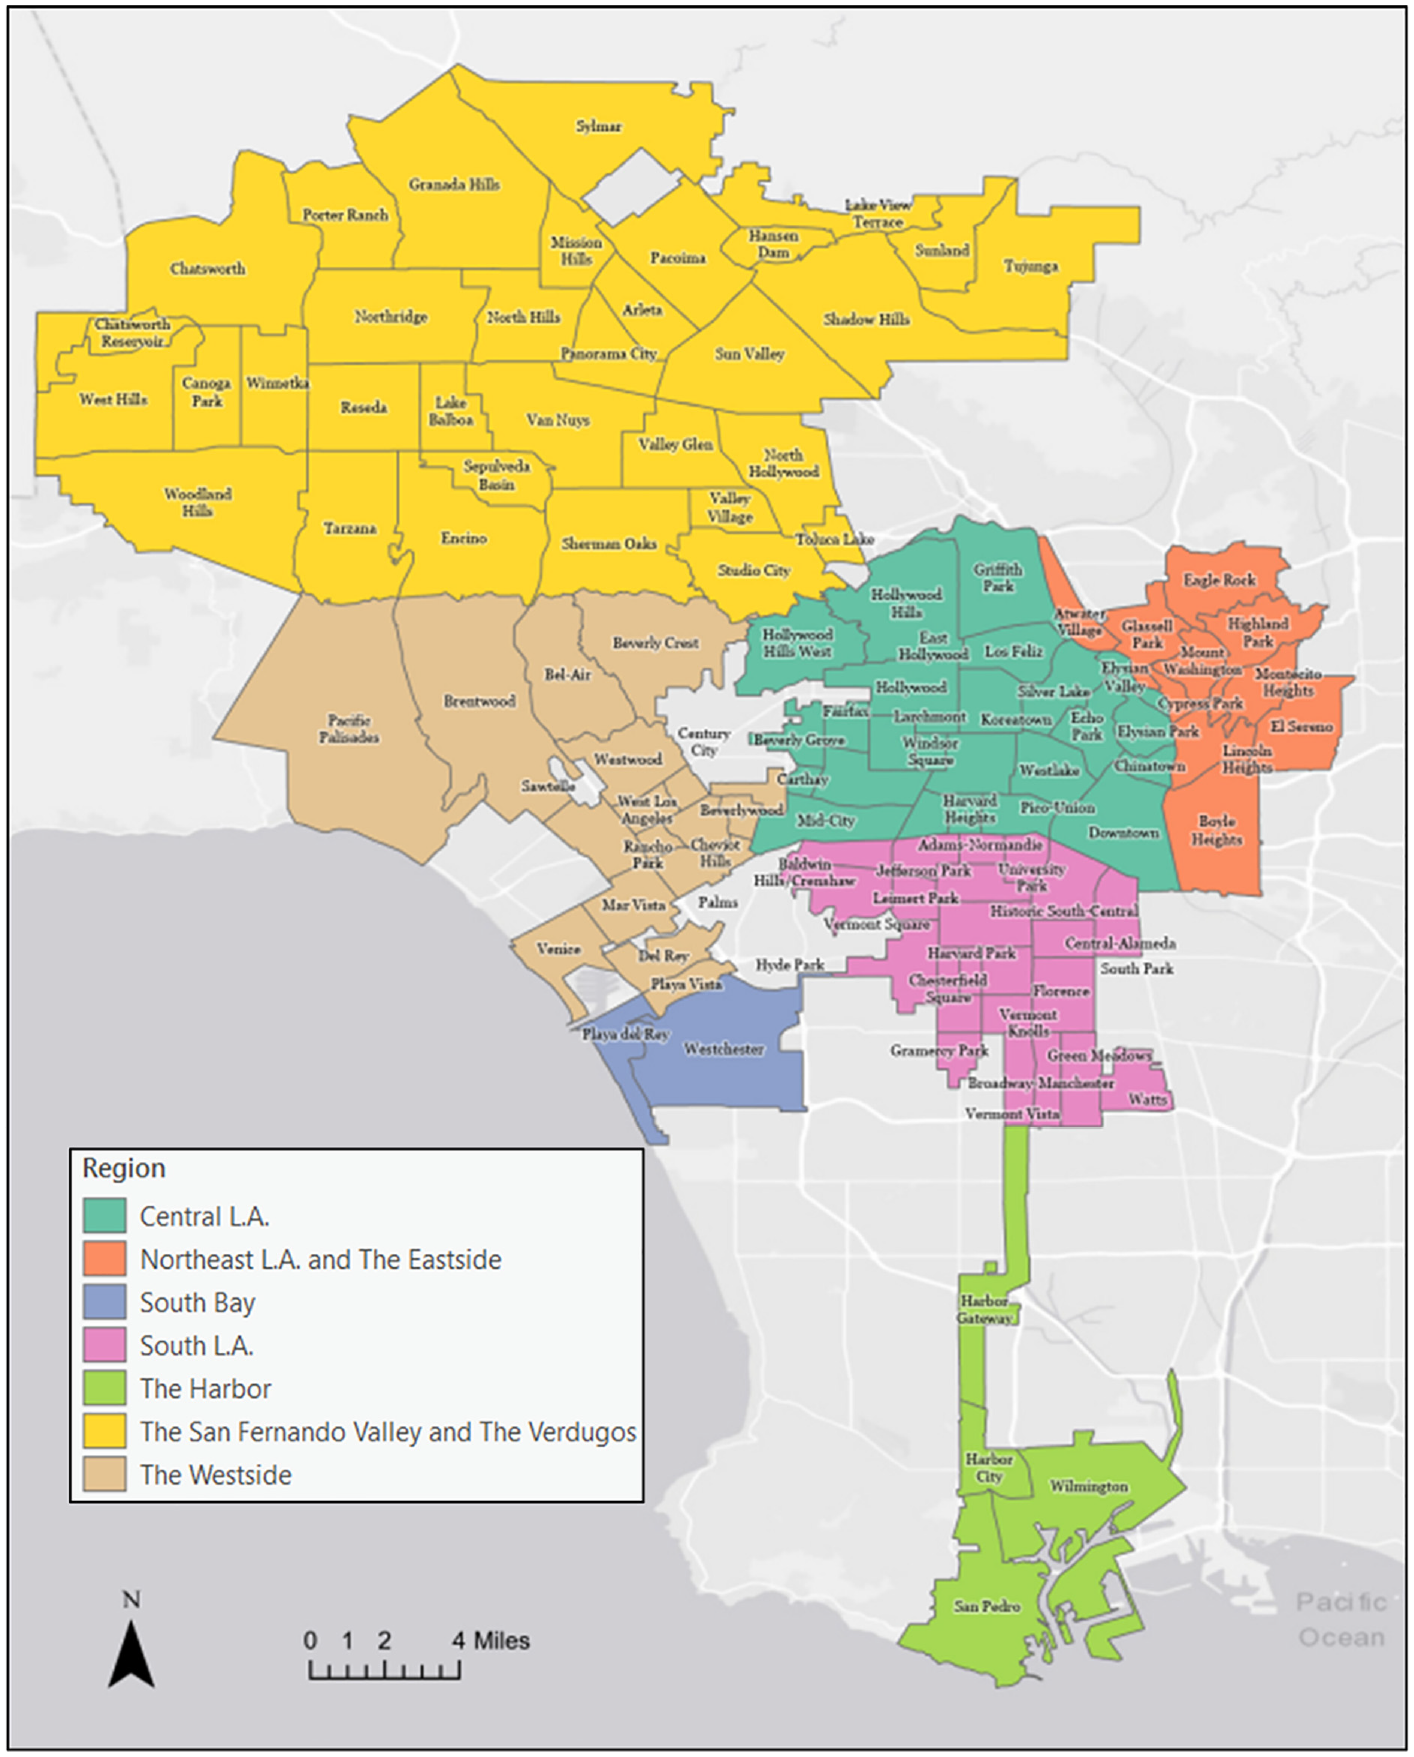
Map of Los Angeles showing the seven regions and 114 neighborhoods within the city.
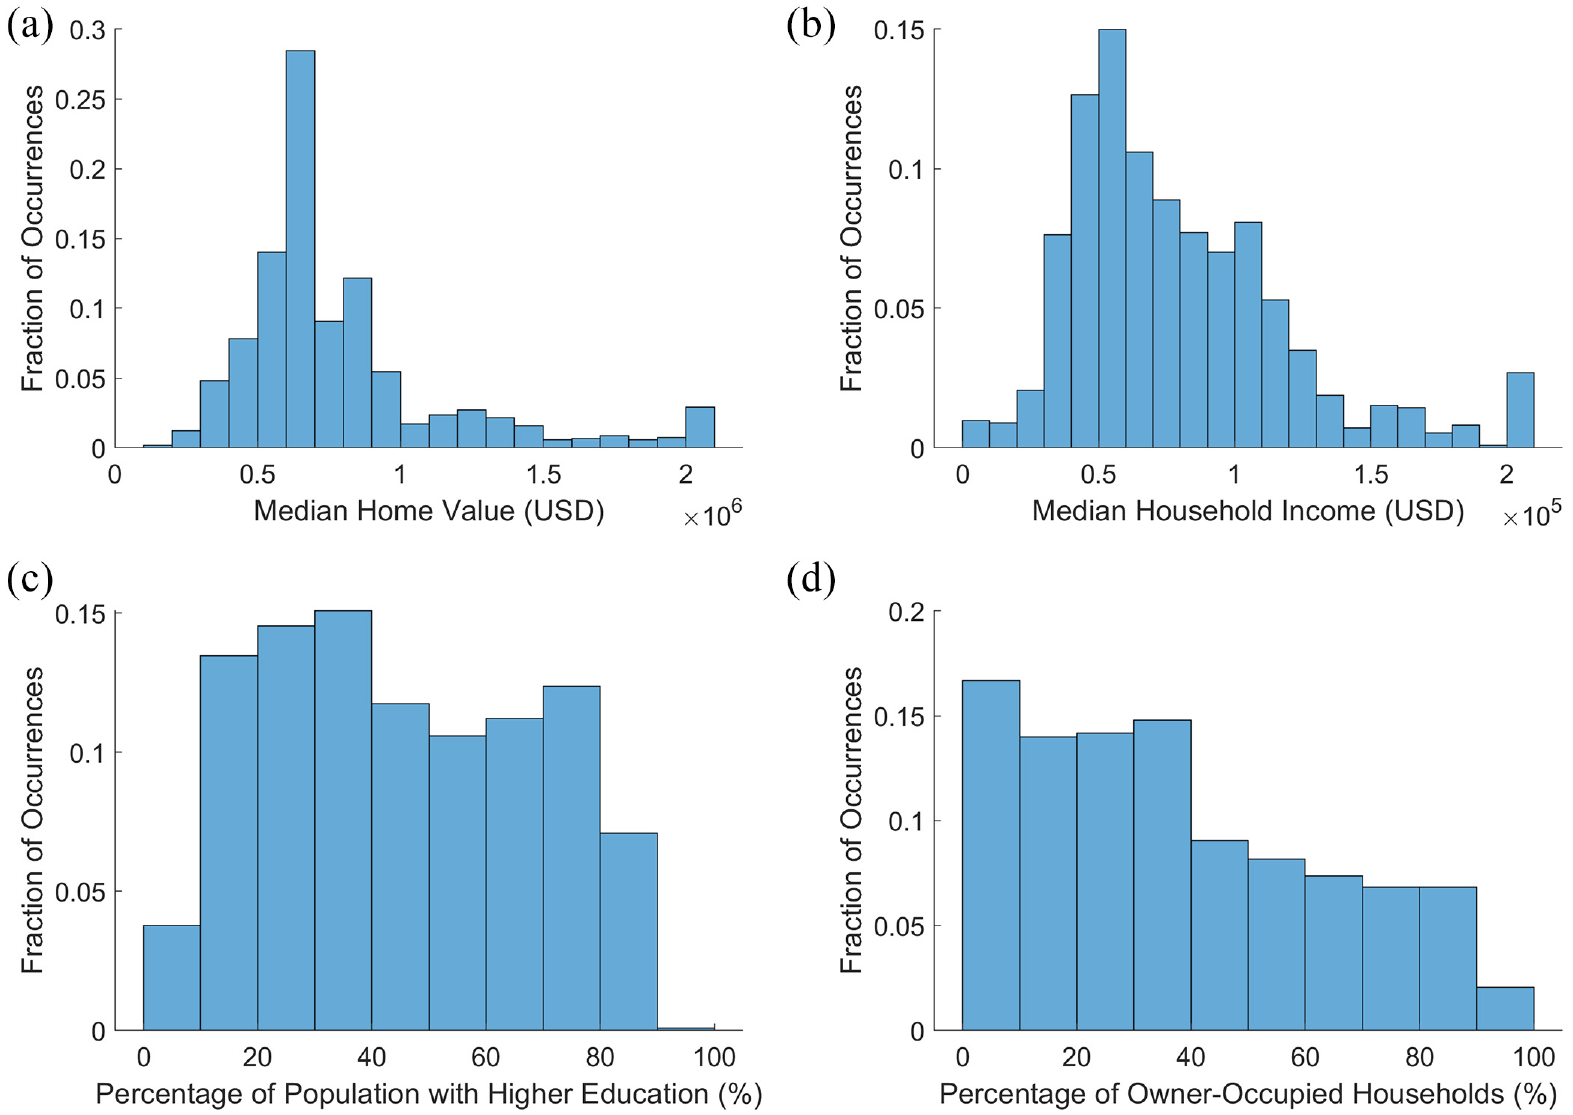
Histograms showing the census-tract level empirical distribution of (a) the median home value, (b) the median household income, (c) the percentage of the population with higher education, and (d) the percentage of owner-occupied homes in LA City.
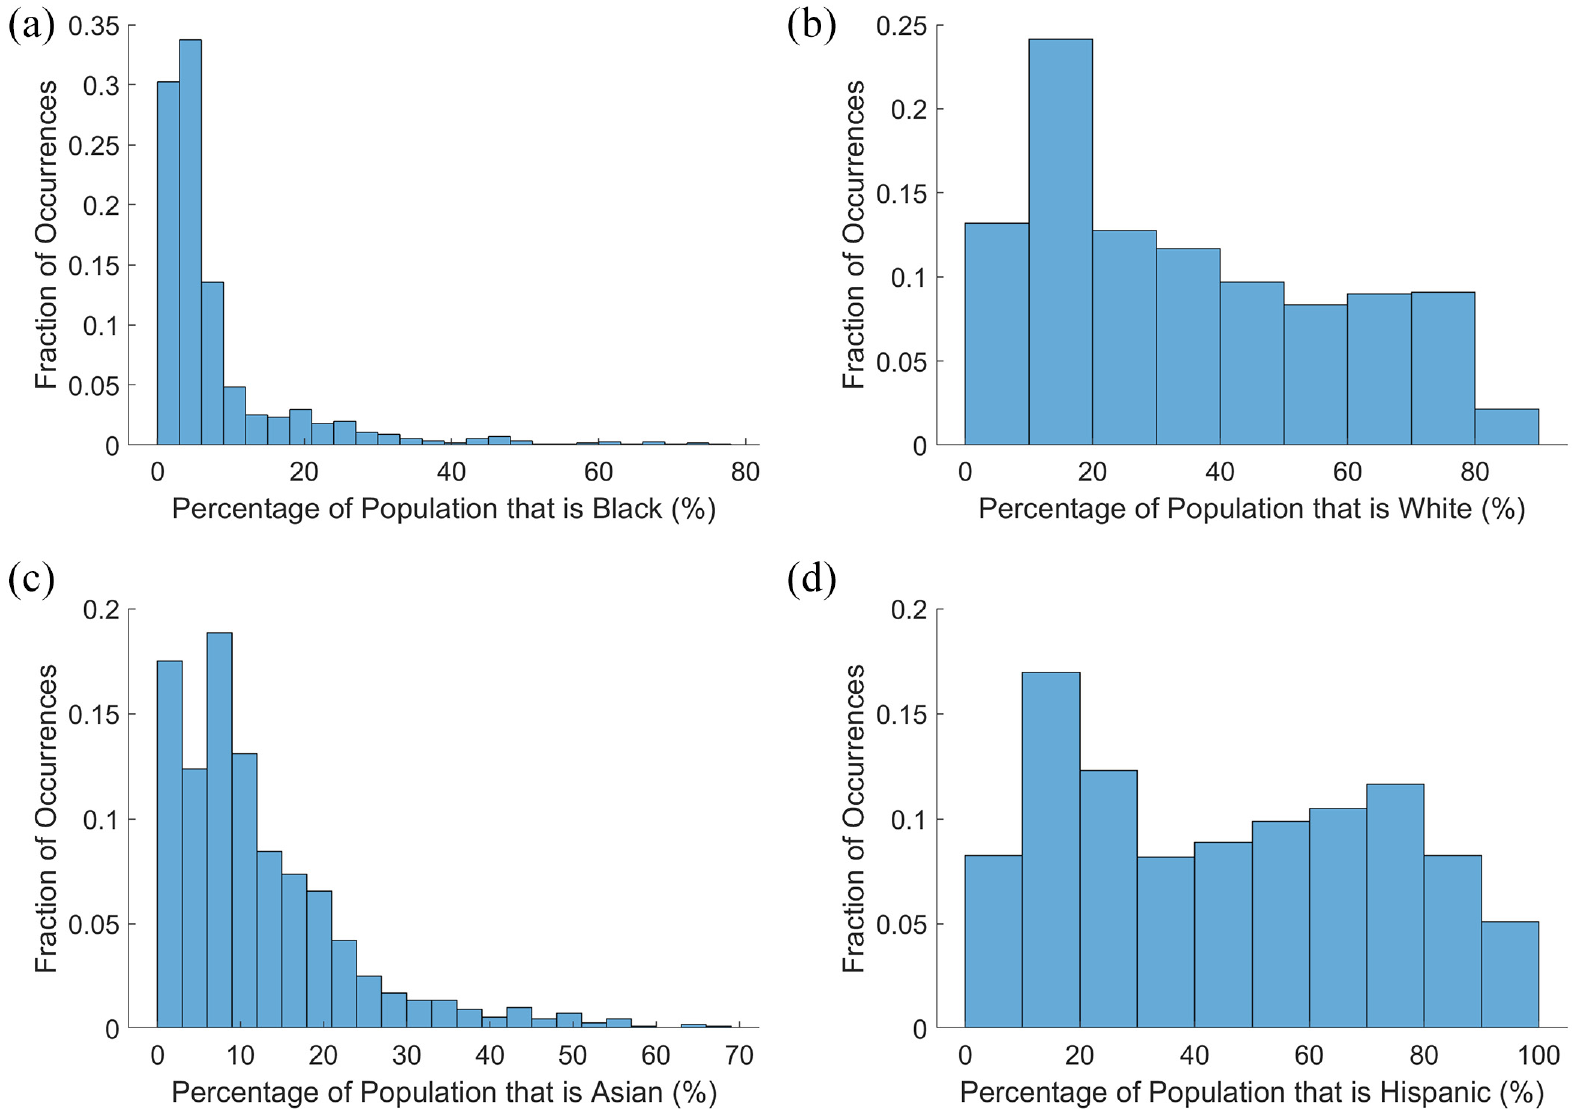
Histograms showing, at the census tract level, the percentage of the LA City population that is (a) Black, (b) White, (c) Asian, and (d) Hispanic.
Methodology
This section summarizes the methodology used to investigate the association between the different sociodemographic variables and the retrofit rate. First, a visual trend analysis of the spatial distribution of the cripple wall retrofits at the neighborhood and regional levels is conducted. To facilitate this analysis, we mapped the individual buildings that have been retrofitted as well as the retrofit rates. For the latter, a geographic representation of the normalized count (i.e., the number of retrofitted buildings normalized by the total building count) is visualized considering only pre-1980 single- and two-family residences. Residential buildings constructed after 1980 with more than two units are not included in the normalization because it is highly unlikely that they would require cripple wall retrofits. This is also consistent with the EBB program, where only pre-1980 buildings are eligible for the retrofit grants. The retrofit rates are calculated and mapped at the census-tract level, but the visual trend analysis is still focused at the regional and neighborhood scales.
On their website (EBB, 2022), the EBB program notes that the zip code level eligibility for the grant program is based on the age distributions of the houses and the seismicity. We evaluate the consistency between the observed distribution of retrofits and the EBB eligibility criteria by comparing maps showing (i) the zip code-level eligibility for the EBB program and (ii) the geographic distribution of the building age distribution and the site seismicity. The latter is a bivariate map that includes the short-period spectral acceleration parameter (i.e., the
The social, economic, and demographic characteristics of the neighborhoods with the highest and lowest rates are also examined. Specifically, we compare the sociodemographic makeup of the neighborhoods with the 10 highest and 42 lowest retrofit rates (i.e., normalized retrofit counts). These groupings are based on the Jenks (1967) optimization method, which minimizes the variation within classes and maximizes variation between classes. Different numbers of classes were explored, but eventually, five total classes were used (which led to the most natural breaks within the data set), with the top class consisting of 10 neighborhoods and the bottom class consisting of 42 neighborhoods. These two sets of neighborhoods account for 26% and 7.5% of all retrofits, respectively. Next, the distribution of the retrofit rate in the neighborhoods that have the highest concentration of specific groups (e.g., Black and Hispanic households) is further examined. The groups are chosen for this particular line of inquiry based on their low representation in high retrofit rate neighborhoods. Finally, a statistical analysis considering all neighborhoods is performed to quantify the association between the sociodemographic and housing characteristic variables and the retrofit rate.
Each type of analysis is performed considering the entire data set as well as subsets of the partitioned data based on retrofits performed before and after the introduction of the EBB program. The goal here is to evaluate whether the EBB program could have had a tangible impact on the sociodemographic distribution of the retrofits.
Results
Regional and neighborhood level spatial distribution of retrofits
Figure 6 shows the geographic distribution of building retrofits. The circles representing the individual retrofitted buildings are color-coded based on the number of units. The overwhelming majority (approximately 80%) are single-family homes, approximately 10% are two-family units and less than 10% have 3 or more units. In Figure 6, we observe that the majority of retrofits are in the Central, Northeast, and South LA regions.
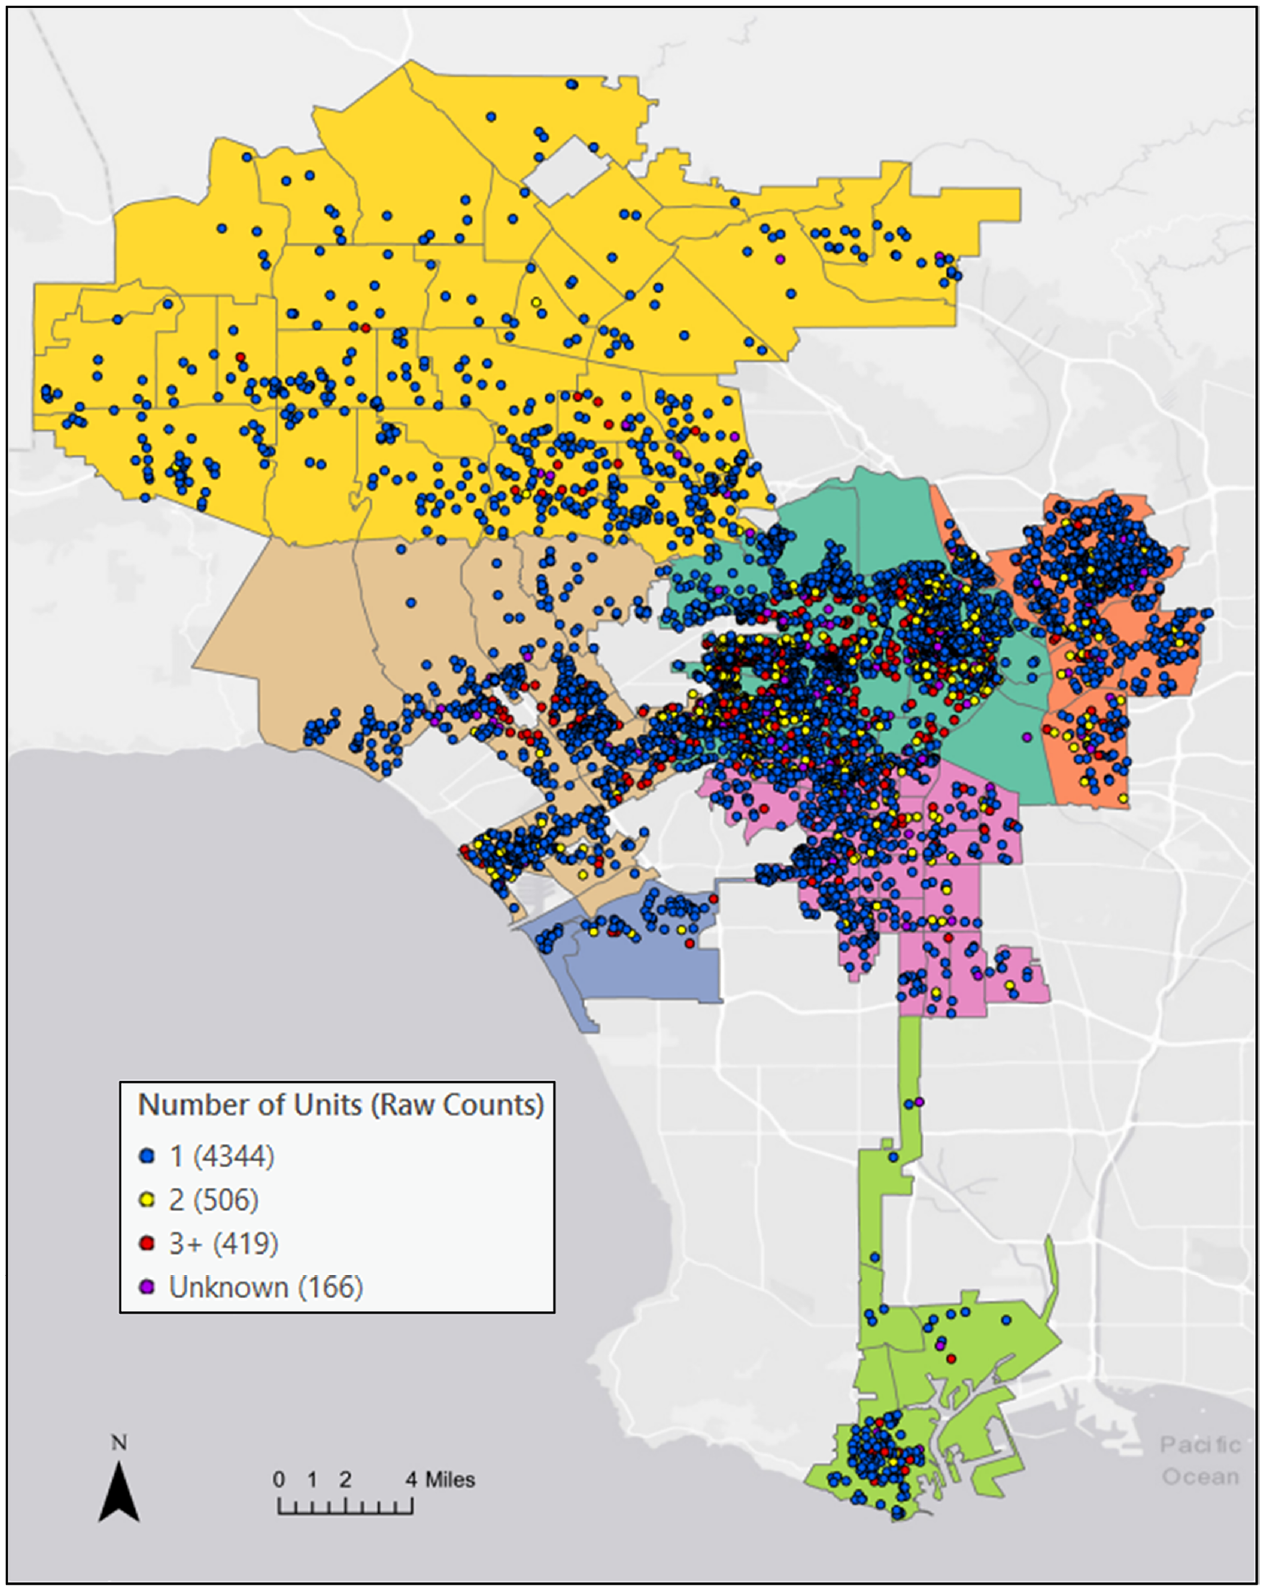
Map of Los Angeles identifying the individual retrofitted buildings (circular dots) and the number of family units associated with each (color-coding of circular dots). The background colors correspond to the regions shown in Figure 3.
Even after normalization, Figure 7 shows that the distribution of retrofits is concentrated in Central, Northeast, and South LA. However, moderately high (relatively speaking) rates of retrofit (1–10 retrofits per 1000 buildings) are also distributed throughout the other four regions.
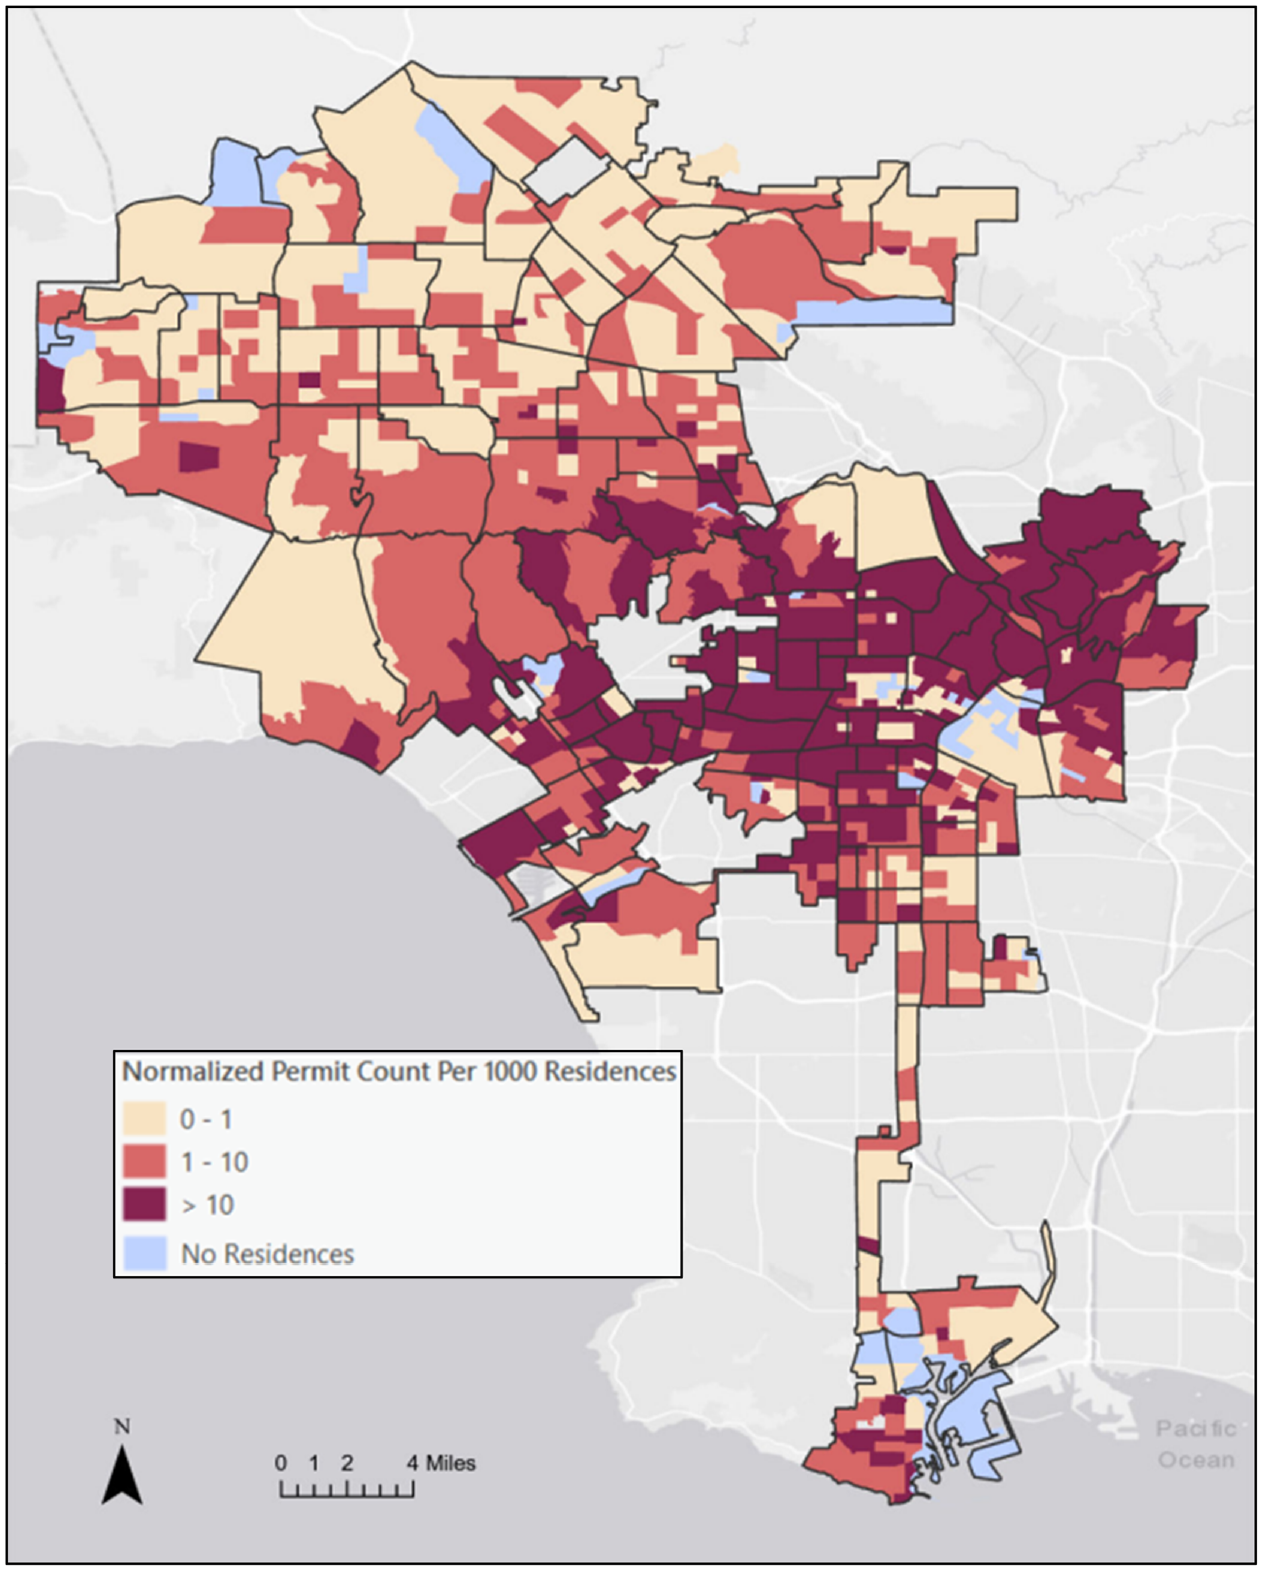
Map of Los Angeles showing the spatial distribution of retrofit rate at the census tract and neighborhood levels. To compute the rate, the retrofit counts are normalized by the number of pre-1980 single- and two-family dwellings.
At the neighborhood scale, there are two spatial clusters of interest that should be discussed, both of which are found in Central LA. A cluster of neighborhoods consisting of Larchmont, Fairfax, Windsor Square, Beverly Grove, Mid-Wilshire, Hollywood, and Carthay (all of which are adjacent to one another) accounts for 18.3% of all retrofits, despite comprising only 3.4% of all single- or two-family residences built before 1980. These neighborhoods generally have high home values and a high percentage of the population with higher education, both of which are variables that correlate positively with the retrofit rate (discussed later in the article). A similarly situated cluster of neighborhoods consisting of Echo Park, Silver Lake, and Los Feliz also accounts for a large number of retrofits, 13.6%, while having only 2.5% of all single- or two-family residences built before 1980. For both of these clusters, there are little to no variations in the retrofit rates, even at the census-tract scale, providing further evidence of the uniformly high retrofit rates in these neighborhoods in relation to the rest of LA. Also, the neighborhoods in these two clusters have been identified as having significant levels of gentrification over the last two decades (Urban Displacement Project, 2022), and more than 60% of the retrofits in these two neighborhood groups occurred prior to 2013 (the year the EBB program was introduced).
In Northeast LA, the other region with a significant number of retrofits, the neighborhood with the highest retrofit rate and highest absolute number of retrofits is Highland Park. With a total of 251 retrofits, this number is only surpassed by the 302 retrofits in Silver Lake, which is located within one of the two clusters discussed in the previous paragraph.
In South LA, the neighborhood with the highest retrofit rate and highest absolute number of retrofits is Jefferson Park, which accounts for a total of 119 retrofits. Its retrofit rate is 1.4 and 1.8 times greater than the neighborhoods in South LA with the next two highest rates. Even more significant is the fact that the retrofit rate in this neighborhood is 11.6 times the median value for South LA. Apart from Jefferson Park, the retrofit rates across neighborhoods in South LA are not as high as those in Central or Northeast LA, albeit not as low as other regions such as the San Fernando Valley. South LA also has several census tracts with very low or even zero retrofit rates, despite there being a prominent number of single- and two-unit homes built before the 1950s. These tracts are primarily found in the neighborhoods of Central Alameda, Florence, Harvard Park, Vermont-Slauson, and Watts, all of which have above-average percentages of Hispanic households and below-average median household income values compared to the rest of LA City.
Evaluating the retrofit distribution relative to the EBB eligibility criteria
From Figure 8, we observe that most of the zip codes that fall within the city limits are eligible for the program. However, there is a small cluster of zip codes in the western part of the San Fernando Valley and Verdugos region that does not meet the eligibility requirements. For further evaluation, Figure 9 presents a map showing the combined distribution of the age of one and two-unit residential buildings and site seismicity. The standard deviation classification method is used to develop the groupings (i.e., ≤–0.50, −0.50 to 0.50, and > 0.50 standard deviation). The short-period spectral intensity
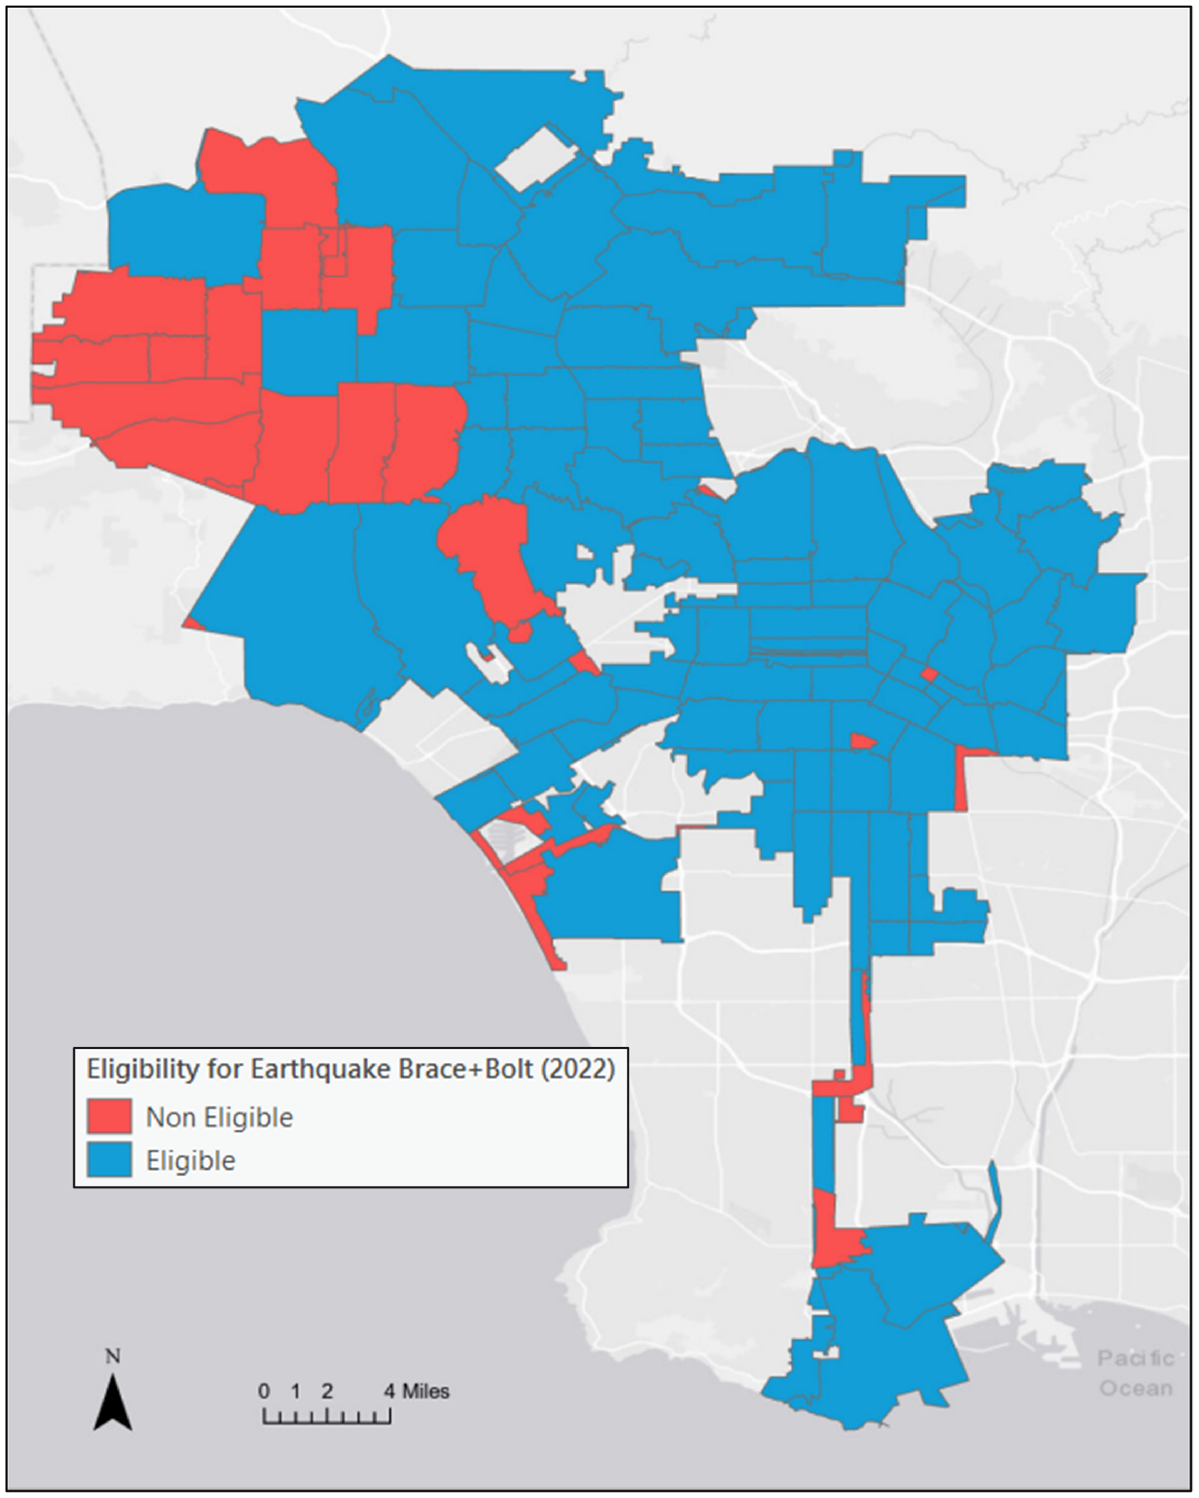
Map of Los Angeles showing the zip codes that are eligible for the EBB program.
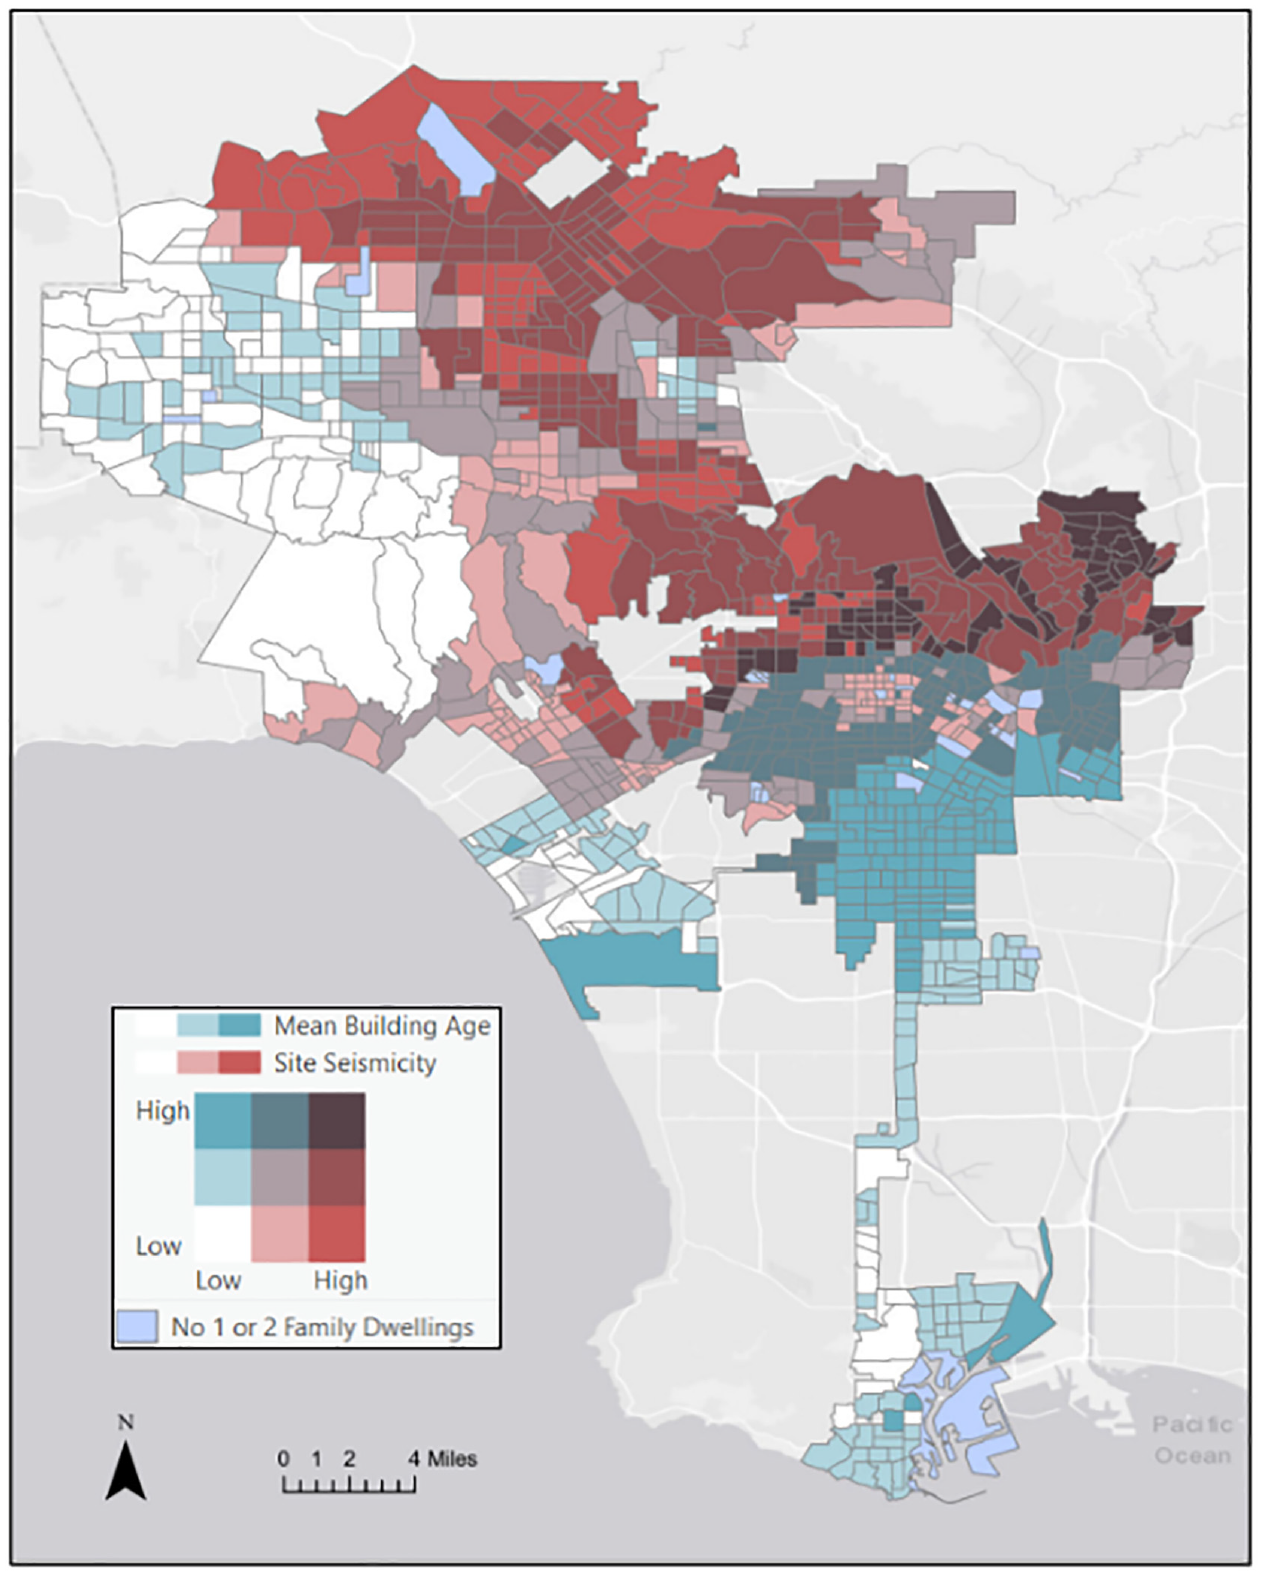
Map showing the spatial distribution of the mean building age and short-period spectral intensity (i.e., the
Figure 10 shows the distribution of the site
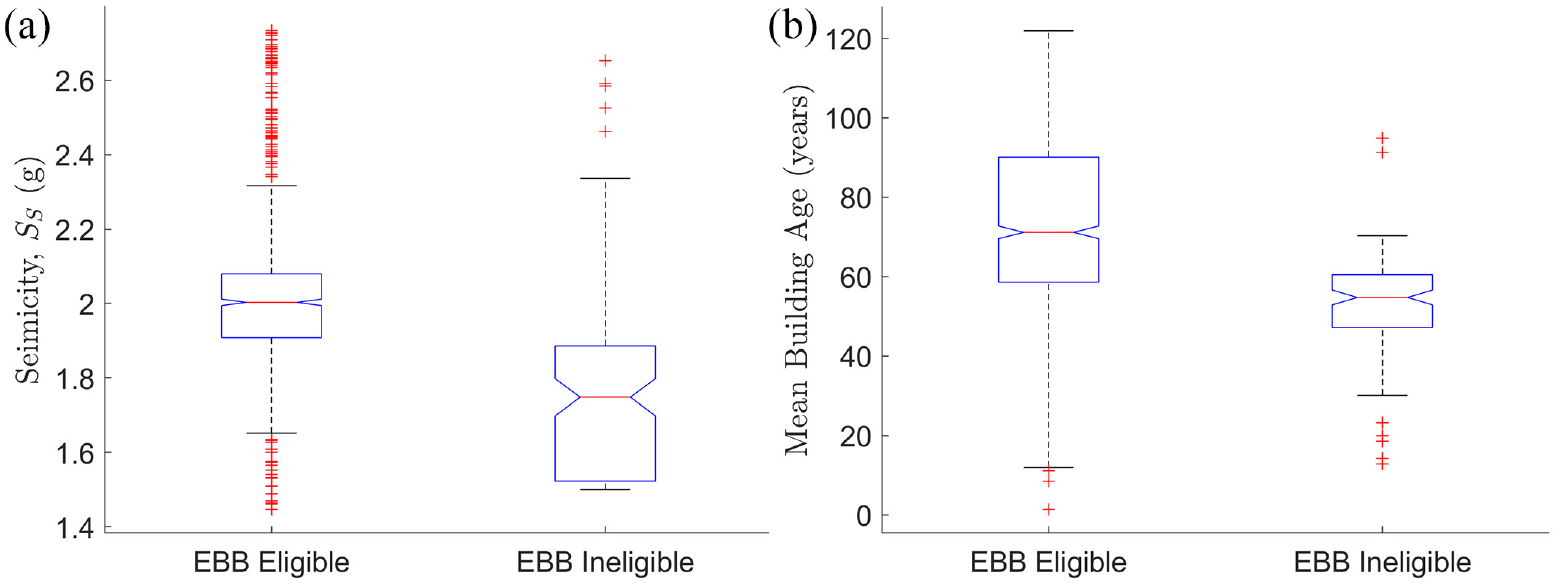
Distribution of the (a) site
The ineligible tracts account for just 3.6% of all retrofits despite making up 18% of all single- or two-family residences built before 1980. However, upon further investigation, these same tracts account for only 1.6% of all single or two-family residences built before 1940, which aligns with the general observation that regions with older homes have more retrofits and are thus more likely to be eligible for the program.
Association between retrofit rates and sociodemographic factors
Comparing neighborhoods with the highest and lowest retrofit rates
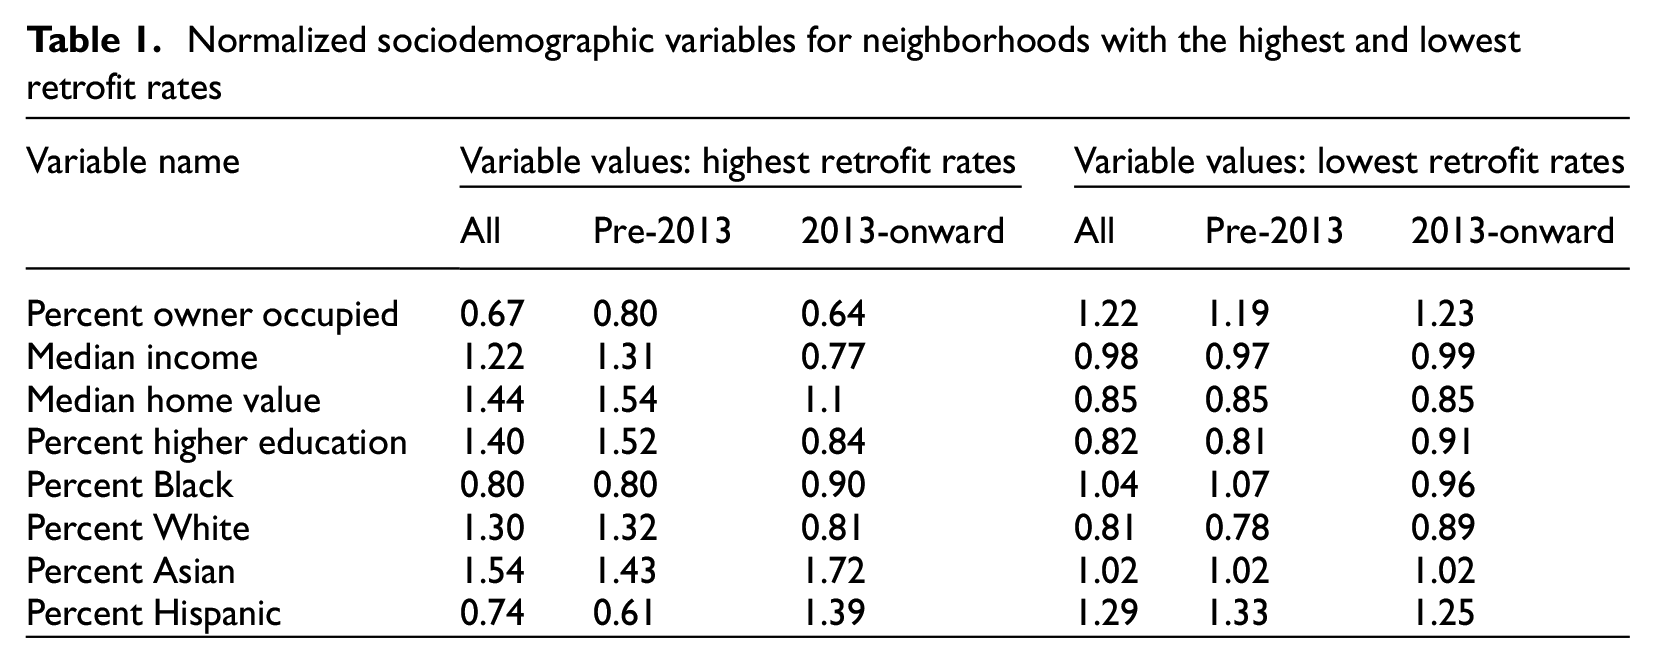
Table 1 compares the sociodemographic characteristics of the neighborhoods with the highest and lowest retrofit rates (also mapped in Figure 11) considering (i) all retrofitted buildings, (ii) retrofits permitted before 2013, and (iii) retrofits permitted from 2013 (the year that the EBB program was instituted) onward. For a given sociodemographic variable, the value for the given neighborhood is normalized by the value for all of LA City. Therefore, a value greater than 1.0 means that the specific group or category is overrepresented. On the other hand, a value less than 1.0 indicates underrepresentation. For instance, Table 1 shows that for the entire retrofit inventory, the normalized percentage of White households equals 1.3 and 0.81 for the neighborhoods with the highest and lowest retrofit rates, respectively. In other words, for this specific inventory, White households are overrepresented in those neighborhoods with the highest retrofit rates and underrepresented in those with the lowest retrofit rates. The key findings from the results in Table 1, considering only the complete retrofit inventory, are as follows:
Hispanic households appear to be generally underrepresented in terms of buildings that have been retrofitted. This is evidenced by the normalized population percentage for that group being underrepresented in the neighborhoods with the highest retrofit rates and overrepresented in those where the retrofit rate is the lowest.
As noted earlier, White households are generally well-represented in the neighborhoods with the highest retrofit rates and underrepresented in the neighborhoods that are on the low end of the spectrum.
Although Black households are underrepresented in the neighborhoods where the retrofit rates are the highest, the representation in those with the lowest retrofit rate is on par with that of LA City.
The Asian population is highly over represented in the neighborhoods with the highest retrofit rate but the representation in places with the lowest retrofit rate is on par with that of LA City.
The neighborhoods with the highest retrofit rate have median household incomes and home values that are 22% and 44% higher than all of LA City. In the neighborhoods with the lowest retrofit rate, the median household income is on par with that of LA City; however, the median home value is 15% lower than all of LA City.
The neighborhoods with the highest retrofit rates have a greater percentage of the population with a higher education level compared to all of LA City. The opposite is true for the neighborhoods with the lowest retrofit rates.
The percentage of owner-occupied units in the neighborhoods with the highest retrofit rate is significantly lower than all of LA City, and the opposite is true where the retrofit rate is lowest.
Normalized sociodemographic variables for neighborhoods with the highest and lowest retrofit rates
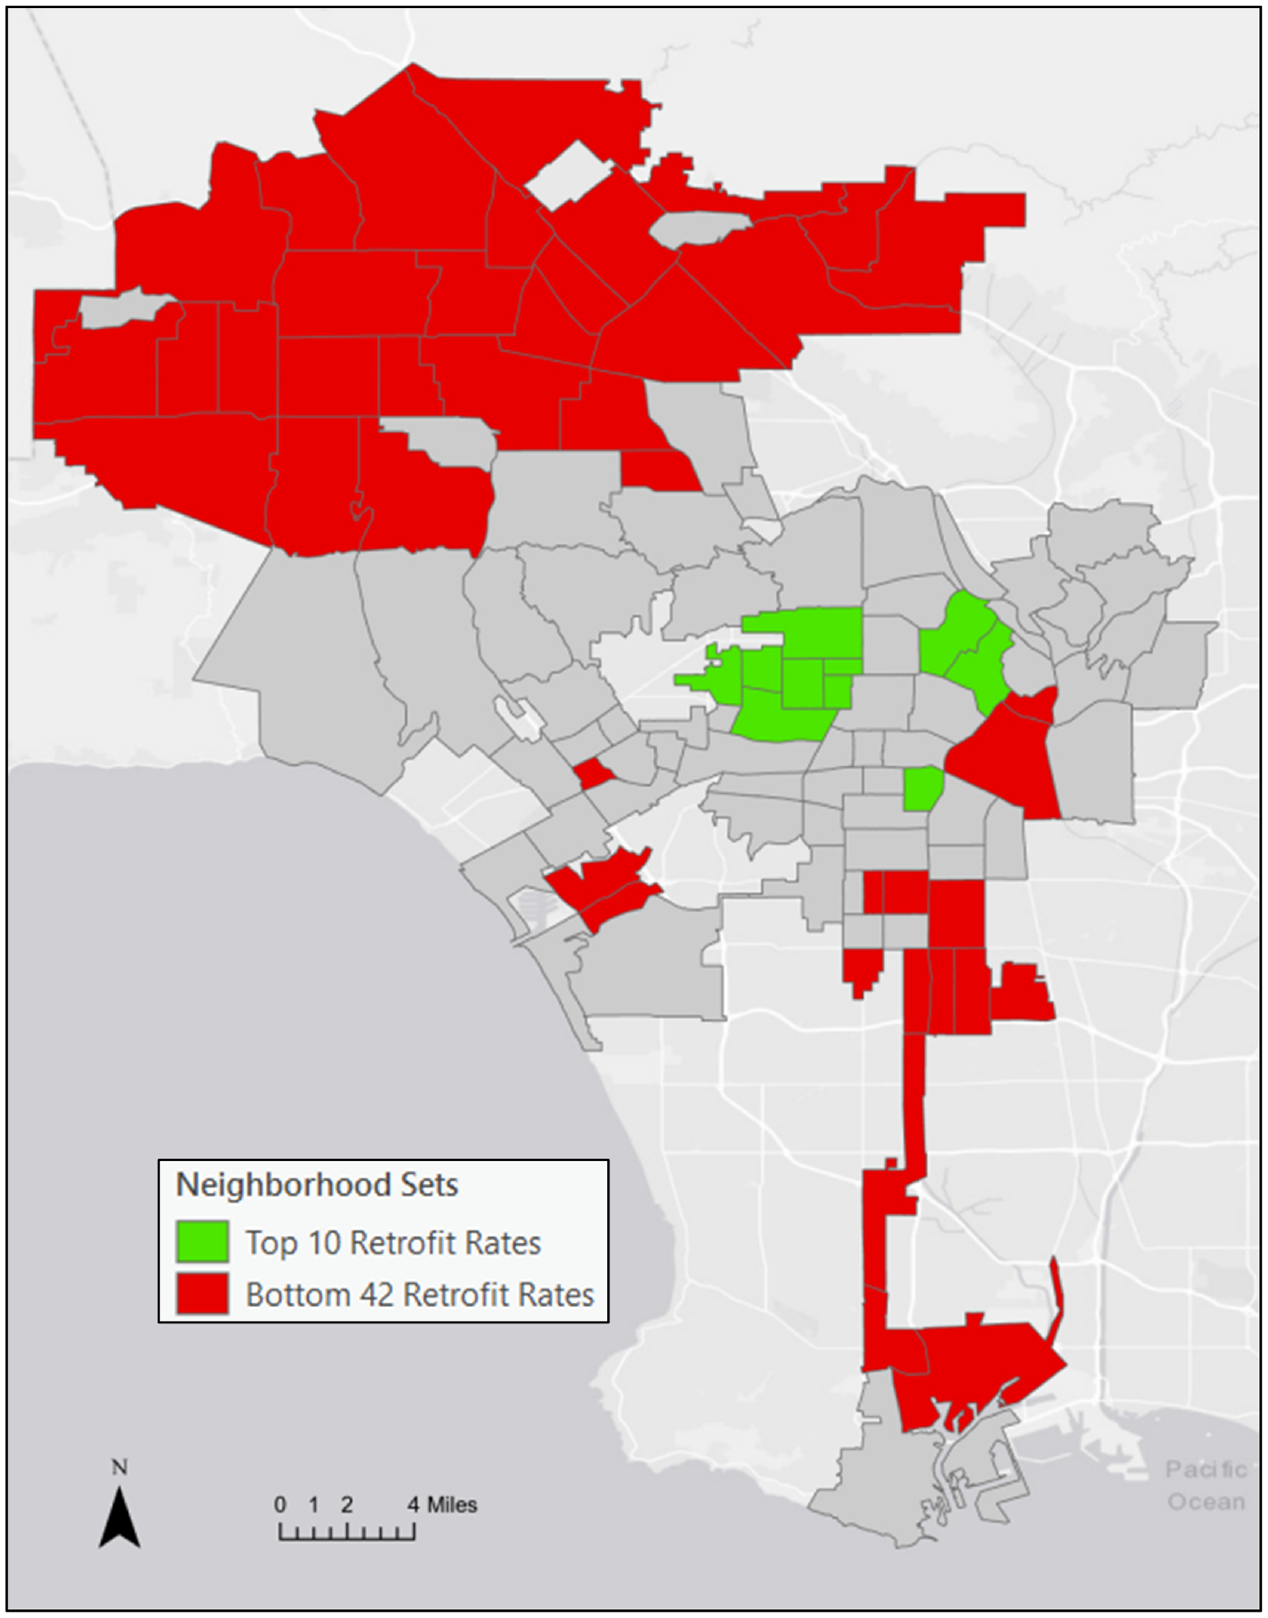
Map showing the neighborhoods with the highest (Top 10) and lowest (Bottom 42) retrofit rates.
The findings discussed in the previous paragraph (and associated bullet points) are for the entire retrofit inventory. To evaluate the impact of the EBB program, we compare the results for the pre-2013 and 2013-onward retrofit inventories. A general observation from this comparison is that the EBB program appears to have significantly reduced the disparities in the retrofit rates that existed prior to its introduction. For instance, the normalized percentage of Hispanic households in the neighborhoods that have the highest rates of retrofit more than doubles (0.61 to 1.39) after the program is introduced. The representation of black households in the neighborhoods where retrofit is most prevalent also increased after 2013, although not as significantly as for the Hispanic population. Significant reductions in disparities are also observed for the median household income and median home value variables. Prior to 2013, the median household income in the neighborhoods with the highest retrofitted rates was 31% higher when compared to all of LA City. For the retrofits performed after the EBB program was introduced, the same metric is now 23% lower than for LA City. Note, however, that there is little to no change in the neighborhoods with the lowest retrofit rates. Similarly, the median home value in the neighborhoods with the highest retrofit rate are 54% and 10% higher than for LA City for pre-2013 and 2013-onwards, respectively. The normalized percentage of the population with higher education in the neighborhoods with the greatest retrofit rates is reduced from 1.52 to 0.84 since the EBB program was introduced. Whereas in the neighborhoods where retrofits are least prevalent, the value increased by approximately 12%. The decrease in representation of owner-occupied units after 2013 at first seems surprising because this was actually an eligibility requirement for the EBB program (i.e., the house needed to be owner-occupied to qualify for the retrofit grant). However, the representation of owner-occupied units used in the study is for all residential buildings, not just single- or two-family residences. This may partially explain why this particular trend appears to be counter intuitive. This trend could also be due to significant numbers of “flipped” properties, where the owners choose to rent out the residence after it is retrofitted.
Retrofit rates in neighborhoods with the highest representation of Black, Hispanic, and low-income households
The results presented in Table 1 and summarized earlier in this section provide some high-level insight into the retrofit rate disparities and the effect of the EBB program. To further probe the issue, we examine those neighborhoods that have the highest representation of those groups that were shown to be underrepresented in places where the retrofit rate is highest. Specifically, the retrofit rates for the neighborhoods with the highest percentage of Black and Hispanic populations are computed. A similar evaluation is performed for the neighborhoods with the lowest median income. As was done previously, the analysis is conducted considering the entire retrofit inventory as well as the pre-2013 and 2013-onward retrofits.
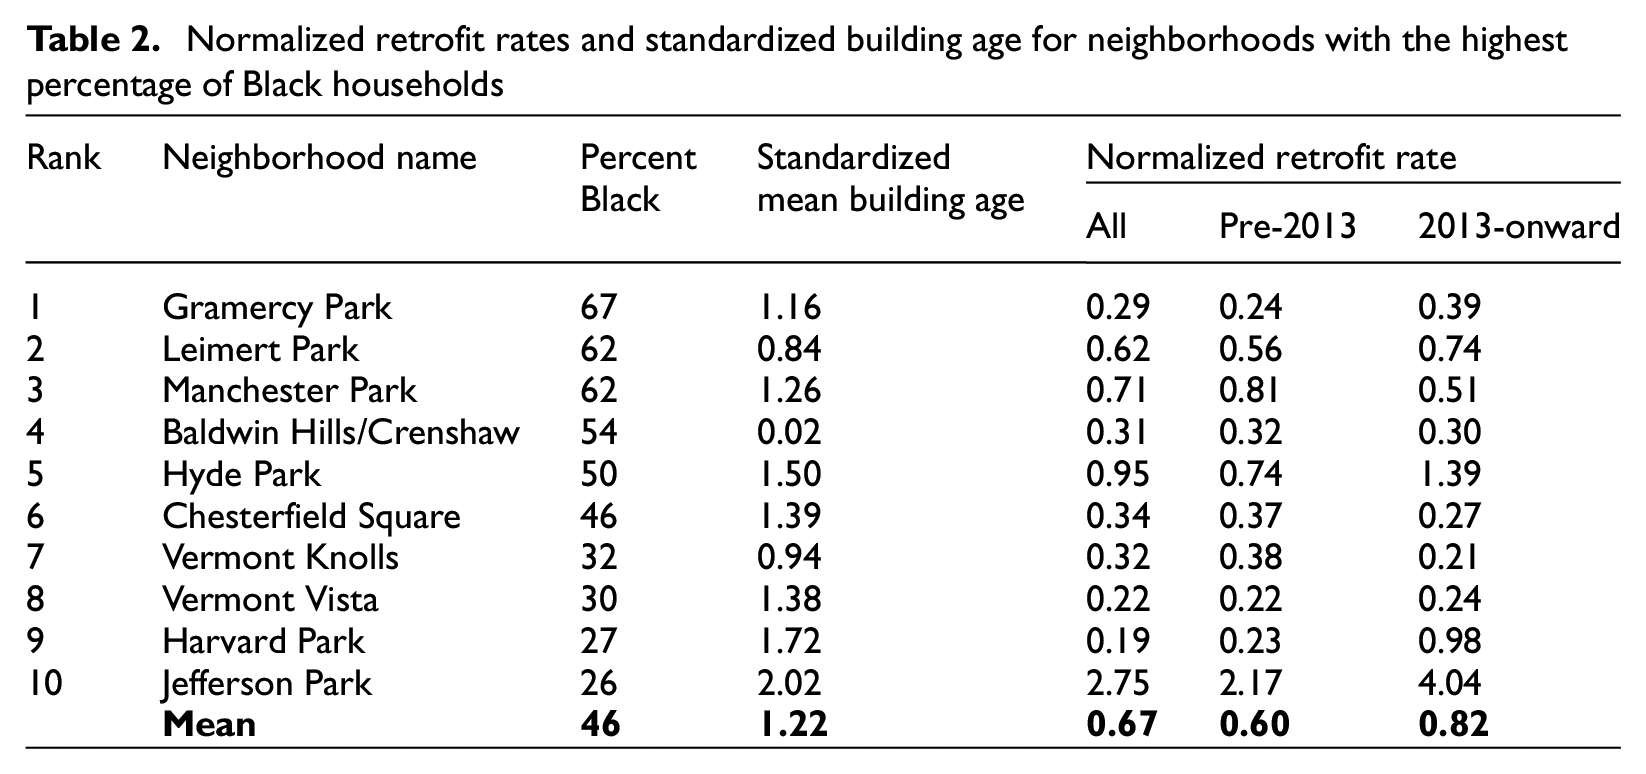
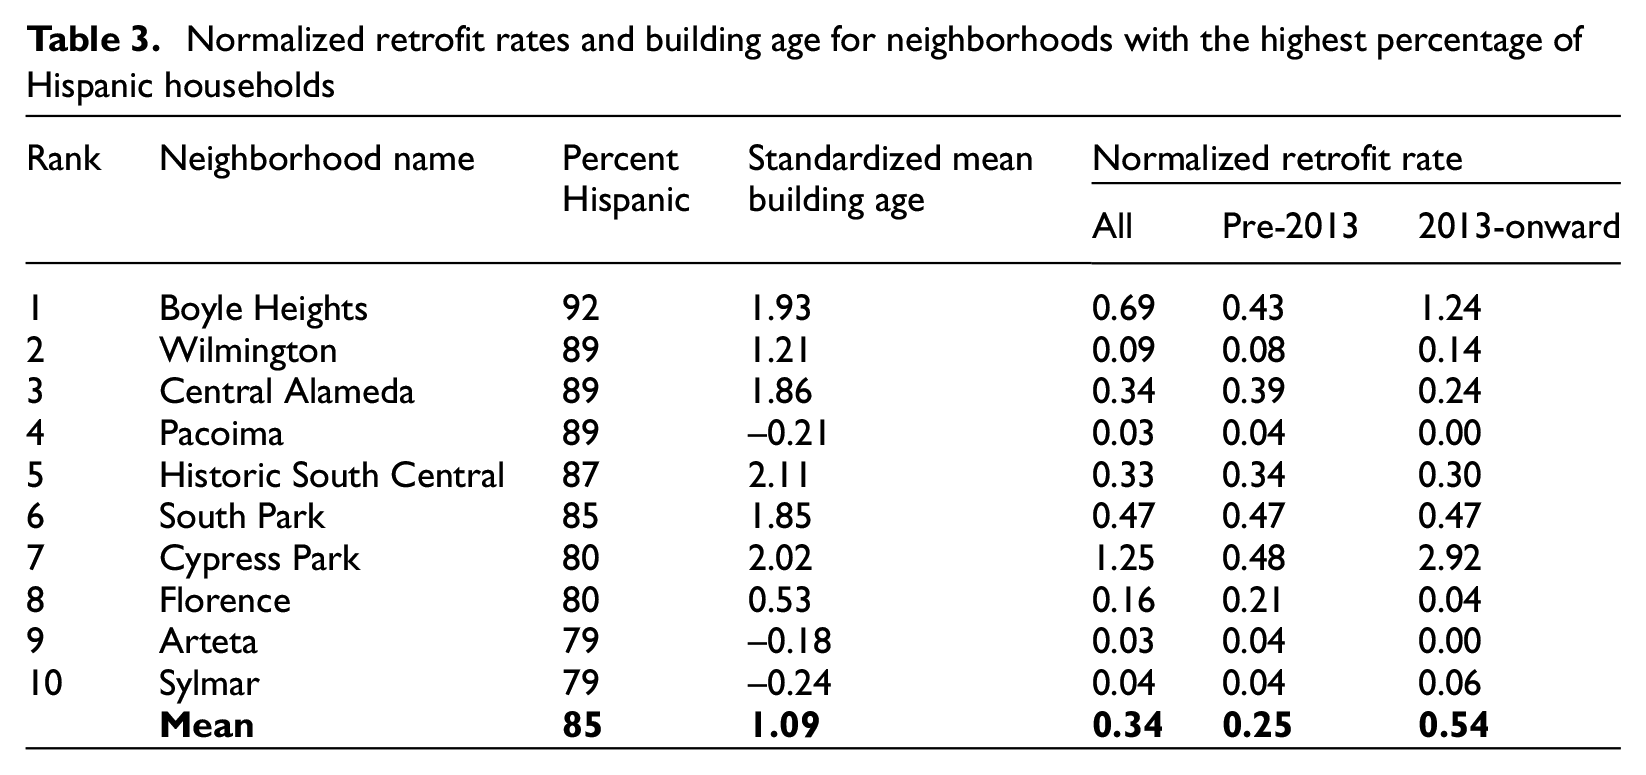
Tables 2 and 3 summarize the normalized retrofit rate for the ten neighborhoods with the highest percentage of Black and Hispanic households, respectively. These neighborhood clusters account for 26% and 24% of the total Black and Hispanic populations, respectively. The normalization is based on the average retrofit rate for all of LA City. Therefore, a value less than 1.0 means that the retrofit rate is generally lower than the entire city (and vice versa). To deal with the issue of confounding (e.g., both the building age and a given sociodemographic variable could influence the retrofit rate), the standardized mean building age is included for each neighborhood. This column represents the number of standard deviations between the value for a given neighborhood and the mean value considering all of LA City. A positive value indicates that the mean building age for that neighborhood is higher than that of the entire LA City one- and two-family residential building inventory (and vice versa).
Normalized retrofit rates and standardized building age for neighborhoods with the highest percentage of Black households
Normalized retrofit rates and building age for neighborhoods with the highest percentage of Hispanic households
The percentage of Black households in the neighborhoods with the highest representation ranges from 26% (Jefferson Park) at the low end to 67% (Gramercy Park) at the high end. Except for Jefferson Park, all neighborhoods have a retrofit rate that is less than 1.0. Considering the entire data set, the average for the ten neighborhoods is 0.67, indicating an overall retrofit rate that is 33% lower than all of LA City. Also, for the same ten neighborhoods, the average building age is 1.22 standard deviations greater than the mean value for the entire city. This observation suggests that the low retrofit rates cannot be “explained away” by building age as a confounder. In other words, the neighborhoods with the greatest prevalence of Black households have generally low retrofit rates despite the presence of older buildings (compared to the rest of the city). Another important observation is the difference between the pre-2013 and 2013-onward retrofit rates. Specifically, the average normalized retrofit rate for the ten neighborhoods is approximately 37% higher for the 2013-onward data set. Similar to the result (and discussion) provided in Table 1, this finding serves as evidence of the impact of the EBB program in terms of increased representation of retrofits in Black households.
Table 3 shows that the percentage of Hispanic households in those neighborhoods where the group is most represented ranges from 79% (Arteta and Sylmar) on the low end to 92% (Boyle Heights) on the high end. As indicated by the standardized mean building age (1.09 average for the ten neighborhoods), despite having generally older buildings compared to the rest of the city, the normalized retrofit rates are extremely low. When considering the entire inventory, the mean normalized rate for the ten neighborhoods is 0.34. Also, even though the value more than doubled from 2013-onward (0.54 compared to 0.25 pre-2013, likely due to the EBB program), the resulting retrofit rate is still only slightly more than half that of the entire city.
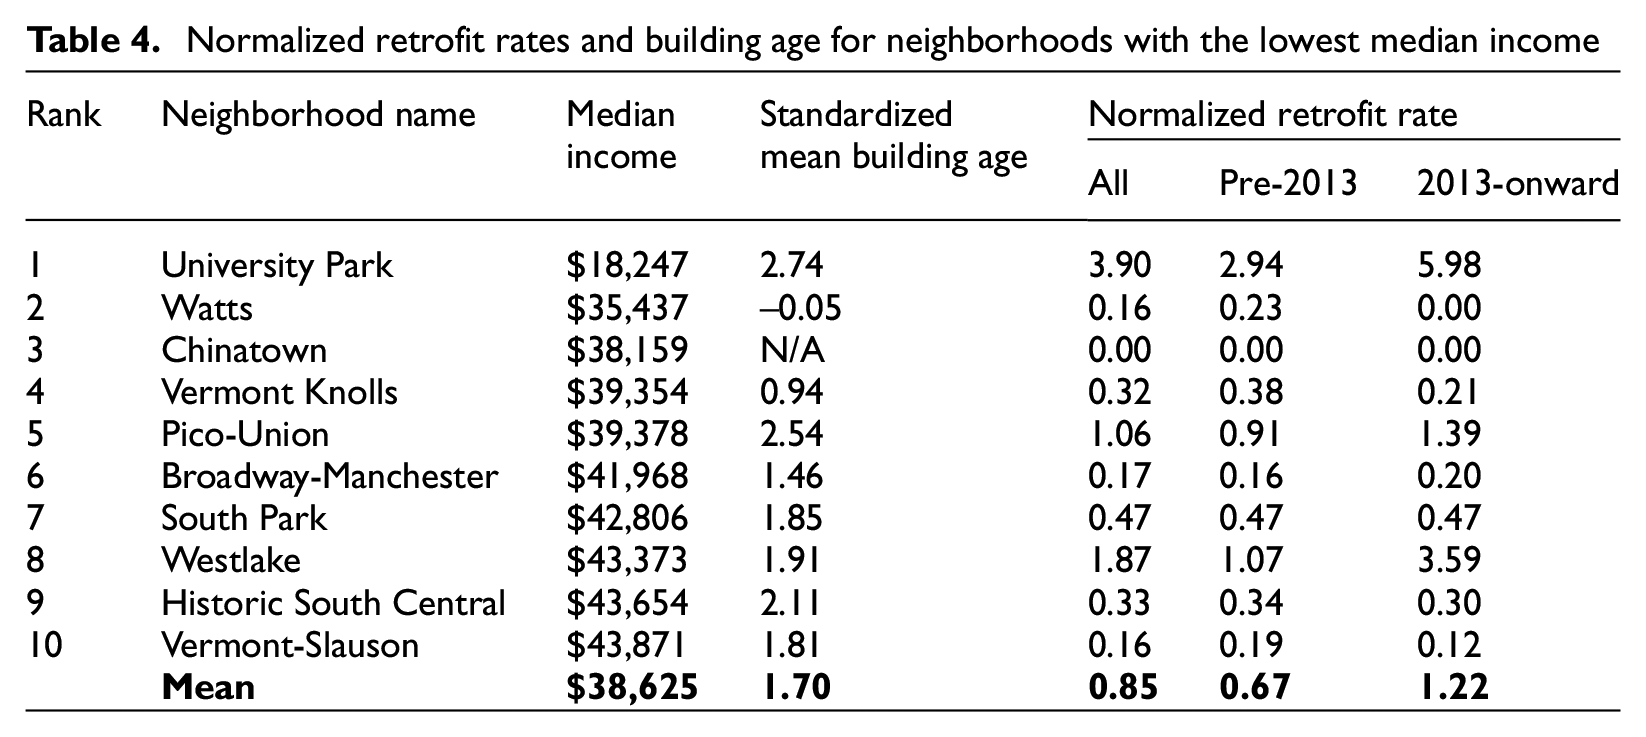
The retrofit rates for the ten neighborhoods with the lowest median income ($18,247 to $43,871) are presented in Table 4. Based on the average of the standardized mean age, these buildings are generally older compared to the entire city. Also, while the retrofit rate for these ten neighborhoods is 15% less than the citywide average, the EBB program (and possibly gentrification) appeared to have a significant impact. Prior to 2013, the normalized retrofit rate was only 0.67. This rate almost doubles (to 1.22) when only the 2013-onward retrofit data is considered, again highlighting the likely impact of the EBB program.
Normalized retrofit rates and building age for neighborhoods with the lowest median income
Census-tract level evaluation
The previous section provides two distinct but related types of high-level assessment approaches to elucidating the potentially inequitable distribution of cripple wall retrofits in LA City and the impact of the EBB program in terms of reducing those disparities. With the same goal, this section conducts a statistical analysis of the data. Specifically, the associative relationships between the retrofit rates and the various sociodemographic variables and building age are assessed by computing Pearson’s correlation coefficients. A logarithmic transformation is applied to the retrofit rate to satisfy the normality assumption underlying linear associations.
The correlations between the retrofit rate and the building age, as well as the seven sociodemographic variables, are shown in Table 5. To deal with the issue of confounding, the same table also presents the correlation between the building age and the sociodemographic variables. As noted earlier, the relatively high positive correlation between the retrofit rate and building age (0.37 for the entire retrofit data set) is not surprising (it is, in fact, the reason for raising the issue of confounding). The median home value is the variable with the next highest absolute correlation with the retrofit rate. For the entire inventory, that correlation is 0.36. However, the pre-2013 and 2013-onward coefficients are 0.37 and 0.29, respectively. In other words, there is a reduction in the positive correlation with the retrofit rate after the EBB program was introduced. Similarly, the impact of the program in terms of lessening disparities is reflected in the reduction in the correlation coefficient for the percentage of the population with higher education after the EBB program was introduced (0.26 to 0.13). For the percentage of Black households, the correlation with the retrofit rate is generally low across all subsets of the data. As observed in the previous subsection, the impact of the EBB program is also significant for Hispanic households, where the correlation with the retrofit rate is changed from −0.21 to −0.06. In other words, the negative correlation between the percentage of Hispanic households and the retrofit rate is reduced by a factor of about 3.5.
Correlation coefficients for retrofit rate and building age against the sociodemographic variables
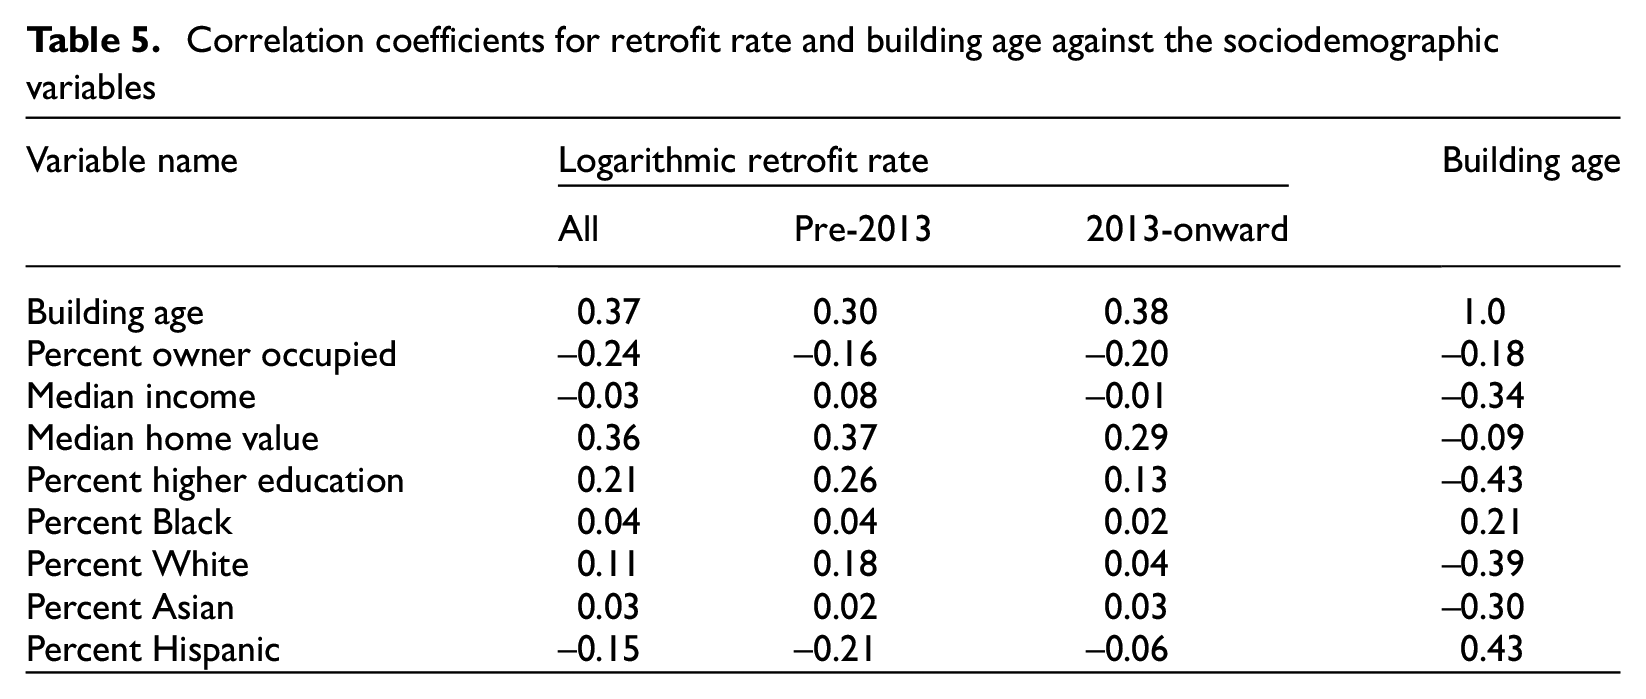
The correlations between the building age and sociodemographic variables shown in Table 5 reinforce the earlier finding that Black and Hispanic households generally occupy older buildings. Specifically, the correlation between the percentage of these two groups and the building age is positive. In contrast, the same correlation is negative for White and Asian households. As such, especially for Hispanic households, the correlations with the retrofit rate cannot be “explained away” by the correlations with the building age.
Summary and conclusion
This article evaluated the extent to which there are sociodemographic disparities in the cripple wall retrofits that have been performed in LA City. The possible effect of the CEA Earthquake Brace and Bolt (EBB) program (introduced in 2013) on these disparities was also investigated. The analysis employed retrofit data collected from the Los Angeles Department of Building and Safety (LADBS) and the Los Angeles Open Data Portal (LAODP). Additional relevant information on the inventory of one- and two-family dwellings as well as the sociodemographic makeup of the city, was also collected and utilized.
The overall goal of the study was to illuminate systematic trends in the spatial distribution of retrofits and associative relationships with several building-related and sociodemographic variables. From the spatial characterization, we found that the majority of retrofits are concentrated in the Central, Northeast, and Southern regions of the city. Even after normalizing the absolute counts by the total number of pre-1980 single and two-family residences, the neighborhoods in these three regions generally have the highest retrofit rates. This trend is generally aligned with the gentrification patterns across Los Angeles in the past decades. A visual bivariate spatial analysis found the distribution of retrofit rates to be consistent with the stated zip code level eligibility criteria for the EBB program. Specifically, retrofit rates were found to be high in locations with older buildings and/or high (relative to the rest of the city) seismicity.
We also examined the sociodemographic makeup of the neighborhoods with the highest and lowest retrofit rates. For the entire retrofit inventory, the analysis showed that White and Asian households are overrepresented (compared to the demographics for all of LA City), and Black and Hispanic households are underrepresented in those neighborhoods with the highest retrofit rates. Also, these same neighborhoods have a higher median income and percentage of the population with higher education than all of LA City. However, when the data is divided into pre-2013 and 2013-onward retrofits, the disparities are significantly less in the latter of the two. Specifically, the median income, median home value, and percentage of the population with higher education for the same set of neighborhoods are almost on par or lower than the citywide average when only the 2013-onward data is considered. Similarly, for the same data subset, Blacks are less (although still) underrepresented and Hispanics are overrepresented in the neighborhoods with the highest retrofit rates.
The retrofit rate in the ten neighborhoods with the highest percentage of Black and Hispanic households and the lowest median income (i.e., three separate sets of ten) is also considered. Despite having a mean building age that is more than one standard deviation greater than the citywide average, the retrofit rates are generally lower (compared to all of LA City) in the ten neighborhoods with the highest percentage of Black households. However, after 2013 (when the EBB program was introduced), there was a 36% increase in the retrofit rate in these ten neighborhoods. This set of findings also applies to the neighborhoods with the highest population of Hispanics and lowest income. However, the retrofit rates are significantly lower in the neighborhoods where Hispanic households are prevalent. Prior to 2013, the retrofit rate in these neighborhoods was 75% less than the rate for the entire city. From 2013 onward, the rate is still 46% less than all of LA City. These neighborhoods also have a mean building age that is more than one standard deviation greater than that of the entire city.
The correlation coefficients between the retrofit rate and the different building and sociodemographic variables were also computed. Overall, the signs of the correlations were consistent with the results from the previous stages of the analysis. For example, the retrofit rate was found to be negatively correlated with the percentage of the population that is Hispanic. Moreover, consistent with the earlier analyses, the representation of Black and Hispanic households is positively correlated with the building age (the correlation is negative for White and Asian representation). Also, for the percentage of the population that is Hispanic, the magnitude of the negative correlation is reduced by a factor of more than three after 2013.
In summary, the overall investigation found that the rate of cripple wall retrofits (i.e., after normalizing by the number of one and two-family residences) is generally lower in buildings occupied by Black and Hispanics. The results from the analysis based on pre-2013 and 2013-onward data suggest that the EBB program had the effect of increasing the retrofit rate in households occupied by these two groups. However, even after 2013, the overall rates in neighborhoods with high Hispanic representation remain much lower (slightly more than half) than in the rest of the city. The EBB program also appears to have had a significant impact on the retrofit rate for those neighborhoods on the low end of the median income spectrum. However, the overall rate for these neighborhoods is still 15% lower compared to the entire city. These findings have direct implications to the disparities in the immediate and lasting impacts of an earthquake event on the Los Angeles region in terms of economic losses and the displacement of residents from their homes. With that context, the following policy recommendations are suggested: (1) the EBB program should conduct targeted outreach to neighborhoods with the highest household representation of groups that have been shown to be underrepresented in the rates of retrofit, (2) local government (city and district) officials should partner with the EBB to support coordination with community-based organizations, and (3) social vulnerability should be explicitly considered when developing and implementing future grant-based programs that address specific seismic vulnerabilities (e.g., soft-story). It is notable that the most recent offering of the EBB program (2022–2023) includes a supplemental grant for income-eligible homeowners, which is likely to further address some of the lingering disparities that have been identified in this study.
An important limitation of this study is that none of the data that was utilized came from the CEA and the EBB program. As such, the percentage of non-EBB retrofits that occurred after 2013 is not known. Moreover, an explicit causal evaluation was not used to assess the potential impact of the EBB program. Therefore, even though the results strongly suggest that the program reduced disparities in the retrofit, a more detailed analysis that uses the EBB data and deals with the issue of confounding in a rigorous manner (e.g., using methods from the causal inference literature) would serve to reinforce our findings. However, the issue of privacy may limit or prevent access to the EBB data, making such studies quite challenging if not impossible. With the ultimate goal being to reduce the gap in seismic risk mitigation efforts, there is an opportunity to further investigate the drivers or barriers to retrofit using a mix of qualitative and quantitative methods (only the latter was used in this study). Finally, future studies should focus on quantifying these disparities using risk-based metrics that could inform the development of more equitable seismic risk mitigation policies.
Footnotes
Acknowledgements
The authors would also like to thank three anonymous reviewers for their invaluable comments, which helped advance the quality of this article.
Declaration of conflicting interests
The author(s) declared no potential conflicts of interest with respect to the research, authorship, and/or publication of this article.
Funding
The author(s) disclosed receipt of the following financial support for the research, authorship, and/or publication of this article: Funding for the first author’s participation in this study was provided by the University of California Multicampus Research Initiative. The second and third authors were funded by the Racial and Social Justice Grant provided by the Ralph J. Bunche Center for African American Studies at the University of California, Los Angeles. The fourth author is funded by the UC-HBCU program established by the University of California.