
Abstract
The southern East African rift system (EARS) is geologically rare considering its early-stage continental rift setting combined with a deep seismogenic zone. Several seismically vulnerable communities are located within this tectonically active region, resulting in a significant seismic risk. However, the ground motion and seismic hazard analyzes necessary to increase the earthquake preparedness in the region have been limited due to the relatively short instrumentation history and scarce ground motion data available. Here, we present a newly compiled ground motion database for the southern EARS which is critically lacking and preventing local ground motion studies. This database includes a regional catalog of 882 earthquakes spanning 1994–2022 (magnitudes 3–6.5) with available waveform records within epicentral distances of 300 km. Three different velocity models were used to relocate 256, 255, and 252 events, respectively, to quantify depth sensitivity, relocating events down to depths of 35–40 km. The final database contains 10,725 time-series records from 353 stations along with P- and S-wave phase arrivals for each record. The ground motion database contains peak ground acceleration and velocity and 5% damped pseudo-spectral acceleration for 291 frequencies from 1.0 to 30 Hz for the horizontal components. In addition, a Fourier amplitude spectrum table for 212 frequencies from 0.1 to 30 Hz is included. The database is accessible through the ISC repository (https://doi.org/10.31905/4GGVBFBE).
Keywords
Introduction
The East African rift system (EARS) is associated with a high seismic risk (e.g. Goda et al., 2016; Hodge et al., 2015; Poggi et al., 2017; Williams et al., 2023). The EARS extends from the African-Arabian (AFAR) triple junction in the north to Mozambique in the south through the Eastern and Western Branches and encompasses several different styles of rifting, including initial sea-floor spreading in Afar, magmatic continental rifting in the Main Ethiopian and Kenyan Rifts, and amagmatic early-stage rifting in the Malawi and Luangwa Rifts (e.g. Craig et al., 2011), see Figure 1. In addition to being a rare early-stage continental rift zone, the southern EARS (encompassing the Western Branch, the Southwestern Branch, and the southern tip of the Eastern Branch, see Figure 1b) has an unusually thick seismogenic zone with earthquakes occurring down to depths of 35–40 km (Biggs et al., 2010; Craig et al., 2011; Craig and Jackson, 2021; Gounon et al., 2022; Jackson and Blenkinsop, 1993). While there are few earthquakes in the instrumental catalog due to the region’s short instrumental record and the relatively slow spreading rate of the Eastern and Western Branches (0.4–3.1 mm/y; Stamps et al., 2021; Wedmore et al., 2021), there have been several damaging, moderate-sized events in the region that caused deaths and economic loss in the local communities (e.g. Poggi et al., 2017). Moreover, several studies have identified larger faults with the potential to host magnitude 7–8 earthquakes (e.g. Ebinger et al., 2019; Jackson and Blenkinsop, 1997; Wedmore et al., 2020, 2021; Williams et al., 2021), highlighting the potentially hazardous events to the surrounding communities. For earthquake preparedness, it is crucial to have a good understanding of the earthquake ground motions in a region. There have been a few studies focusing on ground motion models (GMMs) (Tuluka, 2007) and probabilistic seismic hazard assessments (PSHAs) (Goda et al., 2016; Hodge et al., 2015; Poggi et al., 2017; Williams et al., 2023) for the area. However, the uncertainties of these studies are greater due to the area’s limited number of seismic stations in combination with the infrequency of large earthquakes. In fact, the PSHA studies all relied on GMMs developed for other regions.
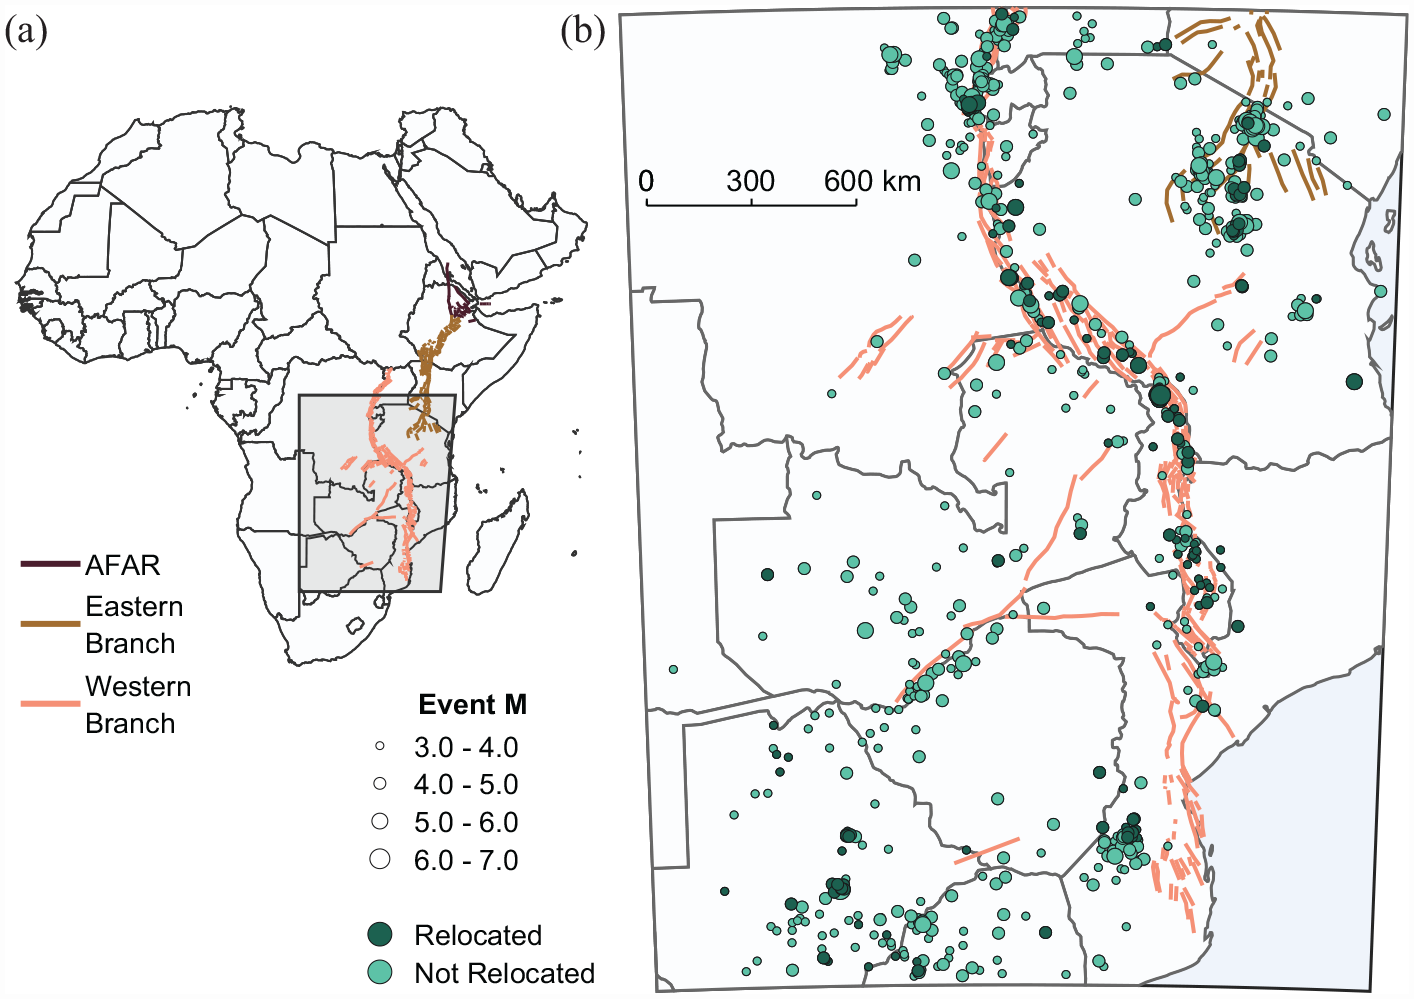
(a) Overview map of Africa, highlighting the active faults from the African-Arabian (AFAR) triple junction, Eastern Branch, and Western Branch from the GEM Global Active Faults Database (Styron and Pagani, 2020), including the Malawi Active Fault Database (Williams et al., 2022). (b) Zoom-in on the southern EARS study area, showing the 882 earthquakes in the compiled catalog with magnitude (M) ≥3.0. For relocated events, the locations using the S21 (Stevens et al., 2021) velocity model are shown (see the Relocated catalog section for more details).
In this article, we assembled a ground motion and time-series database of the publicly available earthquake data from the southern EARS region since 1980. We first compiled an earthquake catalog for the region and collected all publicly available earthquake data within epicentral distances of 300 km, after which we relocated the earthquakes to improve any possible location discrepancies due to original catalog locations using regional stations alone. Finally, we computed peak ground accelerations (PGAs), peak ground velocities (PGVs), 5% damped pseudo-spectral accelerations (PSAs), and Fourier amplitude spectra (FASs).
Data collection and quality control
To create the southern EARS ground motion database, we first compiled an earthquake catalog for the region by searching for any earthquakes within the study area with magnitudes ≥3 that occurred after 1980. For our initial earthquake search, we used the International Seismological Center (ISC) Bulletin (Bondár and Storchak, 2011; International Seismological Centre, 2022b) and the ISC Engdahl-van der Hilst-Buland (ISC-EHB) bulletin (Engdahl et al., 1998, 2020; International Seismological Centre, 2022a; Weston et al., 2018), where the ISC-EHB contains selected, teleseismically well-constrained events with smaller depth errors (<5 km for Level 1, 5–15 km for Level 2, and >15 km for Level 3). In addition, we included the earthquakes detected in southern Malawi by Stevens et al. (2021, hereafter S21) during a temporary deployment of geophones to study active faults south of Lake Malawi, and the events whose depths were constrained using teleseismic depth phases by Gounon et al. (2022). This resulted in an initial catalog of 5512 events. Next, we detected and removed 316 duplicates by searching for any earthquakes within 60 s and with epicenters within 50 km of one another. These search margins were chosen after manual inspection of duplicates, using a larger distance margin due to sparse station coverage in the region at times. We kept the earthquake entry based on the following order: (1) Gounon et al. (2022), (2) ISC-EHB, (3) ISC, and (4) S21. The Gounon et al. (2022) compiled catalog was assumed to be the most accurate because they constrained the earthquake depths using depth phases and complemented their events with Craig et al. (2011) events, ISC-EHB catalog events with Level 1 depth errors, and ISC catalog events with a pP-depth phase parameter available. This was followed by the ISC-EHB and the ISC catalogs. The S21 catalog did not overlap with any of the others, and so its priority order did not matter. For the magnitude selection, we prioritized the moment magnitude
Using our compiled catalog of southern EARS earthquakes, we downloaded all available time-series data that were recorded at stations within 300 km (epicentral distance) of the events from the Incorporated Research Institutions for Seismology (IRIS) using ObsPy (Beyreuther et al., 2010). In addition to IRIS, data from the Malawi Geological Survey (network code: MW) and the S21 study (network code: SM) were also used. For all networks, each time-series record starts 30 s before its earthquake origin time and lasts a total of 3.5 min (unless there were timing errors or gaps in the available data). All records were initially preprocessed by detrending and applying a 5% cosine taper, followed by instrument correction and conversion to Seismic Analysis Code (SAC, Goldstein et al., 2003; Goldstein and Snoke, 2005) files. For the records downloaded via IRIS, this was performed using ObsPy. For the MW and SM networks, the data were initially provided in miniSEED format and the instrument response in poles and zeros. For these, we used MATLAB to preprocess, instrument correct, and save the data in the SAC format, consistent with the IRIS downloads. In the end, we downloaded or received waveform data from stations within 300 km epicentral distance for 1089 out of the initial 5196 earthquakes, resulting in 16,646 records.
Next, we manually inspected all the time-series records for quality control. This was done simultaneously as P- and S-wave phase picking. For the manual inspection, first a bandpass Butterworth filter between 0.8 Hz and 80% of the instrument’s Nyquist frequency was applied. Any records without clear P- and S-wave phases were discarded. This resulted in a total of 10,725 good-quality records from 882 earthquakes (see Figure 1b), most of which occurred after 2007, coinciding with the establishment of more modern seismic networks in the region. Forty-five of these events were originally reported in
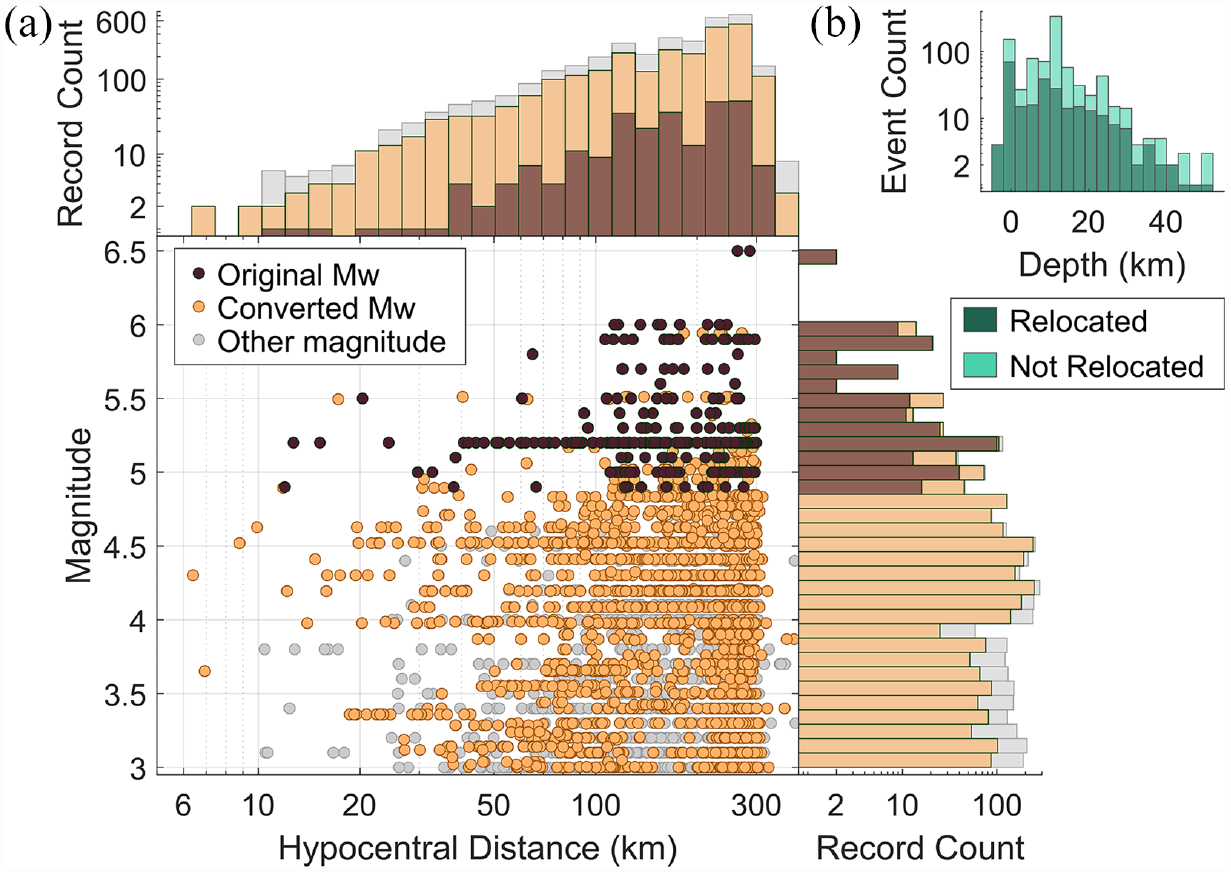
(a) Distribution of magnitudes and hypocentral distances of earthquake records that have clear P- and S-wave picks. Records with an original moment magnitude
A total of 353 stations from 23 different permanent and temporary networks were used in the southern EARS time-series database, see Table 1 for network details. The spatial distribution of these stations and the years they were active is shown in Figure 3. The instruments varied and were either geophones, seismometers, or strong-motion sensors. To get an estimate of the site conditions at each station, we also provided a proxy for the time-averaged shear-wave velocity in the upper 30 m
Seismic network names and references (if available) used in the ground motion database
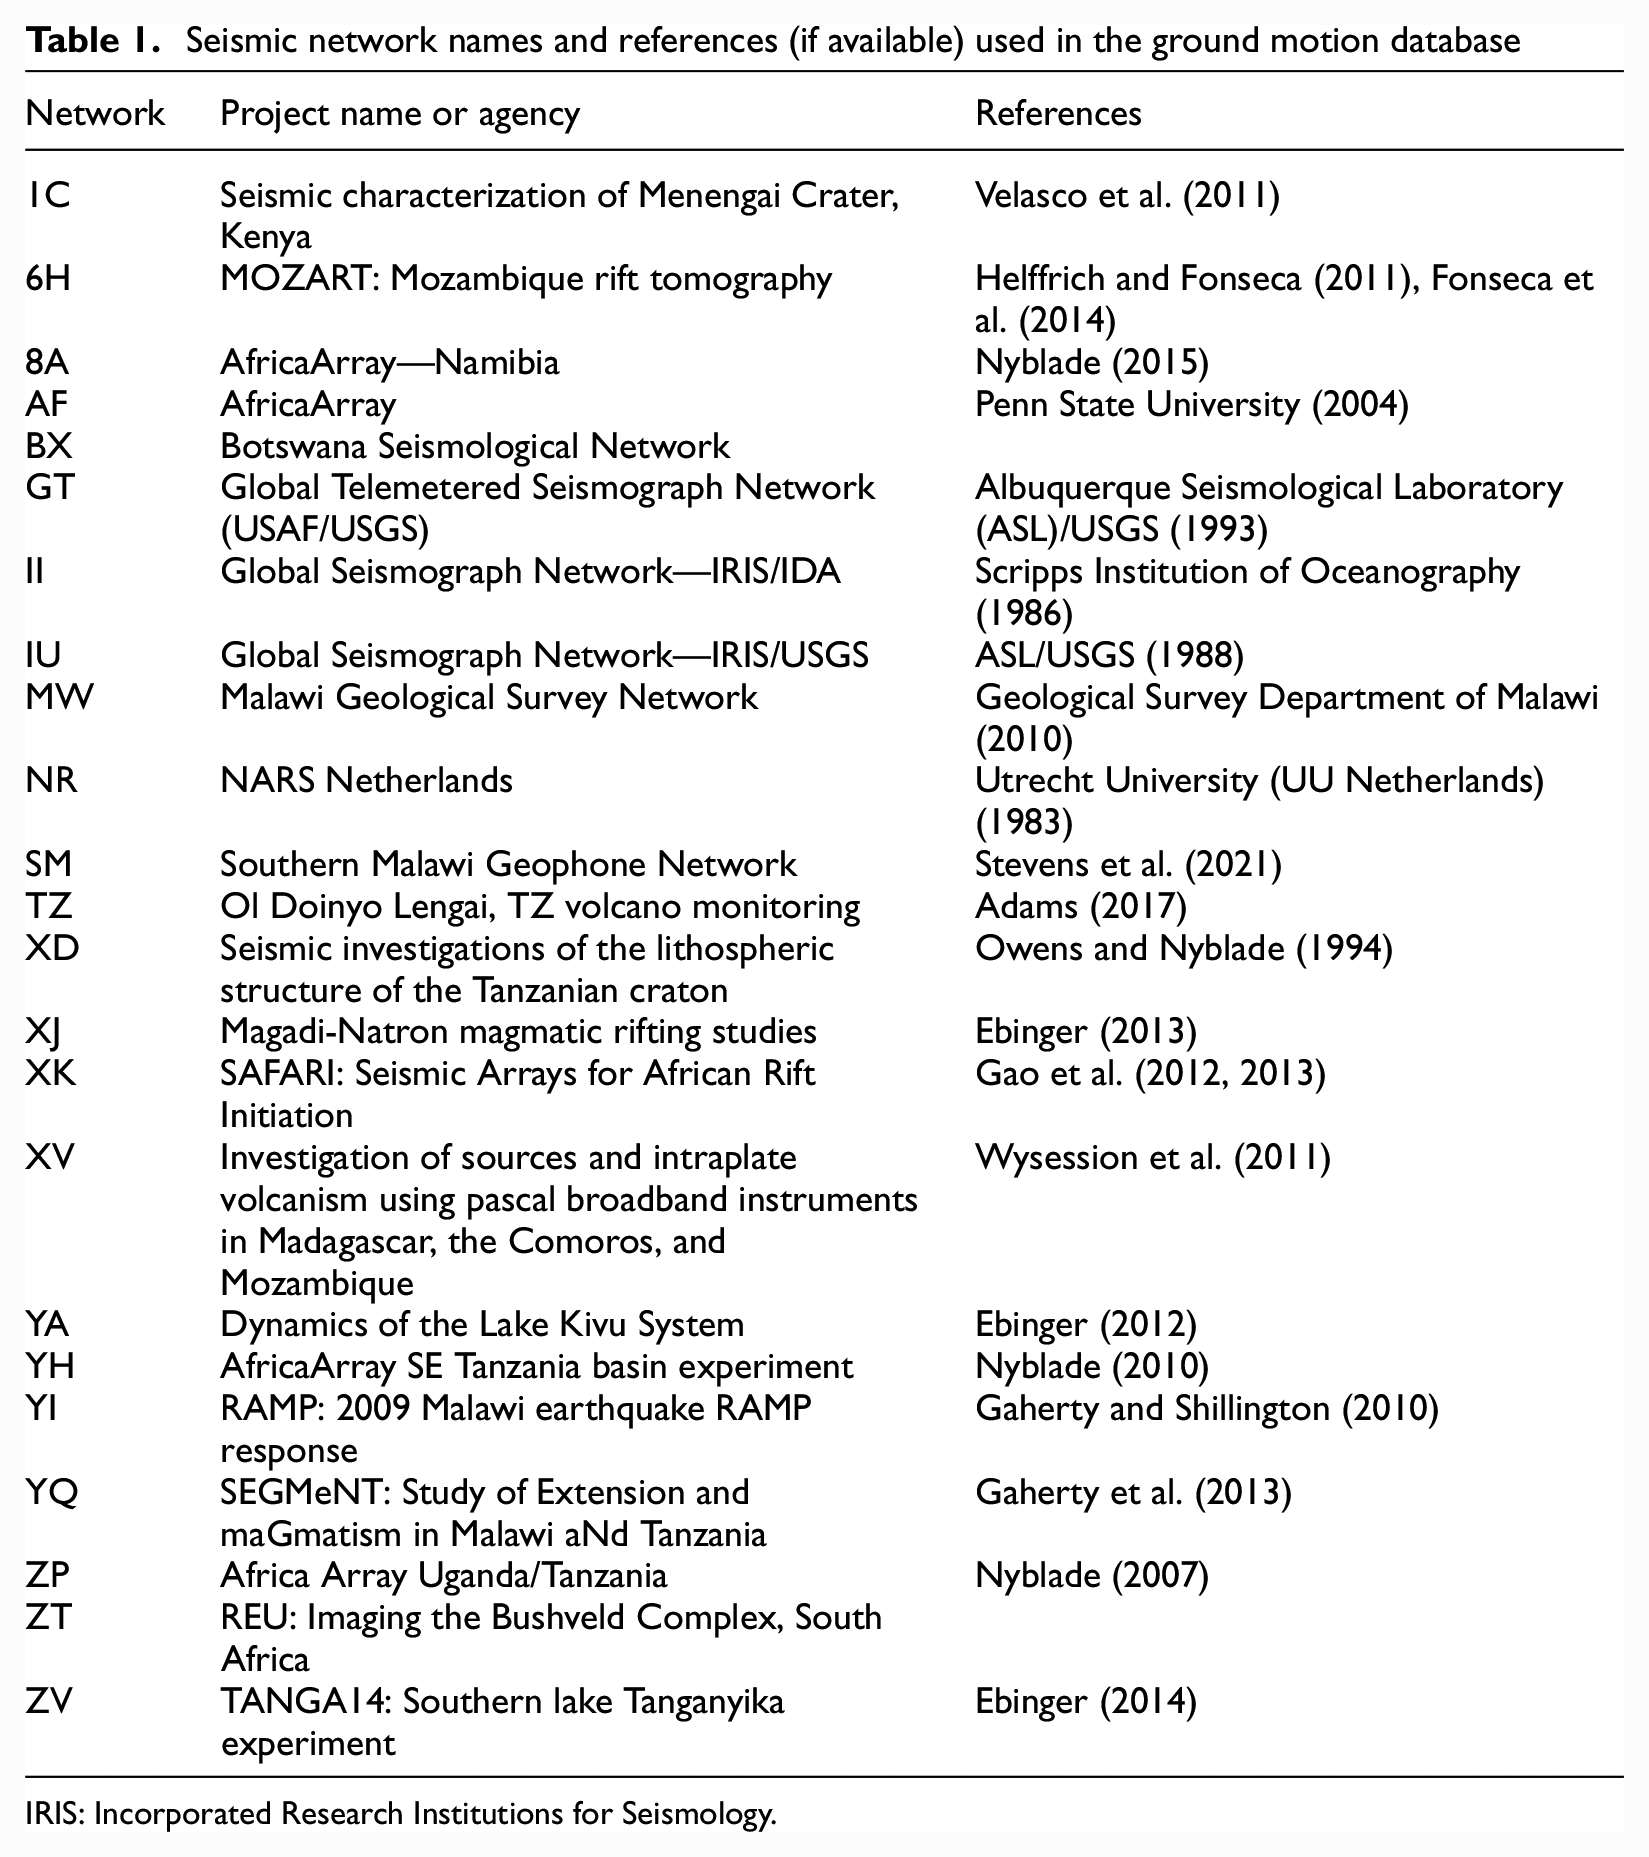
IRIS: Incorporated Research Institutions for Seismology.

(a) A map of the stations with available waveform data within the study area. The study area is highlighted by the solid-lined box. Permanent network stations are shown with circles, and temporary network stations are shown with triangles. Rivers are shown as light blue lines. (b) The active years for each seismic network used. The network identifier code and number of stations used for each network is shown to the left, as well as the symbol and color used in (a). See Table 1 for more network details.
Relocated catalog
Earthquakes at close distances are generally associated with strong seismic hazard, thus accurate earthquake locations are crucial when modeling or analyzing ground motions. In our compiled southern EARS catalog, many of the ISC earthquake locations were determined using regional stations where the closest stations were at times 400–800 km away from the epicenter. Because we were only considering records within 300 km in our ground motion database, this could lead to large location discrepancies, especially at close distances. We therefore used the manually picked P- and S-wave phases to relocate the earthquakes using the probabilistic, nonlinear, global-search NonLinLoc software (Lomax et al., 2000, 2014).
There are two regions with published local velocity models from within the study area: Ebinger et al. (2019, hereafter E19) developed a velocity profile for the Rungwe Volcanic Province and the northern Malawi rift, and Stevens et al. (2021: S21) developed a profile for the southern end of Lake Malawi. One difference between these two models is the presence of a ∼5 km thick sedimentary basin in the E19 velocity model, whereas the S21 model was developed in an area with a thin layer of sediments, as illustrated in Figure 4. Based on the global crustal model CRUST1.0 (Laske et al., 2013), the basin depth is mostly negligible along the Western and Eastern Branches of the EARS but can be up to 2.4 km for parts of northern Malawi and 7.5 km for southern Mozambique. Thus, we considered both the E19 and S21 models as endmembers to encompass depth uncertainties originating from regional differences in sedimentary thickness. In addition, we used an adaptive velocity model based on the velocity profile from CRUST1.0 that is nearest to the earthquake being relocated. CRUST1.0 is a 1-by-1-degree global model describing seismic velocities down to the Moho and can thus capture regional differences in basin and crustal depth. The range in CRUST1.0 velocity profiles used is highlighted in Figure 4.
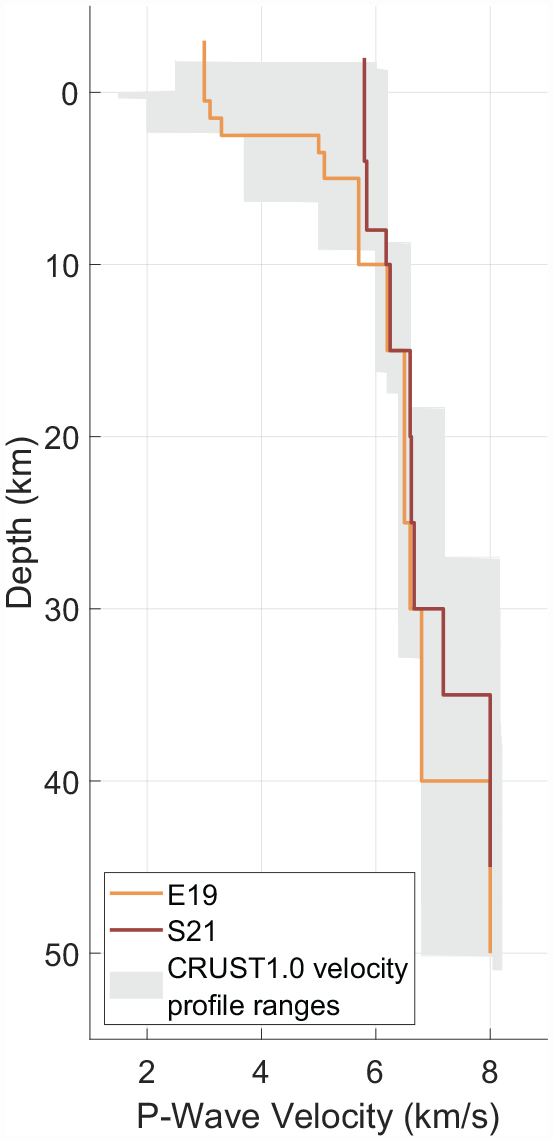
The P-wave velocity models used in the NonLinLoc relocation. The E19 (Ebinger et al., 2019) and S21 (Stevens et al., 2021) 1D velocity profiles are shown, as well as the range of 1D velocity profiles used from the CRUST1.0 global model.
For the nonlinear relocation, we used NonLinLoc’s Oct-tree search algorithm to find the maximum likelihood hypocentral location (Lomax et al., 2000). For each earthquake, we defined the grid space using 1 × 1 km grids, spanning down to 60 km depth and covering an area of
NonLinLoc produces multiple outputs for each relocated earthquake, including the hypocenter with its 68% confidence ellipsoid and the origin time with the root mean square (RMS) travel time residual. After manually inspecting each relocated event, we discarded any hypocenters with location uncertainties (the semi-major axis length of the 68% confidence ellipsoid) greater than 50 km and travel time errors greater than 10 s. While a location uncertainty limit of 50 km is generous, one of the criteria we used to evaluate the improvement of the new locations was the earthquake time-series moveout with respect to hypocentral distance
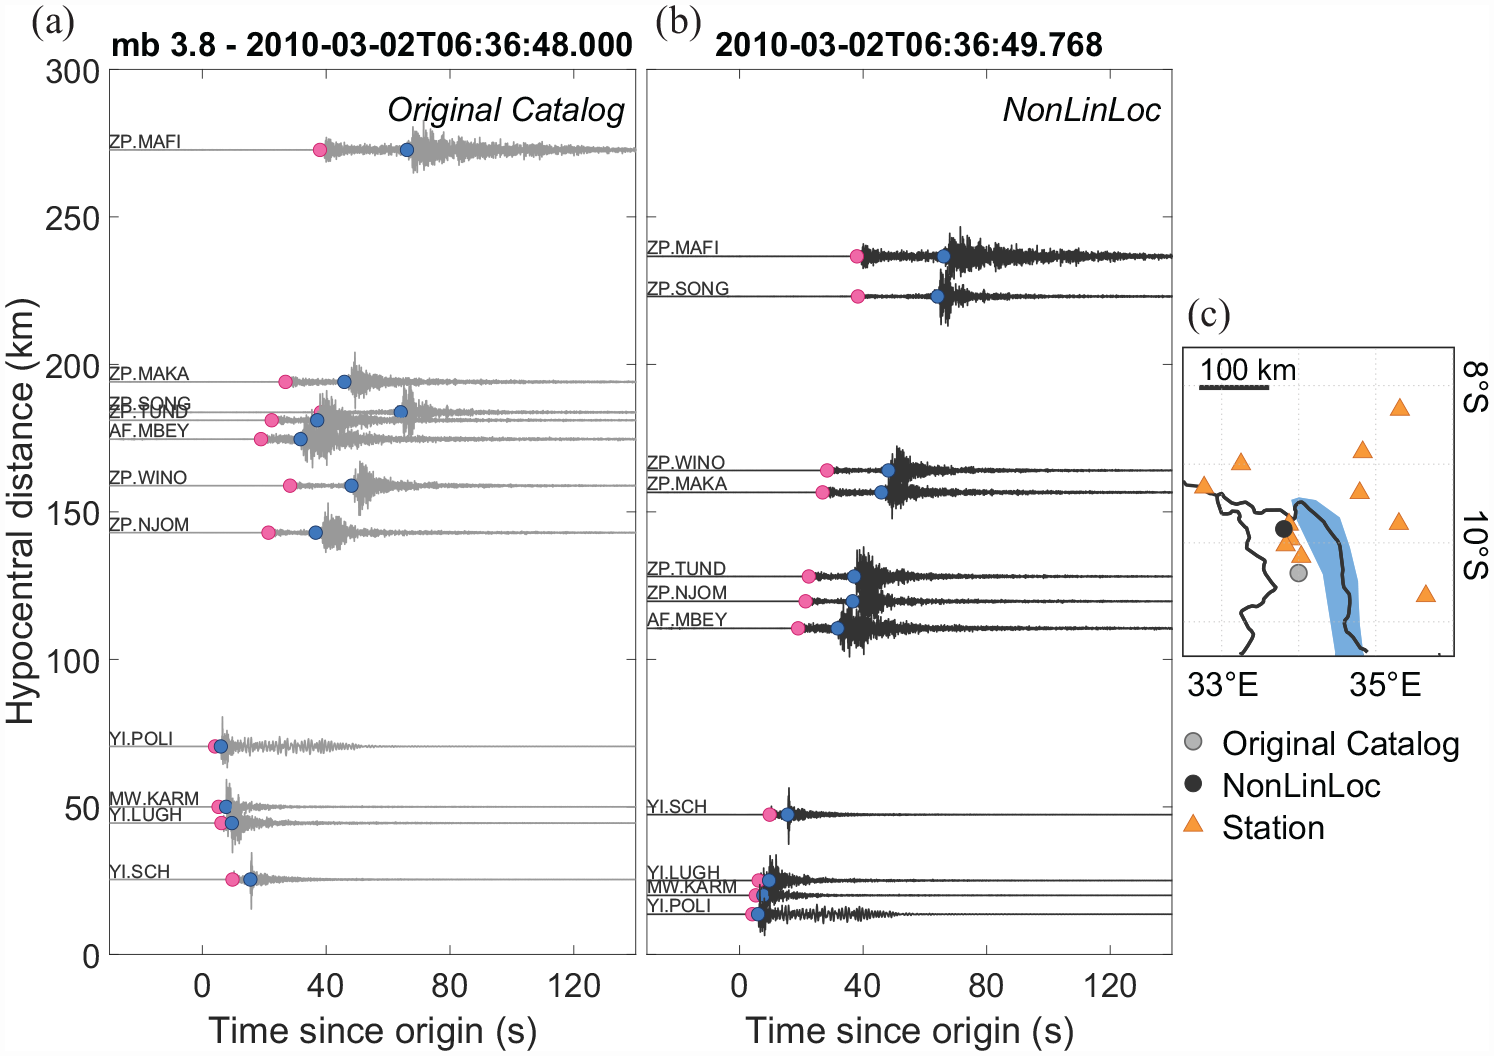
Example of a relocated event (catalog id: 20100302_063648, north component) from northern Malawi using the S21 velocity model. (a) Event time series shown as a function of hypocentral distance from the original catalog location, with P- and S-wave phase picks highlighted by pink and blue circles, respectively. (b) Same as (a) but for the event’s S21 NonLinLoc relocation. (c) Map view of the original catalog and new NonLinLoc relocation. This event has a 6 km location uncertainty using the S21 velocity model.
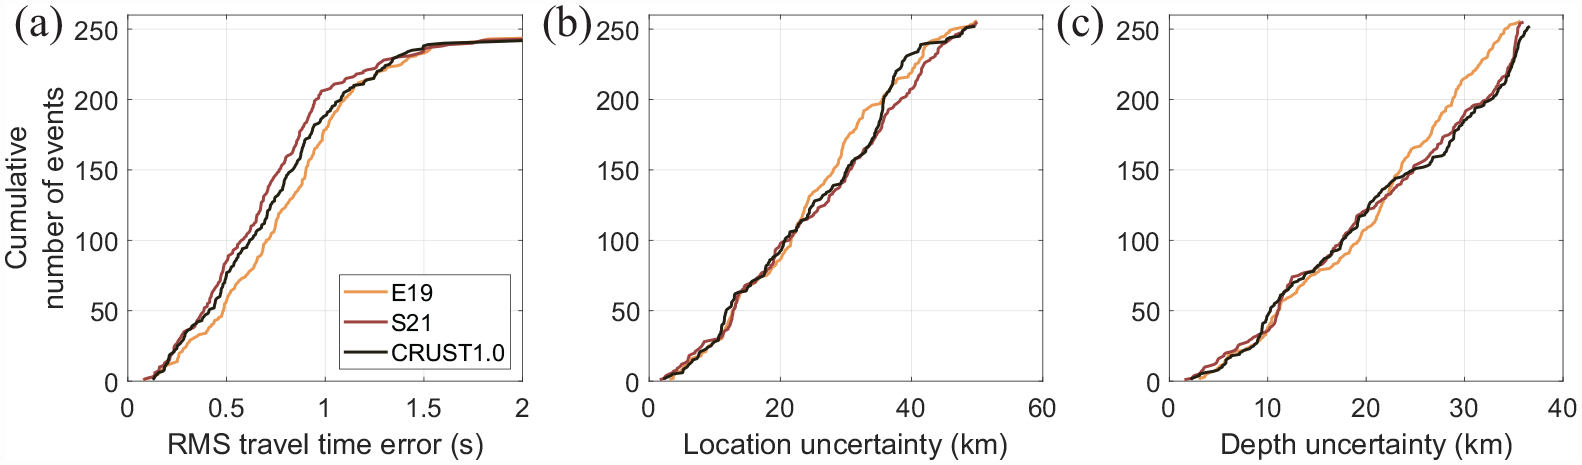
NonLinLoc uncertainty statistics for each of the three velocity models considered. (a) Root mean square (RMS) travel time error plotted against the cumulative number of events. (b) and (c) Comparison of the distributions of location uncertainty (semi-major axis length of the 68% confidence ellipsoid) and depth uncertainty, respectively.
Figure 7 shows the final locations in map and depth view for the three velocity models divided into three subgroups: the Western Branch, Eastern Branch, and Botswana events. As can be seen, earthquakes previously assigned a fixed 10 km depth were found to have a wide distribution in depth, highlighting the importance of relocating earthquakes. The depths of the earthquakes also clearly depended on the velocity model. The E19 velocity model (Figure 7a), which assumes a thicker sedimentary layer, led to the deepest hypocenters and may therefore be the most reliable for earthquakes along the Western Branch in northern Malawi (latitude
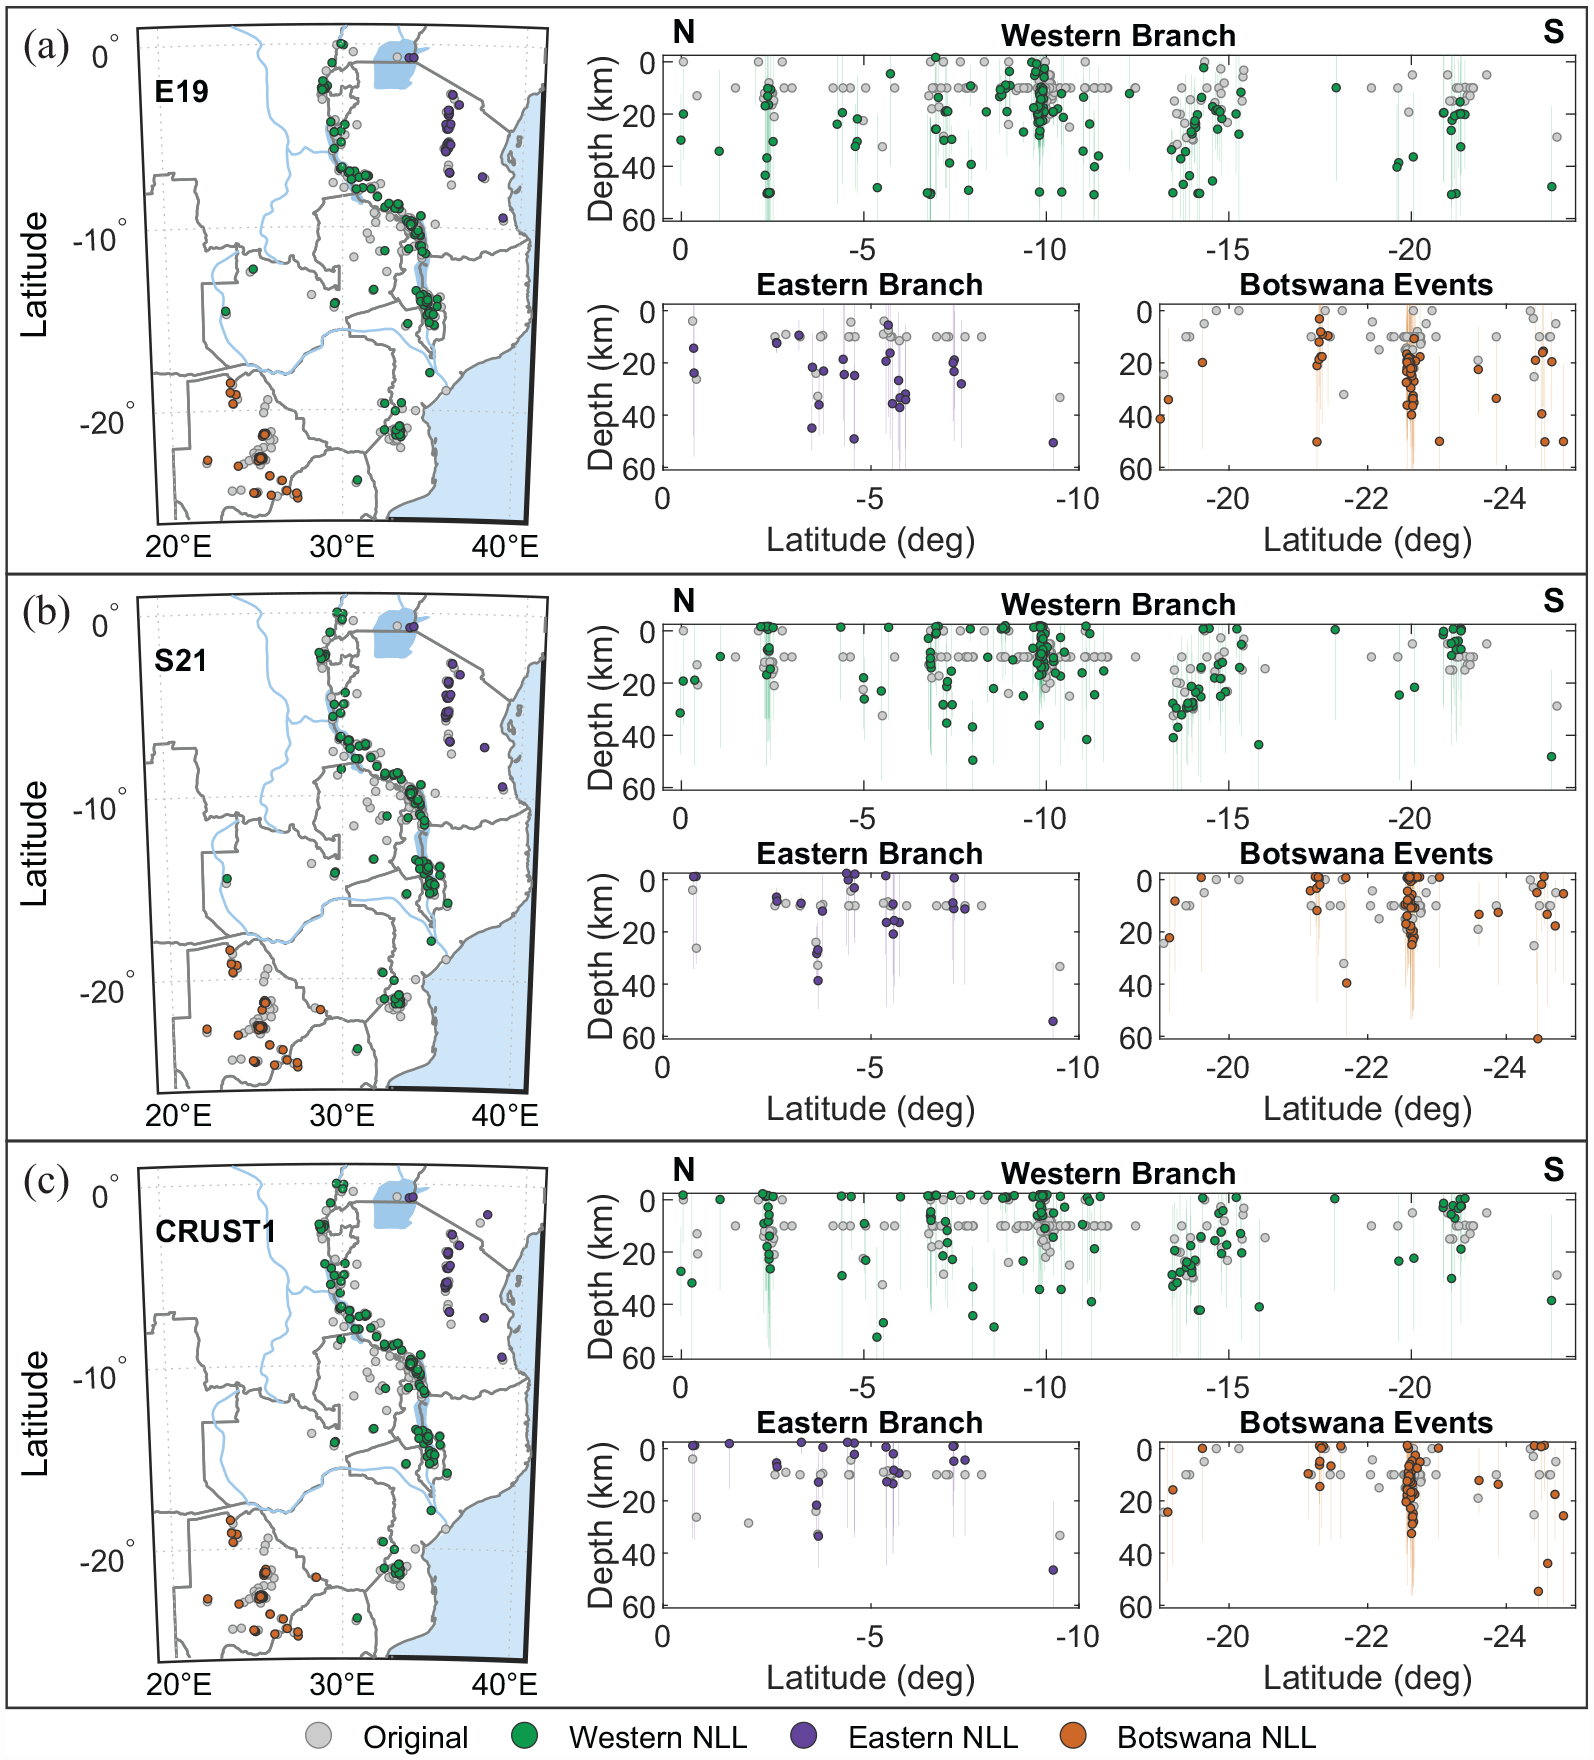
(a) NonLinLoc relocation results using the E19 velocity model, showing the map view to the left and the depth profiles with respect to latitude for the Western Branch, Eastern Branch, and Botswana events to the right, where the vertical lines show the depth uncertainty for each relocated event. (b) and (c) are the same as (a) except using the S21 and CRUST1.0 velocity models, respectively. Original catalog locations are denoted by light gray circles, and the new locations are shown as dark colored circles based on region.
For the remaining earthquakes that were not relocated, we determined if a location is acceptable for each record based on the time difference between the P- and S-wave phase arrival (S-P time). Figure 8 shows the P- and S-wave travel times for all three velocity models and the original catalog. As can be seen, there were many outliers caused by station timing errors (any records with timing errors larger than 10 s were flagged in the database phase file, see the Repository section). However, when the S-P times were plotted (Figure 8b), these outliers disappeared. We found the following empirical bilinear relationship for the S-P time when plotted against

where
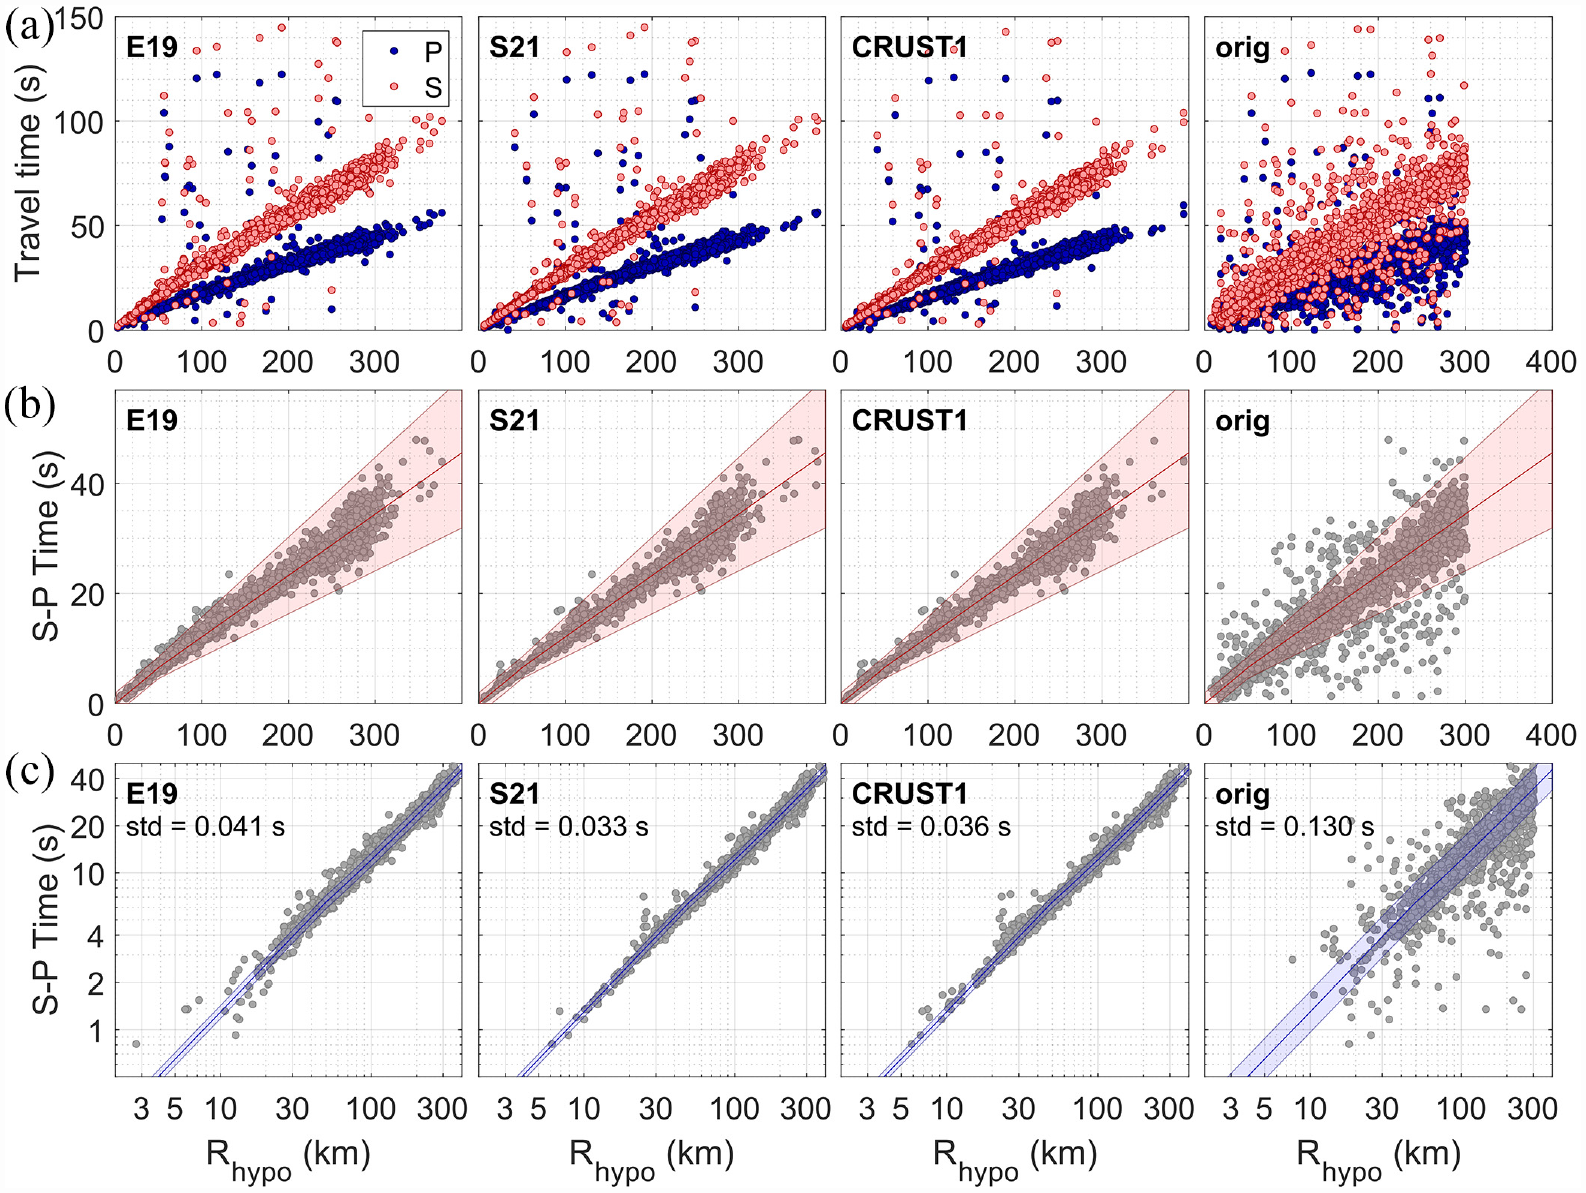
(a) The P- and S-wave travel times plotted against hypocentral distance
Ground motion database
To produce the ground motion database, we followed the signal processing steps outlined by Goulet et al. (2021) for the Pacific Earthquake Engineering Research Center (PEER) Next Generation Attenuation Relationships for Central and Eastern North-America (NGA-East) ground motion database. We computed 5% damped PSA, PGA, and PGV ground motion intensity measures and FAS for each record that passed the initial quality control outlined in the Data collection and quality control section. Furthermore, before we processed the time series, we made sure there were no multiple records for the same earthquake-station pair due to multiple seismic instruments at the site. For these, we only processed one instrument chosen in the following order: (1) accelerometers - short period (instrument code: HN*, where * is a wildcard for the instrument orientation) or extremely short period (EN*), (2) broadband seismometer (BH*), (3) high broadband seismometer (HH*), and (4) geophones (HP*). Figure 9 shows the processing steps of an example trace.
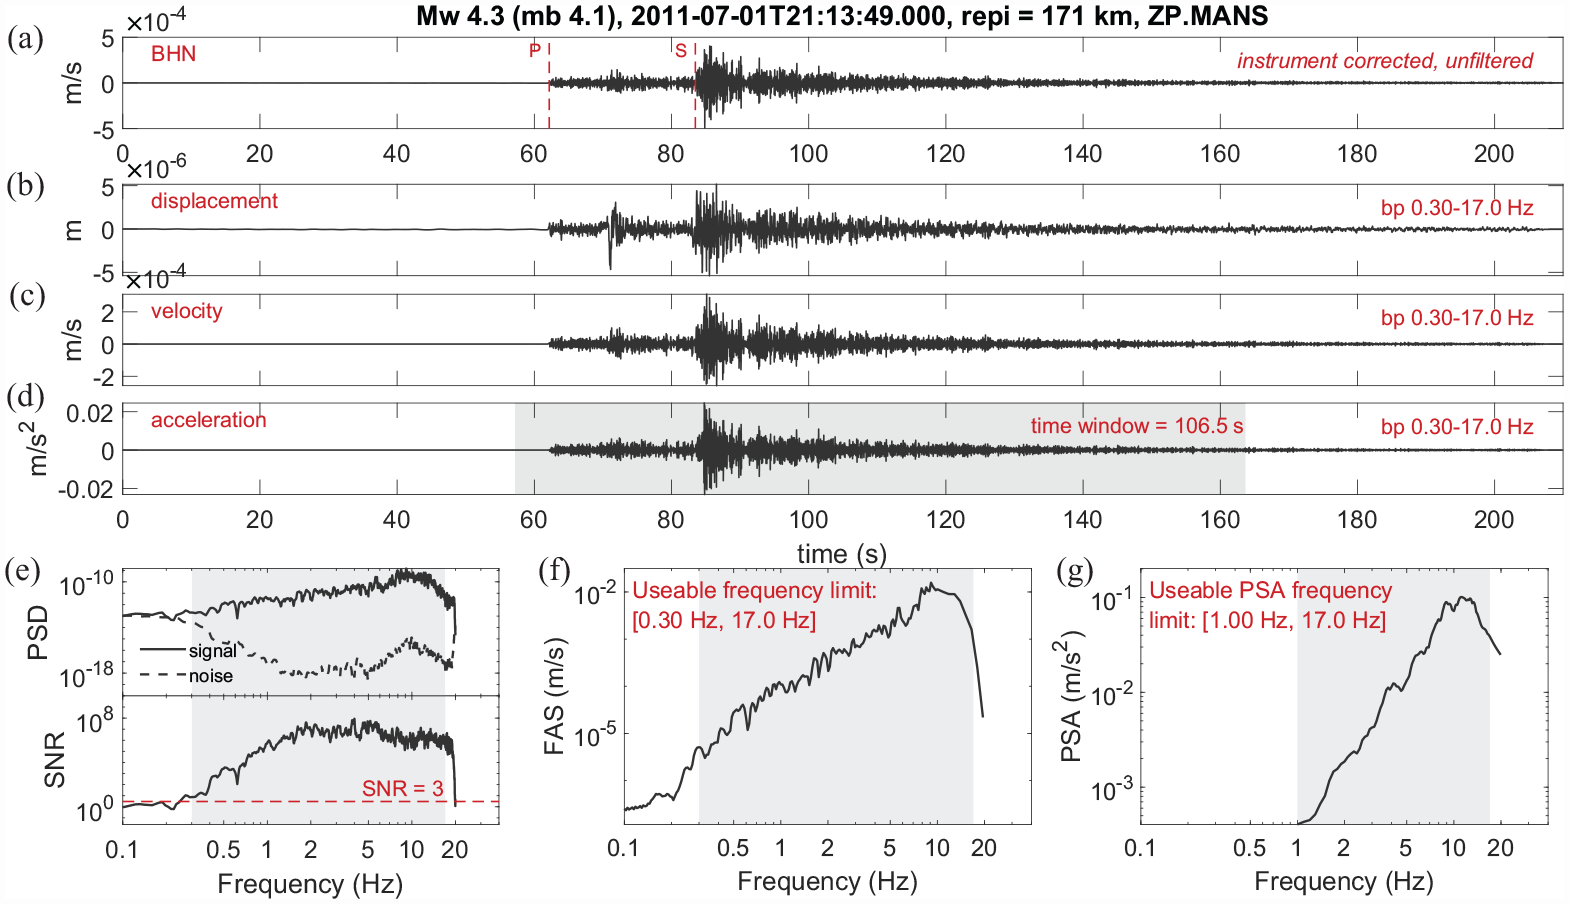
Example of the processing steps used to calculate response spectra (example event catalog id: 20110701_211349). (a) Instrument-corrected, unfiltered trace with the P- and S-wave phase arrivals indicated. (b–d) Filtered and baseline corrected displacement, velocity, and acceleration traces, respectively. The time window is highlighted in the acceleration trace. (e) Power spectral density (PSD, top) and signal-to-noise ratio (SNR, bottom), with the frequency bandwidth with SNR ≥3 highlighted. (f) Fourier amplitude spectrum of the acceleration time series. (g) Response spectrum with the useable frequency bandwidth highlighted.
Before we computed the ground motion intensity measures, we started by calculating the signal-to-noise ratio (SNR) to determine the useable frequency bandwidth for each record (Figure 9e). To ensure the P-wave, S-wave, and most of the coda energy were covered by the signal time window; we let it start 5 s before the P-wave arrival and defined its duration based on the record’s S-P time, allowing for a minimum duration of 30 s:

Because the records start 30 s before the original catalog’s origin time, there was not enough pre-P-wave content for a noise time window of the same length as the signal time window. For this reason, we started the noise window 5 s after the record starts to avoid any tapering effects and stopped it 3 s before the P-wave arrival. We discarded any records where we had less than 10 s of noise window to ensure we had enough frequency resolution at frequencies down to 1.0 Hz, which was the lowest frequency we considered in the PSA domain for this database. Next, we computed the power spectral density (PSD) for the signal and noise windows using the multitaper approach (Prieto et al., 2009). Before the SNR was computed, the noise PSD was interpolated to match the signal PSD frequencies. The useable frequency bandwidth was determined using a SNR threshold of 3.0. We set the minimum useable frequency corner to the lower SNR limit, with a minimum limit of 0.1 Hz. The maximum frequency corner was set to the upper SNR limit, with a maximum limit corresponding to 85% of the Nyquist frequency to avoid instrument effects.
Next, using the full trace, we bandpass filtered each acceleration record based on its useable frequency bandwidth. For the traces that were recorded in velocity, we first numerically differentiated to obtain acceleration. Before applying a zero-phase (acausal) filter, each record was padded with zeros to avoid the wrap-around effect caused by the high-pass filter (e.g. Boore, 2005, 2012; Goulet et al., 2021). After applying a 5% cosine taper, we padded each full record by zeros of equal length to the trace before and after, resulting in a trace three times the initial length. Next, we applied a 2-pole, 2-pass, Butterworth bandpass filter and then stripped the zero padding from the traces and tapered again. Boore et al. (2012) discuss how removing the zero padding can introduce a baseline drift in the displacement time series caused by a constant introduced to the velocity time series by the acausal filter. To avoid this effect, we followed the PEER NGA baseline correction approach outlined by Boore et al. (2012). We integrated the acceleration trace to displacement and fit it to a sixth-order polynomial, where the first two coefficients were fixed to 0 to remain compatible with the displacement and velocity time series. The baseline correction was then performed by removing the second derivative of the polynomial from the acceleration time series, after which velocity and displacement time series were also obtained (Figure 9b to d).
Finally, to obtain the ground motion intensity measures, we first windowed the filtered traces using equation 2, see Figure 9d. For the two horizontal components, we computed PGA, PGV, and the 5% damped response spectrum at 291 frequencies between 1.0 and 30 Hz using the Nigam and Jennings (1969) numerical solution (Figure 9g). If the useable frequency limits from the SNR step were within the 1–30 Hz bandwidth, we set the minimum usable PSA frequency to 1.25 times the minimum frequency defined in the SNR step (e.g. Ancheta et al., 2014; Goulet et al., 2021). This is because PSA samples roughly 25% below the corresponding Fourier amplitude frequency. For the maximum useable PSA frequency, we set it equal to the maximum Fourier frequency limit found in the SNR step if it was below 30 Hz. If both horizontal components were available, we also computed the RotD50 intensity (Boore, 2010). After removing any outliers, most commonly because of incorrect or unavailable instrument response information, this resulted in 5922 horizontal and 2919 RotD50 measurements (of which 4136 and 2033 have Mw estimates, respectively). Figure 10 shows the RotD50 PGA estimates, comparing the
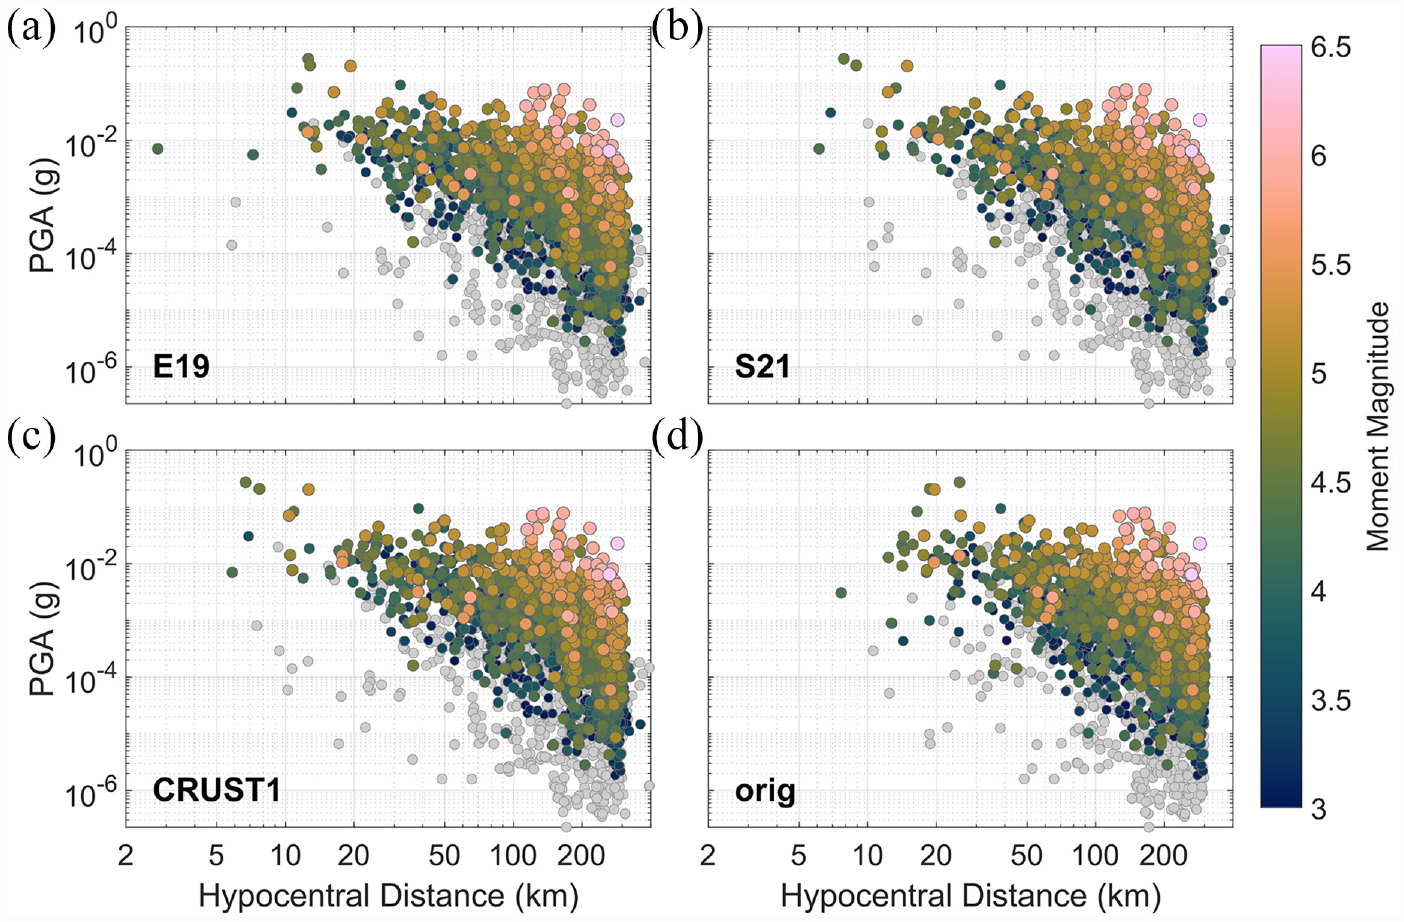
RotD50 peak ground acceleration (PGA) plotted against hypocentral distance for the three velocity models used: (a) E19, (b) S21, and (c) CRUST1.0, and (d) the original catalog locations (orig). Records with available moment magnitudes are colored, and the remaining records are shown as light gray.
Repository
The southern EARS ground motion database can be found in the ISC dataset repository (https://doi.org/10.31905/4GGVBFBE). It contains five products:
The earthquake catalog of all the events with at least one publicly available record within 300 km epicentral distance with clear P- and S-wave phase arrivals. The first column is the event name of format yyyymmdd_HHMMSS and is based on the date and time stamp of the event’s origin time in the original catalog. We include a column with the moment magnitude
A station catalog providing details on each station used in the database. It lists station locations and instrument information. We also include the USGS VS30 measurement (Heath et al., 2020) and useful notes, for example, if the station experienced any timing issues or if the instrument response is missing.
A phase file containing all the record P- and S-wave picks in absolute time. We also flag all records with station timing issues larger than 10 s. These records must have acceptable S-P times based on their
A ground motion table containing the 5% damped PSA between 1 and 30 Hz, PGV, and PGA for all individual horizontal records processed and the RotD50 of the combined horizontal components. Any outliers due to incorrect or missing instrument response have been removed. For each record, the moment magnitude (
A FAS table containing the FAS for all individual horizontal component and the EAS of the combined horizontal components. Any outliers due to incorrect or missing instrument response have been removed (same records as for the ground motion table). The event- and record-detail columns outlined in the ground motion table are also included in the FAS table.
An earthquake time-series database of 10,725 records with clear P- and S-wave phase arrivals. The time series are provided as instrument corrected SAC files in their original orientations, organized into event folders. The event folder name is in the format yyyymmdd_HHMMSS and matches the date and time stamp of the event from the original catalog. The records have names based on the seismic network, station name, and component such as MW_ZOMB_BHN.SAC. Any records for which instrument response was not available will have “_raw” appended to the file name (e.g. MW_ZOMB_BHN_raw.SAC). The units are in m/s for the broadband, high broadband, and geophone instruments (instrument codes: BH*, HH*, and HP*, where * is a wildcard for the instrument orientation), and m/s2 for the accelerometers (HN* or EN*).
Conclusion
This article describes the compiled southern EARS ground motion database and its different products. The dataset includes 882 earthquakes between magnitudes 3 and 6.5 with waveform records available within 300 km, of which ∼250 events were relocated successfully using three different velocity models. The ground motion data are available in a flatfile spreadsheet, which contains PGAs and PGVs, as well as the 5% damped PSA for the two horizontal components and their RotD50. A separate FAS flatfile is also included in the dataset. The database is accessible through the ISC repository (https://doi.org/10.31905/4GGVBFBE). There are several applications of this database. The revised earthquake catalog can be used to improve probabilistic hazard models, which are fundamental for the definition of seismic hazard maps for design purposes. Similarly, the relocated events can contribute to more accurate development of earthquake scenarios, which are useful for risk awareness and creation of preparedness plans. The catalog of P- and S-phase arrivals can be used in regional velocity model development or receiver function analysis to better understand the geological features. The provided time-series can be used for record-selection for structural analysis. Finally, the ground motion and FAS database can be used to develop region-specific GMMs, which are key components for accurate PSHAs.
Footnotes
Acknowledgements
We thank Iason Grigoratos and an anonymous reviewer whose comments and suggestions helped improve this database and manuscript. We also thank Luke Wedmore, Juliet Biggs, Hadi Ghofrani, Antonio Sanchez, Jim Gaherty, Anthony Lomax, Sacha Lapins, Åke Fagereng, and German Rodriguez for their valuable discussion and help with the database collection, instrument correction, and relocation.
Funding
The author(s) disclosed receipt of the following financial support for the research, authorship, and/or publication of this article: this work was funded by the EPSRC IAA grant (EP/R511663/1) and EPSRC SAFER PREPARED grant (EP/T015462/1).
Declaration of conflicting interests
The author(s) declared no potential conflicts of interest with respect to the research, authorship, and/or publication of this article.