The southern East African Rift System (EARS) is an early-stage continental rift with a deep seismogenic zone. It is associated with a low-to-moderate seismic hazard, but due to its short and sparse instrumental record, there is a lack of ground-motion studies in the region. Instead, seismic hazard assessments have commonly relied on a combination of active crustal and stable continental ground-motion models (GMMs) from other regions without accounting for the unusual geological setting of this region and evaluating their suitability. Here, we use a newly compiled southern EARS ground-motion database to compare six active crustal GMMs and four stable continental GMMs. We find that the active crustal GMMs tend to underestimate the ground-motion intensities observed, while the stable continental GMMs overestimate them. This is particularly pronounced in the high-frequency intensity measures (>5 Hz). We also use the referenced empirical approach and develop a new region-specific GMM for southern EARS. Both the ranked GMMs and our new GMM result in large residual variabilities, highlighting the need for local geotechnical information to better constrain site conditions.
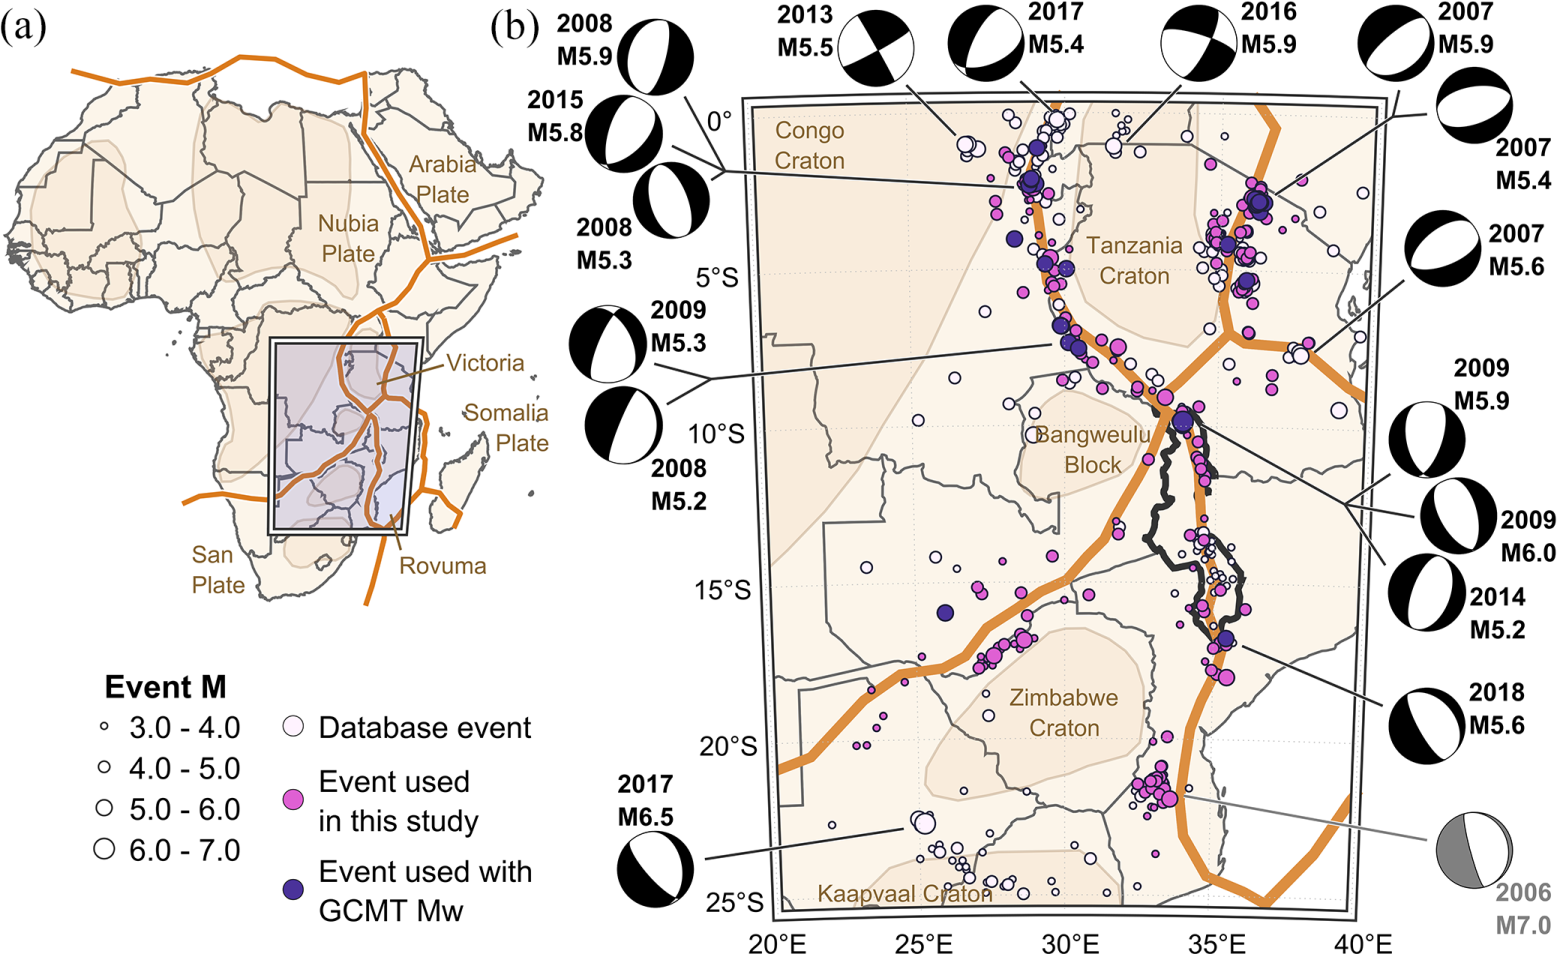
The seismicity in the southern EARS occurs mainly along amagmatic plate boundaries separating thick, cold cratons (Figure 1). Its seismically active branches stretch through several developing countries that are experiencing rapid urbanization and population growth (Paul et al., 2022). Malawi lies along the Western Branch of the EARS (country border highlighted in Figure 1b) and is an example of a low-income country with fast urbanization and population growth combined with high seismic vulnerability (e.g. Giordano et al., 2023; Kloukinas et al., 2020; Novelli et al., 2021). Malawi has experienced several swarms of earthquakes over the last decades, with the largest events reaching M5–6 and causing significant damage and disruptions (e.g. Biggs et al., 2010; Goda et al., 2016). As a result, recent focus has been on increasing the country’s earthquake preparedness through mapping of active faults (Williams et al., 2022), redefining areal and fault sources for probabilistic seismic hazard assessments (PSHAs) (Williams et al., 2023), and classifying the building stock for earthquake risk assessments (Kloukinas et al., 2020). However, for the region’s seismic hazard to be accurately expressed in PSHAs and risk assessments, it is crucial to also understand the regional ground-motion behavior and characteristics.
(a) Overview map of Africa with the southern EARS region highlighted. Orange lines are plate boundaries (adapted from Daly et al., 2020; Saria et al., 2013; Stamps et al., 2021; Wedmore et al., 2021) and shaded sections are Archean and Paleoproterozoic craton boundaries (adapted from Van Hinsbergen et al., 2011). (b) Zoom-in of the southern EARS study area, with the earthquakes in Holmgren et al.’s (2023a) ground-motion database shown as circles. Earthquakes analyzed in this study are highlighted with shaded circles. Malawi is highlighted with a thick black border. For reference, the 2006 M7 Mozambique earthquake is also included (gray focal mechanism) in the map; however, this event is not included in the analysis due to the lack of ground motions available.
When regional GMMs are not available, it is common practice in PSHAs to use global GMMs developed for other regions with similar tectonic settings (e.g. Bommer et al., 2010). For southern EARS, most PSHAs have used a combination of shallow active crustal and stable continental GMMs to capture the expected variations in ground motions due to the rare tectonic setting (e.g. Cheriberi and Yee, 2022; Hodge et al., 2015; Mavonga et al., 2020; Poggi et al., 2017; Williams et al., 2023). However, to date, these GMMs have not been directly compared to regional ground-motion intensity measures (IMs) and assessed in terms of suitability. With regard to existing regional GMMs, there are three in the literature that have been developed for peak ground acceleration (PGA), though, due to the lack of regional strong-motion data at the time, they lack an empirical basis, which is important and desirable for any ground-motion studies. Jonathan (1996) used random vibration theory and recent earthquake recordings to develop a model for eastern and southern Africa; both Midzi et al. (1999) and Cheriberi and Yee (2022) conducted PSHAs using this regional GMM. In their PSHA for Uganda, Twesigomwe (1997) developed a regional model by taking a GMM developed for eastern Canada, which was assumed to have a similar tectonic setting, and updated its anelastic attenuation term using a regional quality factor. Finally, Mavonga (2007) developed a GMM for the Kivu province along the Western branch of the EARS using smaller earthquakes as empirical Green’s functions to simulate large earthquakes.
Here, we use the newly compiled southern EARS ground-motion database by Holmgren et al. (2023a) and first rank common global GMMs for the southern EARS region and assess their suitability for several ground-motion IMs. Despite the large residual variability found in the region for all examined GMMs, we find that active crustal GMMs generally underpredict the ground-motion intensities, whereas the stable continental GMMs overpredict them. Finally, we develop a new GMM for the region using the referenced empirical approach (Atkinson, 2008).
Database
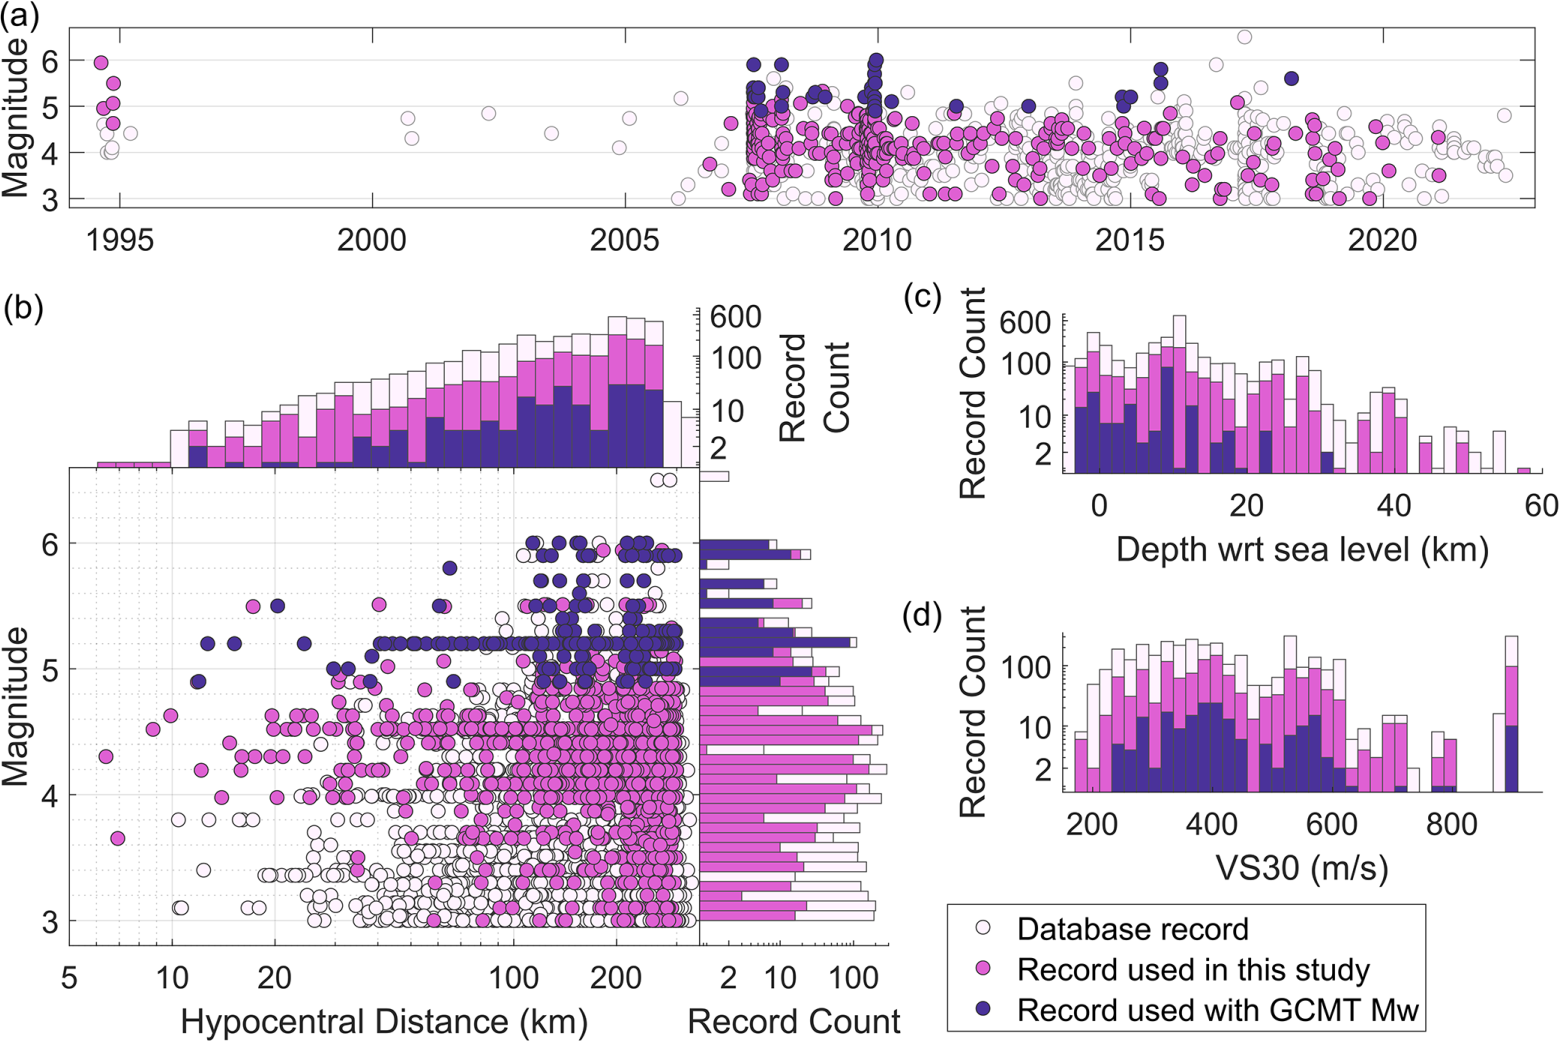
We use a subset of the southern EARS ground-motion database (Holmgren et al., 2023a) to evaluate a set of global GMMs and develop a new regional model. The database is a compiled dataset of 882 earthquakes from the southern EARS with publicly available timeseries records within 300 km epicentral distance (), resulting in 5922 horizontal and 2919 RotD50 (Boore, 2010) measurements. Ground-motion IMs include PGA, peak ground velocity (PGV), and 5% pseudo-spectral acceleration (PSA) for frequencies between 1 and 20 Hz. The events span magnitudes 3.0–6.5, occurring between 1994 and 2022. We note that the largest recorded event, the M7 Mozambique 2006 earthquake (e.g. Fenton and Bommer, 2006), was not included in the database due to unavailability of timeseries within 300 km. Most earthquakes occur after 2007, coinciding with increased seismic instrument coverage in the region (Figure 2a). Holmgren et al. (2023a) initially obtained origin times and hypocenters from earthquake bulletins and many events had been assigned fixed depths, which can introduce a potential bias. To improve the event hypocenters, Holmgren et al. (2023a) relocated earthquakes with more than three records based on three different velocity models which varied in sedimentary layer thickness (Ebinger et al., 2019; Laske et al., 2013; Stevens et al., 2021). While the velocity models produced similar epicenters, depth estimates varied. Here, we use Stevens et al.’s (2021) relocations following the sensitivity analysis by Holmgren et al. (2023a) which evaluated the acceptability of each velocity model’s relocations by inspecting the records’ hypocentral distance () plotted against the time difference between the P- and S-wave phase arrivals (S-P time). They found that Stevens et al.’s (2021) model produced the trend with the smallest scatter between the two parameters, particularly at close distances where it is crucial to have accurate distance metrics for ground-motion intensities (see Holmgren et al. (2023a) for more details). Furthermore, for the events which were not relocated and kept the fixed depths assigned by the original bulletins, relying only on records with reasonable S-P times relative to hypocentral distance helps discard any events with unrealistic depths.
Event and record distribution: (a) event magnitude plotted against date; (b) record magnitude plotted against hypocentral distance; (c) record depth; and (d) distribution. Note that the histograms’ record counts are in logarithmic scale. Magnitudes are if available (all records used have ), otherwise the reported database magnitude.
To obtain a consistent ground-motion dataset on which we could rank GMMs and develop our own model, we apply the following filters to the database:
Only use records with computed RotD50 measurements;
Remove records without an original or converted moment magnitude ();
Remove records with locations not deemed acceptable by Holmgren et al. (2023a) through their inspection of the S-P time in comparison with ;
Remove stations from the “SM” network in southern Malawi—these were geophone recordings which were deemed outliers after initial inspection of ground-motion residuals and only corresponded to 23 events with local magnitudes less than 4.0;
Remove events located further than 200 km epicentral distance away from plate boundaries.
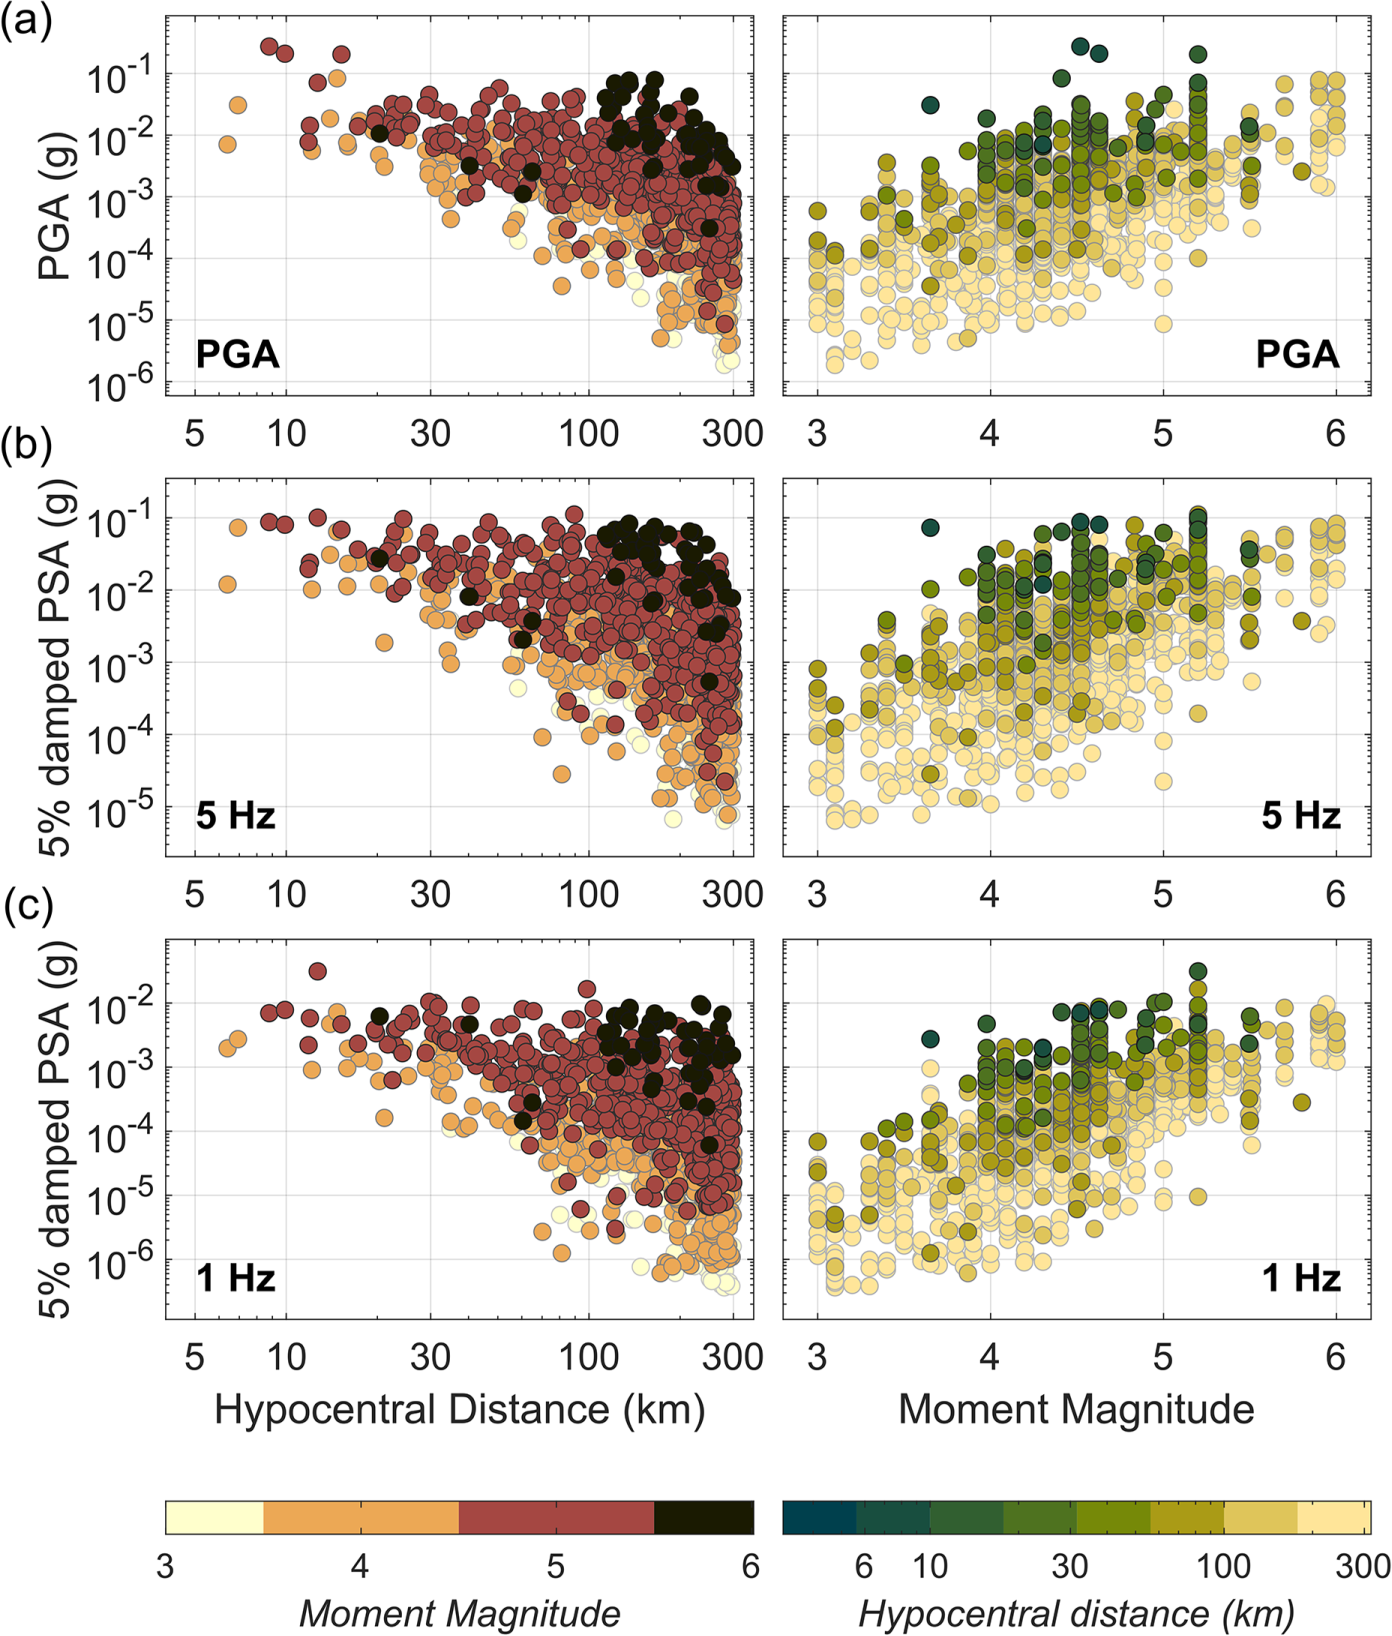
We apply the fifth criterion as an effort to homogenize the database, which covers a wide region and includes earthquakes from both active plate boundaries and stable craton settings. It removes 77 “stable” events and 301 records, mostly with magnitudes less than 5 and distances greater than 80 km. In the end, we are left with 365 “active” earthquakes, of which 36 events have directly obtained from the Global Centroid Moment Tensor catalog (GCMT; Dziewonski et al., 1981; Ekström et al., 2012; see Figure 1). Three of the discarded “stable” events have a GCMT ; however, none of their records are within 200 km. The remaining “active” earthquakes are reported in other magnitude scales and Holmgren et al. (2023a) converted them to either using Weatherill et al. (2016) relations for surface- and body-wave magnitudes, or assuming a 1:1 relation for local magnitudes. This results in 1328 records to be analyzed (Figure 2), where the available record parameters include , , , depth, and the time-averaged shear-wave velocity in the upper 30 m (). Because there are no direct measurements available for the region, Holmgren et al. (2023a) provided the US Geological Survey (USGS) first-order approximation which is based on topographic slope (Heath et al., 2020). Focal mechanisms are also available for a few of the larger earthquakes. Figure 3 shows the ground-motion intensity distributions for three IMs: PGA, PSA at 5 Hz, and PSA at 1 Hz.
Ground-motion intensity distribution plotted against hypocentral distance (left) and moment magnitude (right) for three IMs: (a) PGA, (b) PSA at 5 Hz, and (c) PSA at 1 Hz.
GMM comparison
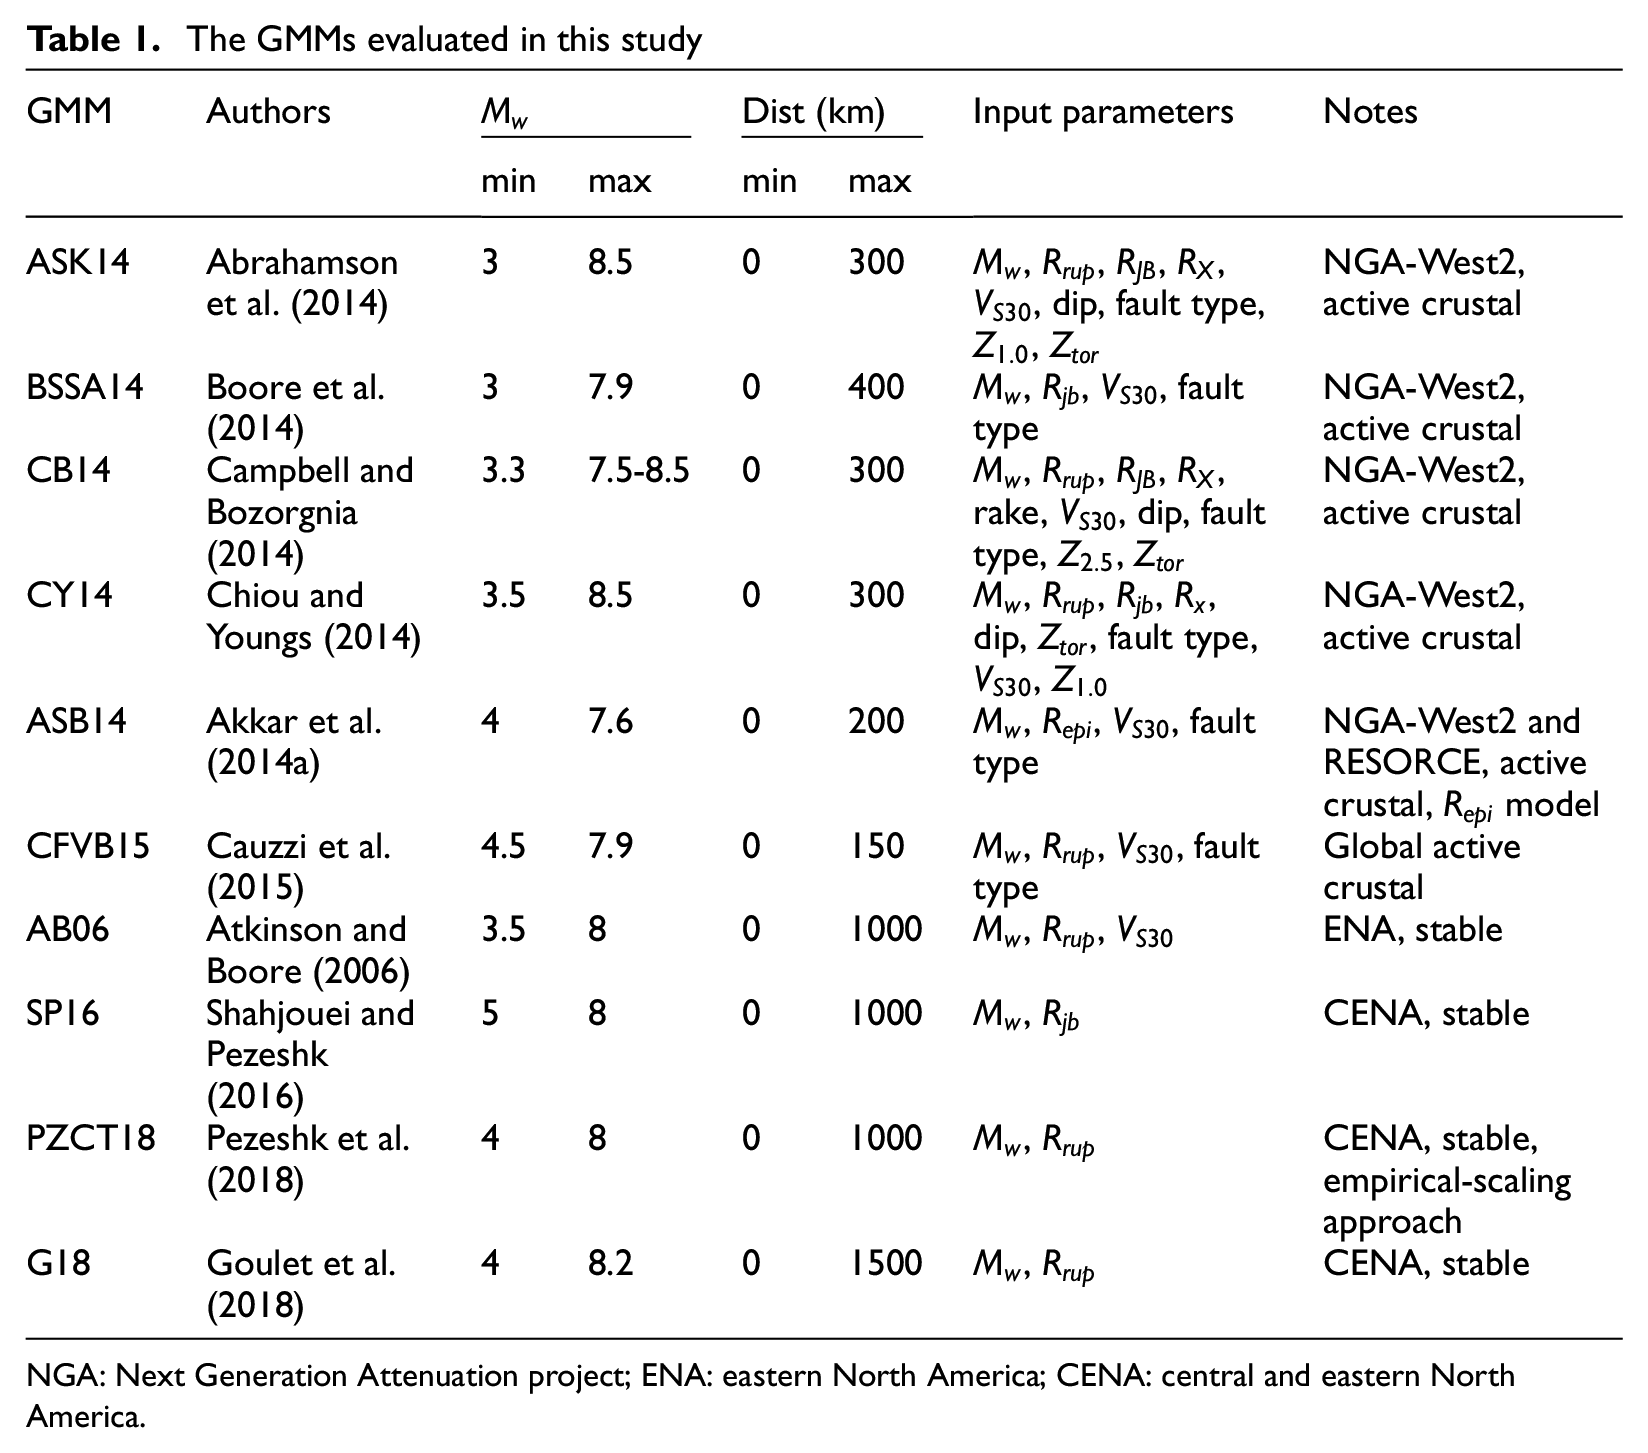
In this study, we evaluate the suitability of 10 global GMMs using the southern EARS database, see Table 1. Four of these models were developed as part of the Pacific Earthquake Engineering Research Center (PEER) Next-Generation Attenuation Relationships for Western US (NGA-West2) project (Ancheta et al., 2014; Bozorgnia et al., 2014), which is a database containing earthquake ground motions from worldwide shallow, crustal events in active tectonic regimes: Abrahamson et al. (2014; ASK14), Boore et al. (2014; BSSA14), Campbell and Bozorgnia (2014; CB14), and Chiou and Youngs (2014; CY14). We also include two additional active crustal GMMs: the Akkar et al.’s (2014a; ASB14) model which was developed using both the NGA-West2 database and the Pan-European equivalent Reference Database for Seismic Ground-Motion in Europe (RESORCE, Akkar et al., 2014b) database, and the Cauzzi et al.’s (2015; CFVB15) model which was developed using 98 global active crustal earthquakes processed independently of the NGA-West2 and RESORCE datasets. Finally, we include four stable continental GMMs: Atkinson and Boore (2006; AB06) developed a GMM for eastern North America (ENA) using stochastic finite-fault modeling, Shahjouei and Pezeshk (2016; SP16) developed a GMM for central and eastern North America (CENA) using the hybrid empirical method (HEM) and NGA-West2 GMMs, Pezeshk et al. (2018; PZCT18) also applied the HEM to develop a CENA GMM using an empirical-scaling approach, and finally, the weighted mean of the PEER Next Generation Attenuation for CENA (NGA-East) project ground-motion characterization (GMC) model (Goulet et al., 2018; G18). The applicability details of each model are listed in Table 1.
NGA: Next Generation Attenuation project; ENA: eastern North America; CENA: central and eastern North America.
For each GMM, we analyze six ground-motion IMs: PGA, PGV, and PSA at 1, 2, 5, and 10 Hz. Not all the input parameters used in the GMMs are available in the southern EARS database, and for these, we make a few assumptions. Commonly, in PSHA, the preferred distance metrics are the rupture distance () and the Joyner–Boore distance (), which reflect the closest distance to the ruptured fault and the fault’s surface projection, respectively (e.g. Scherbaum et al., 2004; Thompson and Worden, 2018). CFVB15 investigated the relationship between and in their dataset for distances km and found that the difference between the two metrics was statistically insignificant for less than 5.7. Thus, because the southern EARS database consists of 6.0 earthquakes and very few records with at close distances (< 50 km) (Figure 2b), we assume that and can be approximated by their point-source equivalents and , respectively (e.g. Hassani and Atkinson, 2015). Likewise, for the depth-to-top of the rupture (), we assume the hypocentral depth. The site parameters are more difficult; for example, depth to 1 () and 2.5 km/s () S-wave boundaries which are used to reflect the depth to bedrock, as there is limited geotechnical information available from the region. Instead, we use the empirical approximations provided within the GMMs. ASK14, CB14, and CY14 also have as an input parameter, which is a hanging-wall parameter reflecting the horizontal distance perpendicular to the fault strike. This parameter is important at close distances and large magnitudes (e.g. Chiou and Youngs, 2008). Because it also requires knowledge of the hanging wall and the strike orientation, which are unknown for the majority of the southern EARS earthquakes, we test the residual sensitivity to different values of (e.g. 5 and 20 km, and setting ) and find that the change in the median GMM level is minimal for our record distribution; thus, in the end, we assume for simplicity. Another common input parameter is the fault type and the fault dip. Because we focus on the “active” subset of the database which consists of normal faulting events with sometimes small strike-slip components (see Figure 1b), we assume that any events without available focal mechanisms are normal faults and set their fault dip to the average dip of the available events (dip °).
We perform four different analyses to examine each GMMs’ suitability in the southern EARS region. The first is a classical residual analysis, where the difference in the observed and predicted ground-motion intensities is computed:
where is the residual for event and site , is the observed intensity, and is the median value of the GMM being examined. Two of the stable continental GMMs, SP16 and PZCT18, provide their models at the CENA reference site condition ( = 3000 m/s and kappa = 0.006 s) and leave it up to the user to choose an appropriate site correction. To obtain site terms for these GMMs, we follow a similar approach to the one SP16 and PZCT18 use to validate their GMMs to CENA observations. First, we adjust the SP16 and PZCT18 models from = 3000 m/s to = 760 m/s using the Boore and Campbell (2017) CENA site amplification factors (assuming kappa = 0.03 s at = 760 m/s). Then, we adjust to each recorded observation’s using the BSSA14 site term. For the reference PGA () used in BSSA14, we retrieve PGA at = 3000 m/s using the SP16 or PZCT18 GMM and adjust it to = 760 m/s using the Boore and Campbell (2017) factors again.
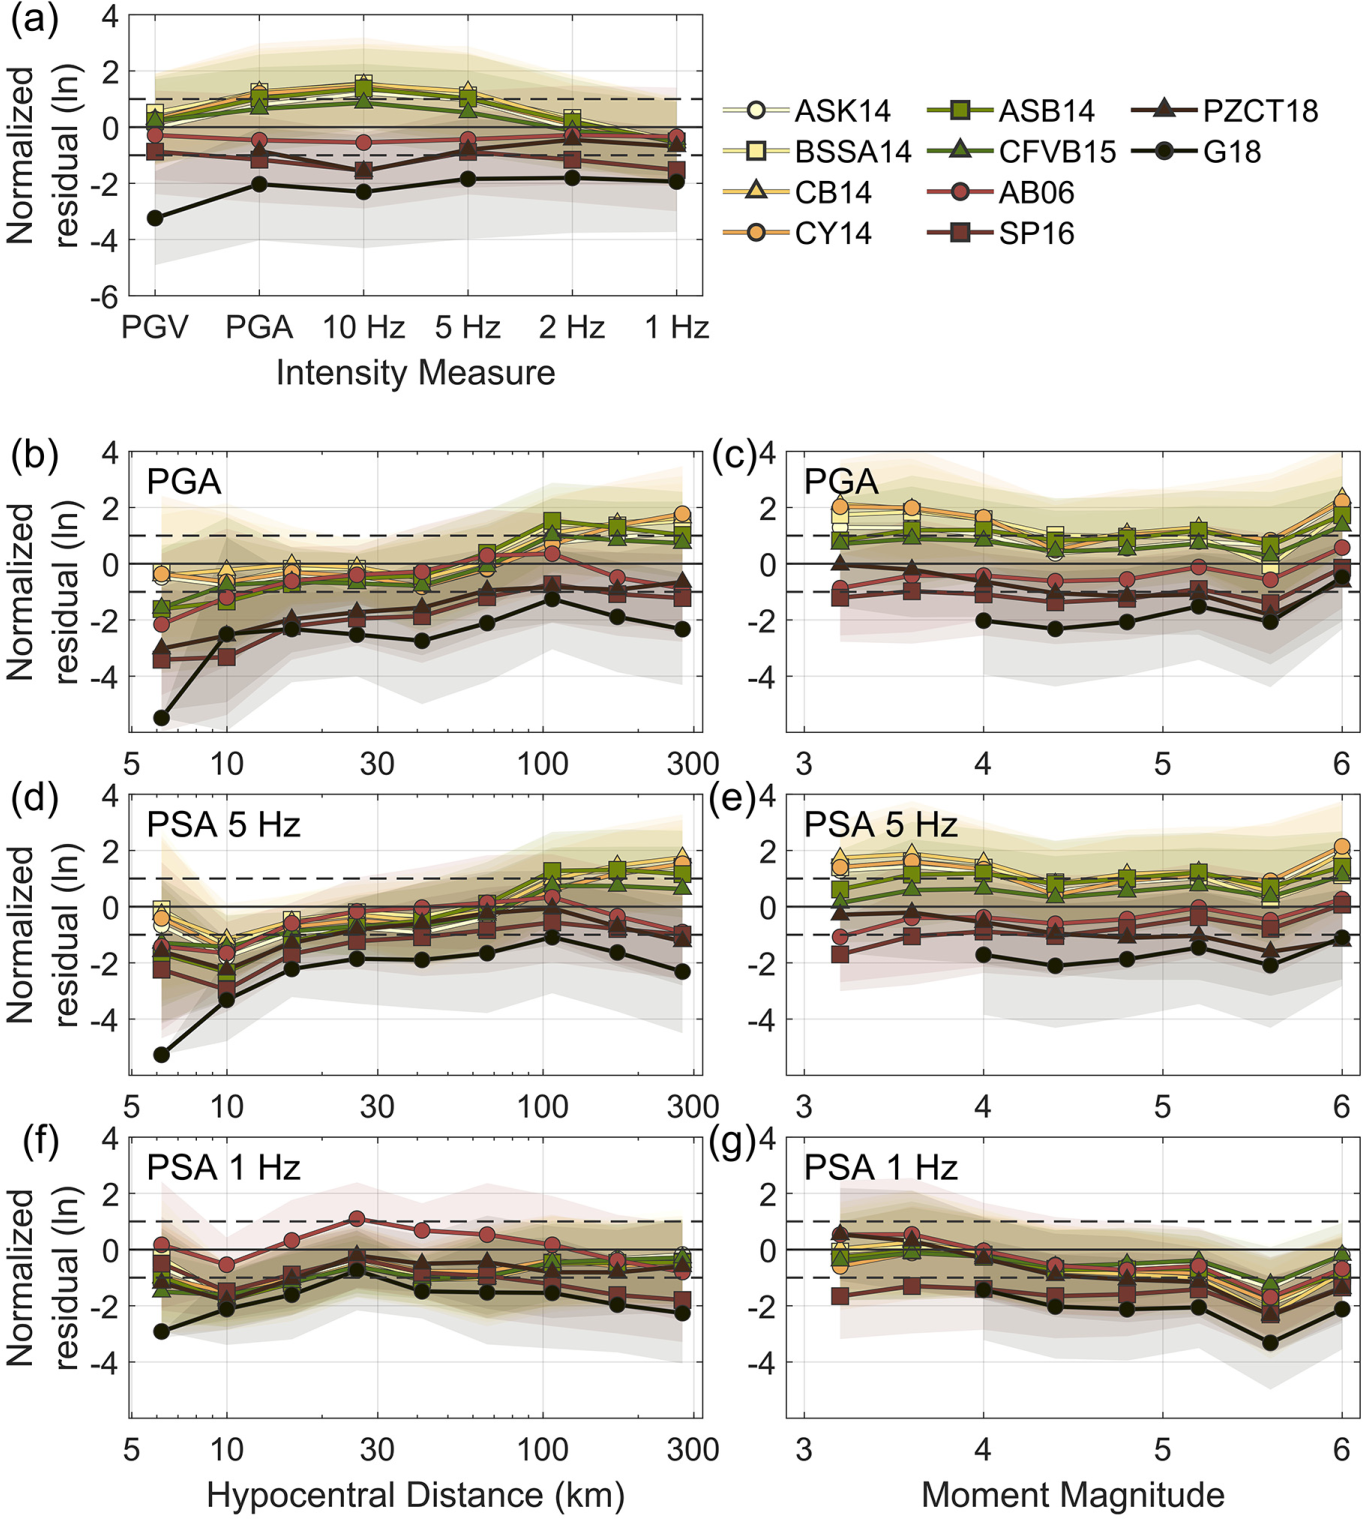
Figure 4 shows the overall residual trends observed for each GMM for the different IMs (Figure 4a), and for PGA and PSA at 1 and 5 Hz plotted against distance (Figure 4b, d, and f) and magnitude (Figure 4c, e, and g). For the comparison, the residuals are normalized by the GMMs’ total sigma (). Individual GMM residuals can be found in Online Supplemental Figures S1–S4. We find that the active crustal GMMs underestimate the higher frequencies, especially at larger distances. However, the stable continental GMMs tend to overpredict all IMs, particularly at very close distances (< 20 km). Because it has been shown that the USGS topographic proxy does not always work well in stable continental regions (e.g. Lemoine et al., 2012), we also perform the same residual analysis using a constant = 760 m/s and a constant = 450 m/s for softer rock (see Online Supplemental Figures S5 and S6). For both cases, this results in an increase in average residual for all GMMs due to the low USGS values in the database (see Figure 2d), although minorly so for AB06. For the active crustal GMMs, using = 760 m/s leads to larger underpredictions than when using = 450 m/s, which results in only slightly larger residuals compared to the USGS proxies. On the other hand, the stable continental GMMs perform better with a constant = 760 m/s and overpredict less.
(a) Average normalized residual for selected ground-motion IMs using the USGS proxy. The shaded region shows the ± 1 standard deviation of the residuals. Residuals have been normalized by each GMM’s total sigma (). Solid and dashed straight black lines show a mean residual of 0 and ± 1 standard deviation, respectively (i.e. if the model and data match perfectly). Normalized residual trends with hypocentral distance (b, d, and f) and moment magnitude (c, e, and g) for PGA, PSA at 5 Hz, and PSA at 1 Hz, respectively.
In addition to the residual analysis, we examine the GMMs using three ranking techniques to evaluate their relative performances. First, we use the log-likelihood score (LLH) proposed by Scherbaum et al. (2009). The LLH test relies on information theory and measures the Kullback–Leibler distance between the observed data and the predicted data given a GMM (e.g. McNamara et al., 2020; Mak et al., 2017). In practice, it produces a single value that reflects the probability of the observed data under a model. The better the GMM describes the observations, the lower the value. The second ranking method used is the Euclidean distance ranking metric (EDR), proposed by Kale and Akkar (2013). In contrast to LLH, which may favor GMMs with large , the EDR method separately considers the difference between the observed and predicted data and the of the GMMs (e.g. Farajpour et al., 2021). The third ranking method used is the stochastic area metric (AM) proposed by Sunny et al. (2021). It first assumes that the marginal distribution of the observations can be considered as an empirical cumulative distribution function (ECDF) and the marginal distribution of the GMM is a theoretical cumulative distribution function (CDF) and then finds the mismatch between the two. This produces a value which is the area between the two curves. In contrast to the LLH and EDR approaches, which both assume normal distributions, the AM method does not assume any underlying distributions. The AM method can also be computed with sparse datasets.
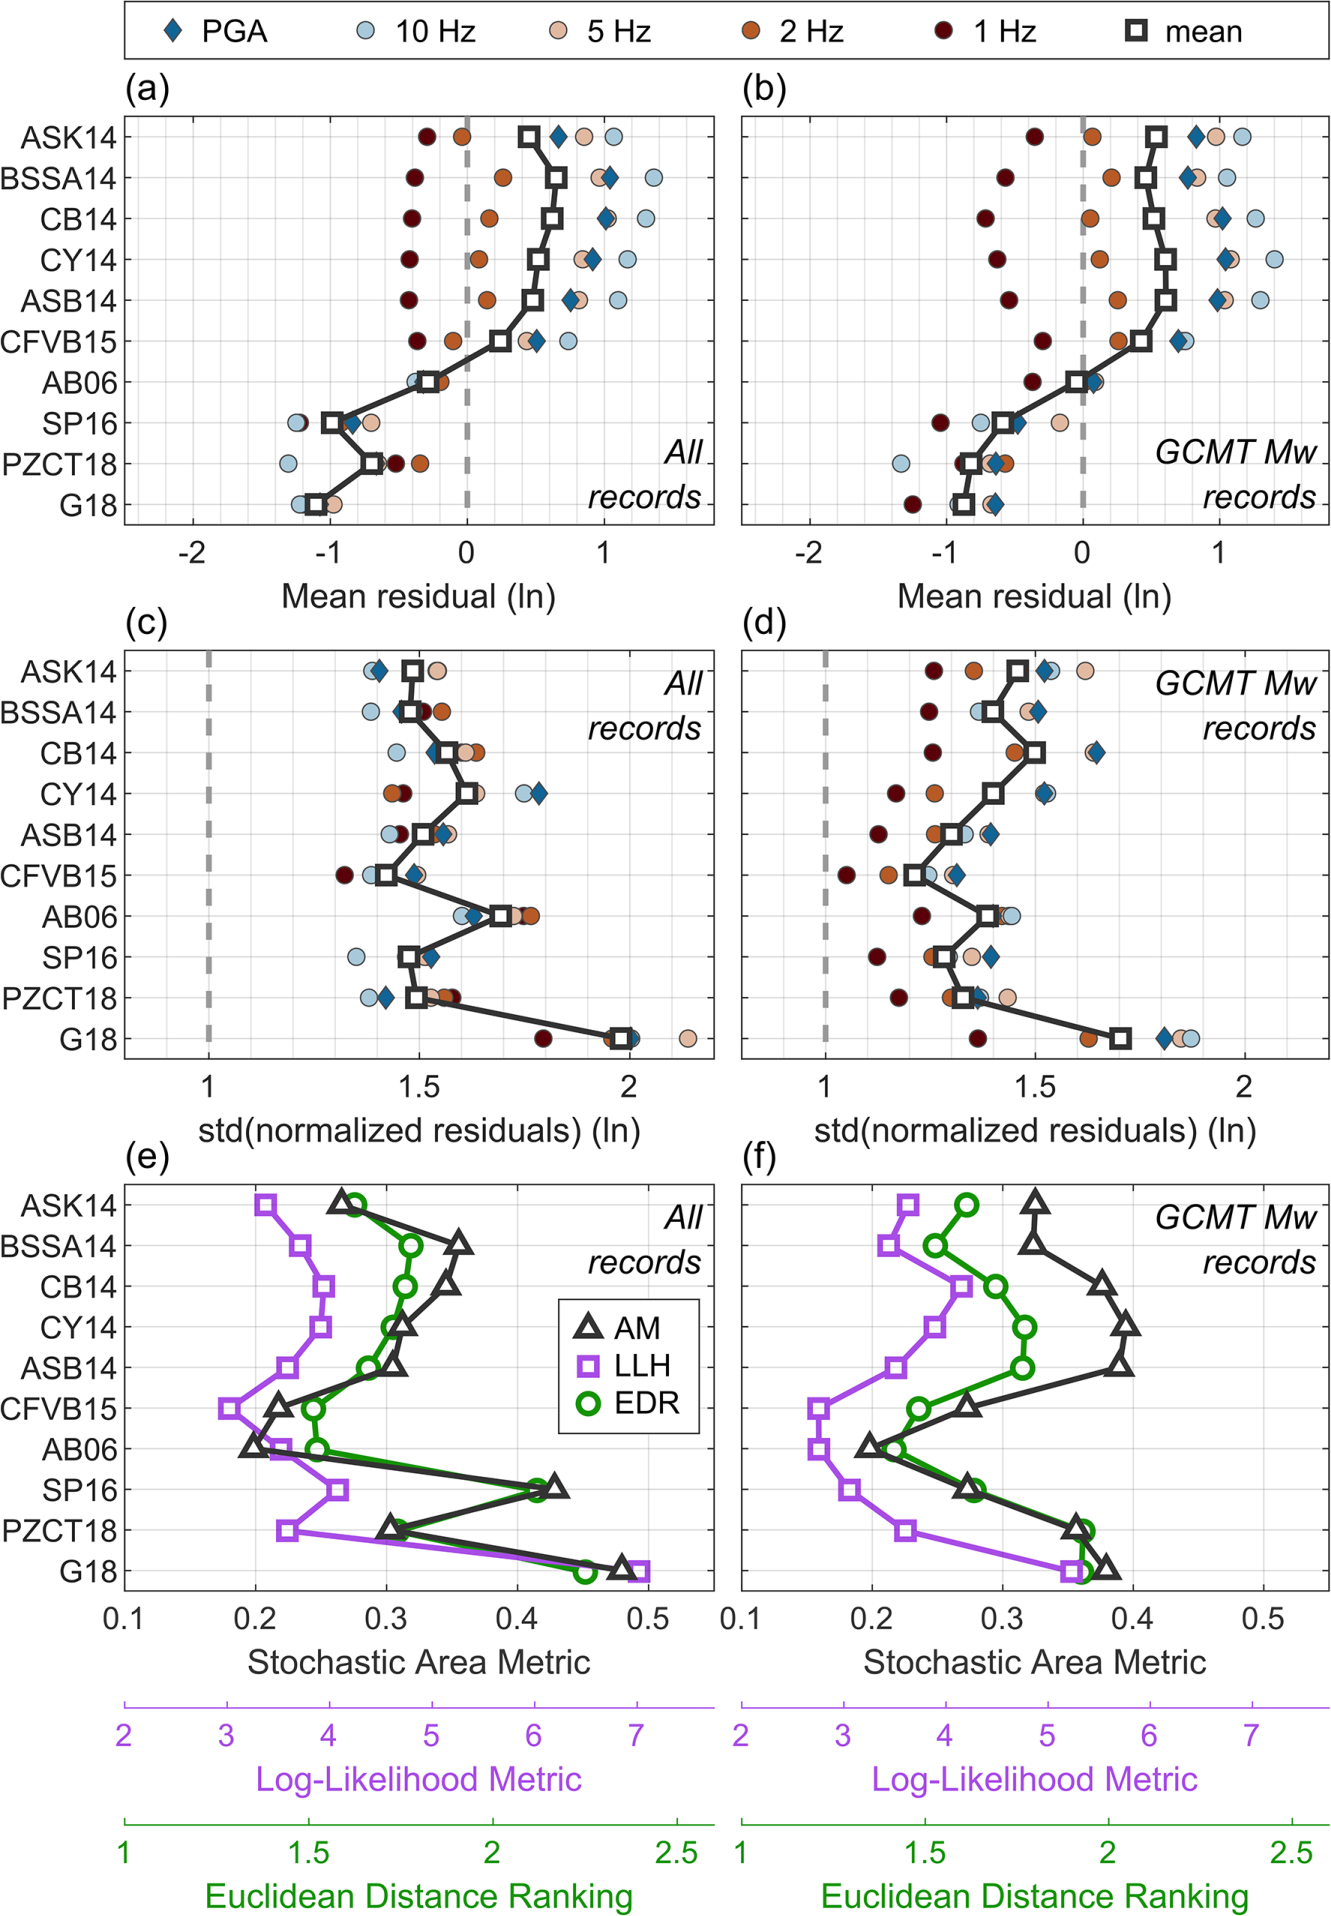
The residual and ranking results are shown in Figure 5 for the whole active dataset and the subset of its records with GCMT (highlighted in Figure 2) for the five acceleration IMs examined. The results for PGV and when using a constant = 760 and 450 m/s can be found in Online Supplemental Figures S7–S9. Figure 5a shows each IM’s mean residual and their average for the full active dataset. The two GMMs that have mean residuals closest to zero and thus perform the best are CFVB15 and AB06 with average residuals of 0.24 and −0.29 (natural logarithm), respectively. The remaining active crustal GMMs tend to underpredict with average residuals > 0.45 and the remaining stable continental GMMs overpredict with average residuals < −0.70, driven mainly by the higher frequencies for both groups. For all GMMs, the lower frequencies (PSA at ≤ 2 Hz) tend to result in mean residuals closer to zero. Figure 5c shows the standard deviation of the residuals after normalizing them by the GMMs’, indicating how well the GMMs’ reflect the observed variability. We find that the variability of the southern EARS database is larger than predicted by all the GMMs. CFVB15 has the lowest residual standard deviations at 1.4 . AB06 and G18 find the highest residual standard deviations at 1.7 and 2.0 , respectively. The large variability obtained is perhaps not surprising considering the lack of local geotechnical information available and the database’s large number of small-magnitude records at greater distances.
GMM ranking results for the southern EARS dataset. (a) Mean residual found for each GMM and the five spectral acceleration ground-motion IMs examined. A vertical line at 0 indicates the median GMM matches the observations. (c) Standard deviation of the residuals normalized by the GMM for each IM. A vertical line at 1.0 indicates the residual standard deviation matches the GMM’s . (e) The AM, LLH, and EDR results for each GMM. The lower the value the better. (b, d, and f) show the same as (a, c, and e) but using only records with GCMT (see Figure 2). Online Supplemental Figure S7 shows the same figure but for PGV.
For the smaller subset of GCMT events (see Figure 5b and d), the average and standard deviation of the residuals show a similar trend. The residuals’ standard deviations are slightly lower (1.2–1.7 ), but this is expected considering the uncertainty in magnitude for non-GCMT events and the significantly smaller sample size (301 records with GCMT compared to 1328 records in the active dataset).
Figure 5e and f show the average LLH, EDR, and AM scores of the five IMs for each GMM. For both subsets of data, AB06 and CFVB15 perform the best on average again (i.e. lower score values). For PGV (Figure S7), results similar to PSA at 2 Hz are obtained, with the active crustal GMMs and AB06 performing better, on average. To investigate if the geological setting affects the GMM ranking results, we also perform the same analysis on the Malawi events within the “active” subset (see Figure 1 for the outline of Malawi) and the “stable” event subset that was removed during filtering (see “Database” section). Online Supplemental Figures S10–S12 show the mean residual and standard deviation ranking (similar to Figure 5) for different magnitude and distance bins for the “active” event subset, the Malawi events, and the “stable” event subset. In general, the trends are similar for all subsets, showing the same results as Figure 5 when using records out to 300 km. For the closer distance bins ( 100 km), both the active crustal and stable continental GMMs tend to overpredict the ground-motion intensities, though slightly less for the active crustal GMMs. AB06 still performs the best in terms of the average residual, while its standard deviation of the residuals tends to be larger than the others (except for G18).
Overall, AB06 and CFVB16 perform better for the active subset of the southern EARS database, particularly at larger distances for the high-frequency IMs, though we also note that AB06 has the second-largest residual standard deviation. Because of the uneven record distribution with distance with most record 100 km (see Figure 2b), the averaged ranking results will be biased toward larger distance trends. For risk and engineering purposes in the southern EARS, the high-frequency ground motions (> 4 Hz) tend to be of greater interest, partly due to the region’s abundance of low-rise buildings (e.g. Paul et al., 2022). For the remaining GMMs, the high frequencies were either considerably overpredicted (stable continental GMMs) or underpredicted (active crustal GMMs). This likely reflects the lack of information about the local site conditions but also the differences in regional characteristics, such as geometrical spreading and anelastic attenuation caused by the uniqueness in southern EARS’s early-stage rift zone with its surrounding thick, cold Archean and Paleoproterozoic cratons (e.g. Wedmore et al., 2021).
A new regional GMM
To date, there have been a lack of empirical GMMs developed for southern EARS due to the limited availability of strong-motion data. Instead, previous regional GMMs have relied on random vibration theory combined with some earthquake recordings (Jonathan, 1996), adapting GMMs from similar tectonic regions (Twesigomwe, 1997) and simulating larger events using smaller regional earthquakes (Mavonga, 2007). A common approach when developing GMMs for regions with scarce ground-motion data is to rely on a host GMM developed in a data-rich region, such as the referenced empirical approach (Atkinson, 2008), equivalent point-source modeling (Yenier and Atkinson, 2015), or HEM (e.g. SP16; PZCT18). Here, we use the referenced empirical approach and adapt the BSSA14 GMM to develop a model for the active dataset of the southern EARS. We choose the BSSA14 model over the other GMMs because it has a relatively simple functional form requiring minimal input parameters. Moreover, while AB06 and CFVB16 perform better in terms of ranking, our initial checks showed that adapting BSSA14 allowed for better fit with distance than the other GMM functional forms.
The BSSA14 GMM has the following functional form:
where is the natural logarithm of a ground-motion IM for event and site . is the event term, is the path term, is the site term, is the number of standard deviations away from the mean, and is the total standard deviation describing the aleatory variability of the model. The units of PGA and PSA are in g, and the unit of PGV is in cm/s. We assume the earthquake source behavior is independent of region and keep the BSSA14 as is, which was derived using 3.0–7.9 earthquakes from the NGA-West2 database. While this may introduce trade-offs during the regression, relying on the narrow magnitude range of the southern EARS database ( 3.0–6.0) would limit the magnitude applicability. In addition, we avoid any potential bias introduced through the uncalibrated magnitude conversion equations used by Holmgren et al. (2023a) to obtain most of the estimates (see “Database” section). Instead, using the BSSA14 allows extrapolation of our GMM to encompass the infrequent but large 7–8 earthquakes observed (e.g. the 2006 M7 Mozambique event, Fenton and Bommer (2006)) or assumed possible in the region (e.g. Ebinger et al., 2019; Jackson and Blenkinsop, 1997; Wedmore et al., 2020; Williams et al., 2021). Furthermore, due to the lack of information available about local site conditions, we also keep the BSSA14 term as is and only regress for a southern EARS term to adjust to a regional geometrical spreading and anelastic attenuation.
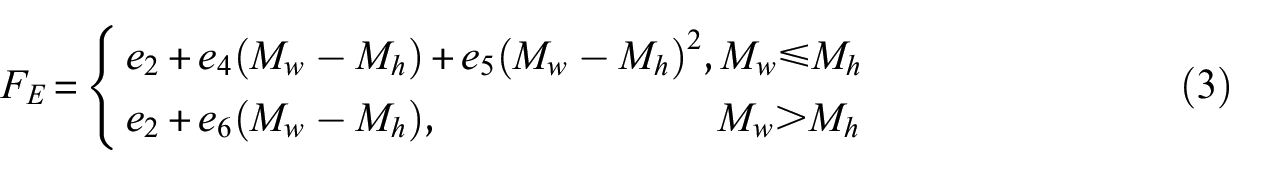
The event term, assuming a normal-slip fault type, is given by:
where is the period-dependent hinge magnitude and and – are period-dependent coefficients taken directly from BSSA14. The site term used by BSSA14 was developed by Seyhan and Stewart (2014), and has the following form:
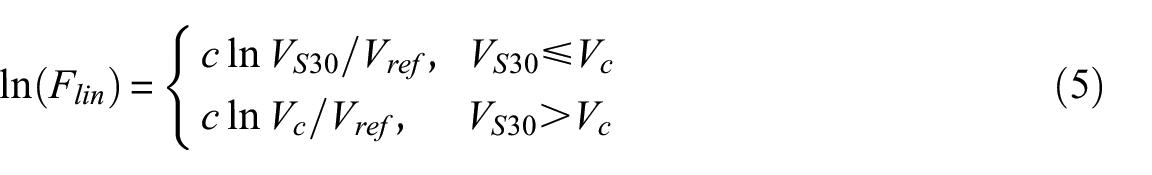
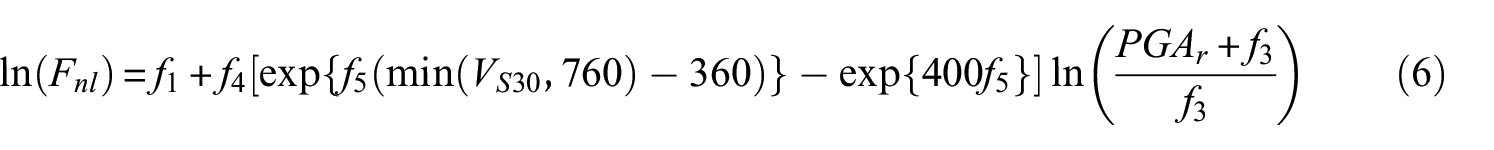
describes the linear component of site amplification and is given by:
where is the reference site condition ( m/s), and and are period-dependent and region-independent coefficients from the work by Seyhan and Stewart (2014). represents the nonlinear site amplification and is given by:
where and are period-independent and – are period-dependent coefficients, also taken directly from Seyhan and Stewart (2014). is the reference PGA and initially obtained through evaluating the BSSA14 GMM at = 760 m/s, but later on obtained using our adapted southern EARS GMM. BSSA14 includes a third site component which adjusts the median model to account for basin depth effects. Because the basin depth is (largely) unknown for the southern EARS, we set this component to zero.
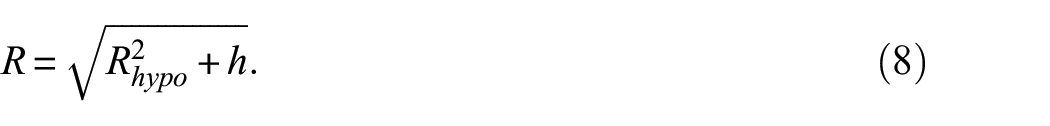
In our regression, we use the same functional form for the path term as BSSA14, given by:
where,
and are period-dependent coefficients describing the regional geometric spreading, while is a period-dependent coefficient describing the apparent anelastic attenuation. We initially include , the magnitude-dependent geometrical spreading coefficient, in the regression. However, due to the limited number of records at magnitudes greater than the BSSA14 hinge magnitude ( > 5.5-6.2), we find that the GMM magnitude shape becomes biased toward the vast number of smaller magnitude records at large distances, resulting in unrealistic amplitudes for the larger magnitudes. Instead, we use the from BSSA14 directly. We find that this has minimal effect on the resultant and estimates. Moreover, BSSA14 originally uses as the distance metric, but we find that works better for the southern EARS, likely because of the deeper earthquakes present in the database (< 50 km depth compared to < 20 km depth in BSSA14). Finally, is the period-dependent pseudo-depth coefficient accounting for saturation effects at close distances. Due to the limited number of records at very close distances in the database, we are not able to determine a southern EARS ourselves. Instead, we use the alternative model derived by Yenier and Atkinson (2015, see their Equation 13) using global earthquakes (including those used in BSSA14).
Thus, to find a GMM for the southern EARS, we solve the following equation using random-effects regression (Abrahamson and Youngs, 1992), determining and for each period independently:
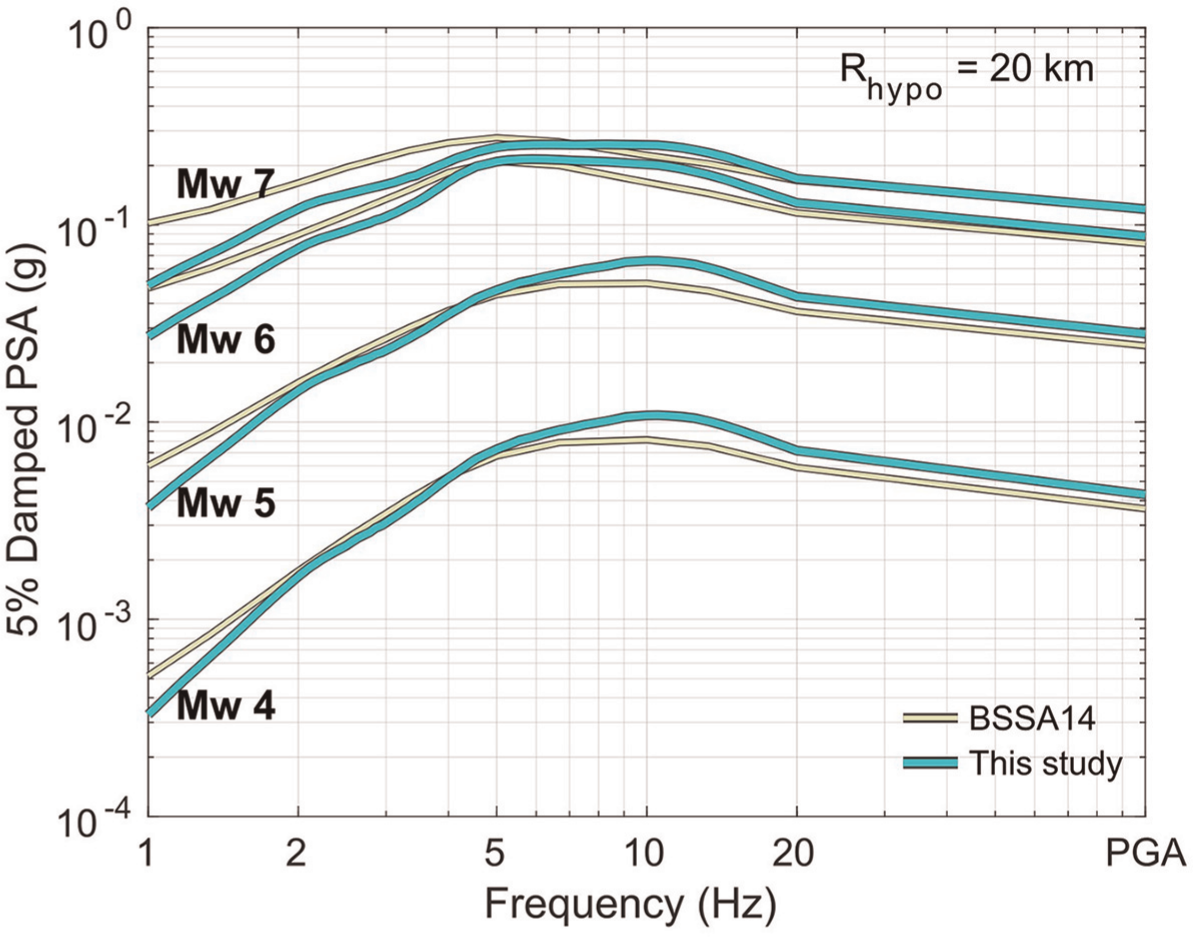
We constrain to be negative, setting it to zero if positive. A minimum of three records is required per event for each ground-motion IM analyzed. After the initial regression, the coefficients are smoothed over the selected periods to remove any jaggedness due to record availability. Online Supplemental Figure S13 shows smoothing of the coefficients and their standard error. Figure 6 shows the resultant response spectra of our southern EARS GMM at = 20 km for four different magnitudes, along with the BSSA14 GMM. As can be seen, IMs above 5 Hz have increased amplitudes reflecting the greater high-frequency content observed in southern EARS compared to BSSA14 and the other active crustal GMMs. We obtain similar median intensity levels for frequencies between 2 and 5 Hz for Mw < 6 and slightly lower amplitudes at frequencies below 2 Hz. The southern EARS GMM coefficient table can be found in the Online Supplemental Material.
Response spectra shown for four different magnitudes and = 20 km (setting depth = 5 km) for our southern EARS GMM and the BSSA14 GMM.
Finally, we perform random-effects regression with the fixed coefficients obtained to examine the aleatory variability of the southern EARS GMM, which can be expanded as (e.g. Al Atik et al., 2010):
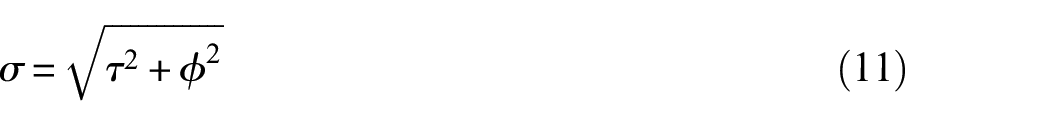
where is the natural logarithm of the GMM, is the between-event residual with standard deviation , and is the within-event residual with standard deviation . The GMM’s total sigma is given by:
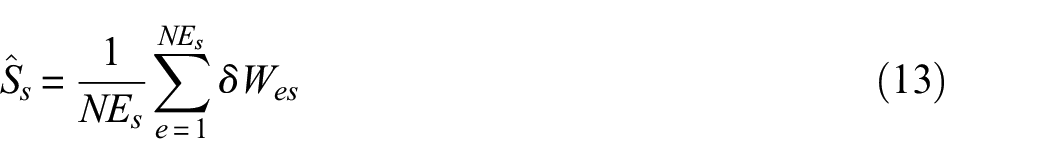
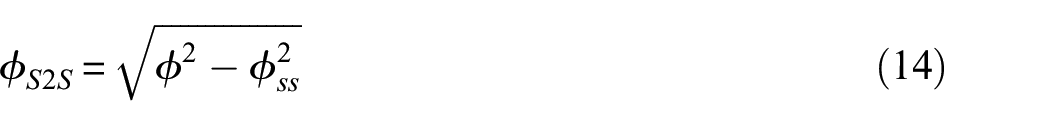
where is the number of records at site . is the single-station within-event residual, with standard deviation , which is left after is removed from . The variability of is given by:
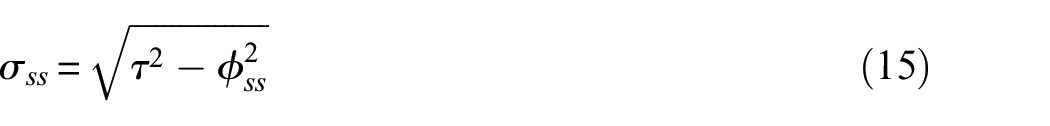
and, finally, the single-station sigma is given by:
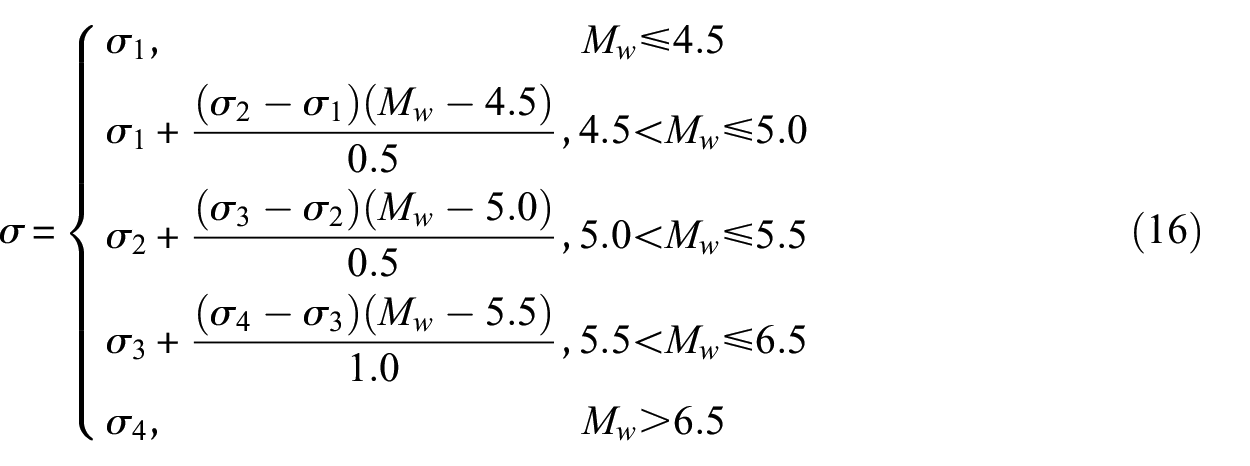
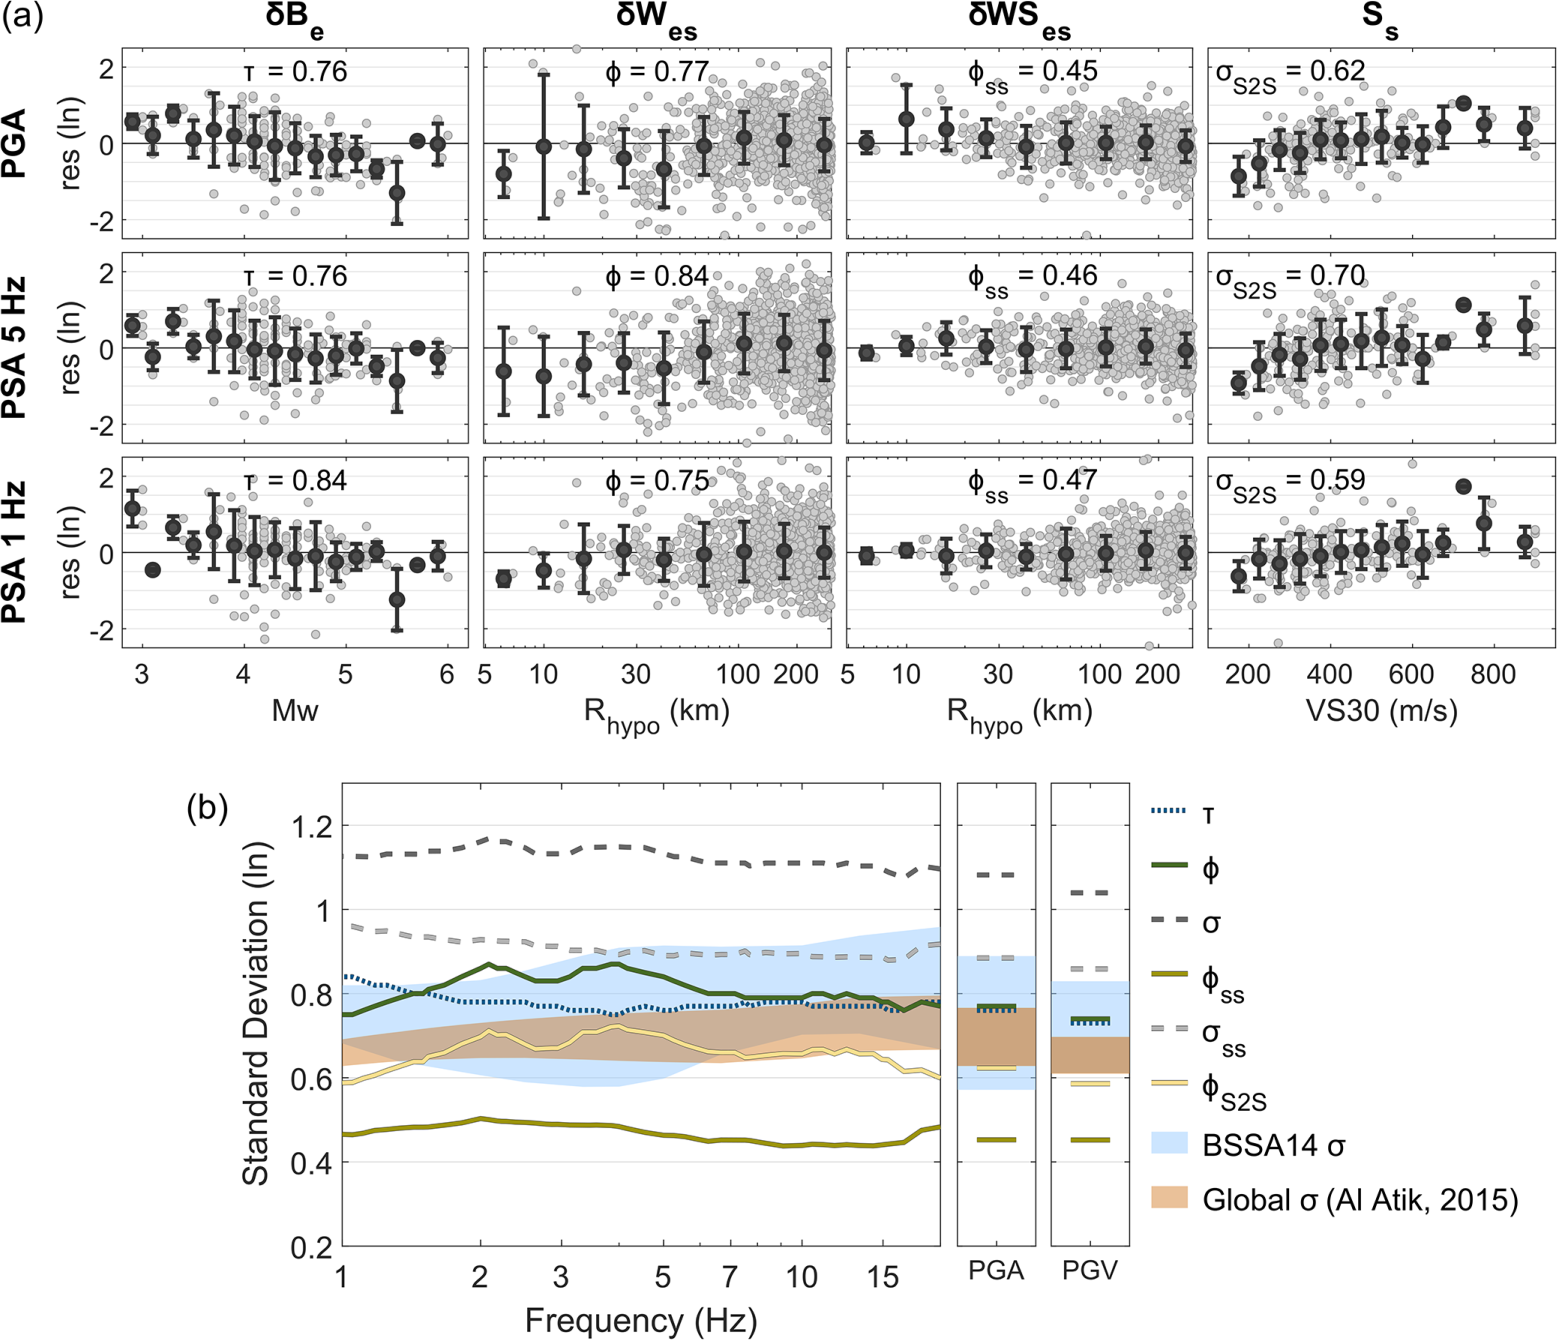
Figure 7 shows the final residuals for three IMs: PGA, PSA at 5 Hz, and PSA at 1 Hz. As can be seen, the and variability terms are large for all IMs, both ranging between 0.70 and 0.90 (natural logarithm) and resulting in a range between 1.00 and 1.17 for . Removing the repeatable site response reveals a -trend and a decreased ranging between 0.44 and 0.50. However, while is reduced compared to , the values are still large and range between 0.86 and 0.96. These large ranges are partly due to the vast number of small-magnitude records at large distances which are associated with greater uncertainties caused by lower signal-to-noise levels, but also highlights the lack of information on local site conditions available. Furthermore, the uncertainty in record magnitudes and unaccounted earthquake source properties, such as regional stress drop differences, are likely large contributors to the large values obtained. As a comparison, we include the BSSA14 obtained given the database’s range in records in Figure 7b. The BSSA14 is , , and dependent, with the lowest sigma obtained from large-magnitude, low- records at close distance. Because the large aleatory variability values obtained for our southern EARS GMM are likely unrealistic due to the large magnitude and site uncertainties in the database, we borrow a -model from another region instead. This follows the G18 procedure in the PEER NGA-East project, in which they decoupled the median GMMs from the -models and assumed that the -models were applicable to the full range of median GMMs. Thus, as part of the NGA-East project, Al Atik (2015) developed several -models, including a global -model which is based on the average of four NGA-West2 -models (ASK14, BSSA14, CB14, and CY14). It is magnitude-dependent and ranges between 0.61 and 0.80 for the southern EARS record range (see Figure 7b). The global ergodic -model is given by:
where – are the central model coefficients given in G18 (see their Tables 11–19). We also include them in the southern EARS GMM coefficient table in Online Supplemental Material.
(a) Residuals in natural logarithm from the newly developed southern EARS GMM for three ground-motion IMs: PGA (top row), PSA at 5 Hz (middle row), and PSA at 1 Hz (bottom row). Between-event residuals () plotted against are in the first column (from the left), within-event residuals () plotted against distance are in the second column, single-station within-event residuals () plotted against distance are in the third column, and site-specific site terms () plotted against the USGS proxy are in the last column. (b) Standard deviations plotted against IMs for between-event (), within-event (), total sigma (), single-station within-event (), single-station sigma (), and the site-to-site variability (). The BSSA14 range given the record , , and distributions is shown as a blue patch. The global -model range (Al Atik, 2015) given the record range is shown as an orange patch.
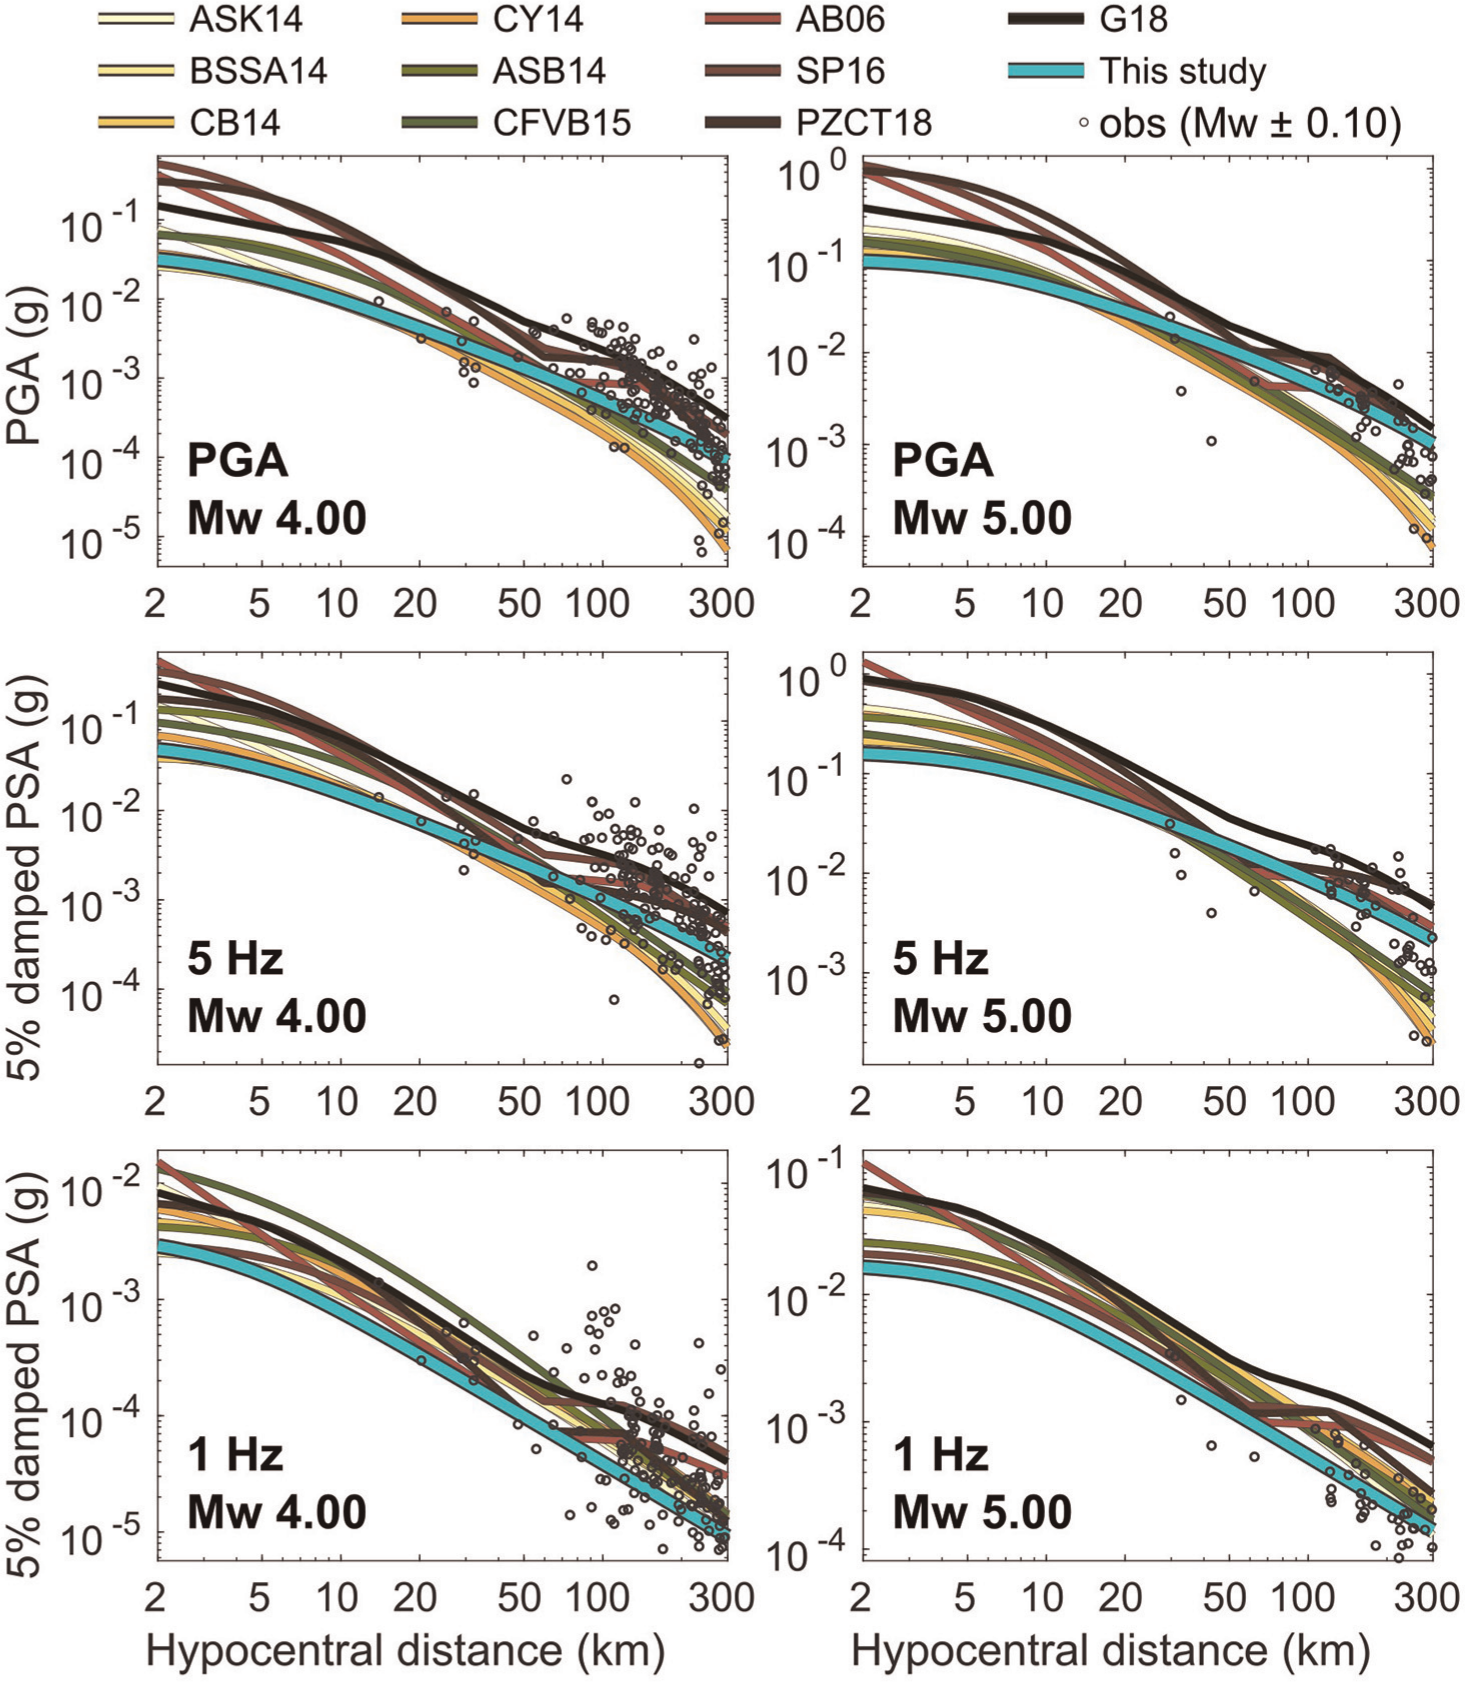
Figure 8 shows our final southern EARS GMM attenuation curve plotted against distance in comparison to the 10 GMMs ranked for the region. Moreover, similar to the BSSA14 GMM, our GMM does not contain the distinctive transition zone observed in the stable continental GMMs between 60 and 100 km. This transition zone reflects the joining of critically reflected direct waves from the Moho and the transition from direct to surface waves dominating the signal (e.g. Yenier and Atkinson, 2014). Due to the large scatter observed in the southern EARS data, this transition could not clearly be determined. Instead, this is something that we leave for future GMM studies to investigate further once strong-motion and geotechnical data are available and GMMs for smaller regions within the southern EARS can be developed. For the high-frequency IMs (> 5 Hz), our GMM levels lie lower than the stable continental GMMs and higher than the active crustal GMMs. This makes sense considering that the geology of the southern EARS’ early-stage rift likely lies somewhere between that of an old stable continental plate and a fully developed active plate margin.
Attenuation curves plotted against distance of the models evaluated for southern EARS and our newly developed GMM. Each row shows the GMMs and observations for a given ground-motion IM (top to bottom: PGA, PSA at 5 Hz, and PSA at 1 Hz) and each column shows a magnitude (left to right: 4.0 and 5.0). The GMMs are shown for = 760 m/s and depth = 2 km (where needed), and the observations are site corrected to = 760 m/s.
Discussion
GMMs are a key component in PSHAs and it is important to use GMMs that realistically model the ground-motion intensities to accurately describe the seismic hazard in a region. For the southern EARS, PSHAs have often used a combination of active crustal and stable continental GMMs (e.g. Poggi et al., 2017), but the lack of strong-motion data prevented an examination of the suitability of the models. For example, the thick seismogenic zone in the southern EARS leads to earthquakes occurring at greater depths than the applicability range of the GMMs commonly used. Here, we rank common GMMs with a newly compiled southern EARS ground-motion database (Holmgren et al., 2023a) and find that the stable continental GMMs generally overpredict, while the active crustal GMMs underpredict the observed ground-motion intensities. This is especially observed in the higher frequencies (>5 Hz), which could be expected considering the cold, thick cratons surrounding the southern EARS are likely preserving the high-frequency content more than the complex geology in active crustal regions, whereas the early-stage rift zone is providing slightly more attenuation than that of a pure stable continental region. This distinct attenuation behavior with distance of the southern EARS is also reflected in our newly developed regional GMM, whose median level lies between the stable continental and active crustal GMMs.
Out of the 10 GMM ranked in this study, the two that perform the best in southern EARS are the CENA model by AB06 and the active crustal model by CFVB15. In particular, we find that while AB06 has a large residual variability compared to the other GMMs (except for G18), it consistently results in residuals closer to zero for all examined IMs and produces the closest zero-trend attenuation curve with distance and magnitude. This is especially seen for the higher frequencies, which are of particular importance for engineering and risk purposes in the southern EARS (> 4 Hz), where the over- and underprediction of intensities becomes more pronounced for the other GMMs. If we also consider future growth of African metropolises and the development of taller buildings and thus increased importance of IMs with lower frequencies, all the examined GMMs generally performed well, with larger overprediction by G18 and SP16 and the best performance by AB06, ASK14, and CVFB15 (Figure 5). Thus, based on these findings and in terms of median GMM levels, we recommend using the AB06 GMM over the other examined GMMs or, alternatively, we recommend using our newly developed regional GMM, which is the BSSA14 model with an empirically adapted path term.
One challenge with the southern EARS region is the lack of geotechnical data, such as local or other site characteristics. Here, we use the USGS proxy based on topographic slope, which assumes that steeper dipping slopes are correlated with higher measurements and gently dipping slopes have lower (e.g. Heath et al., 2020). However, the topography-based has been shown to not perform as well in stable regions (Lemoine et al., 2012). For the southern EARS, the USGS values range between 200 and 900 m/s, with most stations below 600 m/s (see Figure 2d) even though the region has limited sedimentary depth according to the CRUST 1.0 global model (Laske et al., 2013). For example, the Malawi rift in southern Lake Malawi has a flat topography even though its bedrock is close to the surface (e.g. Stevens et al., 2021). Thus, the topography-based predicts very low values (200–300 m/s) when they should be larger. This is presumably one of the contributors to the large residual variability observed for the ranked GMMs and our developed GMM. Furthermore, we find that using a constant = 760 m/s improves the stable continental GMMs ranking (except for AB06), whereas the active crustal GMMs perform better with the USGS proxy. Considering that the stable continental GMMs overpredict the southern EARS ground-motion intensities, this is also expected as = 760 m/s is higher than most of the database USGS values, thus leading to a decreased site amplification.
Large uncertainties in GMMs can lead to unrealistic ground-motion levels and scenarios in seismic risk analyses, resulting in severe overprediction of damage and annual economic loss. As seen from the large residual variability in the global GMM comparison (especially for AB06) and our newly developed regional GMM, there are still areas of improvement to increase the southern EARS earthquake preparedness in terms of understanding its ground-motion characteristics. Here, we highlight the need for regional geotechnical studies to find local site parameters, such as or the depth to the bedrock. Another area of uncertainty concerns the magnitudes used. Holmgren et al. (2023a) used the Weatherill et al.’s (2016) magnitude conversions, and these have not been tested in the southern EARS. Local calibration of these magnitude conversions would improve the estimates for earthquakes where cannot be estimated directly from the data. Earthquake location is also a source of uncertainty, particularly at close distances. As seen in Figure 2c, many of the earthquakes were located at very shallow depths due to the negligible basin depth in Stevens et al.’s (2021) velocity model used in the work by Holmgren et al. (2023a). While this 1D velocity model fits most of the southern EARS, it likely resulted in too-shallow earthquakes in any areas with sedimentary basins. A regional 3D velocity and density model could help improve both the location and estimations. Finally, it is worth noting that seismic disaggregation results for the region predict that a significant hazard primarily comes from 5–7 earthquakes at close distances (< 50 km) (e.g. Hodge et al., 2015; Williams et al., 2023). There is still a lack of seismic data available for these magnitude and distance bins which is reflected in the database (Figure 2b), thus introducing a limitation of this study. However, with the improved seismic instrumentation of the region over the last decades, future ground-motion studies will be able to cover this gap and also provide more refined GMMs applicable to specific regions within the southern EARS for practical engineering use.
Conclusion
Using a newly compiled southern EARS ground-motion database by Holmgren et al. (2023a), we evaluate the suitability of six active crustal GMMs and four stable continental GMMs for the region. We find that the resultant residual variability is large for all GMMs, most likely due to the lack of local site information available. Furthermore, the active crustal GMMs tend to underpredict the observed southern EARS ground-motion intensities, particularly at greater distances (> 70 km) and for higher frequencies (> 5 Hz). Meanwhile, the stable continental GMMs tend to overpredict the intensities and perform better using a constant = 760 m/s instead of the USGS proxy. Overall, the stable continental AB06 and active crustal CFVB15 models perform the best in our ranking. We also develop a new region-specific GMM for southern EARS by adapting the path term of the BSSA14 GMM using mixed-effects regression. Our GMM is applicable for 3.0–7.9 and out to 300 km, for ground-motion IMs PGA, PGV, and PSA between 1 and 20 Hz. Similar to the global GMMs, we find that the residual variability is large and likely unrealistic due to the lack of local geotechnical information, uncertainties in magnitude, and the database’s large number of small-magnitude records at large distances. We thus provide the global -model from the NGA-East PEER project to be used instead.
For realistic seismic hazard and risk assessments and practical engineering applications, it is crucial to use GMMs which can accurately model the earthquakes in a region and that reflect the local geological setting. Thanks to the increased seismic instrumentation in the southern EARS over the last couple of decades, the strong-motion data availability has improved and provided important insights into the ground-motion characteristics. However, there are still several more elements needed to further improve the region’s seismic hazard assessments, such as greater insight into geotechnical data for local site characteristics, correction factors to account for regional differences within the southern EARS, local magnitude conversion equations, and regional 3D velocity structures for accurate earthquake location and magnitude estimates.
Supplemental Material
sj-csv-2-eqs-10.1177_87552930241236765 – Supplemental material for Ranking and developing ground-motion models for Southeastern Africa
Supplemental material, sj-csv-2-eqs-10.1177_87552930241236765 for Ranking and developing ground-motion models for Southeastern Africa by Joanna M Holmgren, Maximilian J Werner, Katsuichiro Goda, Manuela Villani, Vitor Silva and Patrick Chindandali in Earthquake Spectra
Supplemental Material
sj-pdf-1-eqs-10.1177_87552930241236765 – Supplemental material for Ranking and developing ground-motion models for Southeastern Africa
Supplemental material, sj-pdf-1-eqs-10.1177_87552930241236765 for Ranking and developing ground-motion models for Southeastern Africa by Joanna M Holmgren, Maximilian J Werner, Katsuichiro Goda, Manuela Villani, Vitor Silva and Patrick Chindandali in Earthquake Spectra
Footnotes
Acknowledgements
The authors thank Joao Fonseca and an anonymous reviewer for their constructive comments which helped improve this article. They also thank Gail Atkinson, Norman Abrahamson, Luke Wedmore, and Juliet Biggs for useful discussions and suggestions.
Declaration of conflicting interests
The author(s) declared no potential conflicts of interest with respect to the research, authorship, and/or publication of this article.
Funding
The author(s) disclosed receipt of the following financial support for the research, authorship, and/or publication of this article: This work was funded by the EPSRC IAA (grant no. EP/R511663/1) and EPSRC SAFER PREPARED (grant no. EP/T015462/1).
ORCID iDs
Joanna M Holmgren
Maximilian J Werner
Katsuichiro Goda
Vitor Silva
Patrick Chindandali
Supplemental material
Supplemental material for this article is available online.
Data Availability Statement
The dataset used in this study can be accessed through the International Seismological Centre (ISC) Repository at (Holmgren et al., 2023b).
References
1.
AbrahamsonNAYoungsRR (1992) A stable algorithm for regression analyses using the random effects model. Bulletin of the Seismological Society of America82(1): 505–510.
2.
AbrahamsonNASilvaWJKamaiR (2014) Summary of the ASK14 ground motion relation for active crustal regions. Earthquake Spectra30(3): 1025–1055.
3.
AkkarSSandıkkayaMABommerJJ (2014a) Empirical ground-motion models for point-and extended-source crustal earthquake scenarios in Europe and the Middle East. Bulletin of Earthquake Engineering12: 359–387.
4.
AkkarSSandıkkayaMAŞenyurtMAzari SisiAAyBÖTraversaPDouglasJCottonFLuziLHernandezBGodeyS (2014b) Reference database for seismic ground-motion in Europe (RESORCE). Bulletin of Earthquake Engineering12: 311–339.
5.
Al AtikL (2015) NGA-East: Ground-motion standard deviation models for central and eastern North America. PEER report no. 2015/07, 7June. Berkeley, CA: Pacific Earthquake Engineering Research Center.
6.
Al AtikLAbrahamsonNBommerJJScherbaumFCottonFKuehnN (2010) The variability of ground-motion prediction models and its components. Seismological Research Letters81(5): 794–801.
AtkinsonGM (2006) Single-station sigma. Bulletin of the Seismological Society of America96(2): 446–455.
9.
AtkinsonGM (2008) Ground-motion prediction equations for eastern North America from a referenced empirical approach: Implications for epistemic uncertainty. Bulletin of the Seismological Society of America98(3): 1304–1318.
10.
AtkinsonGMBooreDM (2006) Earthquake ground-motion prediction equations for eastern North America. Bulletin of the Seismological Society of America96(6): 2181–2205.
11.
BiggsJNissenECraigTJacksonJRobinsonDP (2010) Breaking up the hanging wall of a rift-border fault: The 2009 Karonga earthquakes, Malawi. Geophysical Research Letters37(11): L11305.
12.
BommerJJDouglasJScherbaumFCottonFBungumHFähD (2010) On the selection of ground-motion prediction equations for seismic hazard analysis. Seismological Research Letters81(5): 783–793.
13.
BooreDM (2010) Orientation-independent, nongeometric-mean measures of seismic intensity from two horizontal components of motion. Bulletin of the Seismological Society of America100(4): 1830–1835.
14.
BooreDMCampbellKW (2017) Adjusting central and eastern North America ground-motion intensity measures between sites with different reference-rock site conditions. Bulletin of the Seismological Society of America107(1): 132–148.
15.
BooreDMStewartJPSeyhanEAtkinsonGM (2014) NGA-West2 equations for predicting PGA, PGV, and 5% damped PSA for shallow crustal earthquakes. Earthquake Spectra30(3): 1057–1085.
16.
BozorgniaYAbrahamsonNAAtikLAAnchetaTDAtkinsonGMBakerJWBaltayABooreDMCampbellKWChiouBSJDarraghR (2014) NGA-West2 research project. Earthquake Spectra30(3): 973–987.
17.
CampbellKWBozorgniaY (2014) NGA-West2 ground motion model for the average horizontal components of PGA, PGV, and 5% damped linear acceleration response spectra. Earthquake Spectra30(3): 1087–1115.
18.
CauzziCFaccioliEVaniniMBianchiniA (2015) Updated predictive equations for broadband (0.01–10 s) horizontal response spectra and peak ground motions, based on a global dataset of digital acceleration records. Bulletin of Earthquake Engineering13: 1587–1612.
19.
CheriberiDYeeE (2022) Preliminary seismic hazard analyses for the Ugandan region. Applied Sciences12(2): 598.
20.
ChiouBJYoungsRR (2008) An NGA model for the average horizontal component of peak ground motion and response spectra. Earthquake Spectra24(1): 173–215.
21.
ChiouBJYoungsRR (2014) Update of the Chiou and Youngs NGA model for the average horizontal component of peak ground motion and response spectra. Earthquake Spectra30(3): 1117–1153.
22.
CraigTJJacksonJA (2021) Variations in the seismogenic thickness of East Africa. Journal of Geophysical Research: Solid Earth126(3): e2020JB020754.
23.
CraigTJJacksonJAPriestleyKMcKenzieD (2011) Earthquake distribution patterns in Africa: Their relationship to variations in lithospheric and geological structure, and their rheological implications. Geophysical Journal International185(1): 403–434.
24.
DalyMCGreenPWattsABDaviesOChibesakundaFWalkerR (2020) Tectonics and landscape of the central African Plateau and their implications for a propagating Southwestern Rift in Africa. Geochemistry, Geophysics, Geosystems21(6): e2019GC008746.
25.
DelvauxDMulumbaJLSebagenziMNSBondoSFKervynFHavenithHB (2017) Seismic hazard assessment of the Kivu rift segment based on a new seismotectonic zonation model (western branch, East African Rift system). Journal of African Earth Sciences134: 831–855.
26.
DziewonskiAMChouTAWoodhouseJH (1981) Determination of earthquake source parameters from waveform data for studies of global and regional seismicity. Journal of Geophysical Research: Solid Earth86(B4): 2825–2852.
27.
EbingerCJOlivaSJPhamTQPetersonKChindandaliPIllsley Kemp-F DrooffCShillingtonDJAccardoNJGallacherRJGahertyJNybladeAAMuliboG (2019) Kinematics of active deformation in the Malawi rift and Rungwe Volcanic Province, Africa. Geochemistry, Geophysics, Geosystems20(8): 3928–3951.
28.
EkströmGNettlesMDziewońskiAM (2012) The global CMT project 2004–2010: Centroid-moment tensors for 13,017 earthquakes. Physics of the Earth and Planetary Interiors200: 1–9.
29.
FarajpourZKowsariMPezeshkSHalldorssonB (2021) Ranking of ground-motion models (GMMs) for use in probabilistic seismic hazard analysis for Iran based on an independent data set. Bulletin of the Seismological Society of America 111(1): 242–257.
30.
FentonCHBommerJJ (2006) The Mw7 Machaze, Mozambique, earthquake of23February2006. Seismological Research Letters77(4): 426–439.
31.
GiordanoNDe RisiRMacdonaldJGodaKKafodyaINgomaI (2023) Implications of building code enforcement and urban expansion on future earthquake loss in East Africa: Case study—Blantyre, Malawi. Natural Hazards117: 1083–1104.
32.
GodaKGibsonEDSmithHRBiggsJHodgeM (2016) Seismic risk assessment of urban and rural settlements around Lake Malawi. Frontiers in Built Environment2: 30.
33.
GouletCABozorgniaYAbrahamsonNAKuehnNAl AtikLYoungsRRGravesRWAtkinsonGM (2018) Central and Eastern North America ground-motion characterization (NGA-East). PEER report no. 2018/18. Berkeley, CA: Pacific Earthquake Engineering Research Center.
34.
GounonALetortJCottonFWeatherillGSylvanderMLatourS (2022) Improving depth estimations of African earthquakes using teleseismic data, and influence for the East-African rift seismic hazard characterization. Geophysical Journal International228(1): 447–460.
35.
HassaniBAtkinsonGM (2015) Referenced empirical ground-motion model for eastern North America. Seismological Research Letters86(2A): 477–491.
36.
HeathDCWaldDJWordenCBThompsonEMSmoczykGM (2020) A global hybrid VS30 map with a topographic slope-based default and regional map insets. Earthquake Spectra36(3): 1570–1584.
37.
HodgeMBiggsJGodaKAspinallW (2015) Assessing infrequent large earthquakes using geomorphology and geodesy: The Malawi Rift. Natural Hazards76(3): 1781–1806.
38.
HolmgrenJMWernerMJGodaKVillaniMSilvaVChindandaliPStevensV (2023a) A relocated earthquake catalog and ground motion database for the southern East African rift system. Earthquake Spectra39(3): 1911–1929.
39.
HolmgrenJMWernerMJGodaKVillaniMSilvaVChindandaliPStevensV (2023b) The southern East African Rift System (EARS) relocated earthquake catalogue and ground-motion database. ISC Seismological Dataset Repository. DOI: 10.31905/4GGVBFBE
40.
JacksonJBlenkinsopT (1993) The Malawi earthquake of March 10, 1989: Deep faulting within the East African rift system. Tectonics12(5): 1131–1139.
41.
JacksonJBlenkinsopT (1997) The Bilila-Mtakataka fault in Malawi: An active, 100-km long, normal fault segment in thick seismogenic crust. Tectonics16(1): 137–150.
42.
JestinFHuchonPGaulierJM (1994) The Somalia plate and the East African Rift System: Present-day kinematics. Geophysical Journal International116(3): 637–654.
43.
JonathanE (1996) Some aspects of seismicity in Zimbabwe and eastern and southern Africa: Seismicity of Lake Kariba, attenuation relations in eastern and southern Africa and earthquake magnitude scales for Zimbabwe. MSc Thesis, Institute of Solid Earth Physics, University of Bergen, Bergen.
44.
KaleÖAkkarS (2013) A new procedure for selecting and ranking ground-motion prediction equations (GMPEs): The Euclidean distance-based ranking (EDR) method. Bulletin of the Seismological Society of America103(2A): 1069–1084.
45.
KendallJMLithgow-BertelloniC (2016) Why is Africa rifting?Geological Society, London, Special Publications420(1): 11–30.
46.
KloukinasPNovelliVKafodyaINgomaIMacdonaldJGodaK (2020) A building classification scheme of housing stock in Malawi for earthquake risk assessment. Journal of Housing and the Built Environment35: 507–537.
47.
LaskeGMastersGMaZPasyanosM (2013) Update on CRUST1.0: A 1-degree global model of earth’s crust. Geophysical Research Abstracts15(15): 2658.
48.
LemoineADouglasJCottonF (2012) Testing the applicability of correlation between topographic slope and VS30 for Europe. Bulletin of the Seismological Society of America102: 2585–2599.
49.
McNamaraDEWolinEPowersPMShumwayAMMoschettiMPRekoskeJThompsonEMMuellerCSPetersenMD (2020) Evaluation of ground-motion models for US geological survey seismic hazard forecasts: Hawaii tectonic earthquakes and volcanic eruptions. Bulletin of the Seismological Society of America110(2): 666–688.
50.
MakSClementsRASchorlemmerD (2017) Empirical evaluation of hierarchical ground-motion models: Score uncertainty and model weighting. Bulletin of the Seismological Society of America107(2): 949–965.
51.
MavongaT (2007) An estimate of the attenuation relationship for strong ground motion in the Kivu Province, Western Rift Valley of Africa. Physics of the Earth and Planetary Interiors162(1–2): 13–21.
52.
MavongaTLukindulaJDurrheimRJ (2020) Seismic hazard assessment of the Democratic Republic of Congo and Environs based on the GEM–SSA Catalogue and a new seismic source model. Pure and Applied Geophysics177: 195–214.
53.
MidziVHlatywayoDJChapolaLSKebedeFAtakanKLombeDKTuryomurugyendoGTugumeFA (1999) Seismic hazard assessment in Eastern and Southern Africa. Annali Di Geofisca42(6): 1067–1083.
54.
NovelliVIDe RisiRNgomaIKafodyaIKloukinasPMacdonaldJGodaK (2021) Fragility curves for non-engineered masonry buildings in developing countries derived from real data based on structural surveys and laboratory tests. Soft Computing25: 6113–6138.
55.
PaulNSilvaVAmo-OduroD (2022) Development of a uniform exposure model for the African continent for use in disaster risk assessment. International Journal of Disaster Risk Reduction71: 102823.
56.
PezeshkSZandiehACampbellKWTavakoliB (2018) Ground-motion prediction equations for central and eastern North America using the hybrid empirical method and NGA-West2 empirical ground-motion models. Bulletin of the Seismological Society of America108(4): 2278–2304.
57.
PoggiVDurrheimRTulukaGMWeatherillGGeeRPaganiMNybladeADelvauxD (2017) Assessing seismic hazard of the East African Rift: A pilot study from GEM and AfricaArray. Bulletin of Earthquake Engineering15(11): 4499–4529.
58.
Rodriguez-MarekAMontalvaGACottonFBonillaF (2011) Analysis of single-station standard deviation using the KiK-net data. Bulletin of the Seismological Society of America101(3): 1242–1258.
59.
SariaECalaisEAltamimiZWillisPFarahH (2013) A new velocity field for Africa from combined GPS and DORIS space geodetic Solutions: Contribution to the definition of the African reference frame (AFREF). Journal of Geophysical Research: Solid Earth118: 1677–1697.
60.
ScherbaumFDelavaudERiggelsenC (2009) Model selection in seismic hazard analysis: An information-theoretic perspective. Bulletin of the Seismological Society of America99(6): 3234–3247.
61.
ScherbaumFSchmedesJCottonF (2004) On the conversion of source-to-site distance measures for extended earthquake source models. Bulletin of the Seismological Society of America94(3): 1053–1069.
62.
SeyhanEStewartJP (2014) Semi-empirical nonlinear site amplification from NGA-West2 data and simulations. Earthquake Spectra30(3): 1241–1256.
63.
ShahjoueiAPezeshkS (2016) Alternative hybrid empirical ground-motion model for central and eastern North America using hybrid simulations and NGA-West2 models. Bulletin of the Seismological Society of America106(2): 734–754.
64.
StampsDSKreemerCFernandesRRajaonarisonTARambolamananaG (2021) Redefining East African rift system kinematics. Geology49(2): 150–155.
65.
StevensVLSloanRAChindandaliPRWedmoreLNSalomonGWMuirRA (2021) The entire crust can be seismogenic: Evidence from southern Malawi. Tectonics40(6): e2020TC006654.
66.
SungCHAbrahamsonN (2022) A partially nonergodic ground-motion model for Cascadia interface earthquakes. Bulletin of the Seismological Society of America112(5): 2520–2541.
67.
SunnyJDe AngelisMEdwardsB (2021) Ranking and selection of earthquake ground-motion models using the stochastic area metric. Seismological Research Letters93(2A): 787–797.
68.
ThompsonEMWordenCB (2018) Estimating rupture distances without a rupture. Bulletin of the Seismological Society of America108(1): 371–379.
69.
TwesigomweEM (1997) Seismic hazards in Uganda. Journal of African Earth Sciences24(1-2): 183–195.
70.
Van HinsbergenDJJBuiterSJHTorsvikTHGainaCWebbSJ (2011) The formation and evolution of Africa from the Archaean to Present: Introduction. Geological Society, London, Special Publications357: 1–8.
71.
WeatherillGAPaganiMGarciaJ (2016) Exploring earthquake databases for the creation of magnitude-homogeneous catalogues: Tools for application on a regional and global scale. Geophysical Journal International206(3): 1652–1676.
72.
WedmoreLNJBiggsJFloydMFagerengÅMdalaHChindandaliPWilliamsJNMphepoF (2021) Geodetic constraints on cratonic microplates and broad strain during rifting of thick Southern African lithosphere. Geophysical Research Letters48(17): e2021GL093785.
73.
WedmoreLNJBiggsJWilliamsJNFagerengÅDulanyaZMphepoFMdalaH (2020) Active fault scarps in southern Malawi and their implications for the distribution of strain in incipient continental rifts. Tectonics39(3): e2019TC005834.
74.
WilliamsJNMdalaHFagerengÅWedmoreLNBiggsJDulanyaZChindandaliPMphepoF (2021) A systems-based approach to parameterise seismic hazard in regions with little historical or instrumental seismicity: Active fault and seismogenic source databases for southern Malawi. Solid Earth12(1): 187–217.
75.
WilliamsJNWedmoreLNScholzCAKolawoleFWrightLJShillingtonDJFagereng BiggsJMdalaÅHDulanyaZMphepoFChindandaliPRNWernerMJ (2022) The Malawi active fault database: An onshore-offshore database for regional assessment of seismic hazard and tectonic evolution. Geochemistry, Geophysics, Geosystems23(5): e2022GC010425.
76.
WilliamsJNWernerMGodaKWedmoreLDe RisiRBiggsJMdalaHDulanyaZFarereng MphepoÅFChindandaliP (2023) Fault-based probabilistic seismic hazard analysis in regions with low strain rates and a thick seismogenic layer: A case study from Malawi. Geophysical Journal International233(3): 2172–2206.
77.
YenierEAtkinsonGM (2014) Equivalent point–source modeling of moderate-to-large magnitude earthquakes and associated ground-motion saturation effects. Bulletin of the Seismological Society of America104(3): 1458–1478.
78.
YenierEAtkinsonGM (2015) Regionally adjustable generic ground-motion prediction equation based on equivalent point-source simulations: Application to central and eastern North America. Bulletin of the Seismological Society of America105(4): 1989–2009.
Supplementary Material
Please find the following supplemental material available below.
For Open Access articles published under a Creative Commons License, all supplemental material carries the same license as the article it is associated with.
For non-Open Access articles published, all supplemental material carries a non-exclusive license, and permission requests for re-use of supplemental material or any part of supplemental material shall be sent directly to the copyright owner as specified in the copyright notice associated with the article.