
Abstract
The Kathmandu Valley is within a seismically active region with only few recorded strong-motion data. Geophysical information in the Valley is also sparse. In addition, the absence of an open database which compiles in situ geophysical tests, borehole records, and geotechnical laboratory data is affecting the advancement of knowledge in the region. This article presents SAFER/GEO-591 database, named after the Engineering and Physical Science Research Council (EPSRC)-funded project Seismic Safety and Resilience of Schools in Nepal (SAFER). SAFER/GEO-591 contains data from groundwater wells and boreholes originally commissioned for research and commercial purposes. This work describes (1) the quality assessment and harmonization process conducted on the dataset, (2) the variation of shear-wave velocity (VS) measurements and geotechnical parameters with depth and elevation in the Valley, (3) the current understanding of the Valley sediment/bedrock topography, and finally (4) new geological cross sections. A companion article presents an updated VS30 map across the Valley based on the contributions of this article. The database can be downloaded from the University of Bristol repository via DOI: https://doi.org/10.5523/bris.3gjcvx51lnpuv269xsa1yrb0rw
Introduction
The Kathmandu Valley and surrounding region has experienced recurring destructive earthquakes: the first recorded circa 1255 CE (e.g. Paudyal et al., 2012, 2013) and later 2015 Mw 7.8 Gorkha earthquake (e.g. Goda et al., 2015). The Valley is an intermontane tectonic basin with a base defined by the Main Central Thrust (MCT) formed within the Lesser Himalayas by crustal shortening (Stöcklin, 1980). This basin is filled with thick semi-consolidated sediments transported primarily by the Proto-Bagmati River derived from metamorphosed sedimentary sequences surrounding the Valley (Sakai, 2001). Examination of the scarce ground motion data suggests that nonlinear site response may offer partial explanation for the strong earthquake events of 2015 (e.g. Rajaure et al., 2017). The 2015 mainshock is thought to have originated on the Main Himalayan Thrust (MHT), the main basal décollement underlying the thrust system (Elliott et al., 2016). Amplification of the long-period energy was evident at stations positioned on the sediments, with site effects understood to play a dominant role on the distribution of the incident waveforms (Asimaki et al., 2017). Moreover, damage observations led to higher macro-seismic intensity estimations in areas, such as Bhaktapur, which lies in the eastern portion of the Valley; this area is also characterized by obsolete building stock (e.g. Goda et al., 2015; McGowan et al., 2017). The records of ground motion revealed that there remains considerable uncertainty regarding both the geological structure and site amplification experienced in the Kathmandu Valley.
Small-strain shear modulus and shear-wave velocity (VS) play an important role in seismic analyses, including hazard analysis, site classification, site response analysis, and soil–structure interaction (e.g. Seed and Idriss, 1969; Shi and Asimaki, 2017; Vucetic and Dobry, 1991; Wair et al., 2012; Yoshimi et al., 1977). When analyzing regions which could be affected by “valley amplification,” the soil condition and geological structure can provide additional explanation as nonlinear amplification effects occur (e.g. Psarropoulos et al., 2007). Within the context of site classification in codes of practice (e.g. Eurocode 8 (European Committee for Standardization (CEN), 2004) and ASCE/SEI 7–16 (American Society of Civil Engineers (ASCE), 2016)), the average VS in the upper 30 m of a site (VS30) is the synthetic parameter typically used to identify seismic amplification in soil deposits. VS30 was introduced in the early 1990s (e.g. Borcherdt, 1994; Borcherdt and Glassmoyer, 1992) and its capability as a proxy for site amplification has been discussed in different regional contexts (e.g. Stewart et al., 2003). Despite many researchers searching for more informative proxies or integrative information for site amplification and soil classification (e.g. Gallipoli and Mucciarelli, 2009; Lee and Trifunac, 2010; Luzi et al., 2011), VS30 remains a widely used parameter. This is especially true in ground motion prediction equations (GMPEs) linking seismic hazard estimation to VS30 (e.g. Abrahamson et al., 2016; Boore et al., 2014). Indirect proxies for VS30 have been identified especially for large-scale hazard analyses. In particular, topography, that is, slope has been used as proxy for the global VS30 model employed by the United States Geological Survey (USGS) (Allen and Wald, 2009; Wald and Allen, 2007). Given the importance of shear-wave measurements for site response studies, any downhole seismic measurements undertaken in the Kathmandu Valley are extremely useful; as yet there is a systematic lack of direct measurements of VS in the Kathmandu Valley. The Japan International Cooperation Agency (JICA) (2002) produced five boreholes with P-S logging measurements to 30 m, which many researchers have used as a source of VS data (e.g. Gautam and Chamlagain, 2016; Gilder et al., 2018; Molnar et al., 2017). Gautam (2017) presented a correlation between standard penetration test blow count (SPT-N) and VS using these boreholes and some additional industry data. Similarly, Gautam and Chamlagain (2016) provided distributions of spectral acceleration and calculation of the predominant period, assigning a VS of 700 m/s at the base of 49 borehole logs to 30 m. Alternative methods for the derivation of VS have been employed, with numerous studies providing micro-zonation of the Kathmandu Valley through microtremor and horizontal-to-vertical spectral ratio (HVSR) methods (e.g. Molnar et al., 2017; Paudyal et al., 2012, 2013; Pokhrel et al., 2019; Poovarodom et al., 2017; Tallett-Williams et al., 2016). Pagliaroli et al. (2018) used a mix of HVSR curves and 2D circular array microtremor measurements to estimate the depths to impedance contrast and attain velocity profiles for 1D and 2D site response analysis. However, these methods require a good physical model of the below ground structure where there is complex wave propagation as in basin contexts (e.g. Bindi et al., 2009), yet the geological structure beneath Kathmandu remains uncertain.
Geological setting
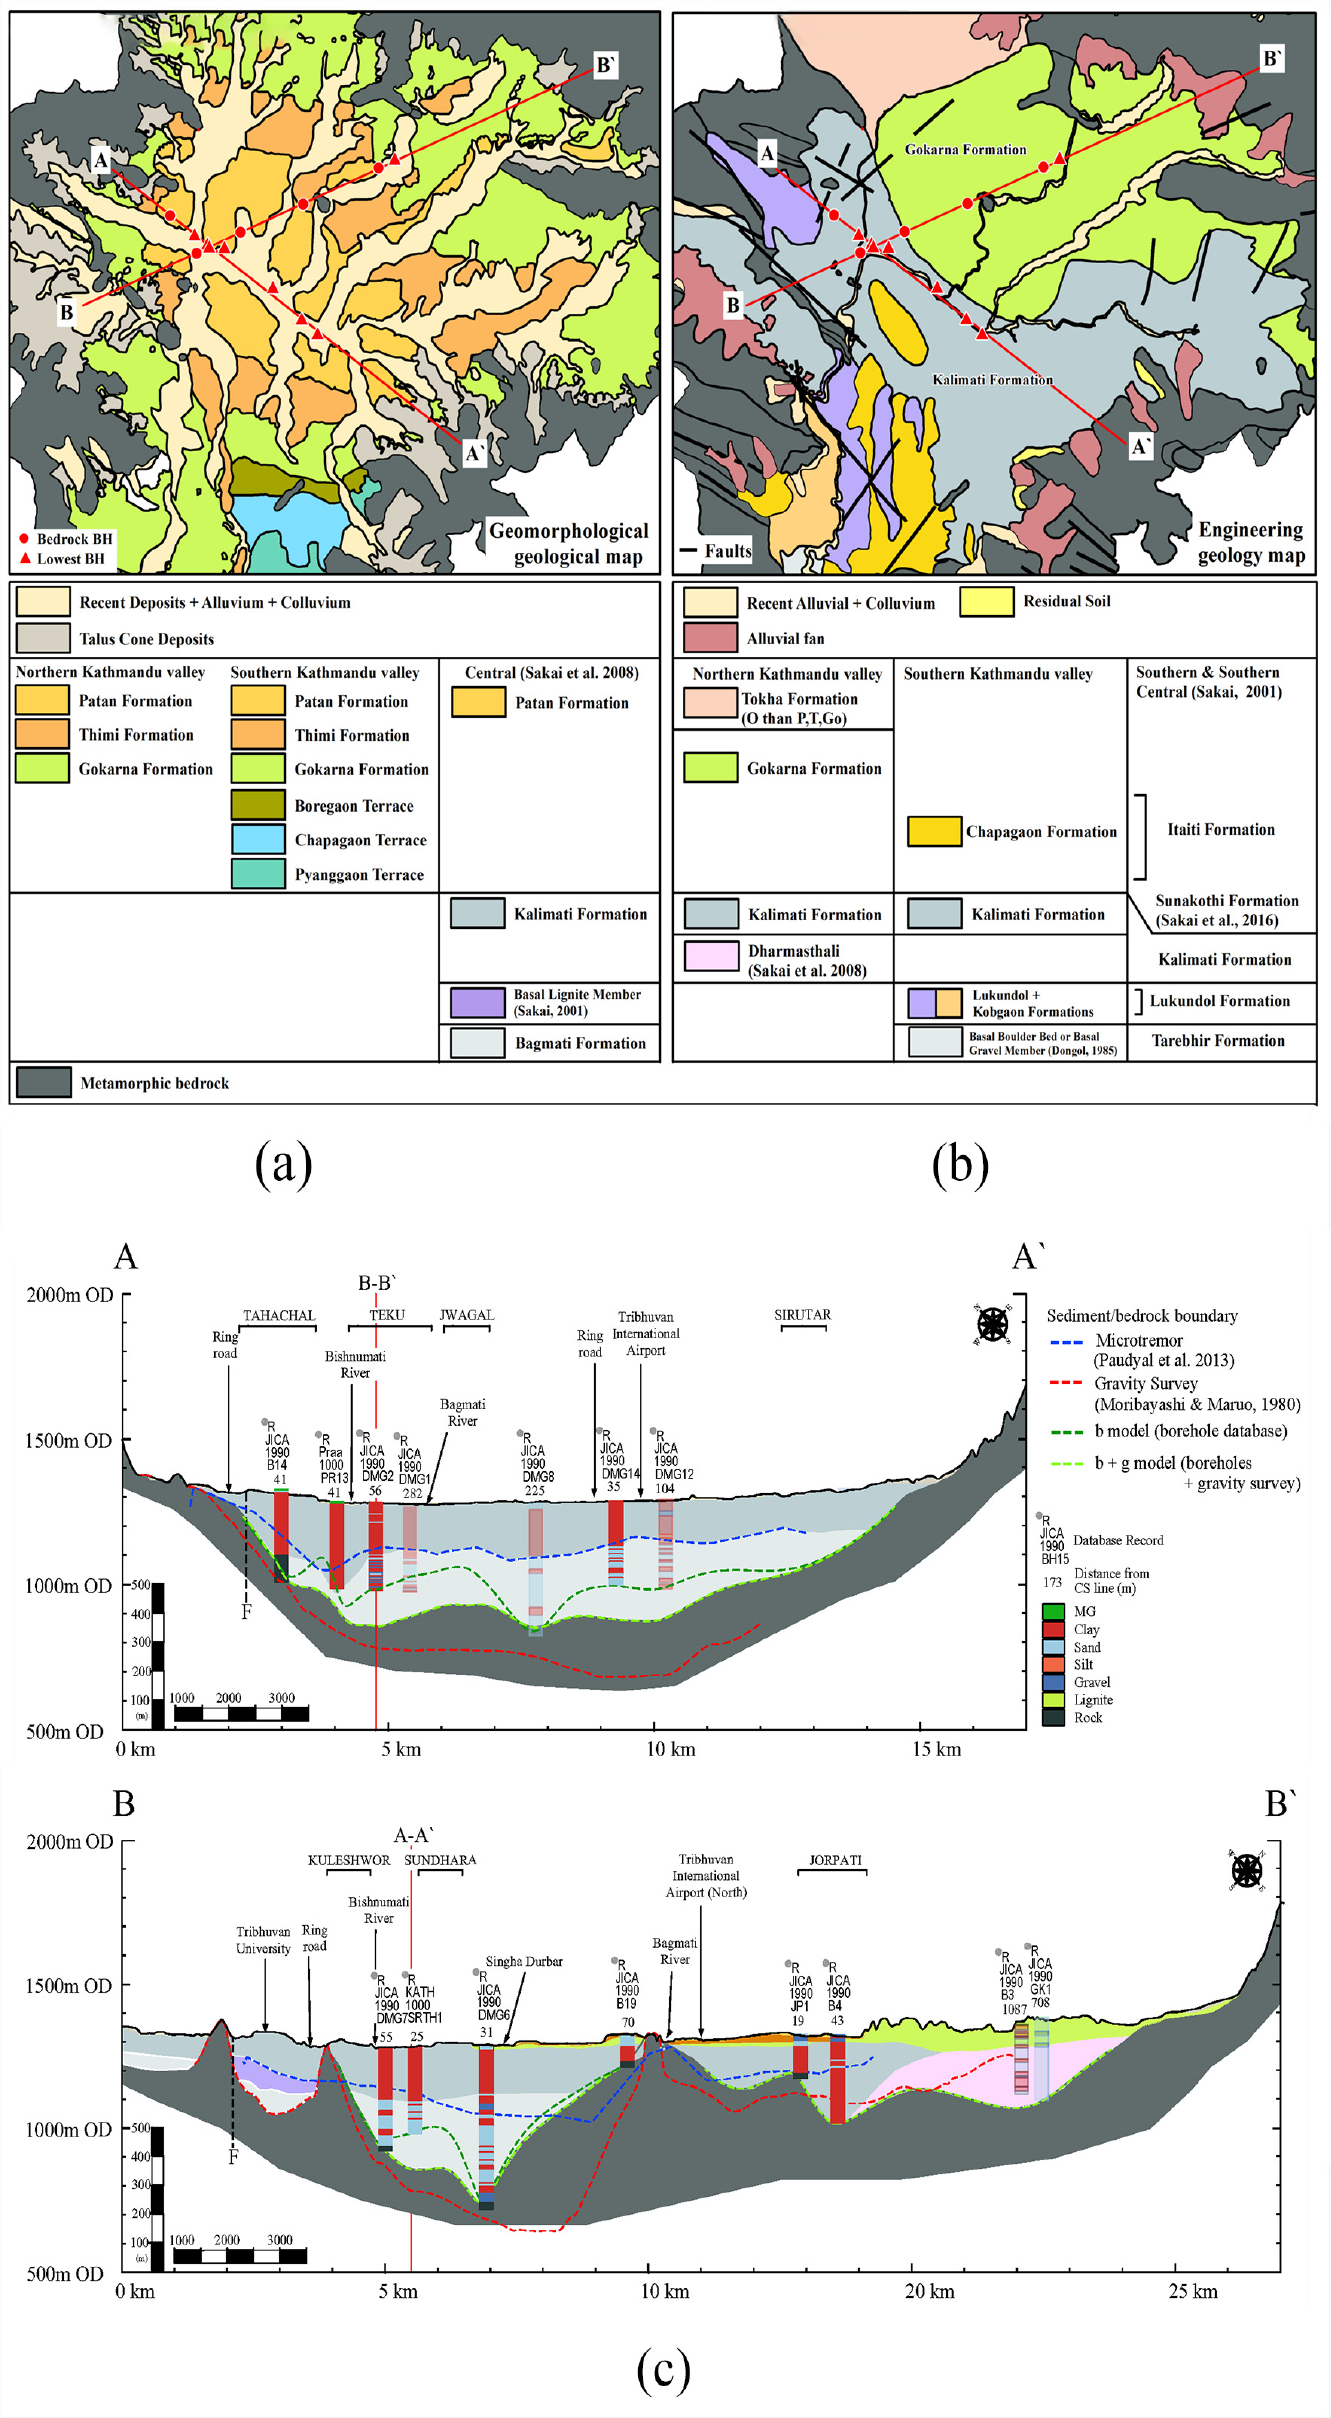
The Kathmandu Valley is underlain by sediments derived from both lacustrine and fluvio-deltaic origins (Sakai et al., 2002). The northern portion of the Valley is characterized by a wide range of sediment grain sizes, representing delta front, delta plain, and pro-delta deposits of a fluvio-deltaic system, that is, the Gokarna, Thimi, and Patan Formations (Sakai et al., 2001b, 2008; Yoshida and Igarashi, 1984). Beneath this, a thick deposit of black silty beds, the “Kalimati Formation,” represents an older lacustrine environment, mainly present in the southern valley (e.g. Shrestha et al., 1998). Various stages of lake extension, with the older Paleo-Kathmandu Lake evolving during the Pliocene, early Pleistocene (Fujii and Sakai, 2002; Sakai et al., 2002), and younger late Quaternary lake (Dill et al., 2003), including seasonal small-amplitude fluctuations recognized from the aggrading delta plain deposits (Sakai et al., 2001b) makes for a complex distribution of materials. The Valley is also bounded to the north by high-temperature, high-grade gneiss, with remaining boundaries of low metamorphic grade, slates, phyllites, and crystalline limestones (Stöcklin, 1980). These lithologies extend below the Valley sediments at depth. Characterization of the basin sediments geologically has come from numerous authors (Dongol, 1985; Sakai, 2001; Sakai et al., 2008, 2016). Two main maps representing the sediments are available; a geomorphological map presented by Yoshida and Igarashi (1984) (Figure 1a) and engineering and environmental geological map by Shrestha et al. (1998) (Figure 1b). The later map presents a view of the major sediment sequences for engineering purposes but is yet to be updated with newer geological findings, that is, the continued research into the sediments’ geological age relationships (e.g. Sakai et al., 2016).
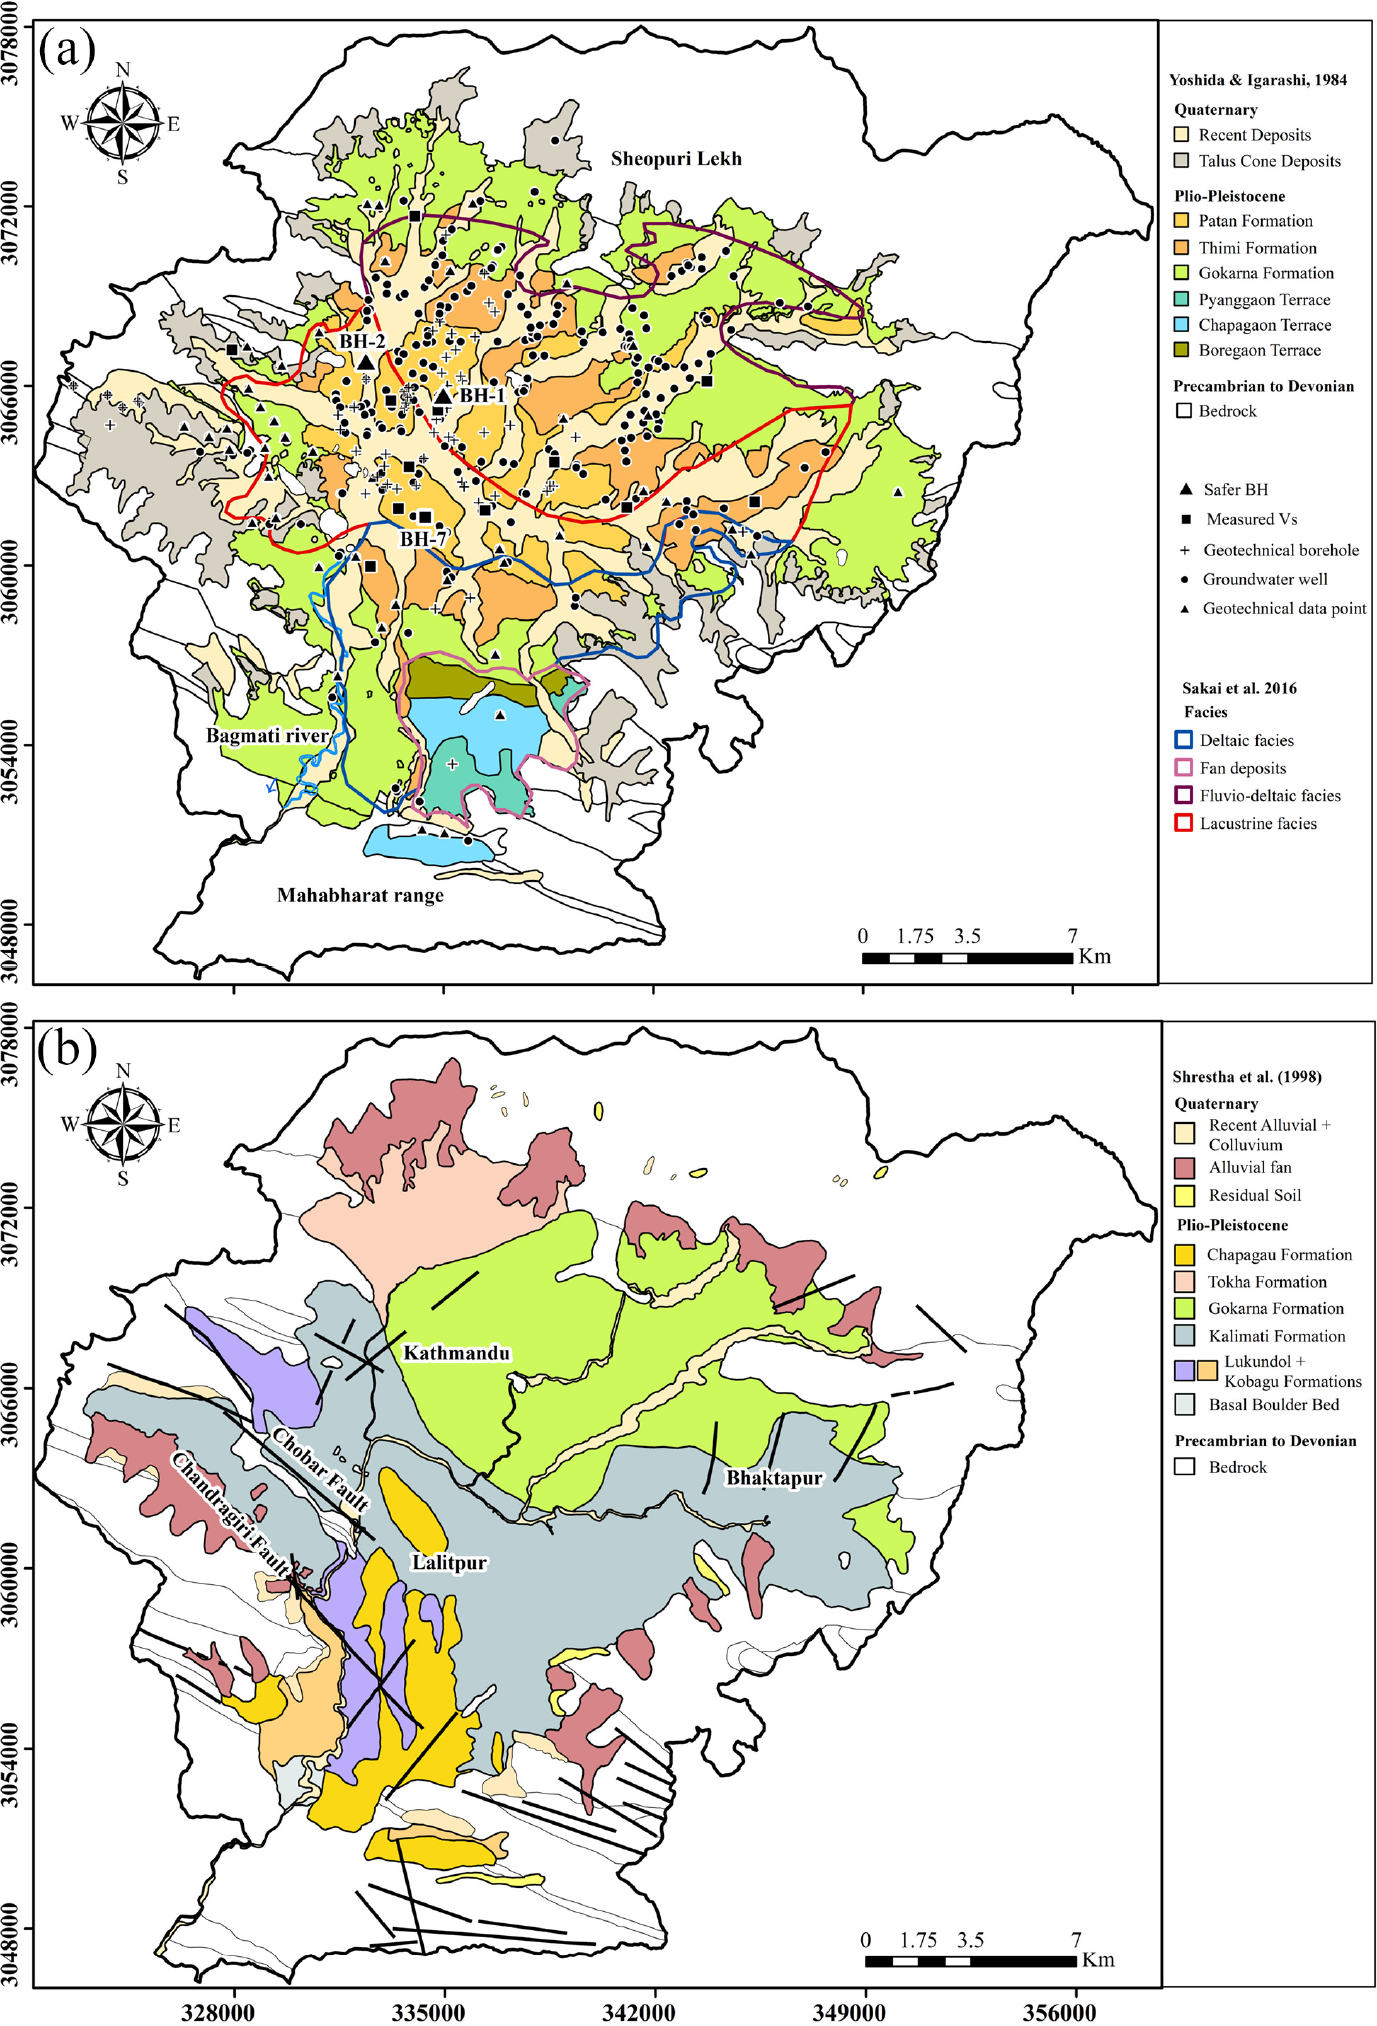
(a) Location of boreholes in SAFER/GEO-591, including groundwater wells and geotechnical boreholes. Geotechnical data points indicate laboratory testing data and locations are approximate. Kathmandu Valley sediments based on geomorphological distribution from Yoshida and Igarashi (1984) with changes to bedrock outcrops based on Shrestha et al. (1998) and Sakai et al. (2008). Facies of sediments from Sakai et al. (2016). The changes by recent authors would indicate the Yoshida and Igarashi (1984) designation of the Thimi and Gokarna Formation in the southern valley is now obsolete (see Figure 1b). (b) Sediment distribution according to Shrestha et al. (1998). As mapping is for engineering purposes, the segregation of some geological units in Figure 1a is not represented. This mapping provides understanding of the distribution of sediments, including the Kalimati, Tokha, and Lukundol Formations (Sakai, 2001; Sakai et al. 2008).
The thickness of these sediments is also uncertain. Moribayashi and Maruo (1980) report the results of a gravity survey estimating a maximum thickness of 650 m; the deepest part corresponding to an area just northeast of Singha Durbar, Central Kathmandu. From records of drilling operations, Katel et al. (1996) present fence diagrams across the Valley from groundwater wells conducted for a water supply project (JICA, 1990). These wells indicate that the maximum thickness of the sediments is 550 m at Bhrikutimandap (just west of the 650-m-thick zone described by the gravity survey). Although core was not recovered during the JICA (1990) project, where core recovery is available, for example, Sakai et al. (2001a), boreholes reveal that the sediments are thick; bedrock is proven at 250 m in Rabibhawan at a western location just beyond both the deepest well and gravity location. Other available geophysical data, such as microtremor observations (e.g. Paudyal et al., 2013), define an upper thickness of approximately 200–250 m for which beyond this “basement topography” it is suggested that the materials would play no major role in amplifying the ground during earthquake motion (Paudyal et al., 2013). The distinction between “engineering bedrock” (i.e. a material that has the geotechnical properties that determine it to be a rock) and the currently determined depth to geological bedrock (where metamorphic sequences are present) is not currently well defined in this region.
Geodatabases
Compilation of geodatabases can help reduce geotechnical uncertainty for design and assessment (cf. Ching and Phoon, 2014; Kulhawy and Mayne, 1990; Roopnarine et al., 2012; Shepheard et al., 2019). A key study Piya (2004) compiled a database of 185 well logs and 328 shallow boreholes to produce a single knowledge base of geological information for the Kathmandu Valley. The records were taken from various organizations for the purpose of preparing a liquefication assessment. This database work has informed much of the work in this region to date. Bhandary et al. (2011) also produced a database, supplementing the Piya (2004) work with further industrial sources; in this case including a total of 700 wells and boreholes. Many of these records are likely from origins that are the same as the work of Piya (2004) and similarly may now overlap in the newly presented SAFER/GEO-591; however, neither of the previous databases have been made openly available to download, so this cannot be confirmed. In response to the clear lack of assembled dataset to describe the geological and geotechnical information of this region, this research aimed to provide improved engineering understanding of the soils and provide information of the velocity structure and depth to the Valley basement. A combined database of ground conditions, in situ and laboratory geotechnical tests, and geophysical tests that were collected during the Engineering and Physical Science Research Council (EPSRC) Seismic Safety and Resilience of Schools in Nepal (SAFER) project are presented. This data article describes the preliminary observations and distributions of the data held within the database, so that the knowledge can be easily accessed for future research purposes.
SAFER/GEO-591 database for the Kathmandu basin
SAFER/GEO-591 database encompasses 591 locations distributed throughout the Kathmandu Valley (Figure 1a). Table 1 presents a summary of the database information. There are 264 shallow boreholes (up to 35 m depth) from consultancy records (45%), 220 groundwater wells (37% of the total), and 107 locations (18%) where geotechnical data are available without borehole logging. These three groups have been represented by a logging quality category: 1, 2, and 3, respectively.
Summary of data included in SAFER/GEO-591
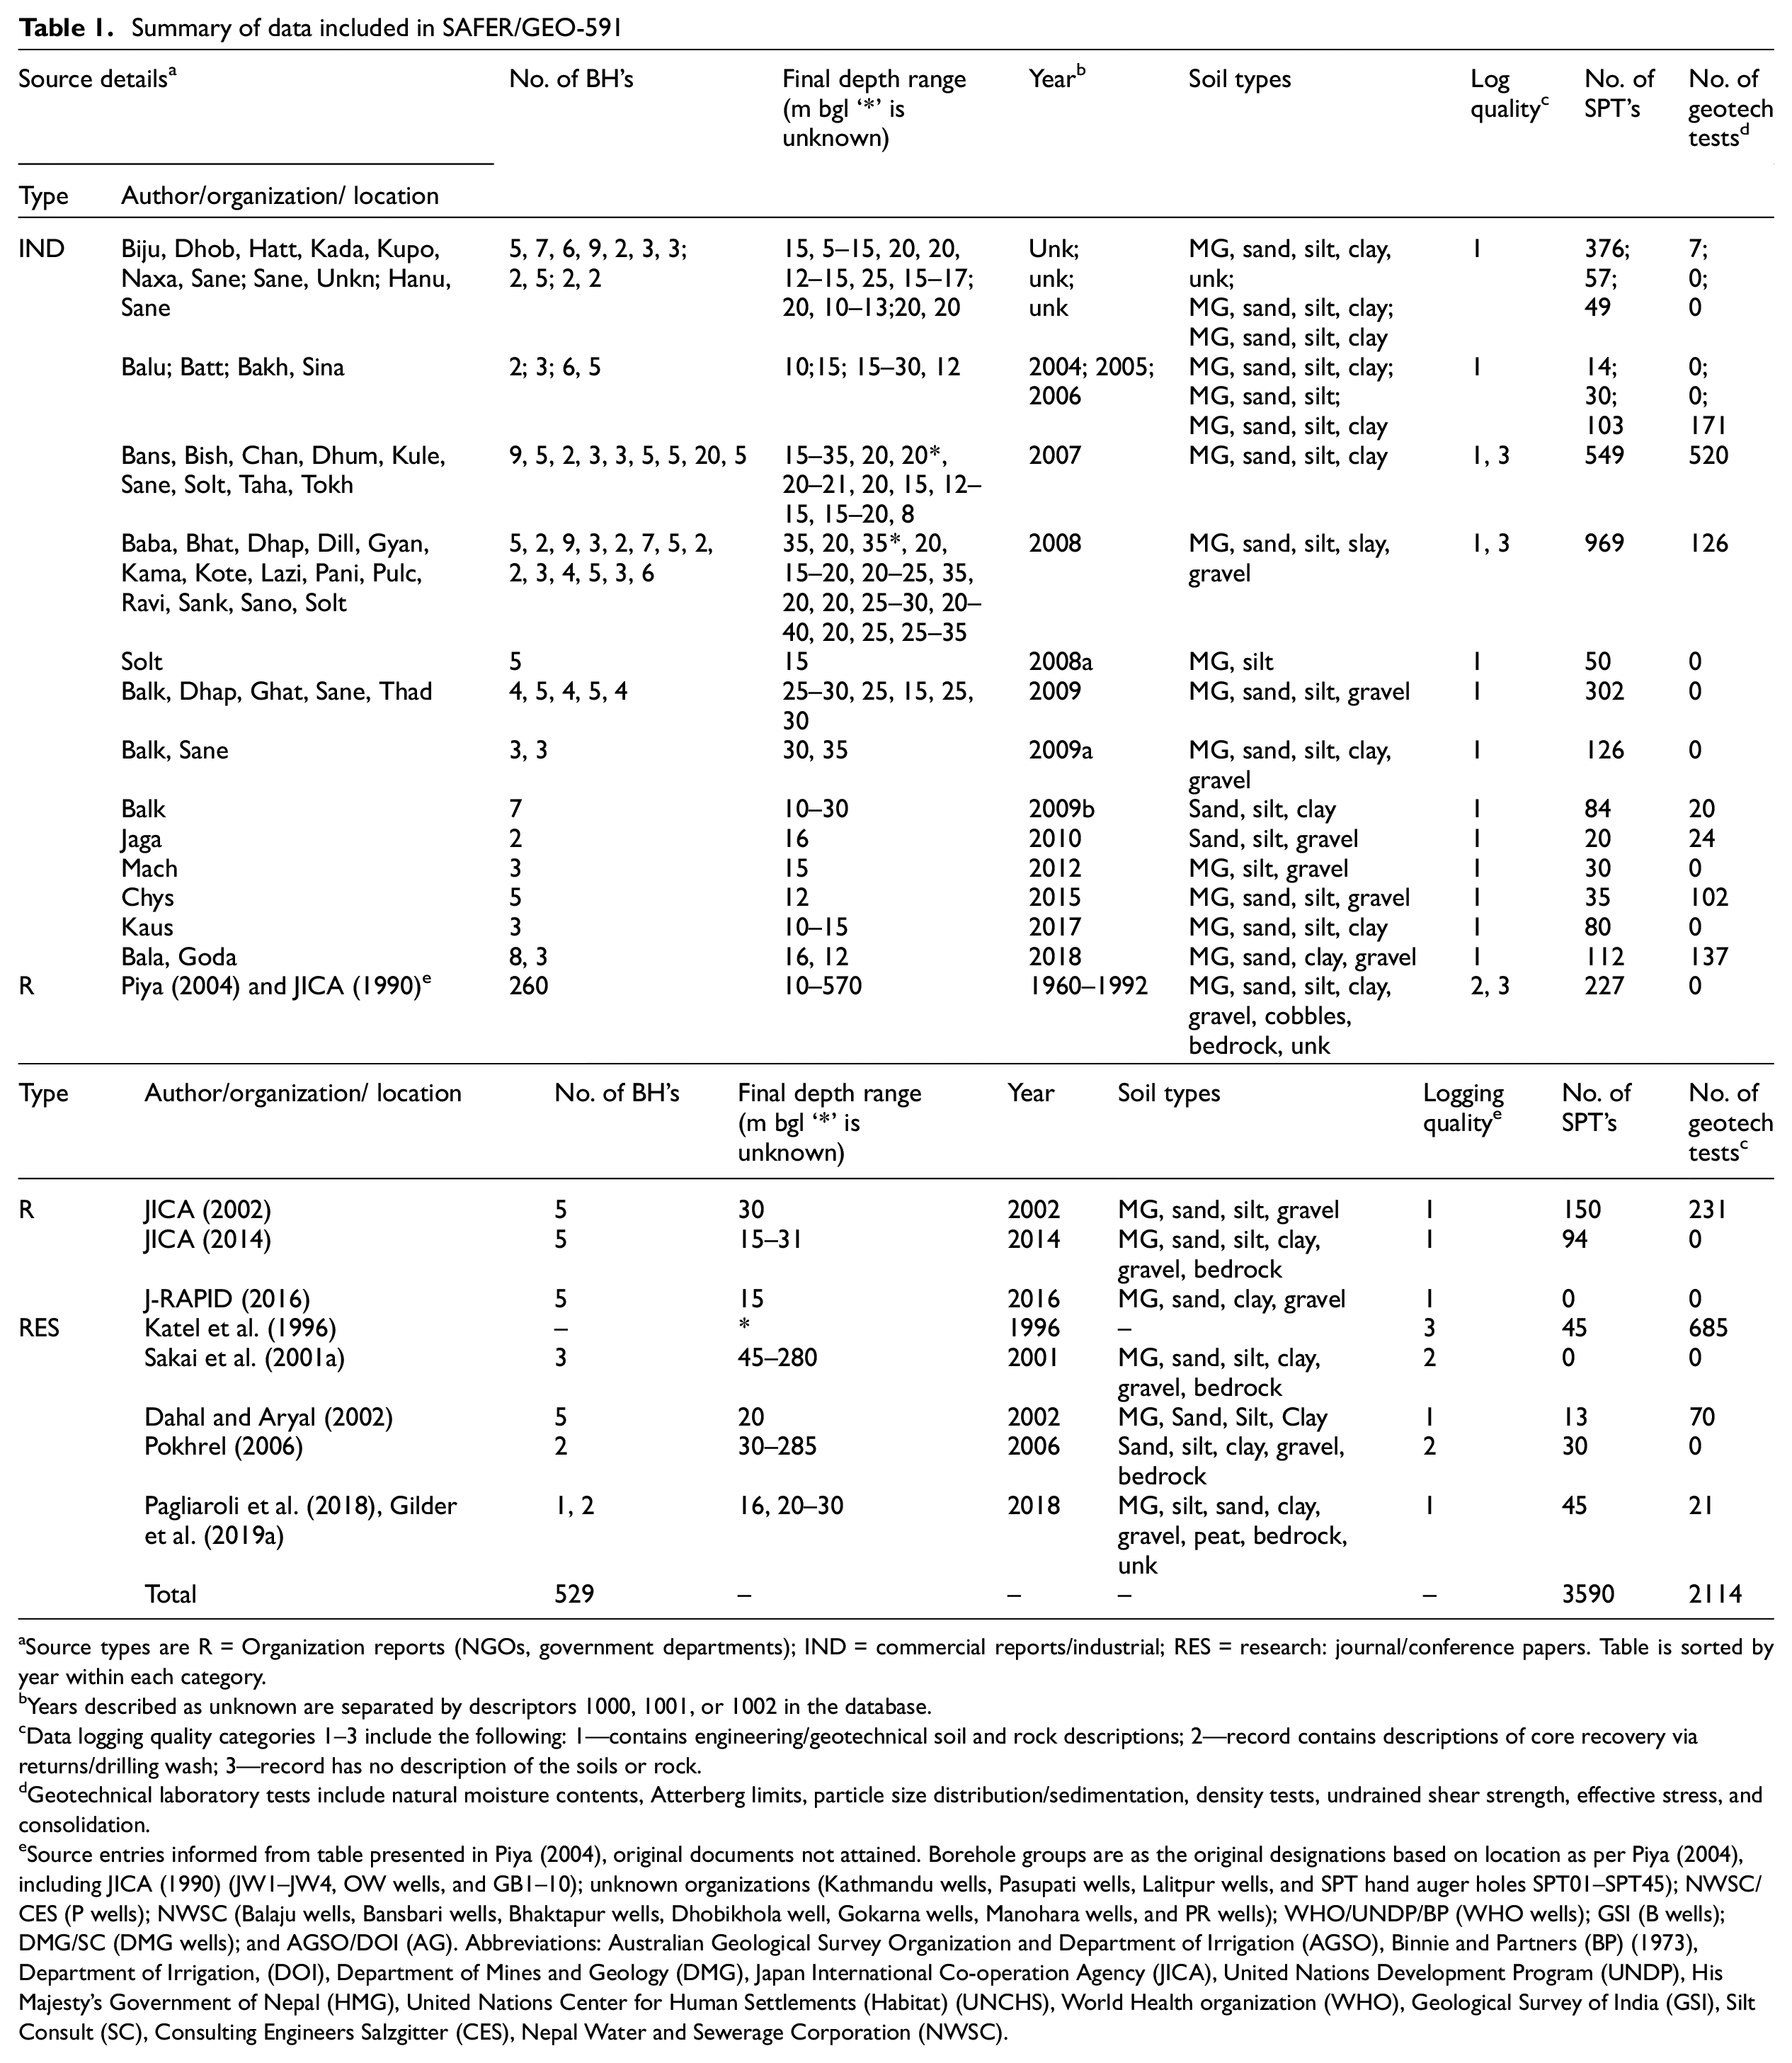
Source types are R = Organization reports (NGOs, government departments); IND = commercial reports/industrial; RES = research: journal/conference papers. Table is sorted by year within each category.
Years described as unknown are separated by descriptors 1000, 1001, or 1002 in the database.
Data logging quality categories 1–3 include the following: 1—contains engineering/geotechnical soil and rock descriptions; 2—record contains descriptions of core recovery via returns/drilling wash; 3—record has no description of the soils or rock.
Geotechnical laboratory tests include natural moisture contents, Atterberg limits, particle size distribution/sedimentation, density tests, undrained shear strength, effective stress, and consolidation.
Source entries informed from table presented in Piya (2004), original documents not attained. Borehole groups are as the original designations based on location as per Piya (2004), including JICA (1990) (JW1–JW4, OW wells, and GB1–10); unknown organizations (Kathmandu wells, Pasupati wells, Lalitpur wells, and SPT hand auger holes SPT01–SPT45); NWSC/CES (P wells); NWSC (Balaju wells, Bansbari wells, Bhaktapur wells, Dhobikhola well, Gokarna wells, Manohara wells, and PR wells); WHO/UNDP/BP (WHO wells); GSI (B wells); DMG/SC (DMG wells); and AGSO/DOI (AG). Abbreviations: Australian Geological Survey Organization and Department of Irrigation (AGSO), Binnie and Partners (BP) (1973), Department of Irrigation, (DOI), Department of Mines and Geology (DMG), Japan International Co-operation Agency (JICA), United Nations Development Program (UNDP), His Majesty’s Government of Nepal (HMG), United Nations Center for Human Settlements (Habitat) (UNCHS), World Health organization (WHO), Geological Survey of India (GSI), Silt Consult (SC), Consulting Engineers Salzgitter (CES), Nepal Water and Sewerage Corporation (NWSC).
All database entries are assigned a unique identifier based on the source type, that is, from a report (R), industrial (IND), or research (RES); followed by a four-digit code describing the authors/organization or location; followed by the year, the data were collected; and finally, a unique borehole identifier. The industrial data sources in SAFER/GEO-591 contain geotechnical information with corresponding SPT-N and groundwater levels. The groundwater wells, (from Piya, 2004 and also available in the JICA, 1990 data book), provide the majority of the deep information, so are informative of the basin structure. The database contains 83 boreholes with associated geotechnical laboratory testing. The database structure is based on the Association of Geotechnical and Geoenvironmental Specialists (AGS) file structure known as the AGS Format (AGS, 2017). This structure enables borehole records to be split into field headings, set up as four-letter group names (e.g. “LOCA” for location details or “GEOL” for geology descriptions). This structure enables all meta-data within each category to be well defined and compliant with data formatting requirements. Further information of the chosen structure, the data harmonization, and quality/adherence to geotechnical standards are provided within the database manual provided with the dataset (Gilder et al., 2019c).
Geotechnical and geophysical data
In Kathmandu as part of the EPSRC SAFER project, two boreholes were drilled during April 2018 to produce new measurements (see Gilder et al., 2019a; Pokhrel et al., 2019). The boreholes were drilled using rotary open-hole boring methods, with recovery limited to the SPT split spoon. BH-1 was set within the grounds of an existing school in Dillibazar, located centrally in Kathmandu city and BH-2 was located in Bijeshwori, in the northwest of the Valley (see Figure 1a: BH-1 and BH-2). The supplementary data for this site investigation are provided at Gilder et al. (2019b). In addition to geotechnical investigation, direct downhole seismic testing was used to measure VS at BH-1 (Gilder et al. 2019b), and at BH-2, microtremor HVSR methods were used (Pokhrel et al., 2019). BH-2 encountered a meta-sandstone deposit at just 10.85 m depth, and final interpretation of whether this constituted the sediment/bedrock boundary (or a boulder) was uncertain due to poor recovery.
The assembled database contains a total of 18 VS profiles from direct downhole testing (Figure 2). From these data, a total of 12 directly measured VS30 values are calculated and a further six inferred (where acquisition did not reach 30 m depth and estimation is using Boore (2004)). These VS30 data are analyzed in a companion article using Bayesian kriging to present an updated VS30 map across the Valley (De Risi et al., 2019). Supplemental Table A1 tabulates these data. Of note is the profile presented by Pokhrel (2006; see location in Figure 1a: BH7), which extends to 88 m depth within the Valley sediments. This is the deepest known velocity profile in the Valley and indicates that the VS does not increase much above 300 m/s across this approximately 90 m thickness. Of the available VS profiles in Figure 2, the majority are not above 300 m/s in the upper 30 m, with an average value of 215 m/s and maximum of 625 m/s.
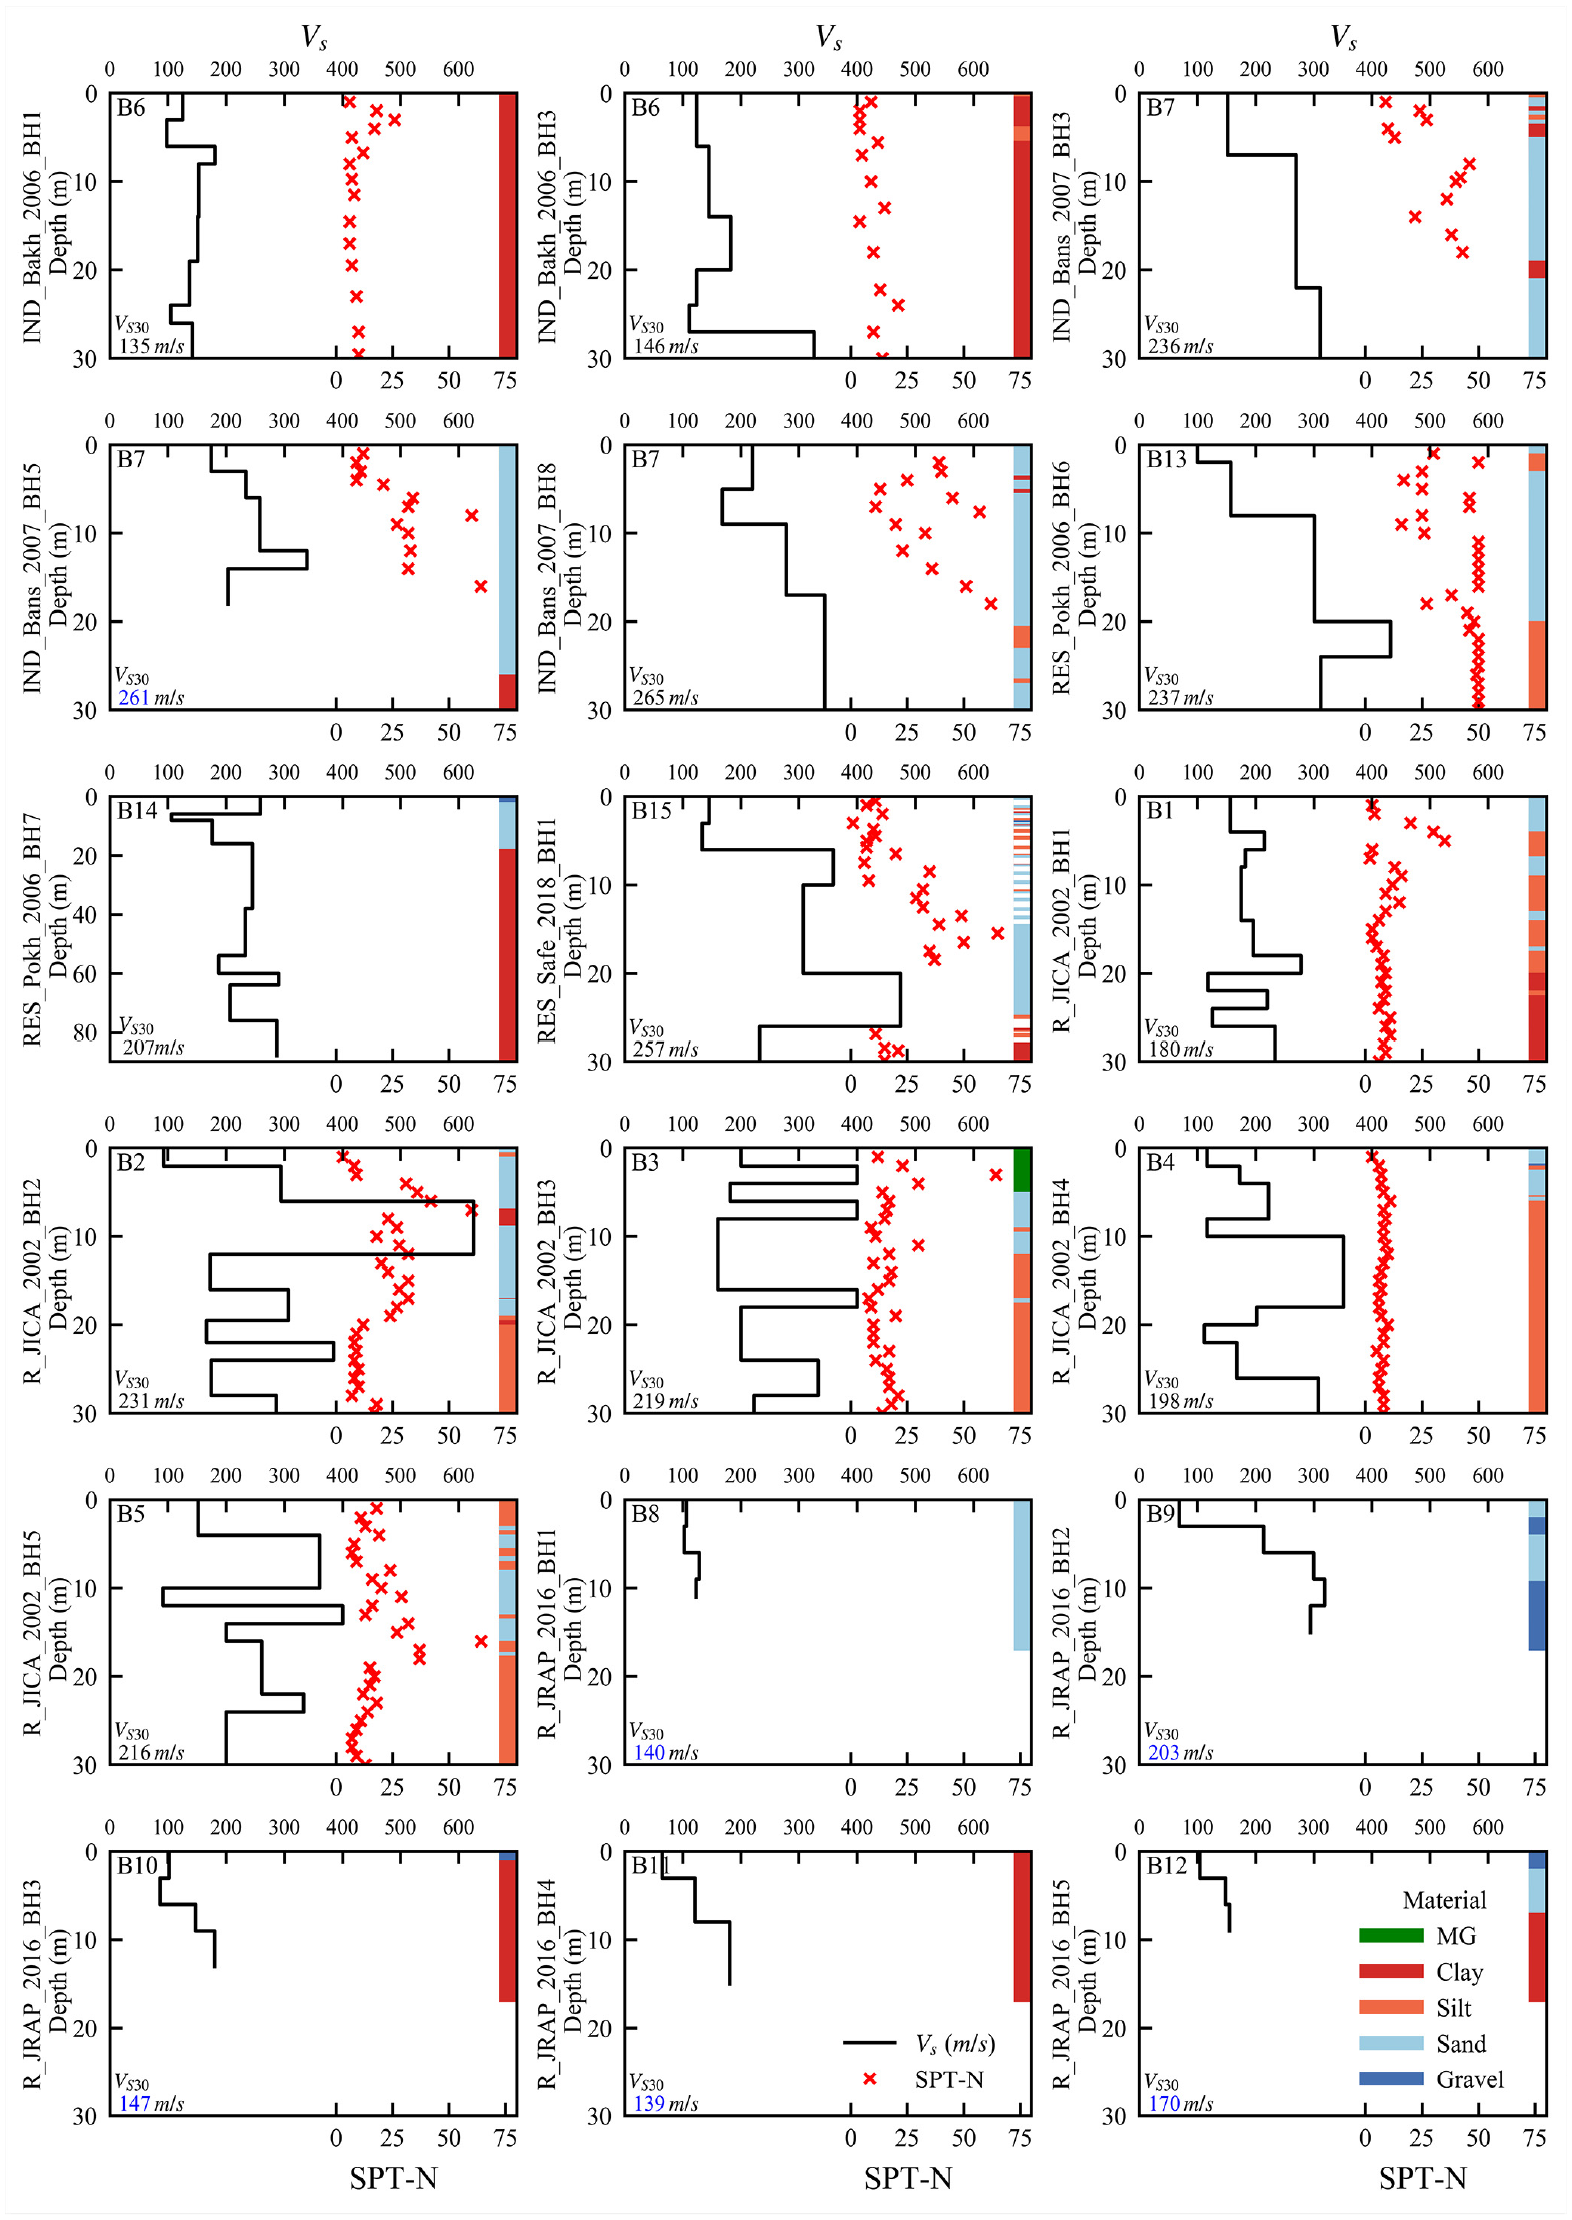
Downhole seismic shear-wave data for the Kathmandu Valley. Simplified borehole logs are presented according to dominant materials types Made Ground (MG), sand, clay, silt, and gravel. BH-ID’s are in the database format, source type, authors/organization or location, year, and borehole identifier. ID’s in left-hand top corner correspond to map locations in De Risi et al. (2019). VS30 values calculated according to Eurocode 8 (CEN, 2004), from geophysical intervals as recommended for direct downhole seismic described in Kim et al. (2004). Inferred values (blue) are corrected using Boore (2004). Where 9 m depth was reached regression co-efficient for 10 m was used.
The geotechnical data are found to display an interesting set of patterns when presented by elevation (m above mean sea level; Figure 3). This is reflecting the way the sediments enter stepwise into the Valley (schematically the terraces can be understood by referring to the Sakai (2001) cross section). This can be compared to the plot by depth (see Supplemental Figure A1), which provides a limited indication of spatial changes due to the considerable changes in topography within this relatively small study area.
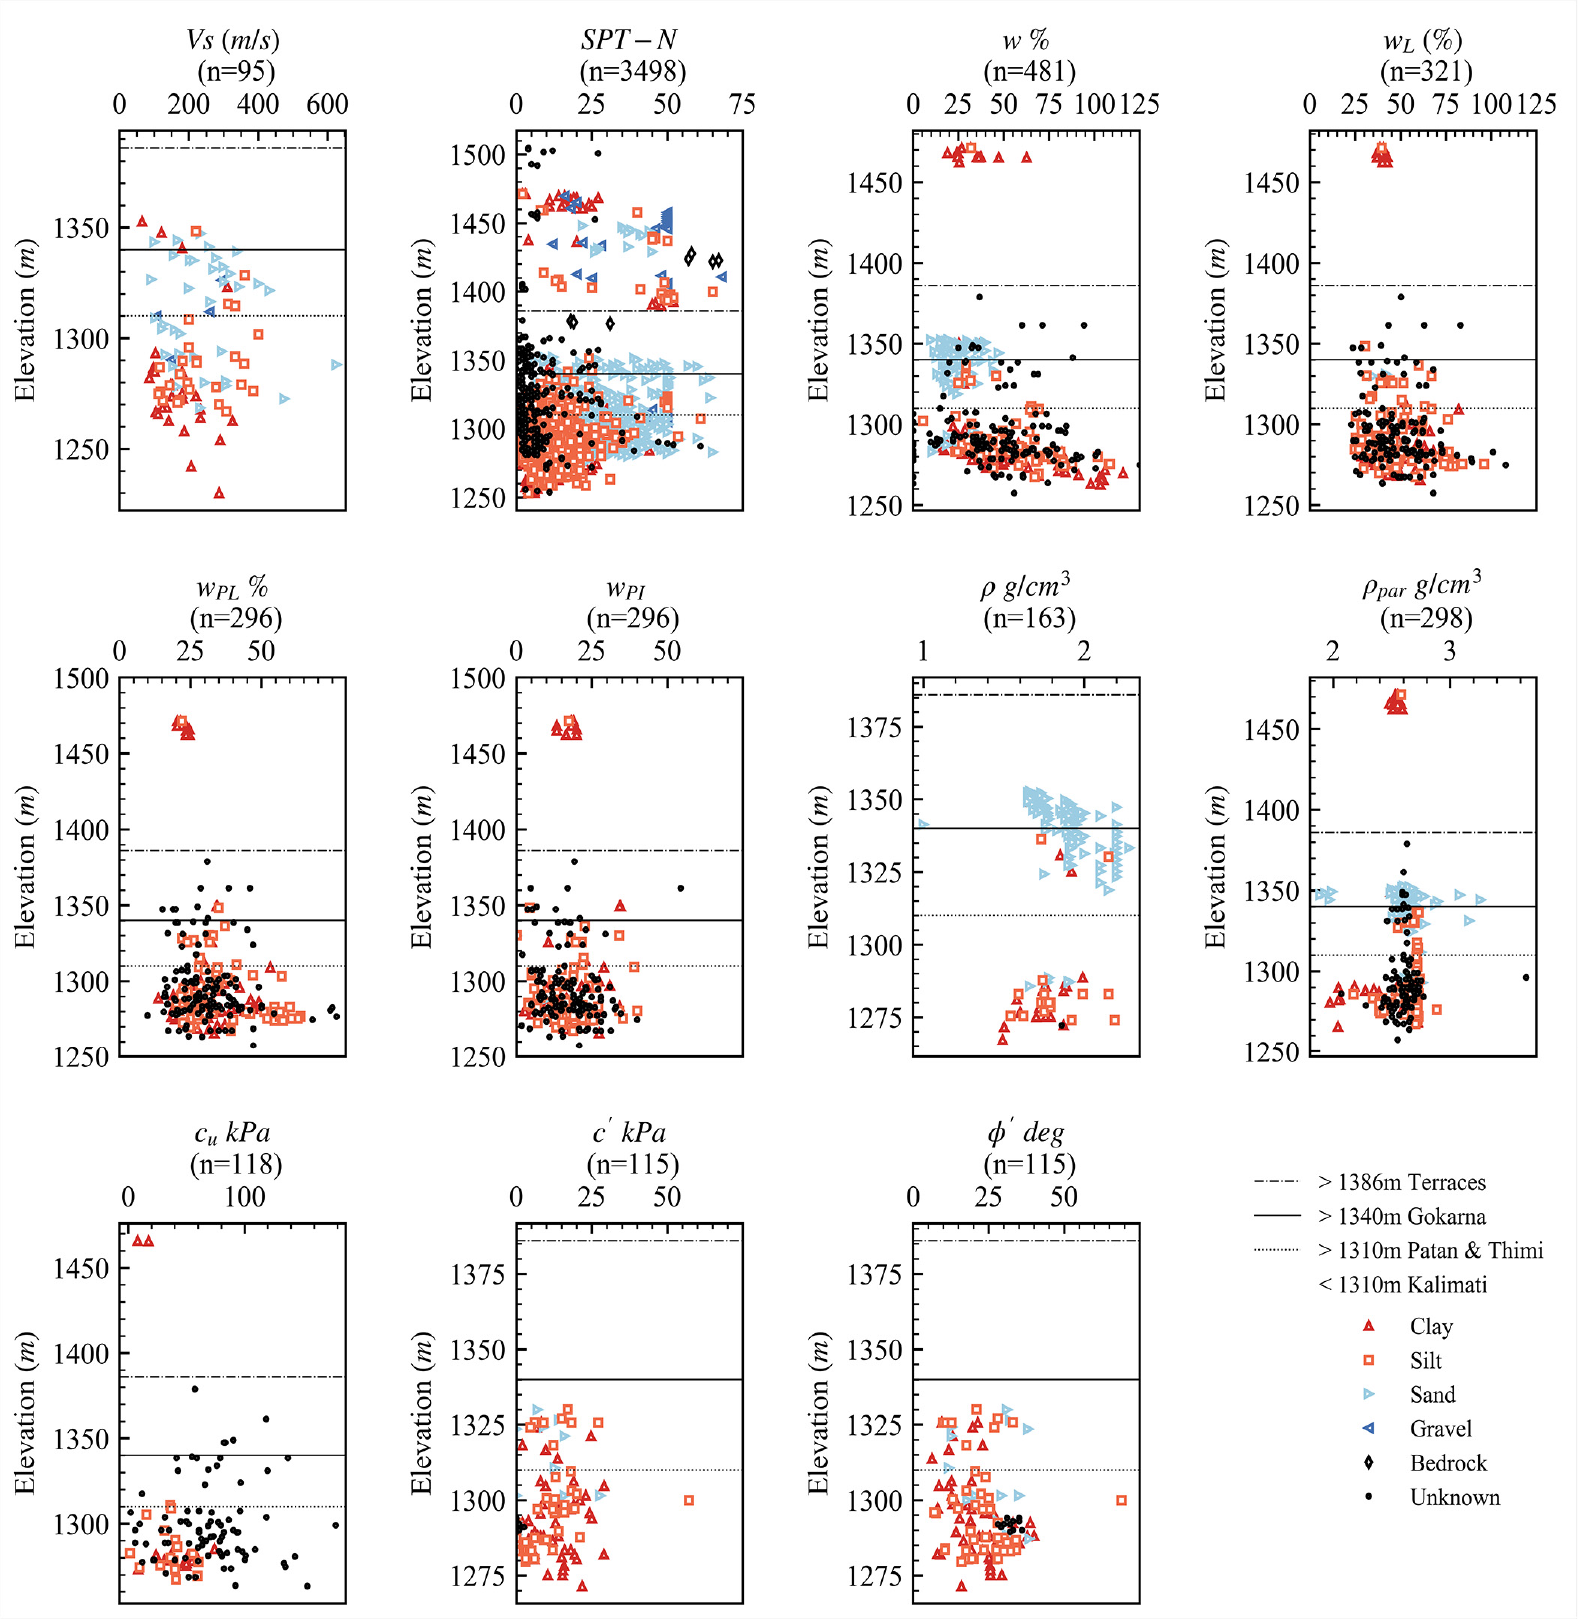
Database geotechnical parameters with elevation (m above mean sea level) separated for material type. Values in Made Ground and at unknown locations are not presented. Elevation categories informed from cross section by Sakai (2001) represented using horizontal lines.
When studying Figure 3 closely, possible groupings of the geotechnical data with the sediment levels provided by Sakai (2001) can be established. As further data become available, these terrace divisions could be divided into further geotechnically significant sub-categories. However, within the current grouping, in the upper portions (elevations >1340 m), the data are generally gravel and sands with minor silts and clays (the latter mostly likely soils resulting from in situ weathered bedrock), which agrees with that expected from a proximal deposit in a fluvio-deltaic system (i.e. the Gokarna Formation) or upper terraces. The data within this elevation category can be conveniently selected to be representative of these soils. At the lower topographies, and increasing distance to the center of the Valley, there is an occurrence of sands which are forming a number of discrete lenses, before becoming a more concentrated region of data at approximately 1280–1310 m (this can be seen particularly in the SPT results Supplemental Figure A2). These properties can be assumed to be representative of the Patan and Thimi Formations using elevation within the Valley as a proxy. Below 1310 m, there becomes a dominance of clay and silt deposits and a clay-dominated layer below 1265 m (Supplemental Figure A2). Below 1310 m, the deposits have undrained shear strength values (database field TRIG_CU) of not more than 50 kPa where the material type is confirmed by logging in the database (Figure 3). In addition, in this elevation zone, the natural moisture content values (LNMC_MC) are the highest in the database (up to approximately 125%) confirming geotechnically the materials’ high-organic content. These deposits likely represent the organic silts and clays of the Kalimati Formation. Elevation can provide means to separate deposits with similar properties in the Valley, where the mapping of the region and allocation of geological age are uncertain.
VS correlations are commonly used for engineering seismology applications and used in data-poor regions where site-specific data are not available. It is known that correlations can generally be greatly improved if measurements are separated by depth, geological age, and soil type (Wair et al., 2012). When this was attempted with SAFER/GEO-591, no regional correlations for VS could be developed using the database (see Supplemental Figure A3). As an alternative resource, Supplemental Table A2 provides the summary statistics for all geotechnical parameters in the database, for the dominant soil types, in the above selected elevation ranges. Further data are available in the database, where the soil type corresponding to the test is not confirmed, but general ranges can be sort. Table 2 provides the summary statistics of the VS data which are of interest. These values (mean values and standard deviations) can be useful for designers and those wishing to model the basin response both deterministically and stochastically. Figure 4 shows the Casagrande chart (Casagrande, 1947) of all cohesive soils present in the database. This indicates that the majority of the fine-grained soils tend to be silts rather than clays. It is expected that a lot of the current database, where logging has been of quality designation rated 1 or 2, have used the general description of a fine-grained material as a clay, when the material would, if tested, have been classified geotechnically as a silt. This is a significant information to those researching liquefaction, as low plasticity silts are known to be generally more susceptible to earthquake motion (e.g. Bray and Sancio, 2006).
VS by elevation
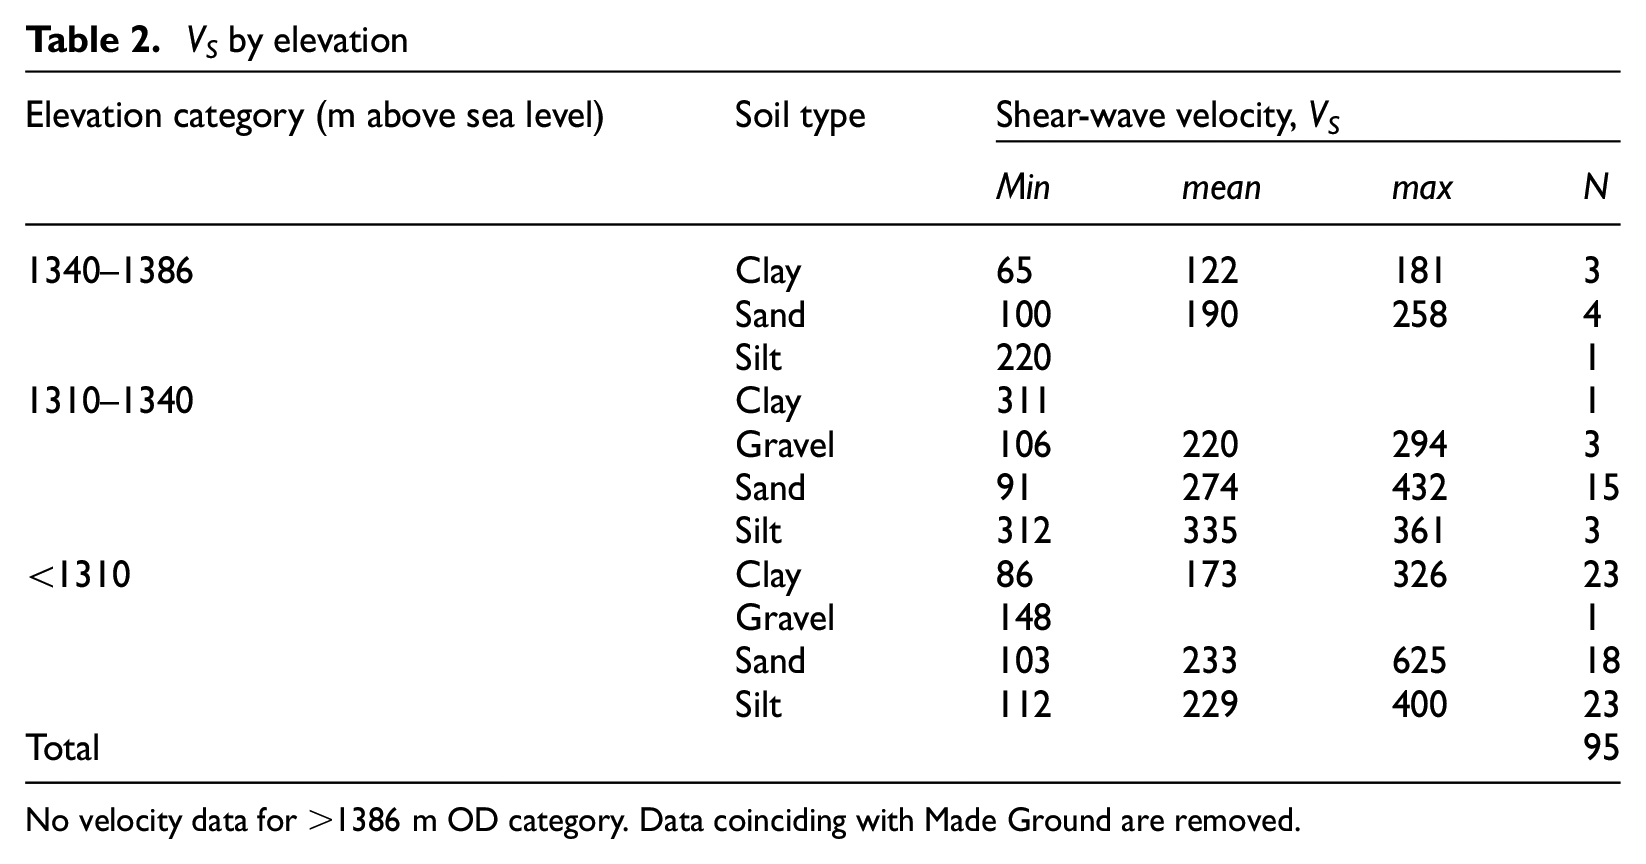
No velocity data for >1386 m OD category. Data coinciding with Made Ground are removed.
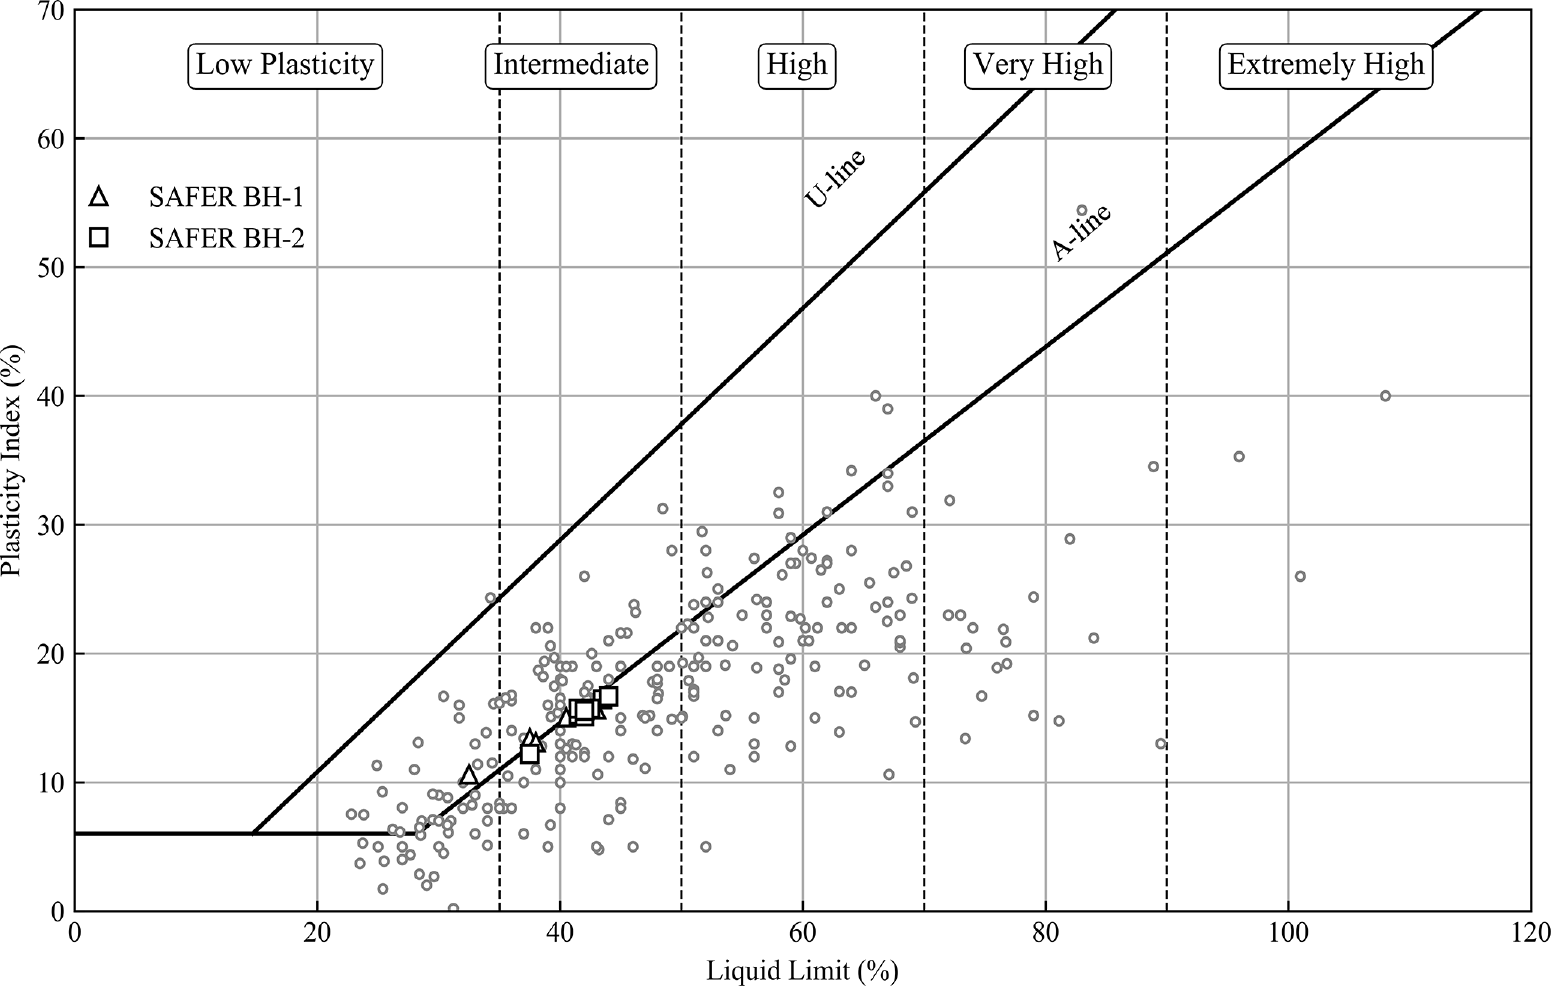
Fine-grained soils plotted on the Casagrande chart based on Casagrande (1947); Howard, (1984); BS 5930:2015 (2015).
Basin topography
A third aim of the research was to present an updated representation of the sediment/bedrock topography. The Valley spans approximately 25 km east to west and 20 km north to south. It has been stressed previously by various authors that this region would need considerably higher quality data for 2D and 3D advanced simulations for soil amplification than is currently available (e.g. Asimaki et al., 2017; Ayoubi et al., 2018; Bijukchhen, 2018). Even with the newly compiled database, the information is sparse, and therefore, it was considered the SAFER/GEO-591 database alone could not fully describe the variability of the “basement” boundary.
In the recent years, researchers have sought to find a representative ground model for seismic simulation purposes. Bijukchhen (2018) introduced a velocity model structure of the basin to perform 1D site response analysis (Bijukchhen et al., 2017), defining five sediment layers assigning VS values between 200–500 m/s, also 700 m/s for weathered rock and 3200 m/s for the bedrock base. This was based on the JICA (2002) VS measurements and above-mentioned maps. From the previous database work, Piya et al. (2004) defined four layers within the sediments which represented different stages of lake extension, that is, post lake, lake, and pre-lake, and provided a boundary representing the depth to bedrock. Okamura et al. (2015) produced sections using the Bhandary et al. (2011) database showing the engineering soil type and layer thickness changed within short distances. Both studies indicated that the stratigraphic relationships between the sediments are complex. The 3D structure of the sediments is also described by a schematic cross section from Sakai (2001), which splits the central structure of the basin into five parts using the Sakai et al. (2001a) core recovered borehole. This schematic has been used to inform site response studies (e.g. Asimaki et al., 2017; Pagliaroli et al., 2018). Bijukchhen (2018) presents cross sections but showing differing orientations to Sakai (2001) that describe the large variation that exist across the Valley. One section line in Bijukchhen (2018) shows the bedrock is intersecting the ground level due to faulting running northwest to southeast across the Valley. Sakai (2001) indicates five similarly orientated faults, north of the confirmed Chandragiri and Chobar faults (see Figure 1b). However, to the authors’ knowledge, it is not confirmed if this is through mapping evidence or inference from the outcrop occurrences. Due to the now densely populated area that they underlie, mapping would be near impossible, and so the reason for the bedrock presence at the surface remains arguable.
3D modeling
Using the database, the previous 3D modeling work was re-visited. The purpose was to provide the results of this analysis alongside the database as ArcGIS raster files. The aim was to provide the best possible 3D surface of the sediment/bedrock boundary from the information available. The selected methodology for producing the model surface is shown in Figure 5 and the results are provided in Figure 6. First, the Bedrock Elevation model (b-model) was developed using the ArcGIS “Topo to raster” tool using only the SAFER/GEO-591 database (result in Figure 6b). This identified two depressions in Central Kathmandu and one further depression in Lalitpur. From existing gravity data of Moribayahi and Maruo (1980), these depressions are known to be joined, see digitized gravity survey (g-model) in Figure 6c. Therefore, the gravity model was used to extend the previous b-model, where bedrock had not been proven, to provide an enhanced distribution of depth (by the methodology shown in Figure 5b). This could only be applied to boreholes that coincided with the gravity survey extent as shown in Figure 6c and d. The points on Figure 6d are calculated by taking the elevation of the bedrock proven by the boreholes minus the elevation indicated by the gravity survey. For example, a borehole proving bedrock at 1220 m above mean sea level taken from a corresponding implied level of 1160 m from the gravity survey results in a difference of 60 m. Therefore, positive values on Figure 6d indicate the gravity survey is overestimating the depth to the bedrock boundary. The raster of the corrected gravity shape (Figure 6d) extrapolated from the proven bedrock boreholes was used to assign new depths to any boreholes which contained deep sediments. This extended the area of the depressions in model-b and produced a combined surface as shown in Figure 6e named model b + g. This new model evaluates the elevation of the bedrock boundary as best as is possible within the bounds of extrapolation of the geophysical data. At location BH-2, the model b + g is not providing any indication of bedrock elevation (i.e. white area in Figure 6e). However, the trend of the model suggests a bedrock depth between 65 m and 0; this is in line with the results of BH-2 (see section Geotechnical and geophysical data).
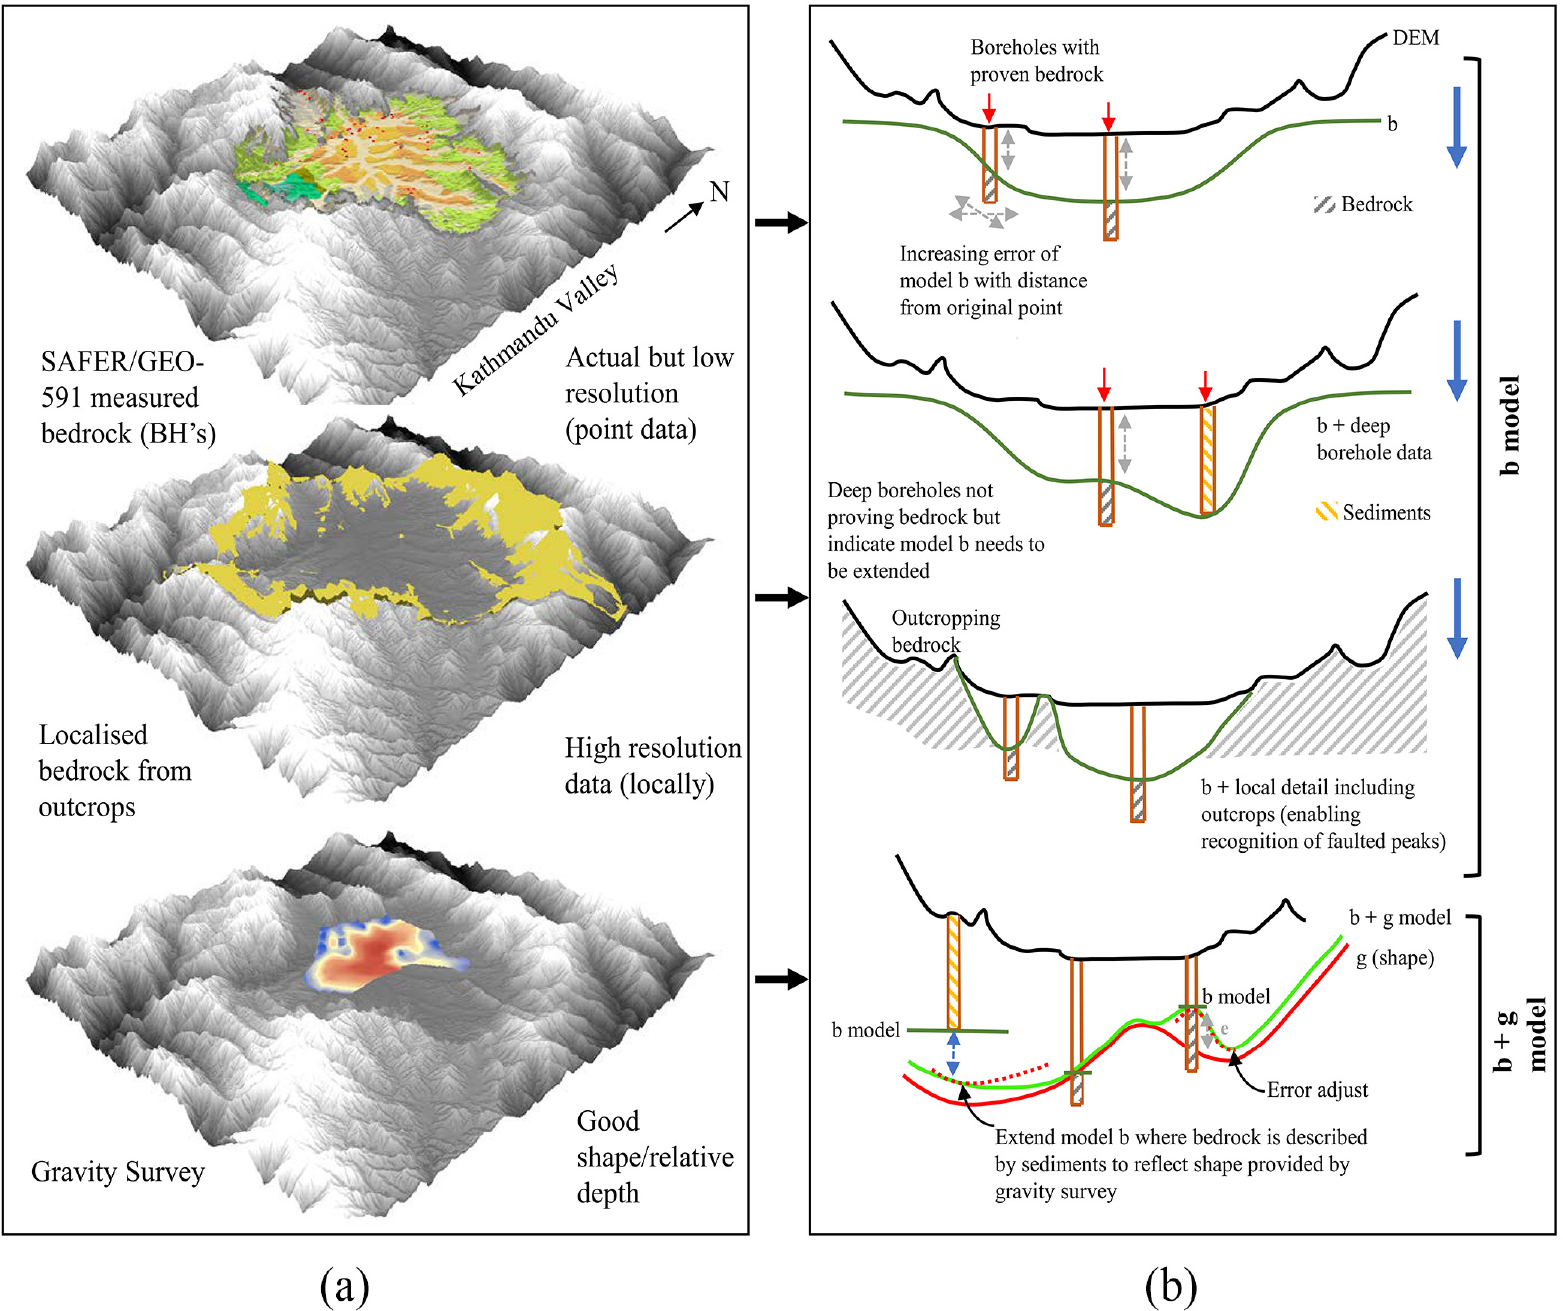
(a) 3D representation of the existing data sources. (b) Schematic of 3D model development. The bedrock elevation model (b-model) combines the database boreholes which reached bedrock (52 locations), the elevation of the inner outcrops, the sediment/bedrock edge which encompasses the Valley, and the lowest 25% of the database borehole data (by elevation) resulting in 96 points where the sediments have been proven to be at least a minimum of 153 m and maximum of 457.2 m below the ground surface (but bedrock depth has not been proven). The bedrock elevation model (b-model) combined with the gravity survey of Moribayashi and Maruo (1980) is described as the (b + g model).
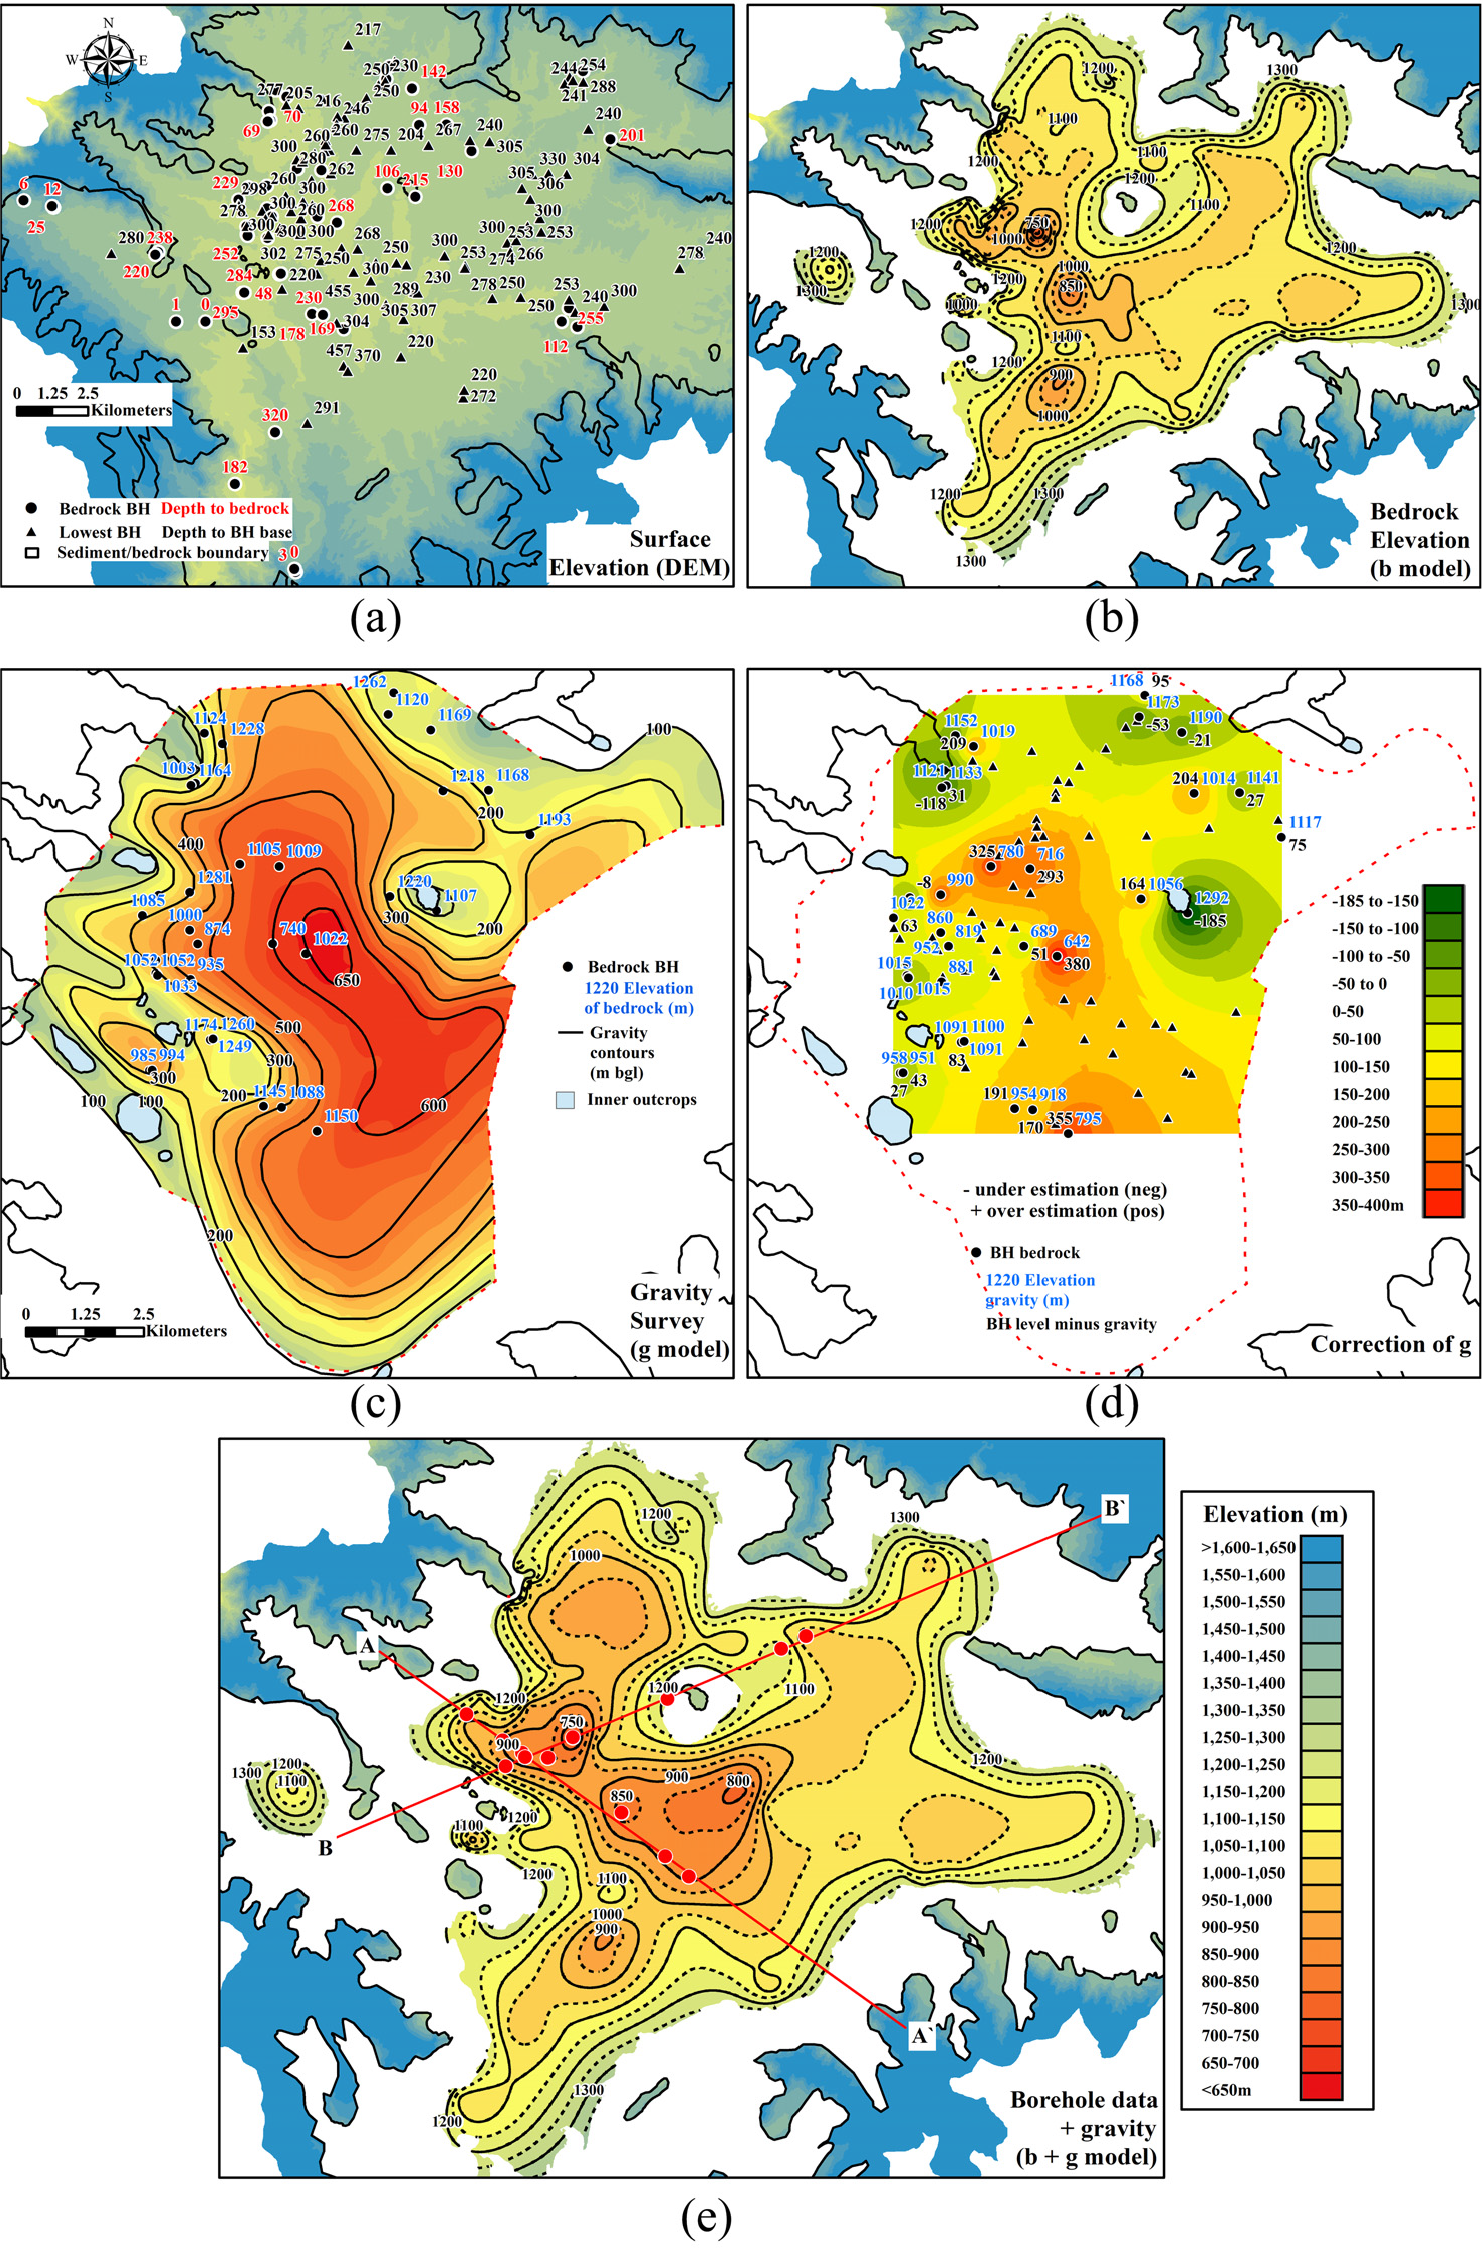
(a) Boreholes from SAFER/GEO-591 that proved bedrock (red) and the lowest 25% of boreholes by elevation (black).(b) Model of elevation of bedrock informed by boreholes and outcrop information only. (c) Microgravity survey represented from Moribayashi and Maruo (1980). (d) Representation of the difference calculated between borehole bedrock elevation and gravity survey elevation. (e) Elevation of bedrock level informed from SAFER/GEO-591 and adjusted depths of the 25% lowest boreholes of the database using the corrected gravity values shown in (d).
New geological cross sections
The Kathmandu Valley has been mapped by authors combining differing nomenclature (Sakai et al., 2008; Shrestha and et al, 1998; Yoshida and Gautam, 1988). A combination of knowledge available from both maps shown in Figure 1a and b (undertaken in a similar manner as Dhital, 2015: 450) informed the inferred sediment distributions shown in the two schematic geological sections prepared along A-A′ and B-B′ (Figure 7). Section A-A′ is indicating a similar sequence to that shown by Sakai (2001), but is crossing the Valley extending approximately NW-SE. Section B-B′ provides a SW–NE cross section and the position has been selected to indicate an example of where the basement rock is appearing at the surface. This indicates an entirely different sediment/bedrock topography beneath the Kathmandu Valley.
(a) Yoshida and Gautam (1988) digitized map. (b) Shrestha et al. (1998) digitized map. (c) Cross section A-A′ (top), cross section B-B′ (bottom).
The gravity model of Moribayahi and Maruo (1980) is shown on the cross sections for comparison with the developed b-model and b + g model, shown as dashed red, dark green, and light green lines, respectively. As well as the microtremor result from Paudyal et al. (2013) in blue.
The b + g model (light green model) can be considered the best possible representation of the bedrock level. This model is provided as a function of depth in Supplemental Figure A4. There remains areas of error around the edges of this model; where the white space separates the model and the digital elevation model (DEM) shown in blue in Figure 6e. This is where the lack of information is causing the model to rise above the ground level so the boundary was removed. Also, possible depressions not covered by the gravity survey cannot be corrected with the current data availability. In Bhaktapur, for instance, from damage data and previous studies (Goda et al., 2015; Bijukchhen, 2018), it is expected that the depression may extend to much greater depths, but there is a lack of borehole information to corroborate this. In section B-B’ an effect of data scarcity can be seen in the northeastern side of the central depression. In addition, if the geology is in-fact faulted, it would certainly provide an abrupt shape rather than the smooth boundary as presented. There remains a trade-off between considering the dominant shape of the sediment/bedrock boundary; whether it is characterized by faulting or erosion during the infill of the sediments. In either case, it is expected that the sediment/bedrock boundary is very steep sided beneath the sediment surface and the hydrological modeling undertaken to date does not characterize this well; although these results proved more realistic than when using other interpolation methods, such as Kriging.
Some boreholes are showing to improve on the gravity model, for example, R_JICA_1990_B4 in section B-B’ shows the sediments are extending to below that described by the gravity survey. However, the groundwater wells used to derive the bedrock boundary do not provide soil strengths and data for lithostratigraphic division are not well defined. As suggested previously, it is possible that the sediments may exhibit strengths attributable to rock (and therefore not attribute to local site amplification) at much shallower depths than are indicated by the current model. The microtremor data (Paudyal et al., 2013), when compared to the borehole records, appear to represent the boundary between the Kalimati Formation (the homogeneous silt deposit) and any other underlying sequence. This reflects the microtremor methods apparent ability to identify the first large impedance contrast of a profile. The cross sections facilitate the comparison of the current models highlighting the importance of including all previous information into the ground model. For such a complex environment having geotechnical information only up to 35 m depth is a challenge; the cross sections reveal that still very little is known of the vast proportion of the sediments.
Further studies are needed to determine the boundary in the sediments where seismic amplification is no longer exhibited, and this is also suggested by Paudyal et al. (2013). The region could benefit from undertaking of few, deep, high-quality geotechnical boreholes to confirm the assumptions of the models presented in this study. In the interim, these models and inferences can be used at the discretion of the modeler wishing to undertake seismic 2D and 3D simulations.
Conclusions
This article presents a geodatabase for the Kathmandu Valley SAFER/GEO-591. The database is a processed, harmonized assembly of past published borehole records integrated with industrial data and newly drilled boreholes. The key findings are as follows:
While a large number of boreholes are available for the Kathmandu basin, direct shear-wave measurements (downhole) are still scarce. The quality of the available boreholes is highly variable. To better understand engineering properties at the surface and at depth further extensive investigation is needed.
A 3D model of the sediment/bedrock boundary and two new schematic geological cross sections have been presented based on the information in the database. While the metamorphic bedrock still cannot be properly characterized using the database, a methodology is presented to link this with previous geophysical knowledge.
While SAFER/GEO-591 presents a large amount of new and historic data, most of the available mechanical, physical, and index measurements relate to the top 35 m of the basin sediments. This is understandable as most data were originally collected for construction purposes. However, for 3D modeling of the basin, for purposes of seismic hazard, more data are needed.
Supplemental Material
Appendix_A – Supplemental material for The SAFER geodatabase for the Kathmandu Valley: Geotechnical and geological variability
Supplemental material, Appendix_A for The SAFER geodatabase for the Kathmandu Valley: Geotechnical and geological variability by Charlotte EL Gilder, Rama Mohan Pokhrel, Paul J Vardanega, Flavia De Luca, Raffaele De Risi, Maximilian J Werner, Domniki Asimaki, Prem Nath Maskey and Anastasios Sextos in Earthquake Spectra
Supplemental Material
Appendix_B – Supplemental material for The SAFER geodatabase for the Kathmandu Valley: Geotechnical and geological variability
Supplemental material, Appendix_B for The SAFER geodatabase for the Kathmandu Valley: Geotechnical and geological variability by Charlotte EL Gilder, Rama Mohan Pokhrel, Paul J Vardanega, Flavia De Luca, Raffaele De Risi, Maximilian J Werner, Domniki Asimaki, Prem Nath Maskey and Anastasios Sextos in Earthquake Spectra
Footnotes
Acknowledgements
The authors acknowledge the Engineering and Physical Science Research Council (EPSRC) project “Seismic Safety and Resilience of Schools in Nepal” SAFER (EP/P028926/1). The first author acknowledges the support of EPSRC (EP/R51245X/1). The database SAFER-GEO-591_v1.1 is used to produce all figures and tables in this publication. This is available for download from the University of Bristol Data Repository (Gilder et al., 2019c). In electronic Appendix A, additional figures and tables are provided; in electronic Appendix B the raster files of model b + g are included in two formats (depth or elevation).
Declaration of conflicting interests
The author(s) declared no potential conflicts of interest with respect to the research, authorship, and/or publication of this article.
Funding
The author(s) disclosed receipt of the following financial support for the research, authorship, and/or publication of this article: Engineering and Physical Science Research Council (EPSRC) Grant codes: EP/P028926/1; EP/R51245X/1.
Supplemental Material
Supplemental material for this article is available online.
References
Supplementary Material
Please find the following supplemental material available below.
For Open Access articles published under a Creative Commons License, all supplemental material carries the same license as the article it is associated with.
For non-Open Access articles published, all supplemental material carries a non-exclusive license, and permission requests for re-use of supplemental material or any part of supplemental material shall be sent directly to the copyright owner as specified in the copyright notice associated with the article.