
Abstract
Regional seismic damage simulation of buildings provides decision-makers with important information for earthquake disaster prevention and mitigation. Utilizing nonlinear time history analysis using multiple-degree-of-freedom (MDOF) models for buildings, and the next-generation performance-based earthquake engineering, an open-source general-purpose scientific workflow for seismic damage simulation and loss prediction of urban buildings (referred to as SimCenter Workflow) is presented in this study. To introduce the SimCenter Workflow process in detail and demonstrate its advantages, a seismic damage simulation and loss prediction for 1.8 million buildings in the San Francisco Bay Area were performed using the SimCenter Workflow. The open nature and modularization of the SimCenter Workflow facilitate its extensibility and make it practical for researchers to apply to seismic damage simulations in other regions.
Keywords
Introduction
Earthquakes are potential threats to modern cities with dense populations and infrastructures. Recently, powerful earthquakes such as the 2008 Wenchuan earthquake, 2010 Haiti earthquake, and 2010 Chile earthquake have inflicted severe damage and led to extensive casualties and significant losses (DesRoches et al., 2011; Lorito et al., 2011; Ye et al., 2010). Seismic damage simulation of buildings on a regional scale provides valuable information that can be used to improve emergency preparedness and to mitigate possible earthquake-induced losses in high seismic regions and populous modern cities by identifying current weaknesses.
Existing studies have applied seismic damage simulation to many regions using various methods: Roca et al. (2006) conducted a seismic damage simulation for Catalonia, Spain, based on the damage probability matrix (DPM) method (Applied Technology Council (ATC), 1985); Lantada et al. (2009) performed a deterministic and probabilistic seismic damage simulation for Barcelona with the DPM method; and Silva et al. (2015) performed a seismic risk assessment for mainland Portugal using the DPM method. The capacity spectrum method (Federal Emergency Management Agency (FEMA), 2012a) has been used to simulate seismic damage for buildings in many regions in the United States, including California, Los Angeles County, and Charleston (Chen et al., 2013; Kircher et al., 2006; Schmidtlein et al., 2011). Using integrated earthquake simulation (Hori and Ichimura, 2008), the seismic responses of buildings in the Zeytinburnu district of Istanbul and center of Tokyo in Japan were simulated (Hori et al., 2018; Ichimura et al., 2015; Sahin et al., 2016).
Overall, the seismic damage simulation methods used in these studies can be classified as either empirical methods or analytical methods (Lang et al., 2012). The widely used DPM method (ATC, 1985) is a typical empirical method. Using data for the damage to buildings from historical earthquakes and expert judgment, the probability of various buildings reaching various damage states under different seismic intensities can be obtained. This method is easy to implement, but it is difficult to apply in areas where historical earthquake data are lacking or there are large differences between the inventory of current and historical buildings. In addition, the characteristics of different buildings and ground motions are difficult to account for using the DPM method. The analytical methods include static analysis and time history analysis (THA) methods, through which the response of a building is calculated by establishing a structural mechanics model. The capacity spectrum method used in the loss estimation software HAZUS (FEMA, 2012a) is a typical static analysis method. The overall strength and ductility of different buildings can be represented well using this method. However, the influence of higher-order vibrational modes of buildings and the time-domain properties of ground motions (e.g. velocity pulses) cannot be easily represented. In contrast, the THA method can overcome the limitations of static analysis. Hori and Ichimura (2008) and Lu and Guan (2017) applied THA to urban buildings in Japan and China, respectively. In particular, Lu and Guan (2017) proposed a detailed procedure to determine the structural parameters of different buildings according to building inventory data, which significantly improved the feasibility of this technique for buildings in various regions. In addition, the next generation of performance-based earthquake engineering (PBEE) methods, that is, the FEMA P-58 method, was used for loss estimation by applying the engineering demand parameters (EDPs) obtained from the nonlinear THA of buildings (Lu and Guan, 2017; Zeng et al., 2016). The city-scale nonlinear time history analysis method (Lu and Guan, 2017) includes ground motion input, establishment of the building model, calculation of the seismic response, and assessment of economic loss. Different modules are separated from each other. These modules involve many technical and implementation details that cannot be clearly described in published papers or books. The workflow also requires intense manual labor to start the applications for the individual buildings, and to process the output data from one program to create the input needed by the next application. These omissions and amount of labor intensity limit the applicability of such simulations, essentially reducing them to academic exercises performed by a few researchers scattered around the world. In addition, some methods for ground motion simulation and building inventory development have emerged recently, but there is currently no open-source platform to integrate these methods together to perform seismic damage simulation on a regional scale.
Therefore, we proposed an open-source general-purpose scientific workflow (referred to as SimCenter Workflow) for the seismic damage simulation and loss prediction of buildings on a regional scale using the city-scale nonlinear time history analysis method. The Workflow integrates different modules together and specifies the interface between the different parts, through which the simulation of the entire process—from the earthquake fault to building loss—can be achieved. Consequently, users can quickly familiarize themselves with the entire analysis process, apply to seismic damage simulations in other regions, and modify the modules according to their needs. In addition, applications in the SimCenter Workflow can be replaced with other alternative applications, which indicates its flexibility and robustness. To introduce the SimCenter Workflow process in detail and demonstrate its advantages, we present a scenario-based example run of this workflow application which performs a seismic damage simulation and loss prediction for 1.8 million buildings in the San Francisco Bay Area.
SimCenter scientific workflow application
A workflow is a repeatable set of activities that are performed in a sequence to complete a task that often needs to be repeated. A scientific workflow is the automation of a workflow such that each activity in the workflow is completed by separate applications and the flow of outputs and inputs between the applications is managed. CyberShake (Graves et al., 2011), for example, is such a workflow application used by the Southern California Earthquake Center (SCEC) for creating seismic hazard maps. In this work, a scientific workflow is presented that starts with an earthquake simulation for an urban region, and results in the downtime and loss estimation for the buildings in that region. The applications involved in the workflow include the applications for the nonlinear THA analysis of each building in the region and the subsequent repair time and loss calculation using the FEMA P-58 method. The flowchart and modules of the SimCenter Workflow Application are shown in Figure 1. It should be noted that any application in the SimCenter Workflow can be replaced with other alternative applications. The SimCenter Workflow includes six main applications. The function of each module is summarized in Table 1. Each module is programmed in C++, and the relevant code has been open sourced to the GitHub code hosting platform (https://github.com/fmckenna/Workflowf1). This link includes key software libraries and technical details to run the whole workflow. The SimCenter Workflow is a cross-platform application, which can be run on multiple operating systems (e.g. Windows and Linux). Currently, the building inventory and ground motion input modules are primarily targeted in the Bay Area case study. However, different building inventories, ground motion simulation methods (e.g. OpenQuake engines (Pagani et al., 2014) and SCEC Broadband Platform (Silva et al., 2018)), building modeling approaches (e.g. multiple-degree-of-freedom (MDOF) models, refined finite-element models (Xu et al., 2016), or multiple level-of-detail (LOD) models (Xiong et al., 2019)), and loss modeling approaches can be integrated into the framework. The SimCenter Workflow can serve as a convenient open-source platform for seismic damage simulation of buildings in large urban areas. Two of the main SimCenter Workflow modules, that is, Create SAM and Create DL (shown in red in Figure 1), are introduced in detail in the following sections.
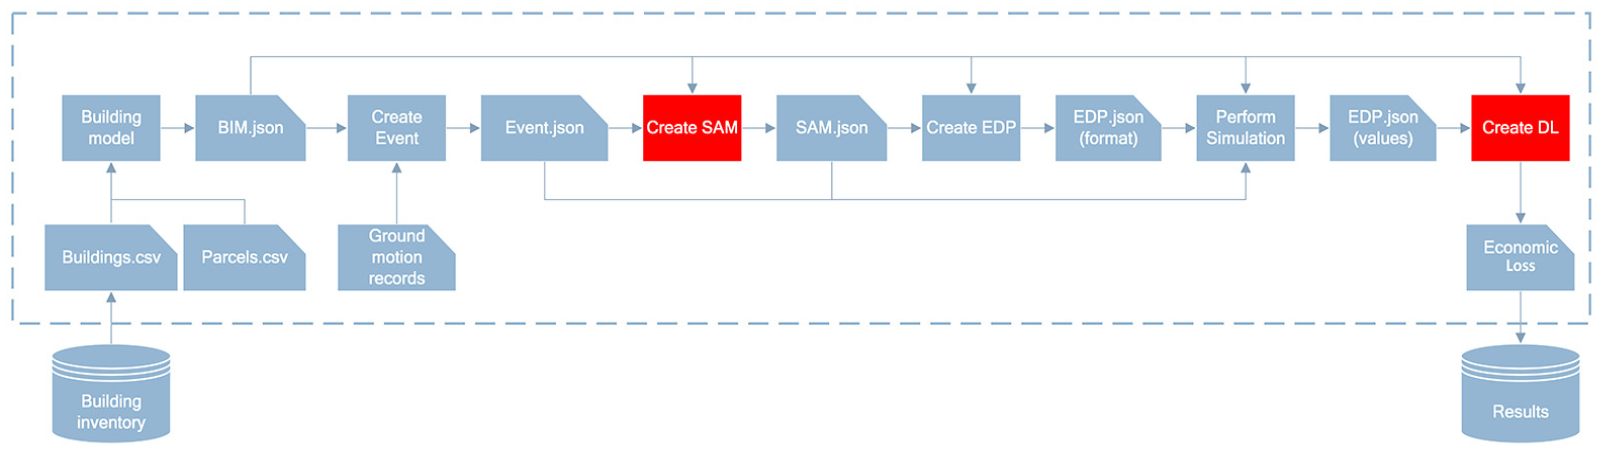
Flowchart and modules of the SimCenter Workflow.
Functions of the different SimCenter Workflow modules
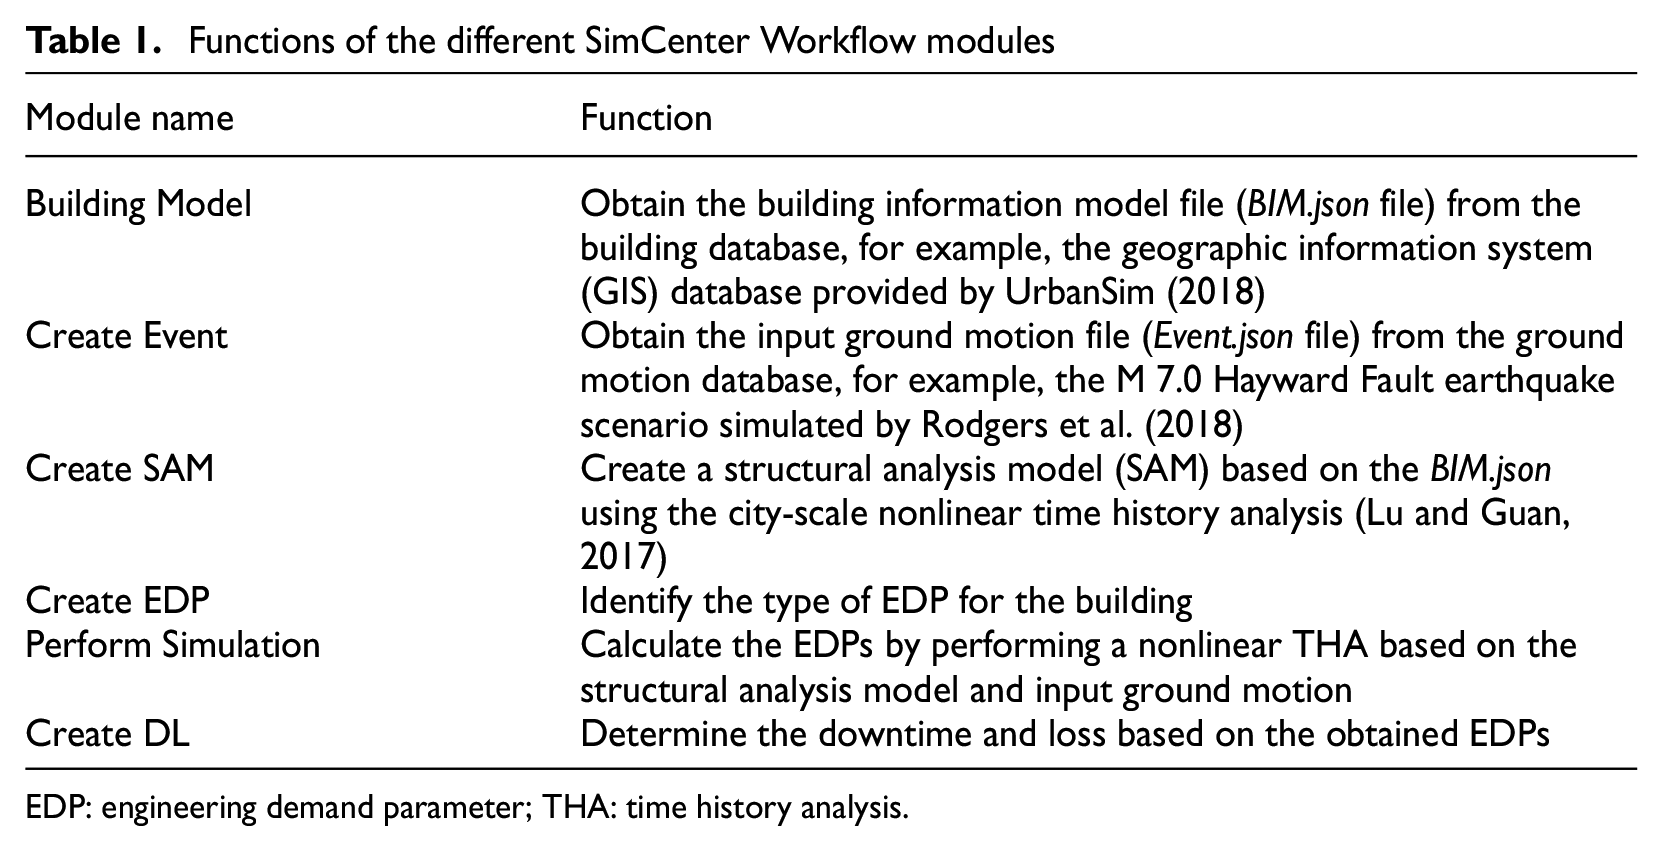
EDP: engineering demand parameter; THA: time history analysis.
Create SAM
As mentioned previously, the THA method enables more rational consideration of the characteristics of different buildings and ground motions than the empirical and static analysis methods. However, for an urban area consisting of thousands of buildings, creating refined computational models is extremely time-consuming. To overcome this difficulty, the MDOF shear model (Figure 2) proposed by Lu and Guan (2017) is used in this study. MDOF shear models are suitable for regional seismic response analysis and provide good accuracy and high computational efficiency (Lu et al., 2014; Xu et al., 2016). The MDOF shear model assumes that
A multi-story building can be simplified to an MDOF model in which each story has its nonlinearity;
The deformation mode of a building is dominated by the shear type; and
Depending on the structural system, the nonlinearity of the structure at each story can be modeled using either a modified-Clough (Mahin and Lin, 1983), bilinear (Miranda et al., 2002), or pinching model (Kinali and Ellingwood, 2007).
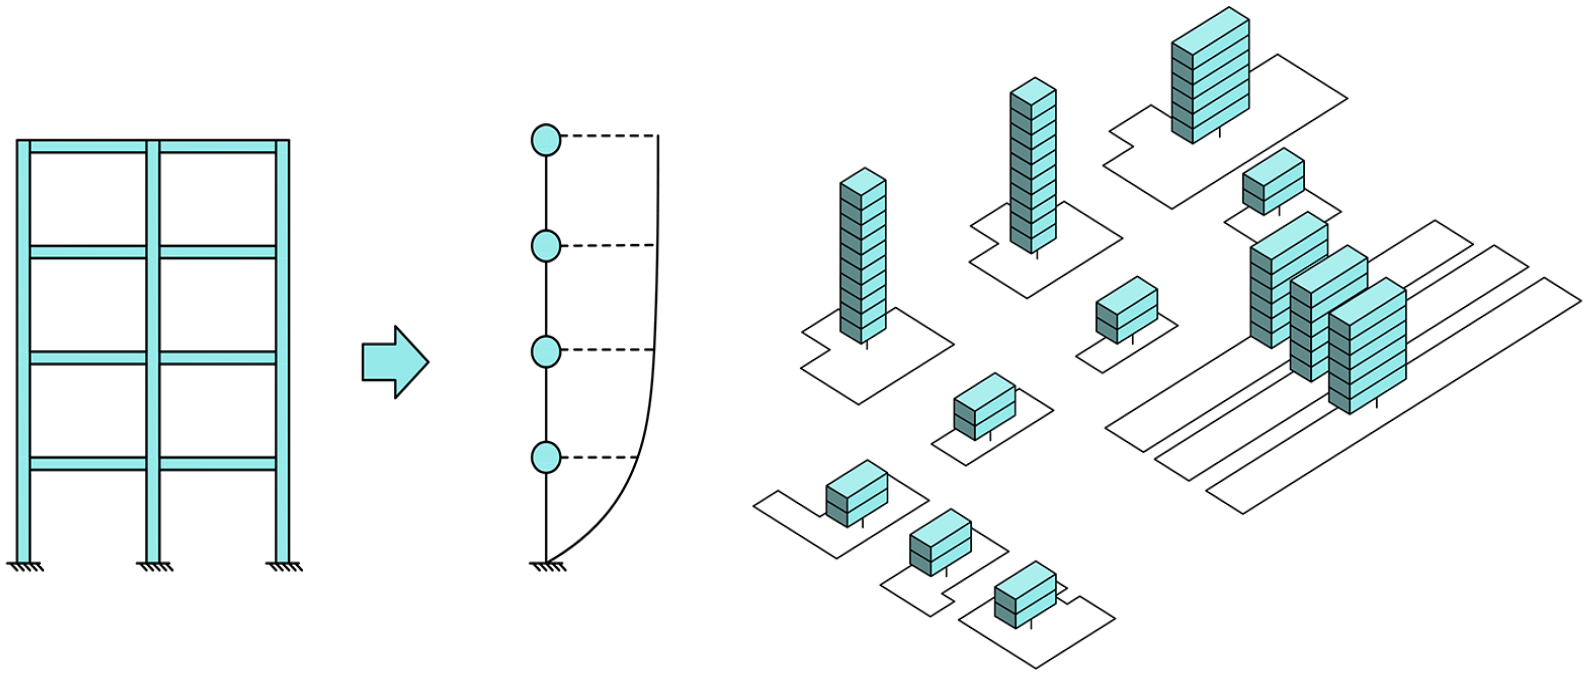
MDOF shear model for buildings on a regional scale.
Based on the HAZUS database, Lu and Guan (2017) proposed a modeling approach by which all the parameters of the MDOF shear model can be determined from the basic building information (i.e. number of stories, height, year built, structural type, floor area, and occupancy). The details are described below.
The first vibration period of the building is determined using Equation 1

where T1 is the first vibration period of the specific building; N is the number of stories in the building; and N0 and T0 are the number of stories and fundamental period, respectively, of the typical buildings presented in Tables 5.5 and 5.7 of FEMA (2013).
For regular buildings, the initial inter-story stiffness and mass of each story are assumed to be uniformly distributed along the height of the building; the stiffness and mass matrices of the MDOF model are then given by
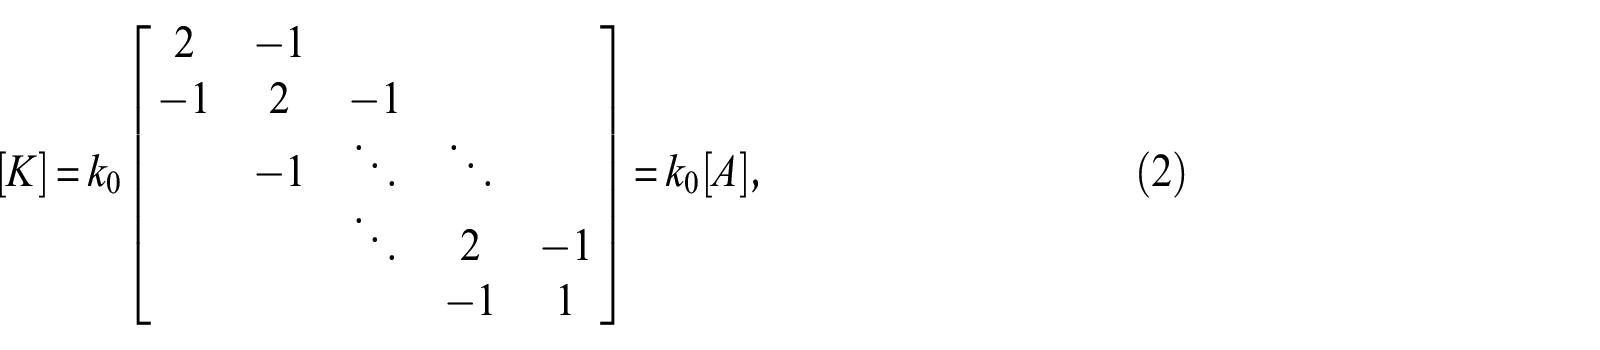
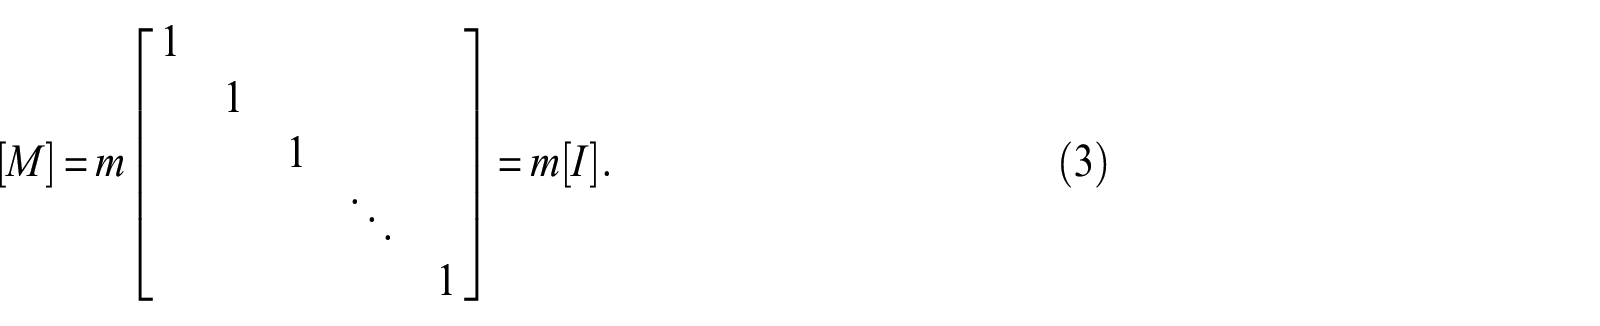
Therefore, the initial inter-story shear stiffness k0 is given as

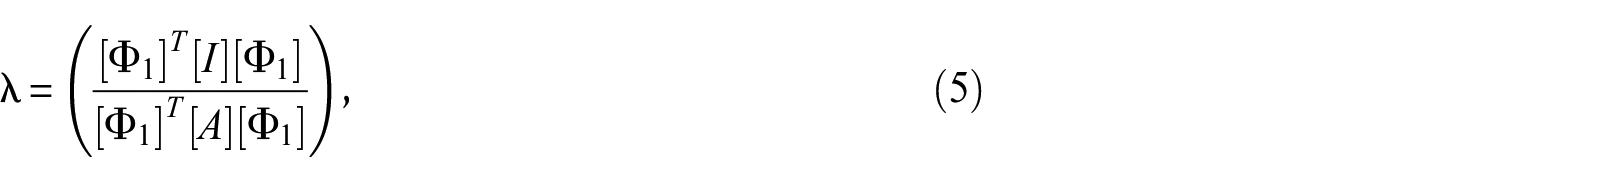
where [Φ1] is the modal vector of the first vibration mode; and m is the mass of each story, which is determined based on the floor area and the occupancy of the building (Lu and Guan, 2017).
Thus, the inter-story backbone curve parameters of story i in Figure 3 are determined as follows:


where g is the acceleration of gravity;

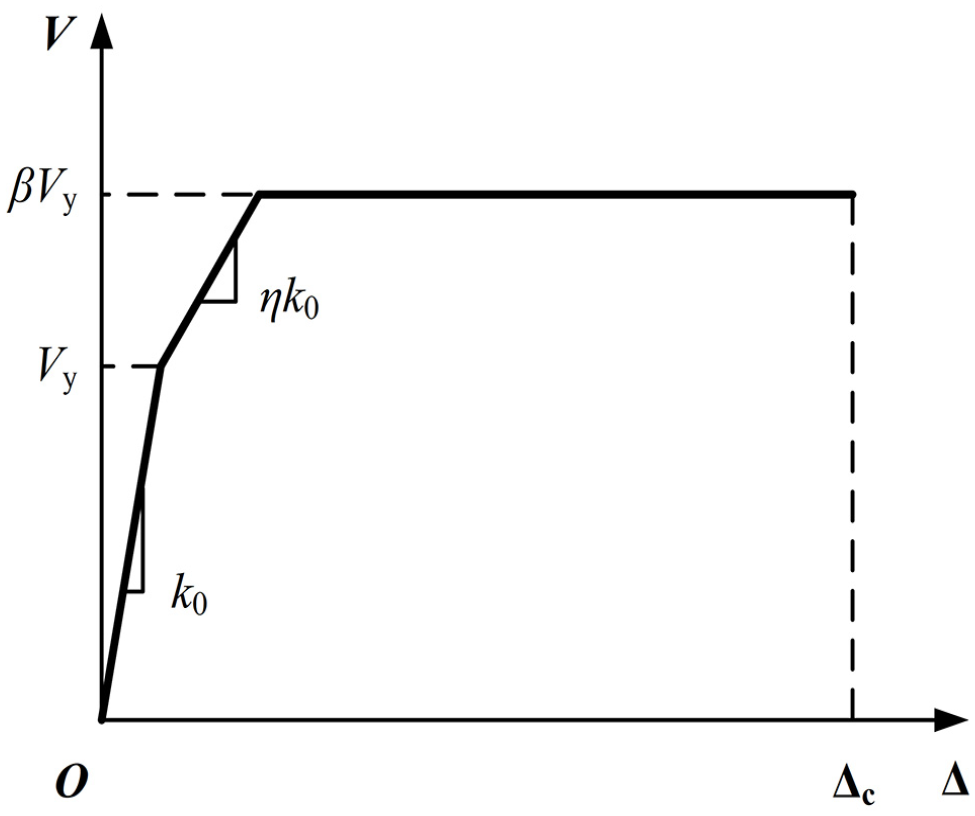
Backbone curve of the MDOF shear model.
The damage states for regular buildings are identical to the damage states defined by HAZUS: slight, moderate, extensive, and complete. The inter-story drift ratio is used as the threshold for each structural damage state, and the values for different structural types are based on Table 5.9 of HAZUS (FEMA, 2013). An example of these values is presented in Table A1 in Appendix A.
The empirical values of the damping ratio for Rayleigh damping (Chopra, 1995) are estimated according to the structural type of the building. FEMA (2012a) and Newmark and Hall (1982) have proposed the damping ratios for different types of buildings, as summarized in Table 2. It should be noted that because of the open-source nature of the SimCenter Workflow, other advanced damping models (e.g. ATC-72 (ATC, 2010)) can also be adopted.
Parameters for Rayleigh damping
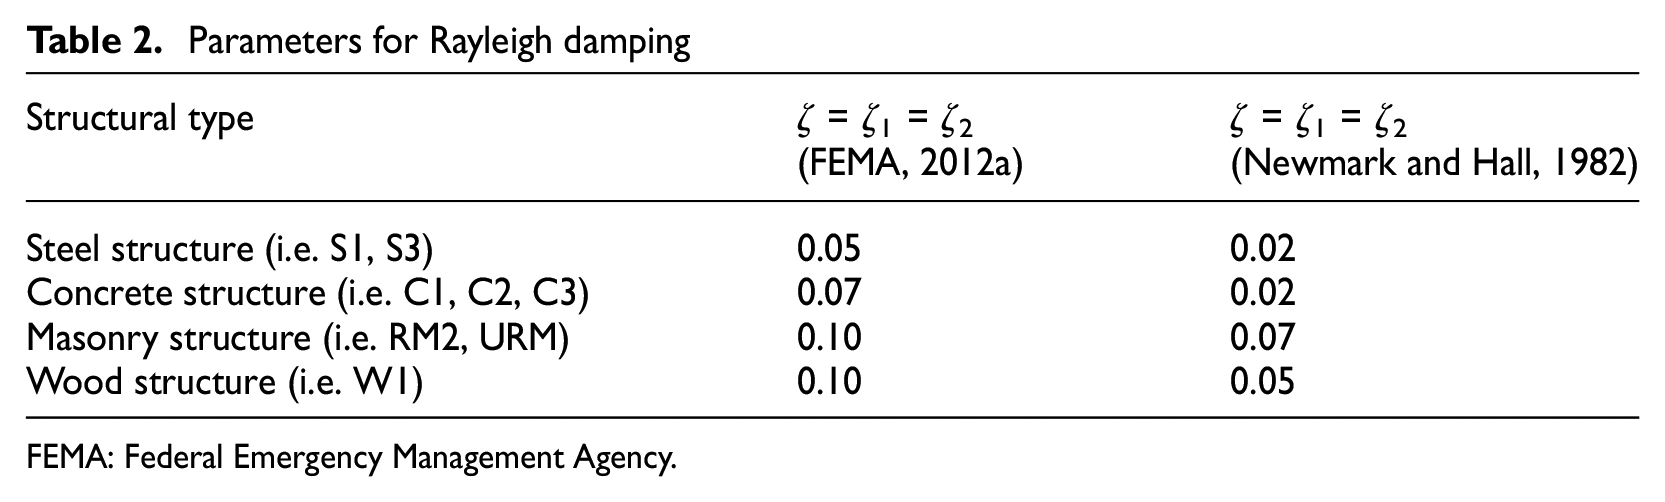
FEMA: Federal Emergency Management Agency.
To represent the pinching behavior subjected to cyclic loads, the commonly used pinching model proposed by Steelman and Hajjar (2009) is adopted in this study. In this model, the unloading stiffness is constant and equal to the initial stiffness. All possible break points in the reloading curve are located on the “break point line,” which is drawn from the intersection of the unloading path with the horizontal axis to the yield point of the full bilinear hysteretic loop in the loading, as shown in Figure 4. Thus, only one parameter, τ, is required to determine the hysteretic behavior of the model, as follows:

where Ap and Ab are the areas of the pinching envelope and full bilinear envelope, respectively (Figure 4); and τ is a coefficient used to quantify the severity of degradation. This model was chosen because the pinching parameter, τ, can be easily determined from the degradation factor, κ, given in Table 5.18 of HAZUS (FEMA, 2013; Steelman and Hajjar, 2009). If other pinching models (e.g. that proposed by Ibarra et al. (2005)) are used, more parameters (e.g., basic strength deterioration, post-capping strength deterioration, and accelerated reloading stiffness deterioration (Ibarra et al., 2005)) should be calibrated. However, the required calibration of the parameters for a large number of buildings has not been found in literature to-date. Consequently, the single parameter-pinching model is adopted herein. It should be noted that this approach is suitable for conventional buildings with regular planar and vertical layouts. And the uncertainty of the parameters of the structural models can be considered when the data are available (Lu et al., 2017).
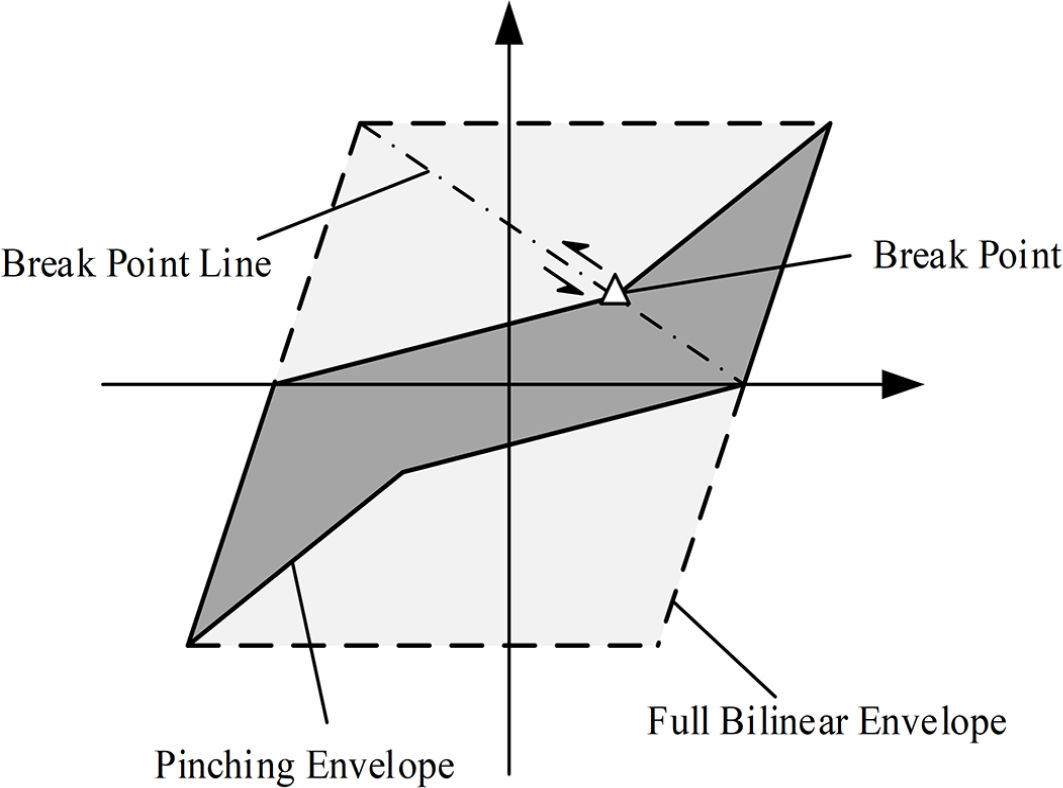
Diagram of the pinching envelope of the pinching model.
Create DL
A regional scale seismic loss prediction method for buildings (Zeng et al., 2016) based on the FEMA P-58 method (FEMA, 2012b, 2012c, 2012d) is adopted in the Create DL module of the SimCenter Workflow to calculate the loss of buildings.
FEMA P-58 is a component-level loss assessment method, in which the seismic loss is calculated by adding up the repair cost of each building component under different damage states. The fundamental principle of the FEMA-P58 methodology is the PBEE framework developed by the Pacific Earthquake Engineering Research Center (Cornell and Krawinkler, 2000). The procedure relies on the use of conditional probability, where the probability of incurring damage at different damage states is conditioned based on the occurrence of a given EDP. Once the damage state is identified, the repair action and repair cost are calculated from a look-up table.
Figure 5 shows the flowchart of the repair cost calculation for a performance group (PG), which consists of the components that are vulnerable to the same EDP (Zeng et al., 2016). The EDP is first calculated using the THA. The damage state of the PG is then determined using the fragility curves. Finally, the repair cost is determined from the total quantity and unit repair cost of each PG. Details of this procedure are described in Chapters 3 and 7 of FEMA (2012b).
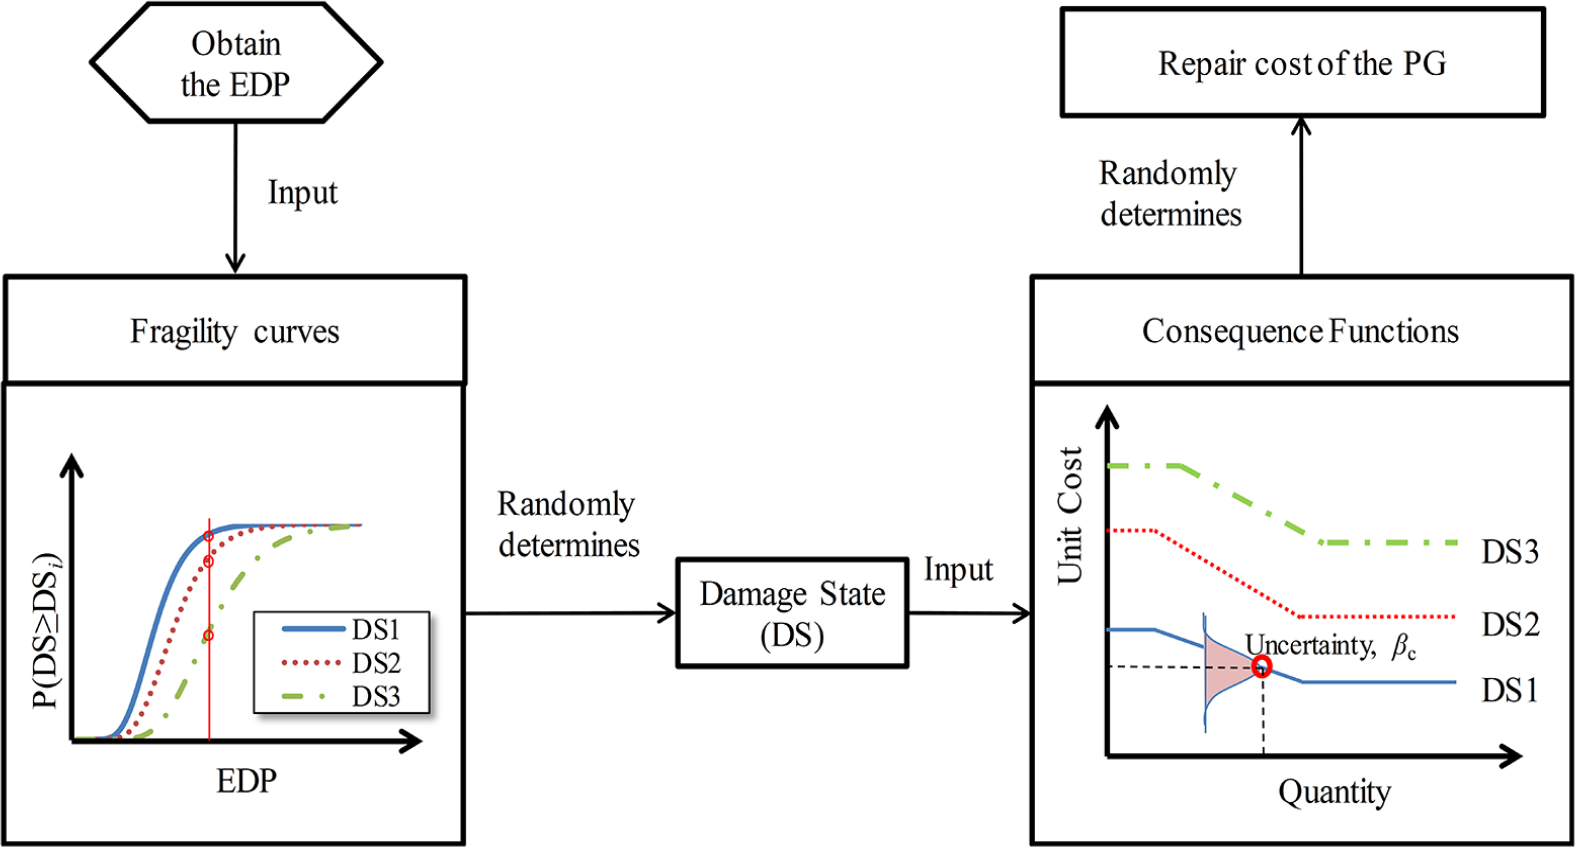
Calculation of repair cost for a building component using the FEMA-P58 methodology (Zeng et al., 2016).
The key challenges of using the FEMA-P58 method for a region are the assembly of the performance models and the rapid calculation of the EDPs.
Assembly of the performance models
The performance model of a building contains the basic information for both the structural and nonstructural PGs.
The basic building data can be obtained from a GIS database, field investigation, or design drawings. Generally, this information is easy to collect if a GIS database of the target area is available.
The structural PGs generally obey a certain statistical law owing to the requirements of seismic design codes and economic considerations of structural design. Through a statistical survey, the statistical law for the number of structural components per unit area can be obtained. Then, based on GIS data such as the structural types, floor area, and number of stories, the number of structural PGs can be estimated. FEMA (2012b, 2012d) assumes that the number of nonstructural PGs follows a lognormal distribution, and thus the number of structural PGs is also assumed to obey a lognormal distribution in this study.
By collecting relevant data from published documents and design drawings (i.e. structural layouts from tests, numerical models, or actual engineering projects), the median and dispersion of the structural PGs of buildings with different structural types were determined, as listed in Table 3. It should be noted that these buildings are designed by researchers and cannot reflect all of the characteristics of a real building. Hence, the accuracy of the estimation could be improved by enriching the statistical data and incorporating more actual engineering projects in the future.
Median and dispersion of the structural PGs
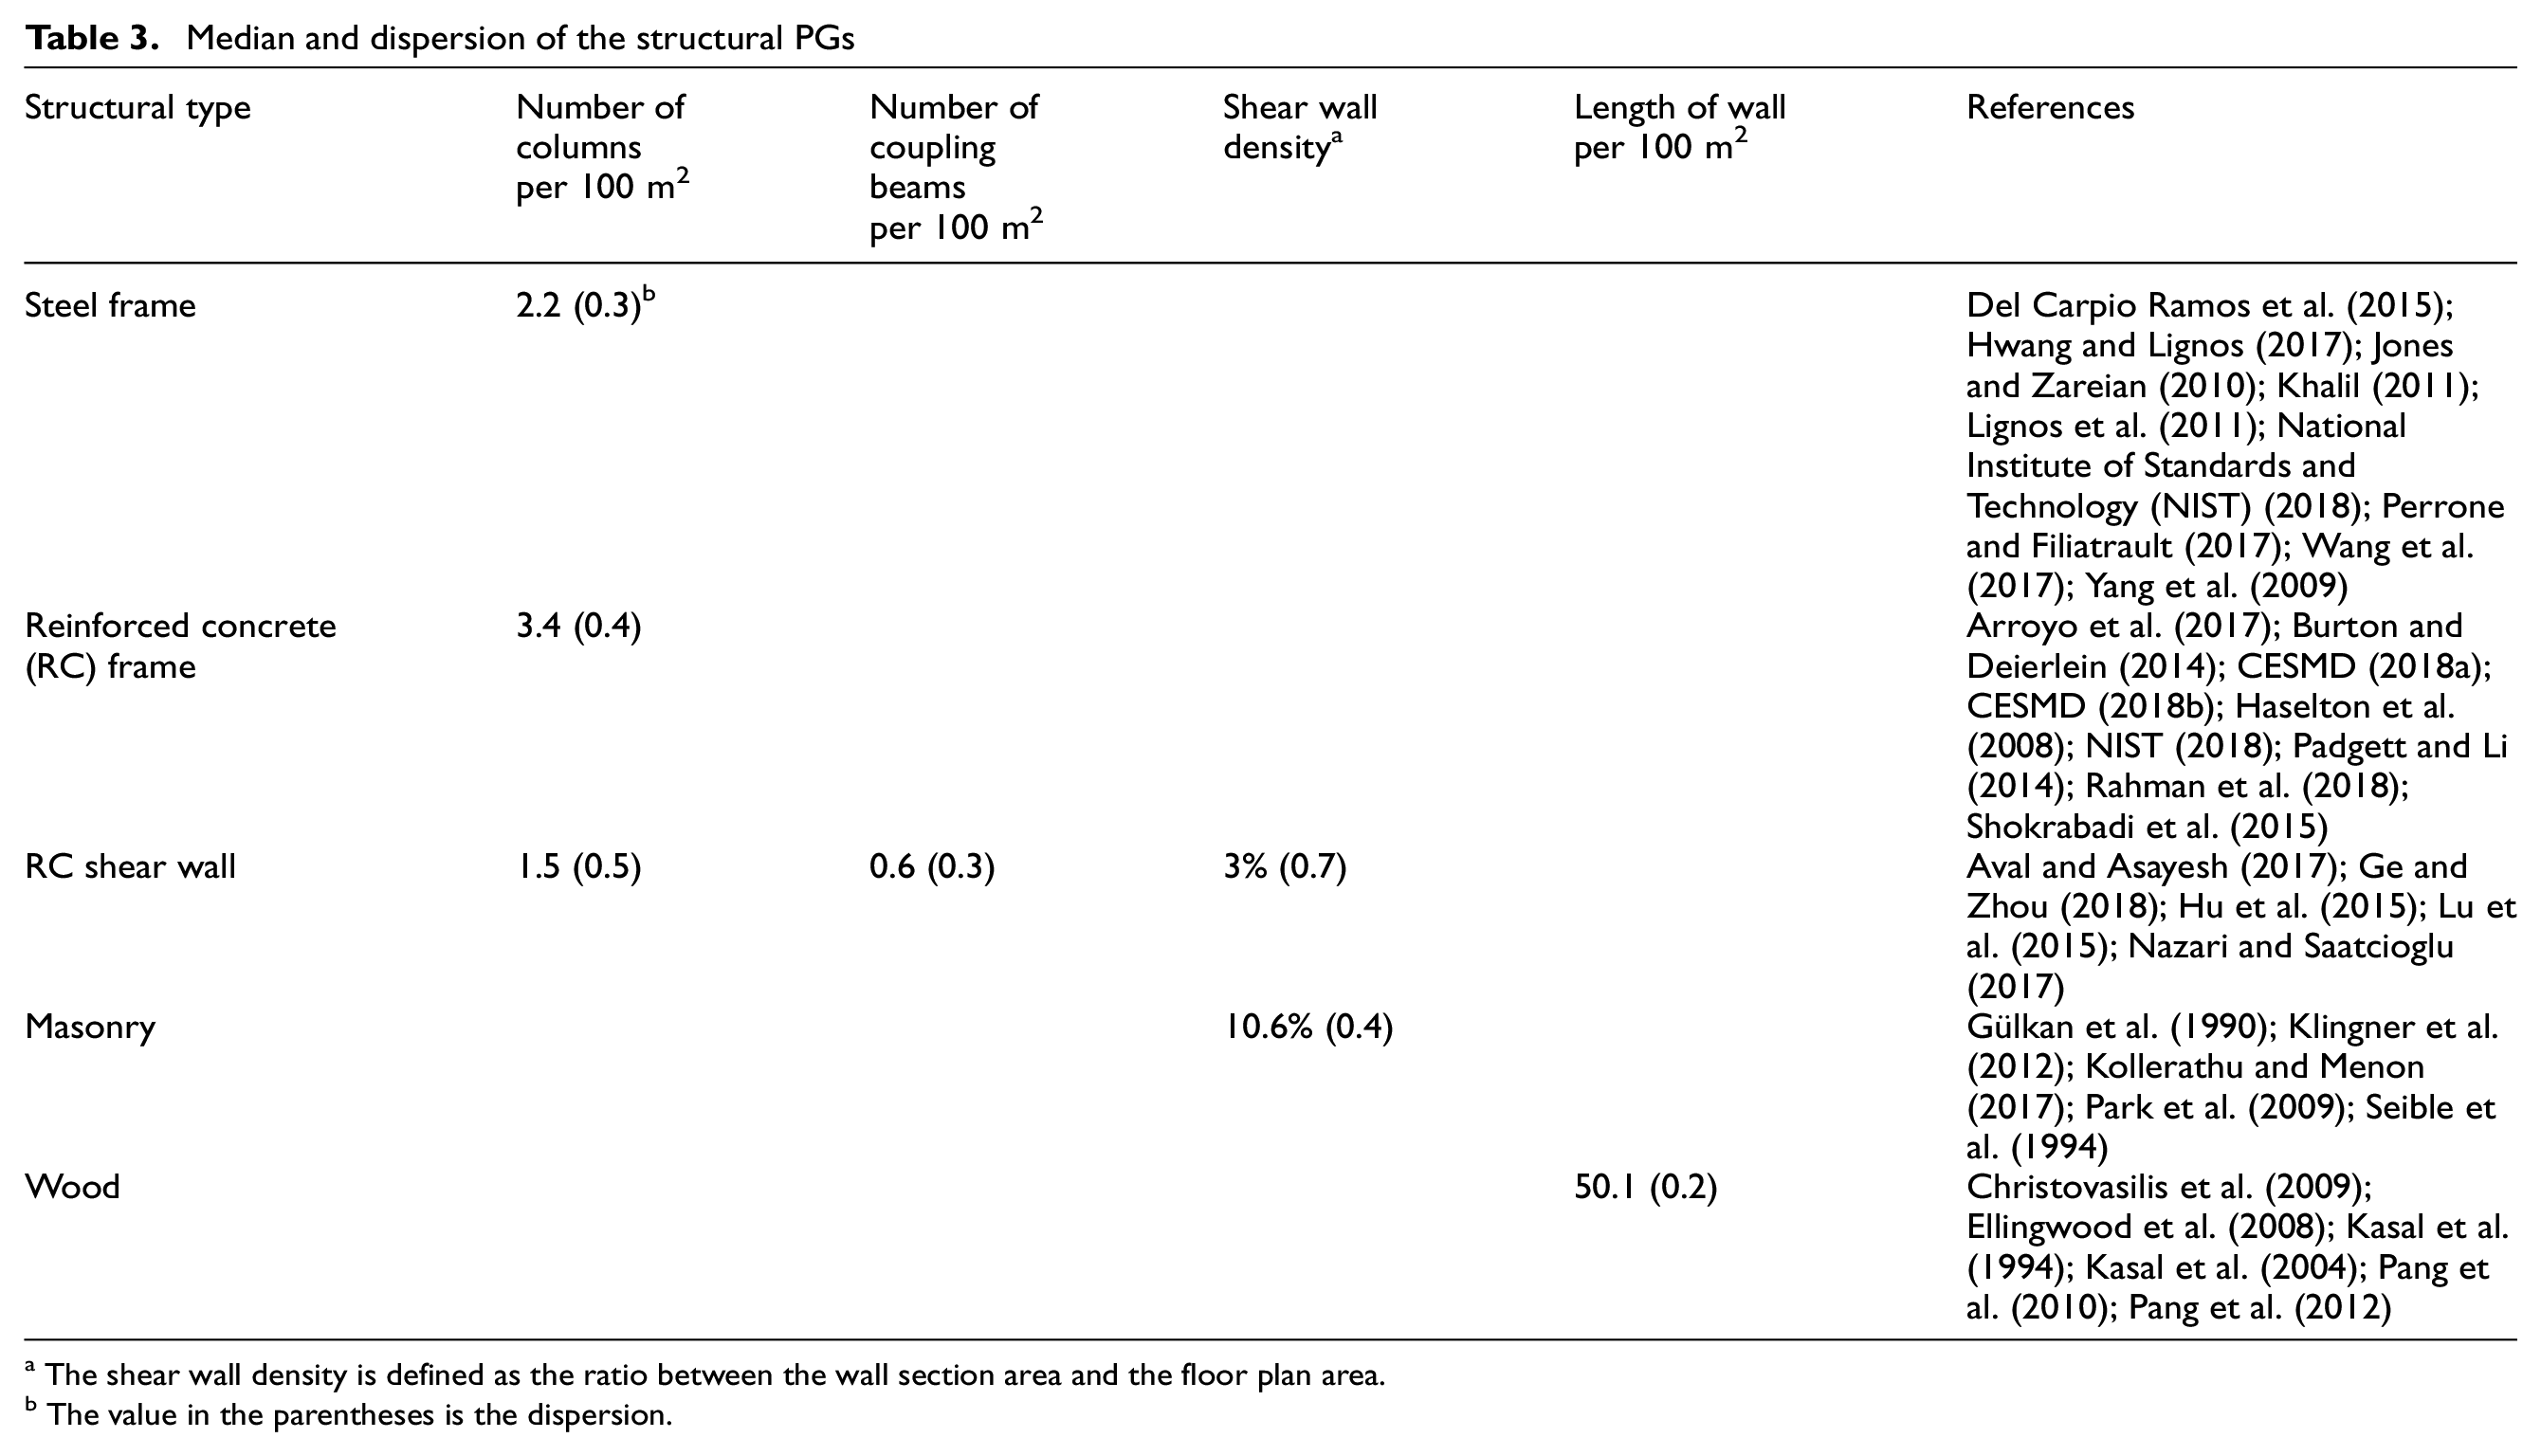
The shear wall density is defined as the ratio between the wall section area and the floor plan area.
The value in the parentheses is the dispersion.
The nonstructural PGs can be identified using the FEMA P-58 database. FEMA (2012b, 2012c, 2012d) investigated the number of nonstructural PGs in more than 3000 buildings with different occupancies (e.g. office, education, healthcare, hospitality, etc.), and suggested typical values, which are listed in the normative quantity information provided in Appendix F of FEMA (2012b). Meanwhile, a tool to estimate the number of nonstructural PGs is provided in FEMA P-58. Therefore, based on those data and basic GIS information such as floor area, number of stories, and occupancy, the nonstructural PGs can be estimated. For example, the sanitary waste piping in an office building is assumed to be 0.057 ft per 1 gross ft2 according to Appendix F of FEMA (2012b), so the length of sanitary waste piping in an office building with a floor area of 1000 m2 is 187 m in each floor. For other specialized buildings, the nonstructural PGs can be estimated according to Appendix F of FEMA (2012b).
Rapid calculation of the EDPs of a building group
Another difficulty in extending the FEMA-P58 method from an individual building to a region is to obtain the EDP distribution in an efficient manner. EDPs including the peak floor acceleration (PFA), peak floor velocity (PFV), peak inter-story drift ratio (IDR), and residual drift at each story are determined from a series of THA. The EDP distribution of a building group can be obtained efficiently using nonlinear THA of the MDOF shear models, making use of the results of the SimCenter Workflow.
In addition to economic loss, the FEMA P-58 method can also be used to predict other seismic consequences, such as the repair time and red-tag status of buildings. In the Workflow, the rebuilding time is determined based on Table 15.9 of FEMA (2013) and the parallel repair strategy is adopted.
Seismic damage simulation of buildings in the San Francisco bay area
In this study, the San Francisco Bay Area (hereafter referred to as the Bay Area) is considered for a case study simulating the seismic damage of buildings using the SimCenter Workflow. And the case study area consists of nine counties (Alameda, Contra Costa, Marin, Napa, San Francisco, San Mateo, Santa Clara, Solano, and Sonoma), as shown in Figure 6.
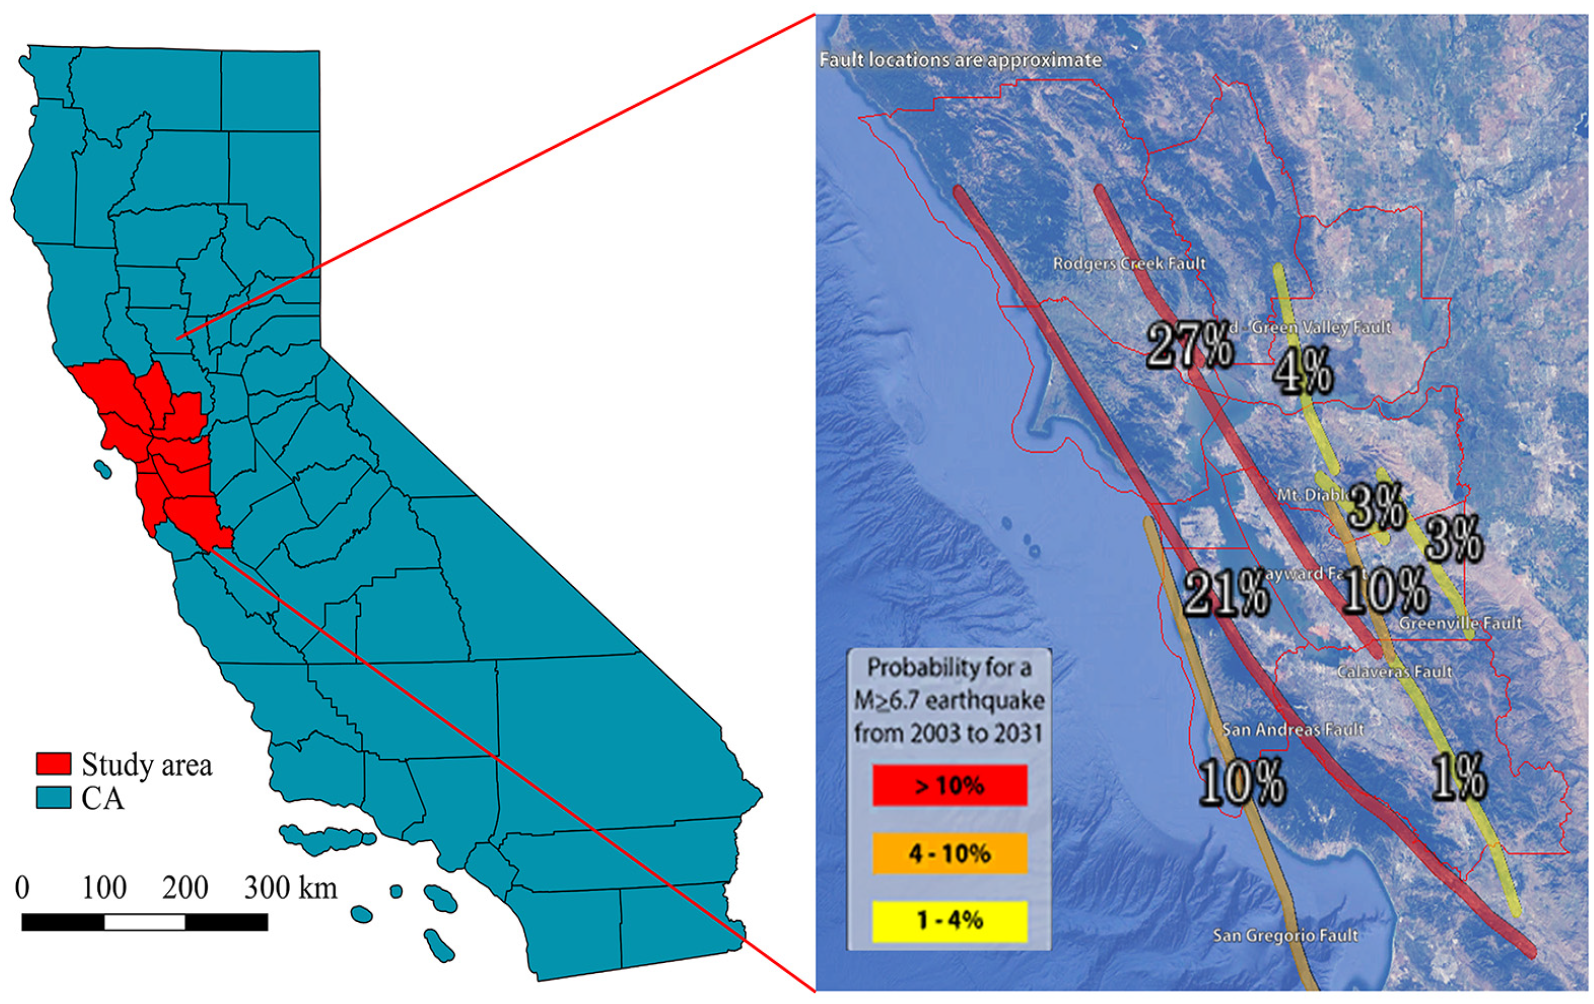
Study area and earthquake probabilities for the Bay Area (U.S. Geological Survey (USGS), 2019).
The seismic risk of the Bay Area is significantly high. In 2003, earthquake scientists led by USGS estimated that there is a 62% probability of a magnitude 6.7 or greater earthquake in the Bay Area in the next 30 years (USGS, 2019), as shown in Figure 6. Therefore, it is necessary to perform the seismic damage simulation of the Bay Area under a significant earthquake.
Building inventory
An inventory of 1,843,351 buildings in the Bay Area was obtained from the GIS database provided by UrbanSim (2018), including the number of stories, year built, floor area, occupancy, and so on. UrbanSim is a simulation system for supporting planning and analysis of urban development, through which information for individual buildings and parcels that represent location can be provided (UrbanSim, 2018). It should be noted that the building inventory can be provided by other data source. Since UrbanSim has established the building inventory for the Bay Area, these data were adopted in this work. The distribution of the year built and number of stories are shown in Figures 7 and 8, which show that the majority of buildings in the Bay Area are low-rise buildings built before 2000.
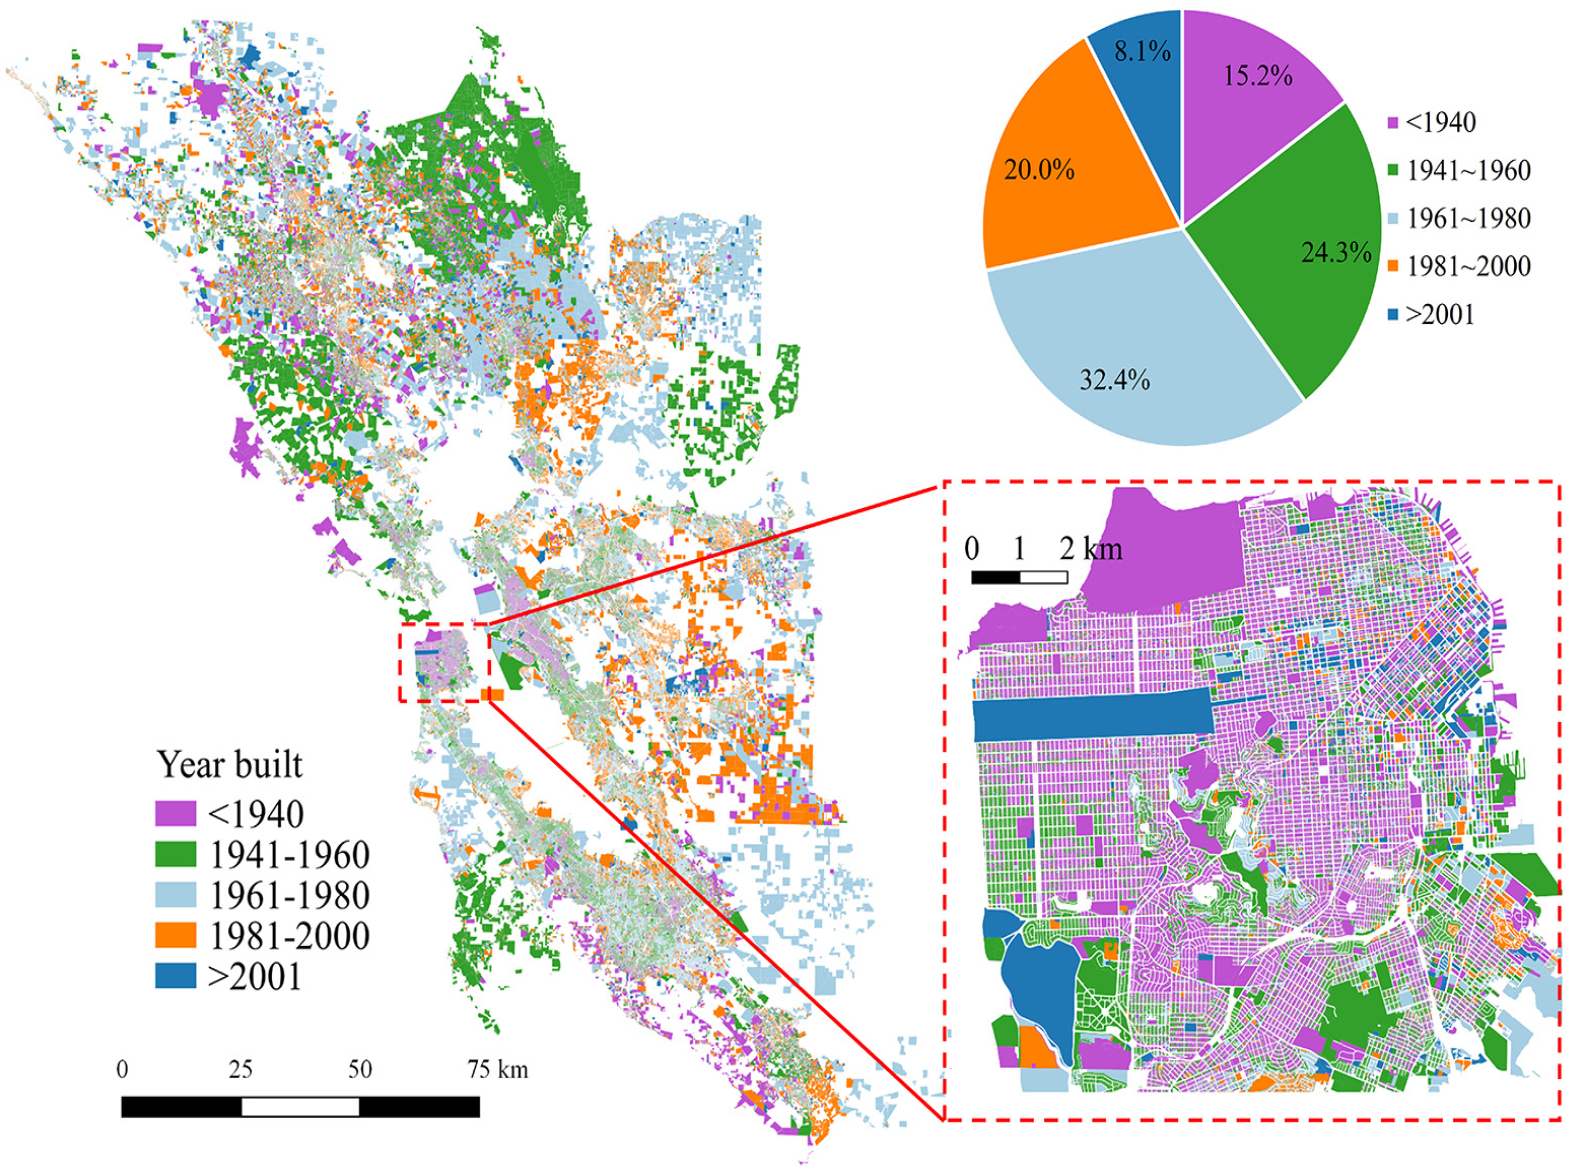
Distribution of the year built for more than 1.8 million buildings in the Bay Area.
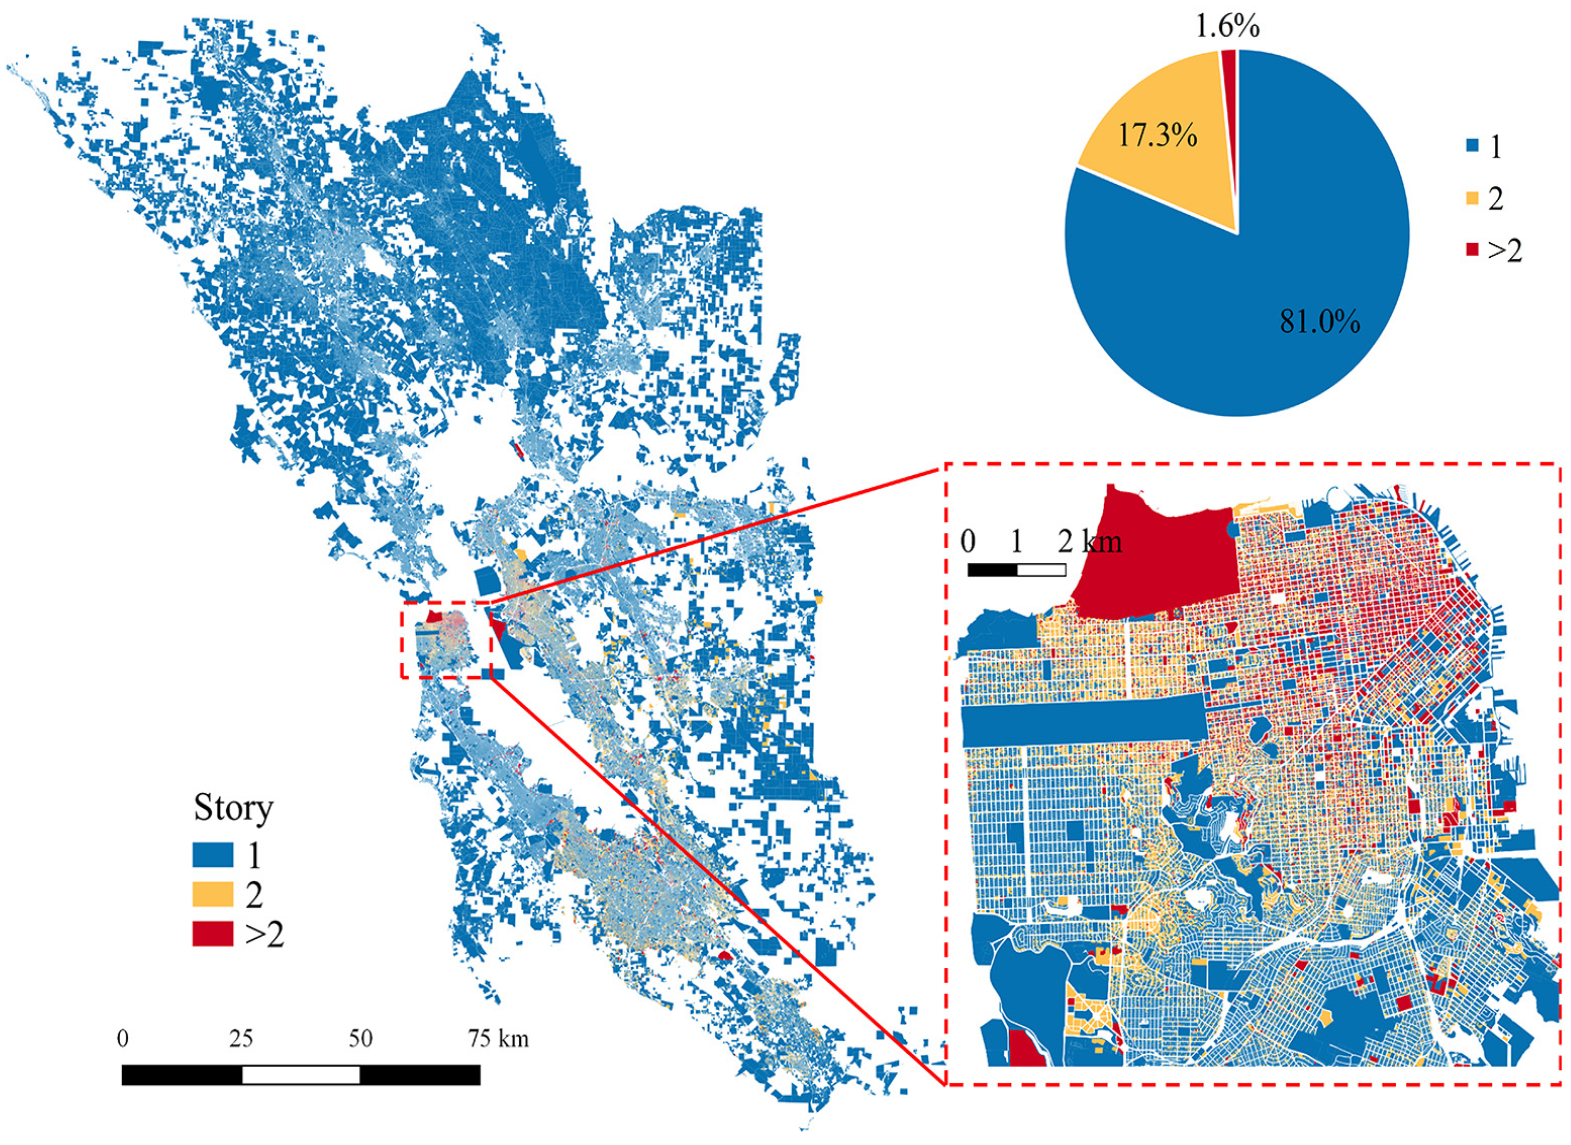
Distribution of number of building stories of more than 1.8 million buildings in the Bay Area.
Input ground motion
An accurate ground motion input not only reduces bias in the obtained structural responses, but it also contributes to improving the reliability of the estimation of seismic responses (Macedo and Castro, 2017). Rodgers et al. (2018) at Lawrence Livermore National Laboratory (LLNL) and Lawrence Berkeley National Laboratory (LBNL) performed a simulation of a magnitude of 7.0 earthquake event on the Hayward fault (Figure 6) in the Bay Area using the National Energy Research Scientific Computing (NERSC) Center Cori supercomputer. The propagation of seismic waves and the ground motions at each grid point within the 120 × 80 × 30 km region were obtained in the simulation (Figure 9). The input ground motion for each building can be determined from the simulated ground motions based on the building location. The peak ground acceleration (PGA) distribution of the input ground motion for each building is shown in Figure 10.
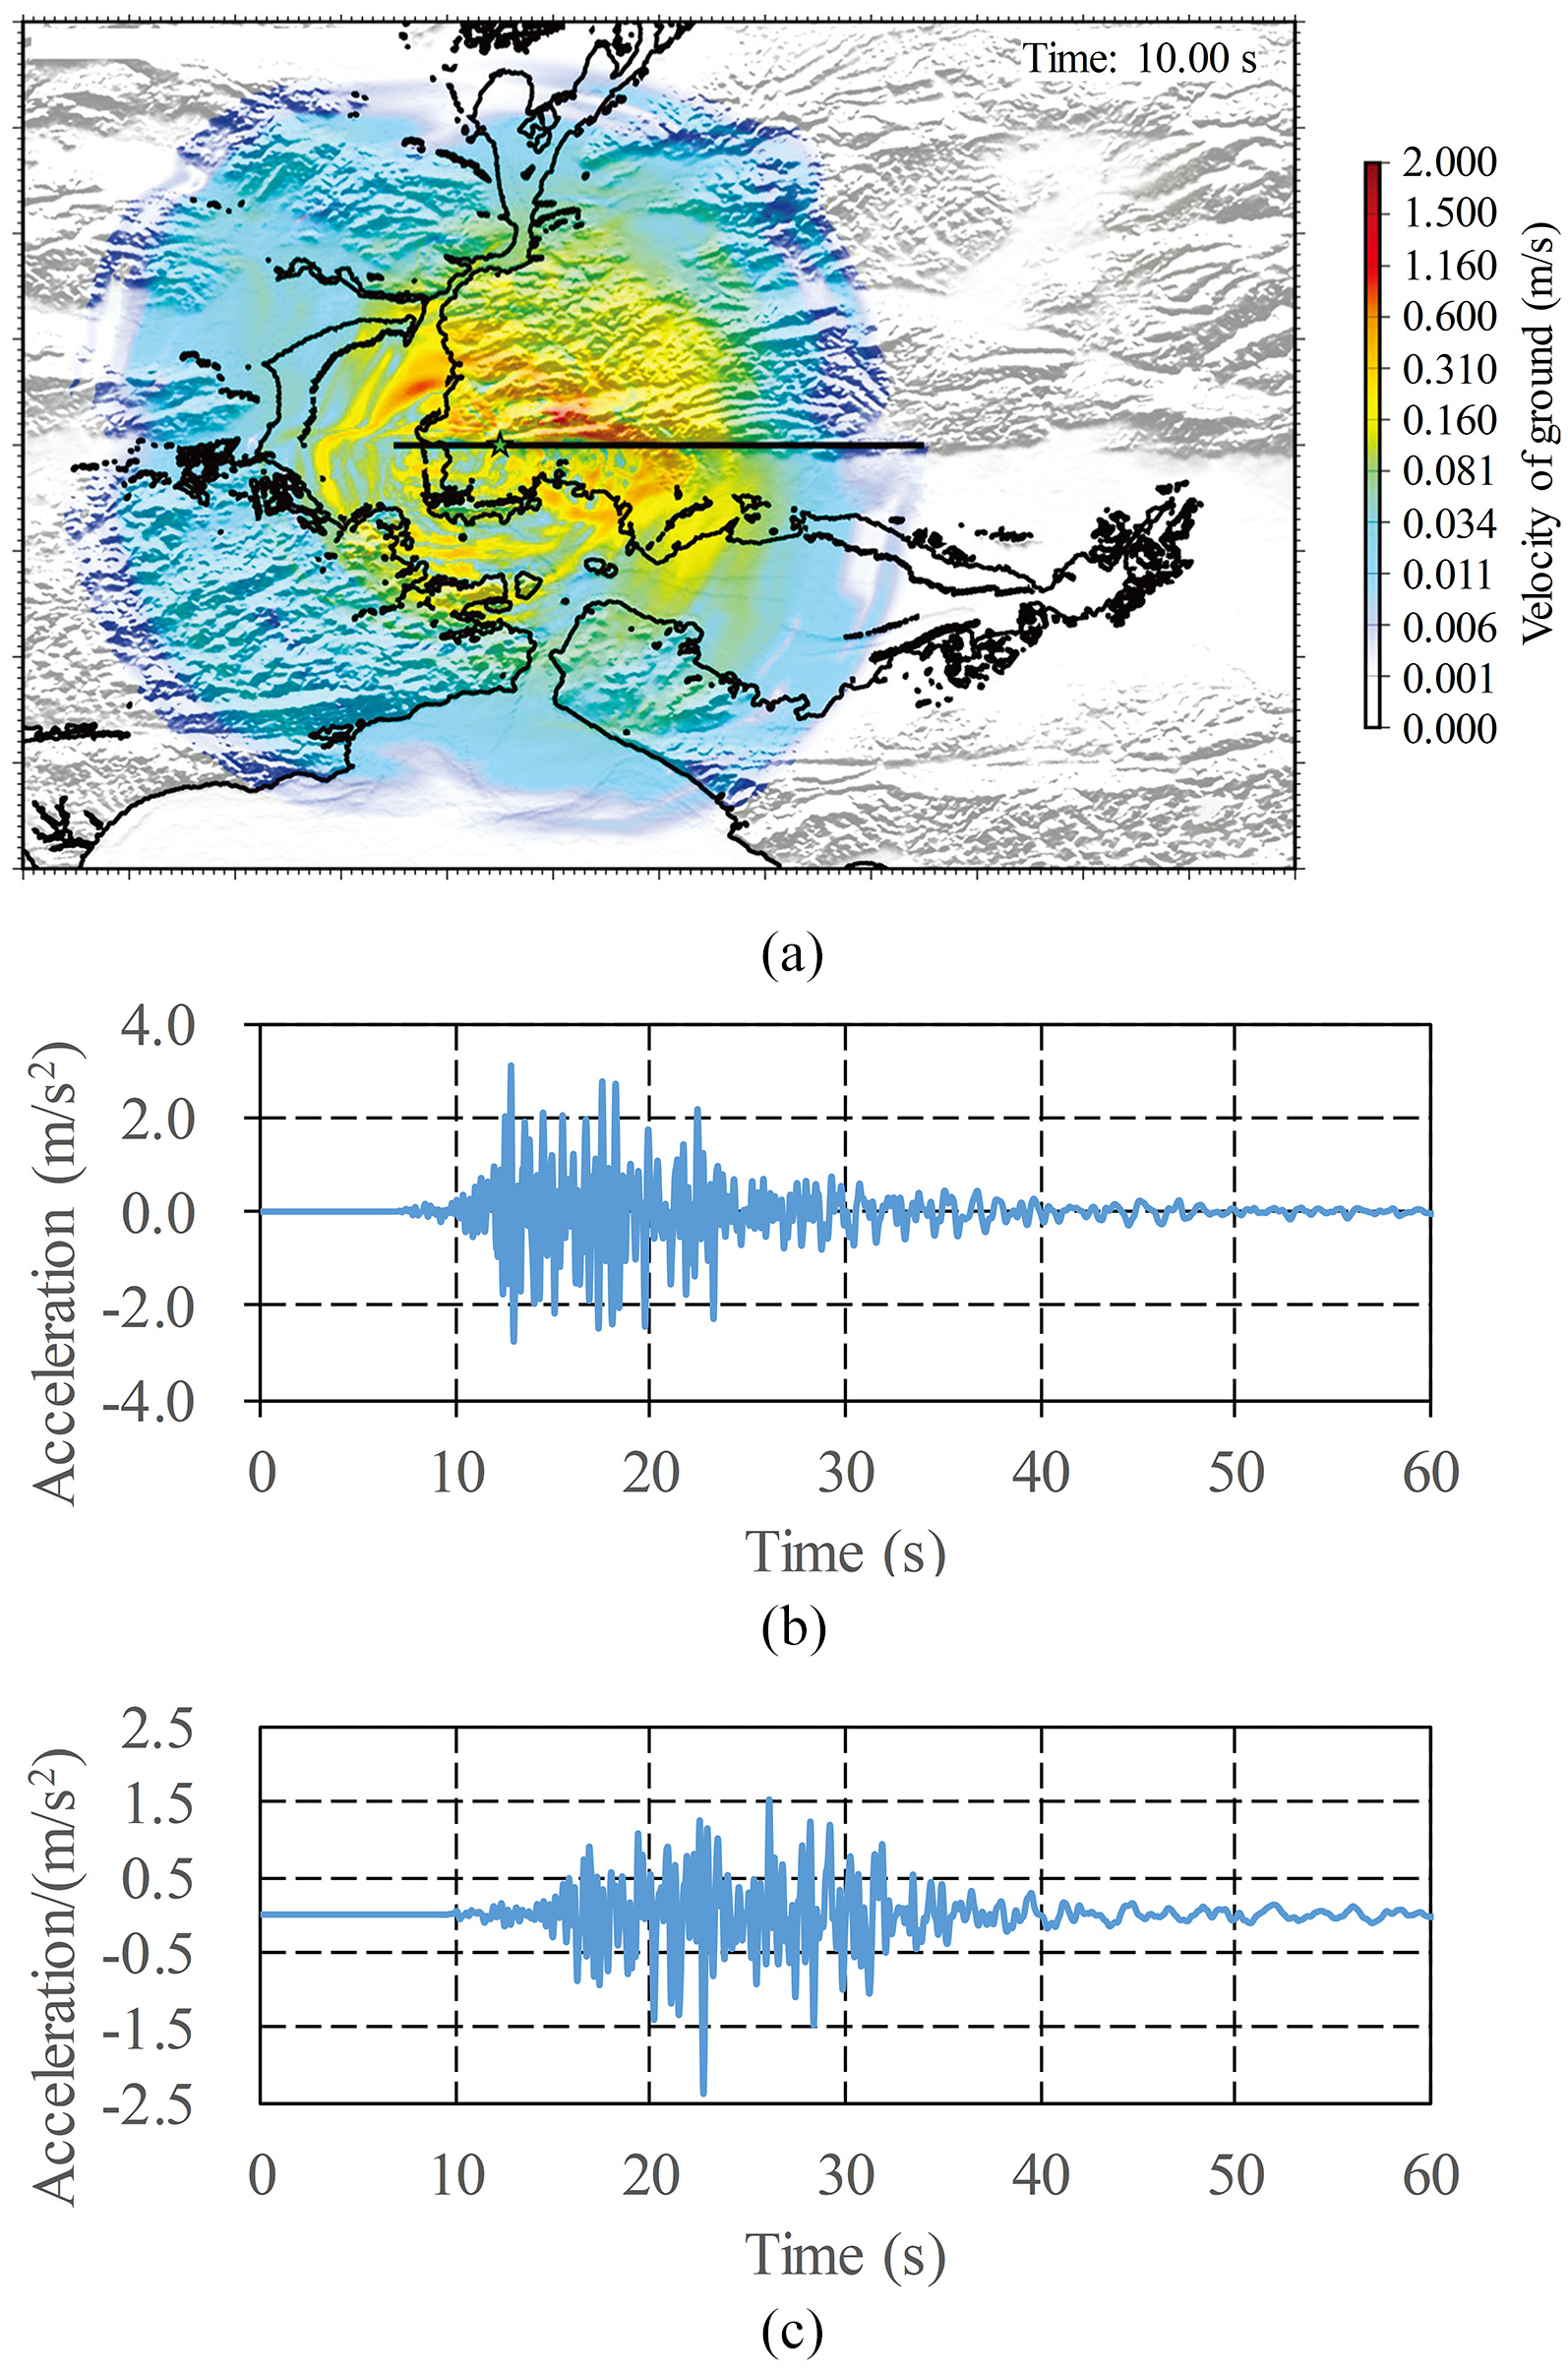
(a) Simulated ground motion for the M 7.0 Hayward Fault earthquake scenario; (b) time histories of the input ground motion at grid S_28_28; (c) ground motion at grid S_30_35 (Rodgers et al., 2018).
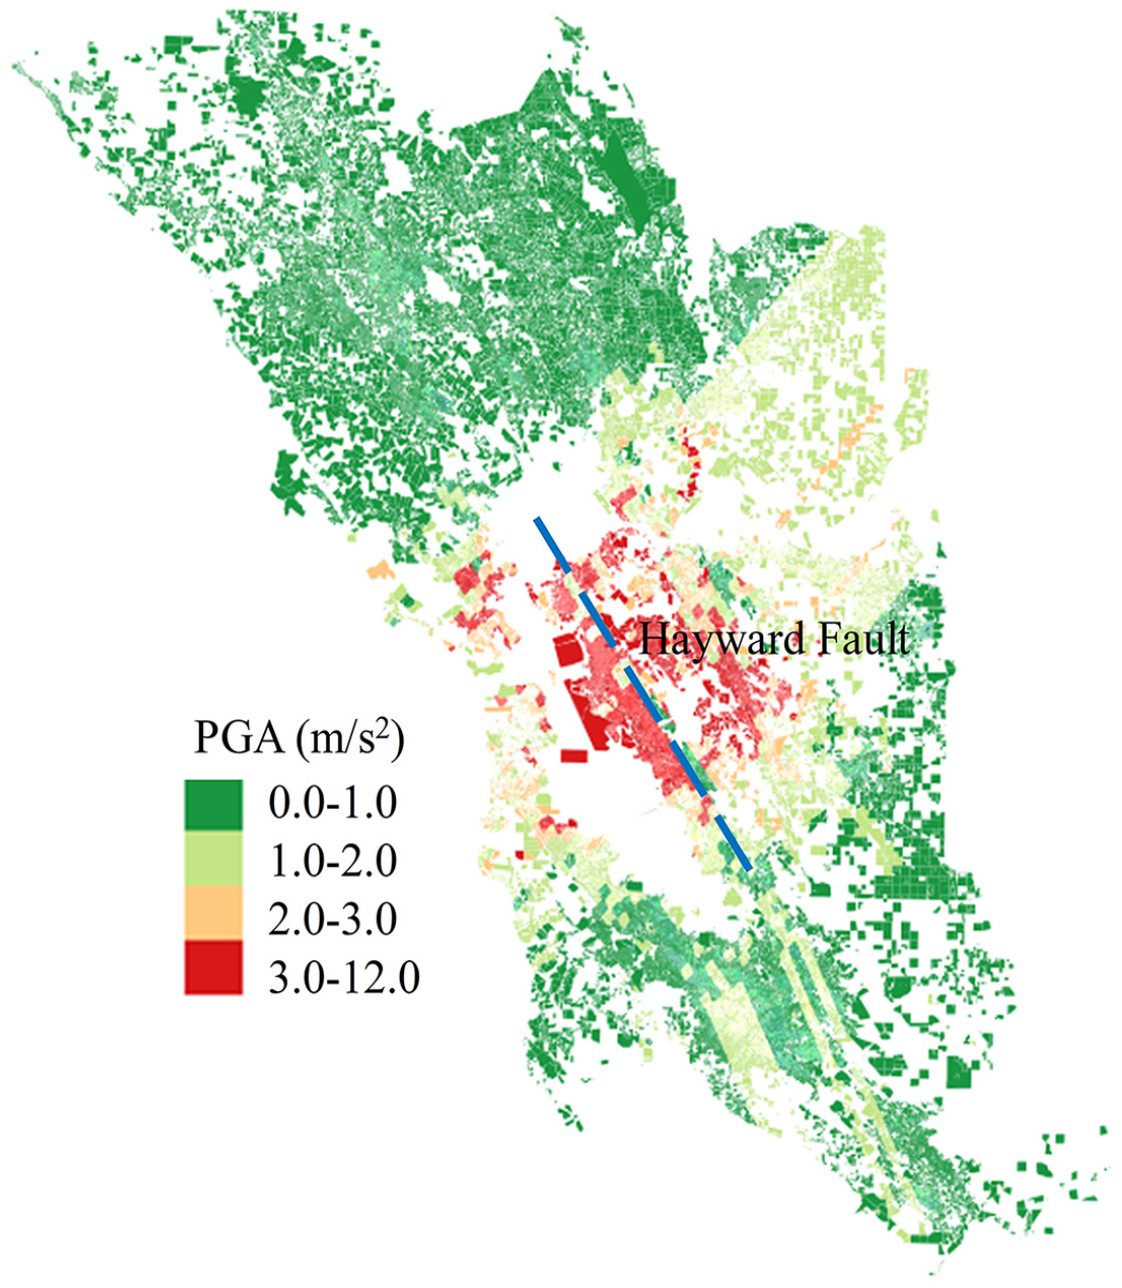
Distribution of input ground motion PGA for each building.
Analysis of typical buildings
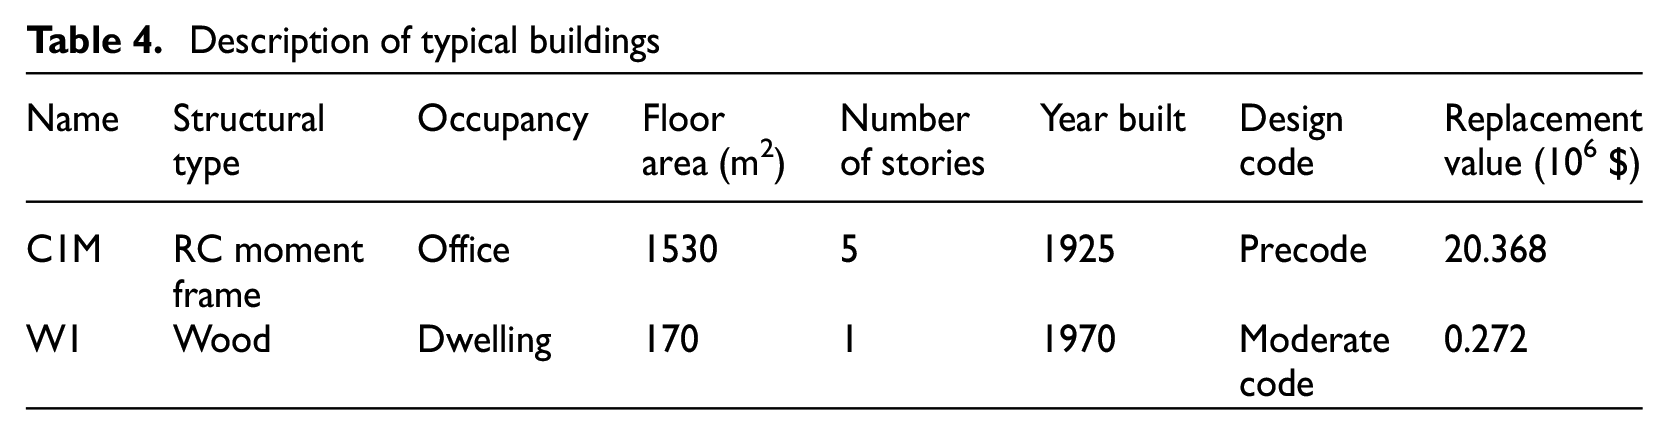
To describe the entire SimCenter Workflow analysis process in detail, seismic damage simulations of two typical buildings (Table 4) in the Bay Area are performed. For each building, the SimCenter Workflow executes the following steps:
Given the building tag, the Building Model module produces a building information model (BIM) file (BIM.json) from the UrbanSim (2018) GIS database. The BIM.json files for the two typical buildings are shown in Figure A1.
Given the location of the building provided in the BIM.json file, the Create Event module produces an Event.json file. This file contains the input ground motion for that building obtained from the database of simulated ground motions. The time histories of the input ground motions for the two typical buildings (grid points S_28_28 and S_30_35) are shown in Figure 9 as examples.
Given the building information and ground motion (from the BIM.json and Event.json files, respectively), a structural analysis model (SAM) file is then created by the Create SAM module. The capacity curves for the two typical buildings predicted by the SimCenter Workflow and the HAZUS method are shown in Figure 11, and are very similar.
Given the BIM.json, Event.json, and SAM.json files, the Create EDP module identifies the types of EDPs required for subsequent damage and loss calculations of the building.
A nonlinear THA of the SAM.json and Event.json files is then performed to calculate the EDPs using pre- and post-processors and the OpenSees (McKenna, 2011) application. The seismic responses of the two typical buildings are shown in Figures 12 and 13, respectively, from which the EDPs of the buildings can be obtained. These outputs provide the foundation for the seismic loss assessment. The roof displacements of the two typical buildings predicted by the SimCenter Workflow and the HAZUS method are compared in Figure 14. It should be noted that although the capacity curves in Figure 11 are very similar to each other, there are some differences on the roof displacements predicted by the SimCenter Workflow and the HAZUS method because they use different analysis methods (i.e. static analysis vs. time history analysis). The nonlinear THA of the SimCenter Workflow can fully represent the features of different ground motions and buildings (Lu et al., 2017). Meanwhile, only the intersection point between the demand spectra and the capacity curve can be obtained using the HAZUS method, whereas the entire seismic response (e.g. acceleration, velocity, and displacement) of each story can be obtained using the proposed workflow, which is significant for loss estimation.
Finally, given the BIM.json and EDPs, the Create DL module provides damage and loss estimates. The seismic losses of the two typical buildings predicted by the SimCenter Workflow and the HAZUS method are shown in Figure 15. Similar to the discussion in Figure 14, generally speaking, the losses predicted by the SimCenter Workflow and the HAZUS method are similar to each other. There are still some differences because they use different prediction methods. Especially for the C1M structure, the loss ratios calculated by the SimCenter Workflow are higher than those determined by the HAZUS method. The reason is that the HAZUS method underestimates the seismic loss of the nonstructural acceleration-sensitive (NSA) component for this structure. Specifically, the NSA loss ratio in the HAZUS method is only 0.17%. However, according to the FEMA P-58 component database, the repair costs for NSA (e.g. elevators and chillers) will result in a significantly larger economic loss. For instance, there are approximately three chillers (D3031.012b) in the C1M building according to the Estimation Tool (FEMA, 2012b). Chillers are fragile and expensive (Figure A2), resulting in a loss ratio of up to 1.02%. However, such nonstructural component loss is obviously underestimated in the HAZUS method. Note that FEMA P-58 method can provide a more accurate prediction if the information of the structural and nonstructural components in the buildings are clearly specified.
Description of typical buildings
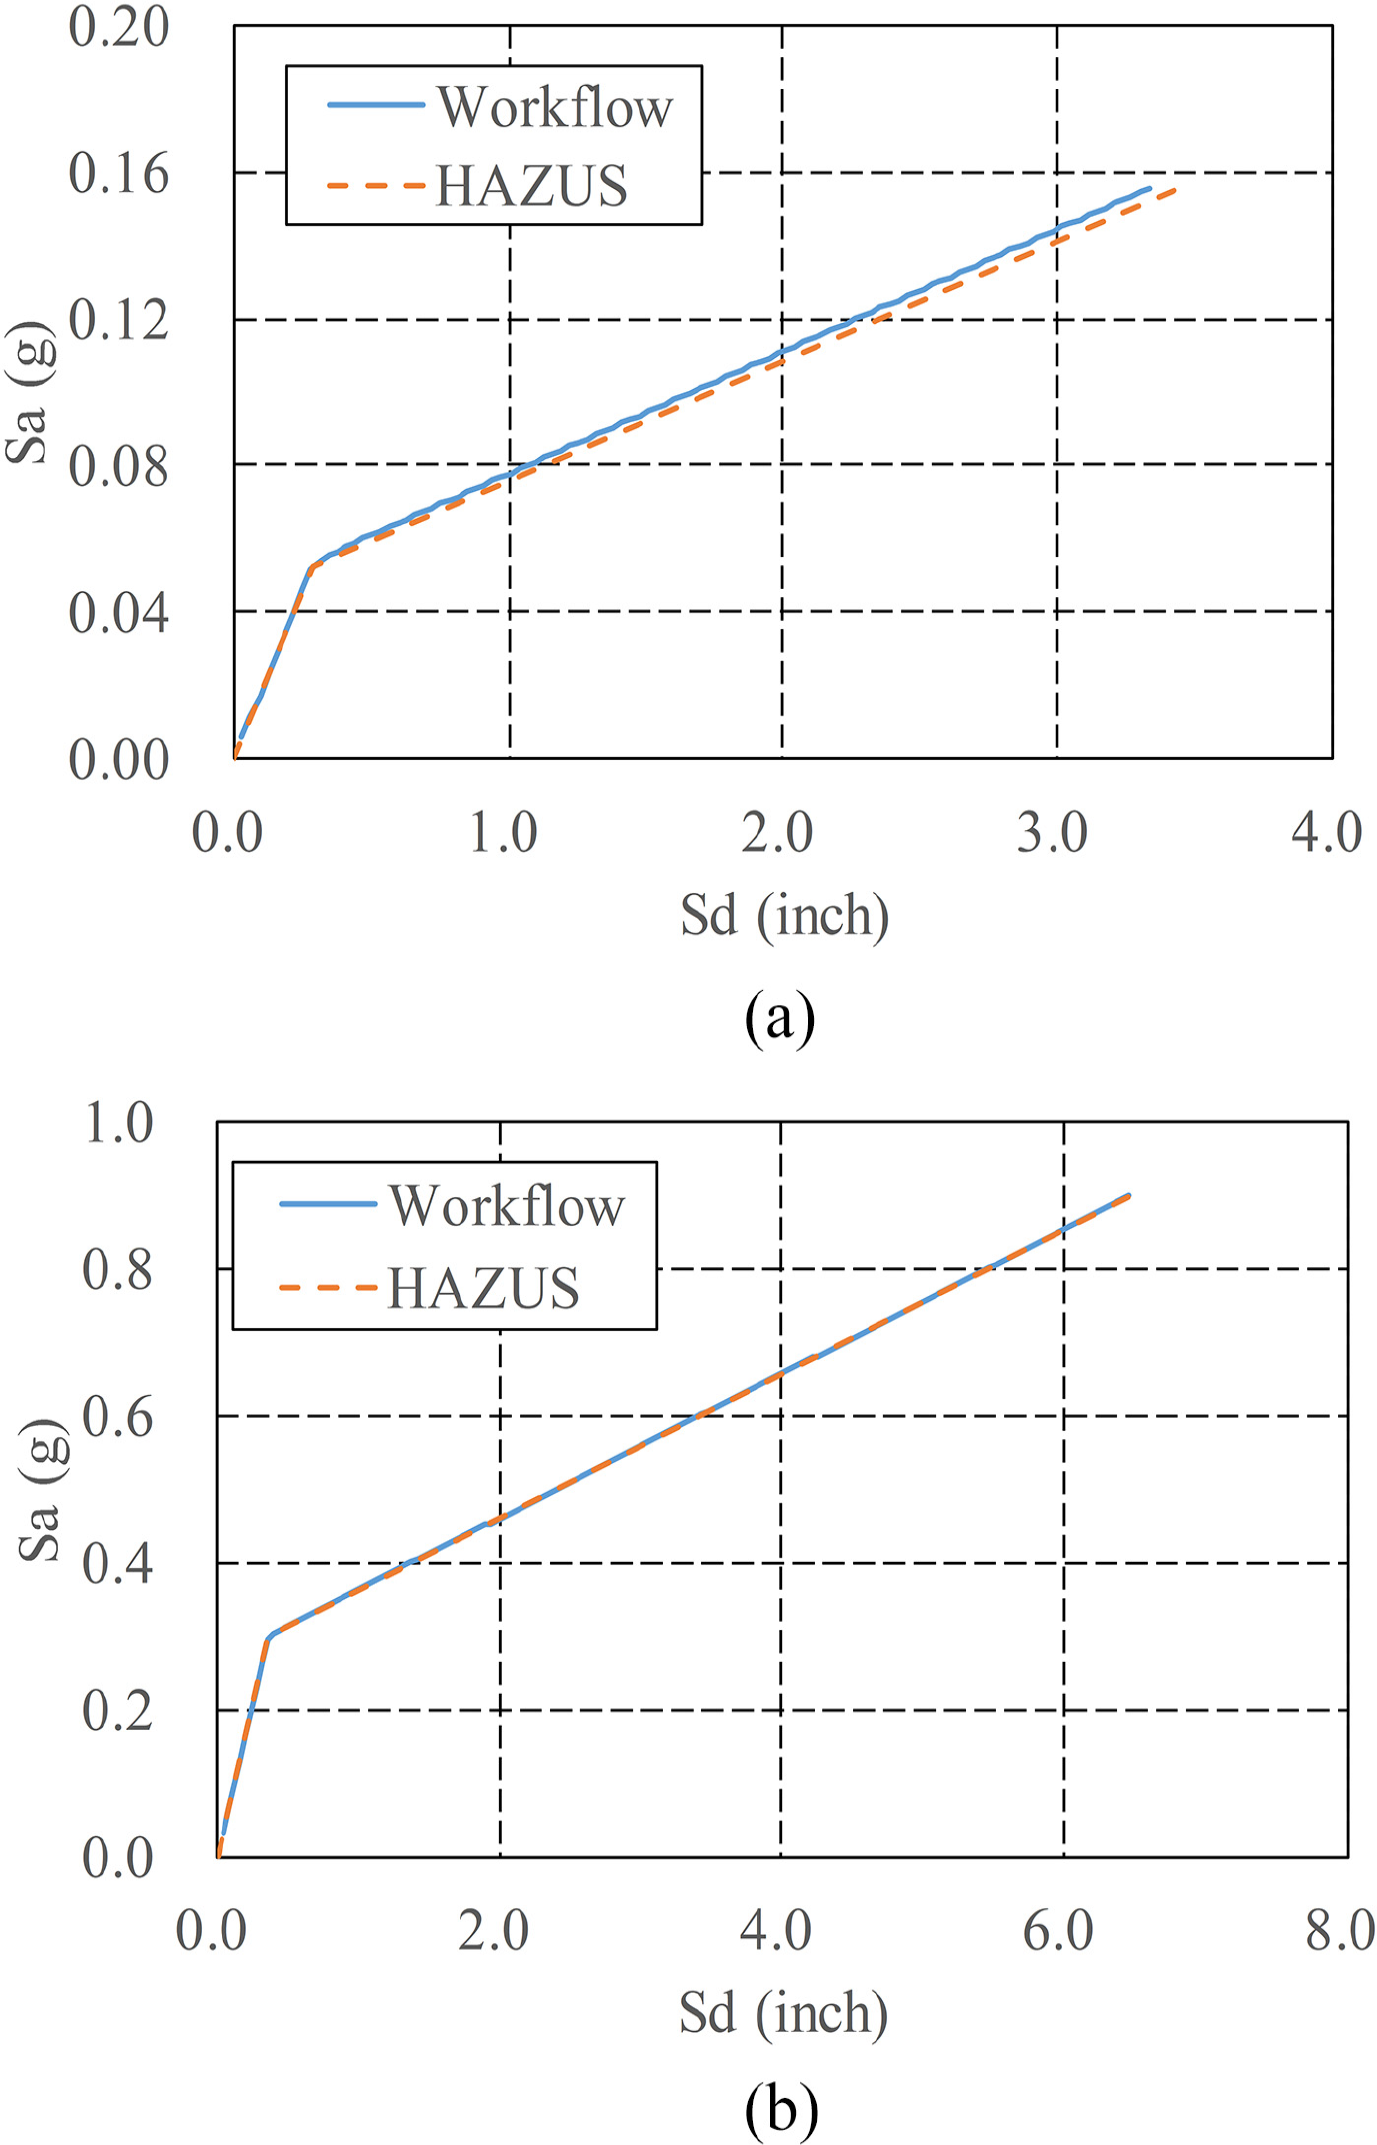
Comparison of the capacity curves: (a) C1M; (b) W1.
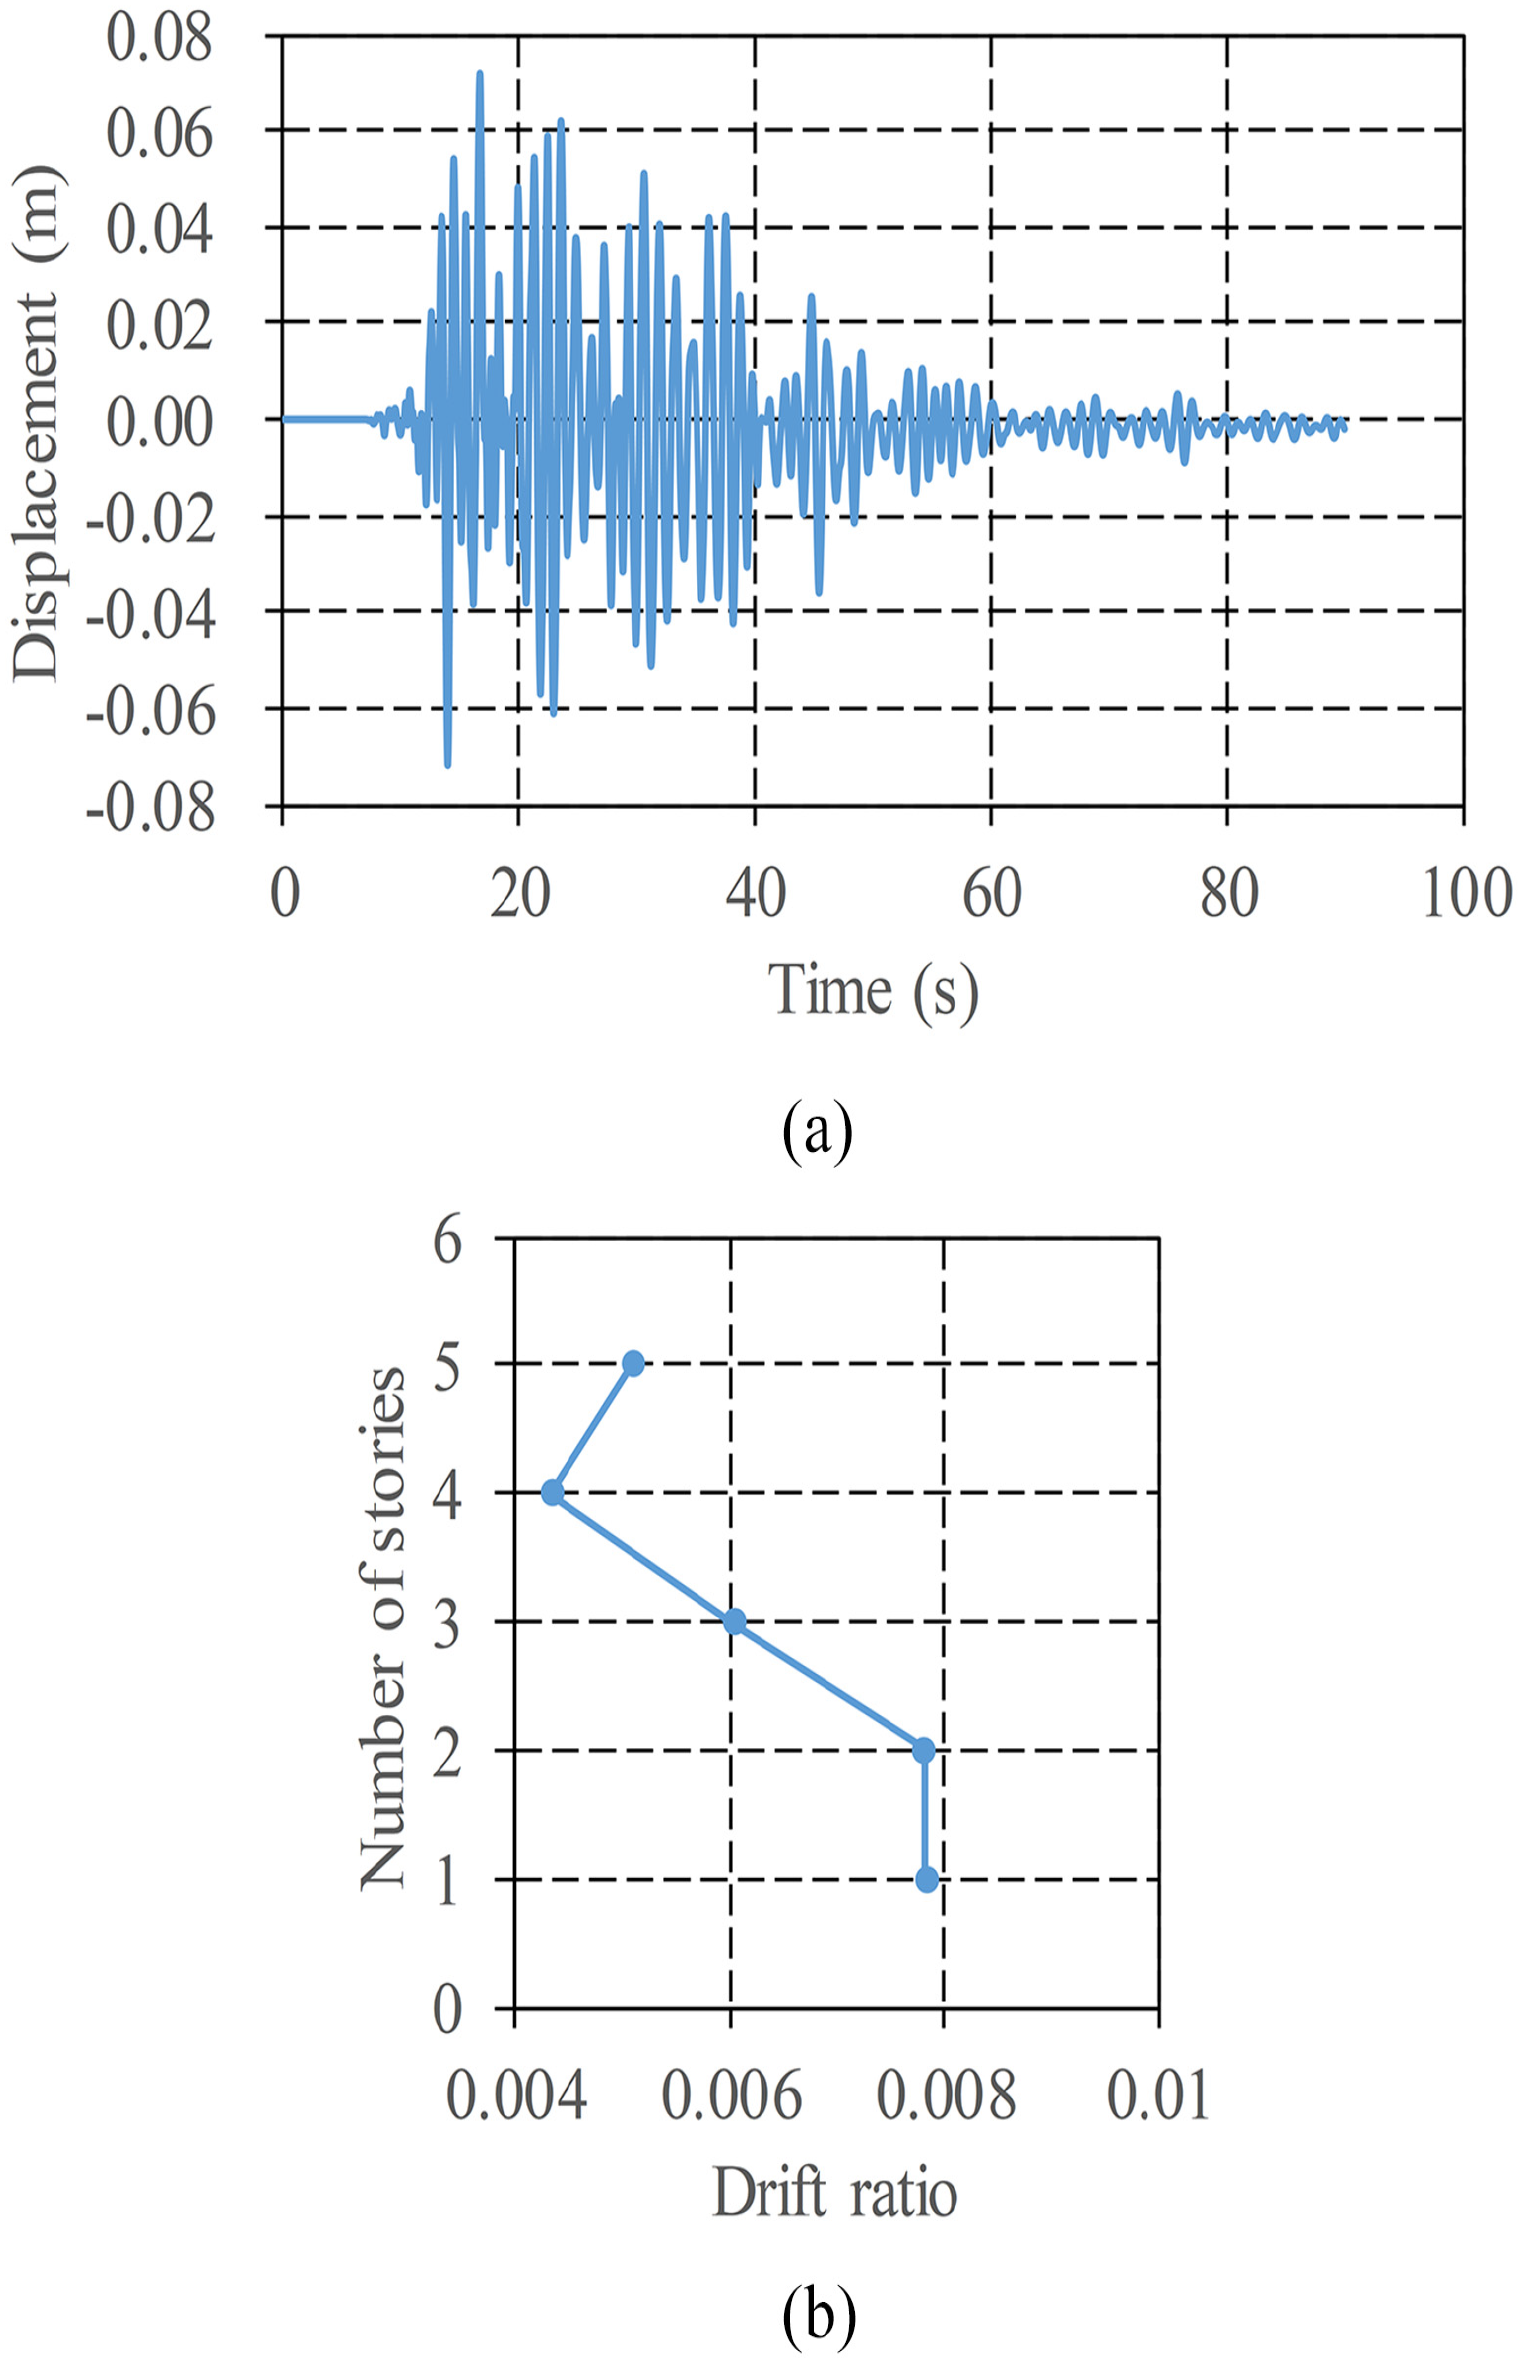
Seismic responses of C1M: (a) top displacement versus time history; (b) peak inter-story drift ratio
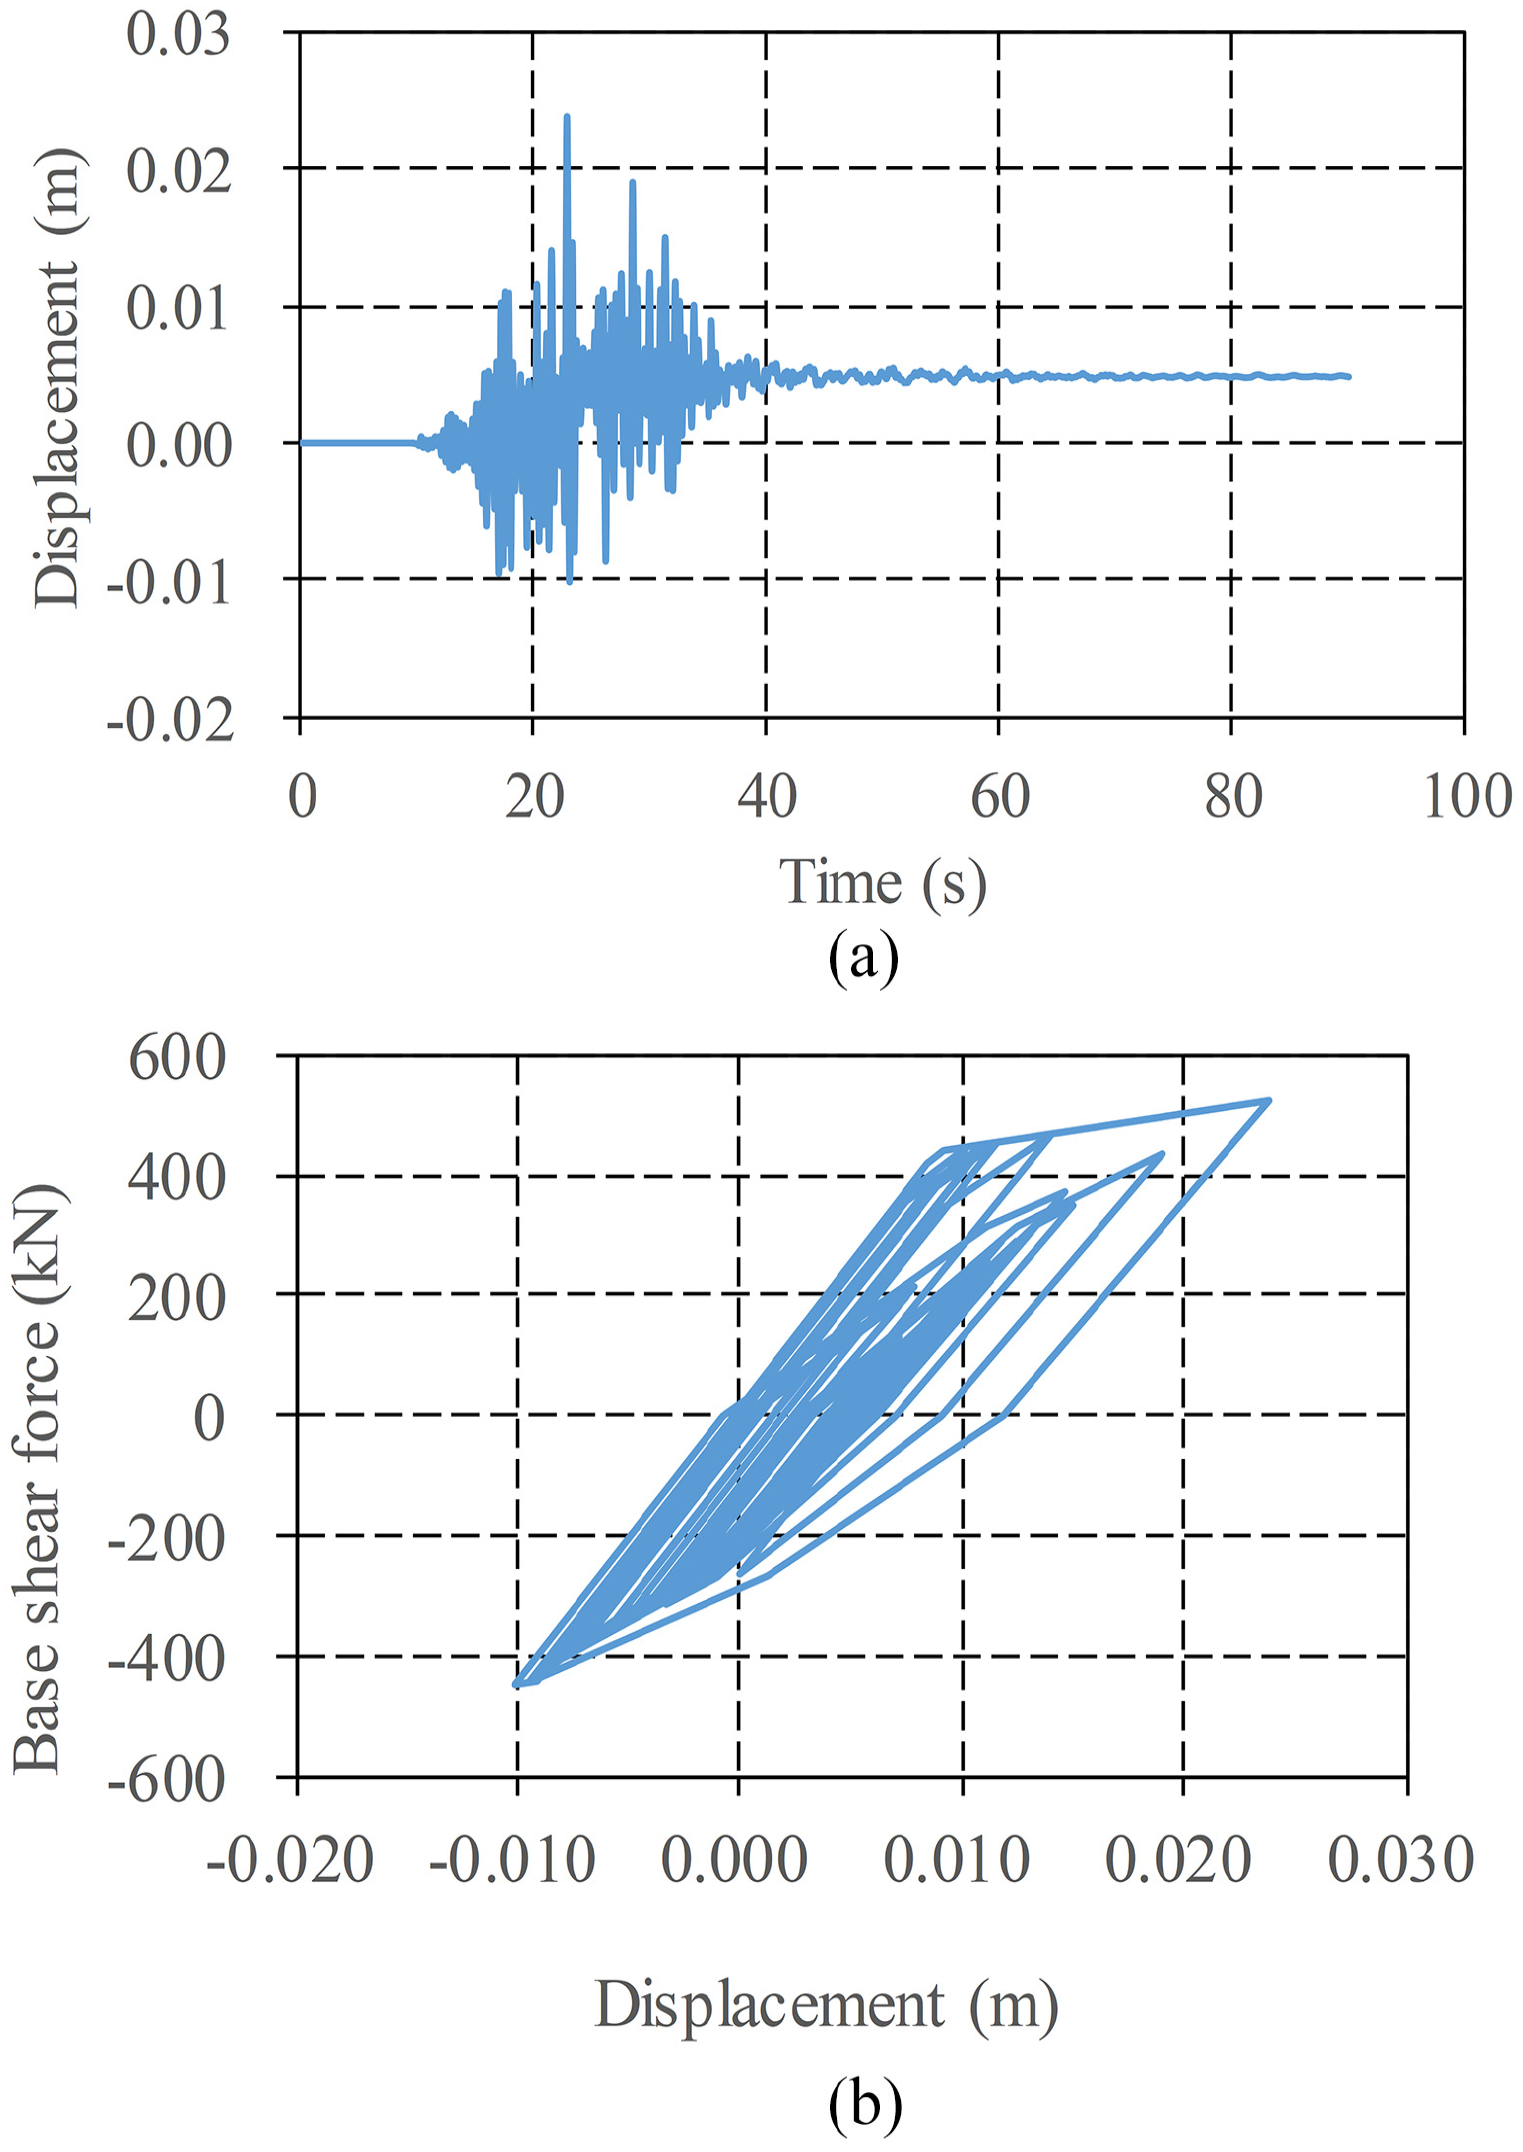
Seismic responses of W1: (a) top displacement versus time history; (b) lateral hysteretic behavior in the bottom story.
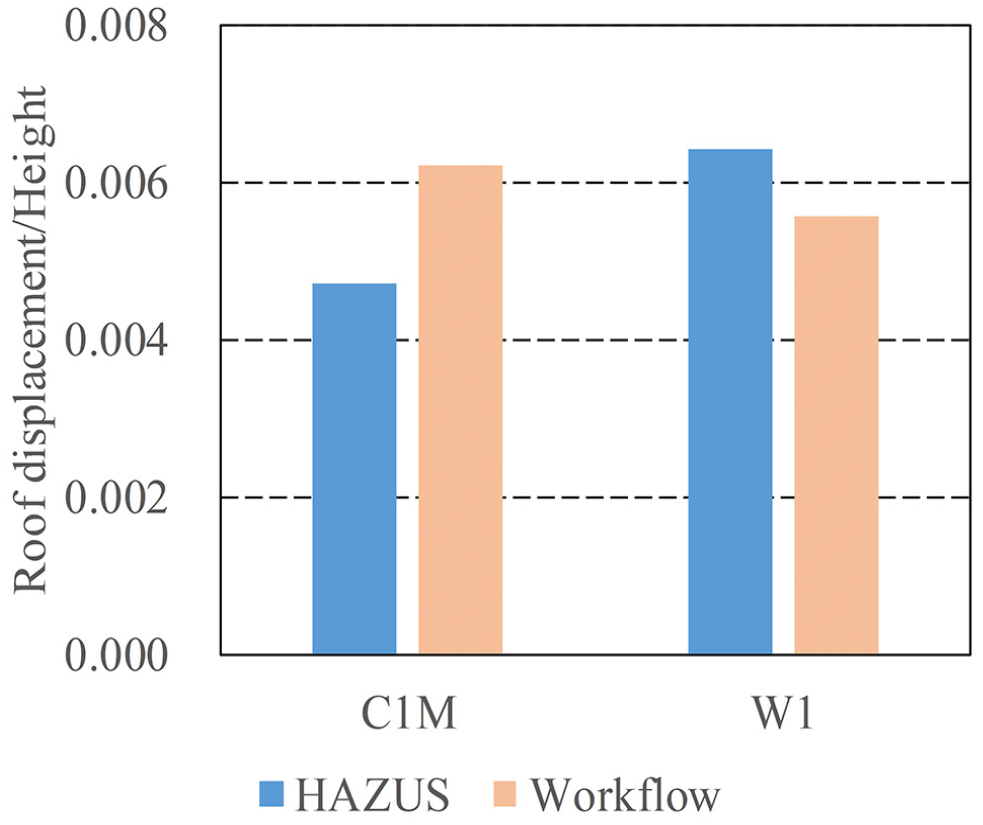
Comparison of roof displacements.
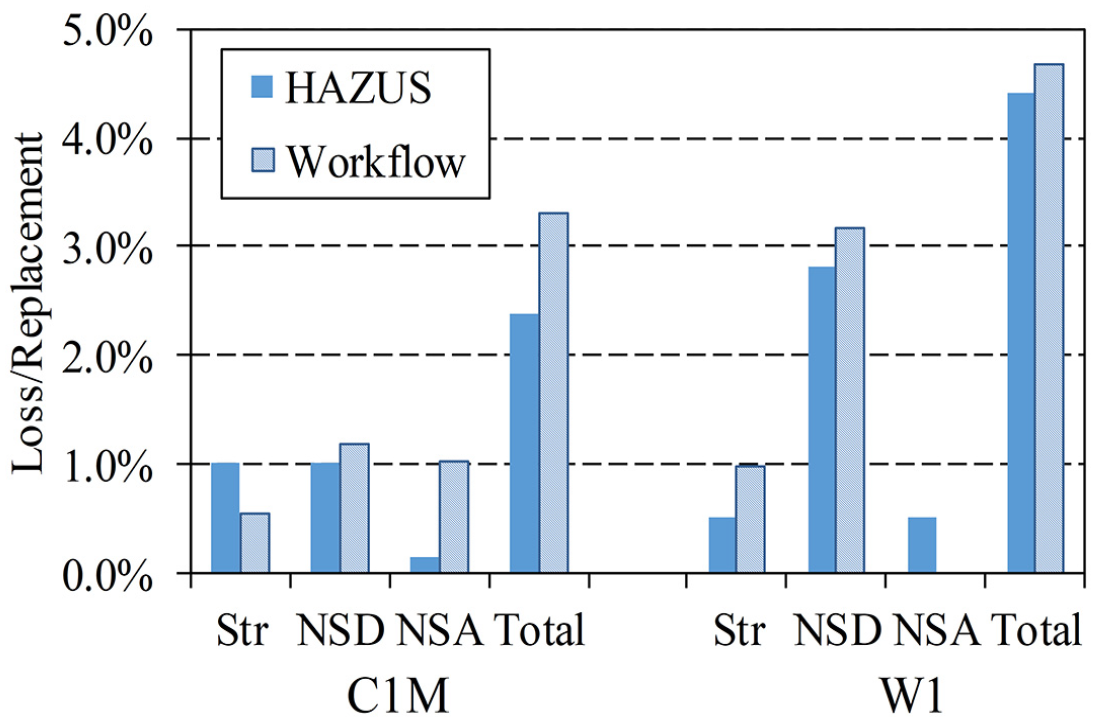
Comparison of seismic losses.
This section describes each step of the SimCenter Workflow in detail, through which simulation of the entire process from earthquake fault to building loss can be achieved. Note that the entire SimCenter Workflow procedure is open-source for the convenience of future scientific research.
Distribution of building losses
Using the building information and input ground motion, the distribution of the median building loss ratios and repair/rebuilding times were computed with the SimCenter Workflow for all buildings. The results are as shown in Figures 16 and 17, respectively. Such distributions can provide emergency responders information that can be used in planning disaster scenarios and provide city planners an understanding of disaster risk, and allow them to explore possible prevention and mitigation strategies that might be effective in earthquake-prone urban areas. Overall, the distribution pattern of the loss ratio and repair/rebuilding times are similar to the distribution pattern of the input ground motion PGA for each building. Buildings with a loss ratio greater than 60% accounted for 7.5% of the total buildings, of which 62.6% were single-story wood structure built before 1973. Therefore, single-story wood structures built before 1973 are potential weak buildings in the Bay Area.
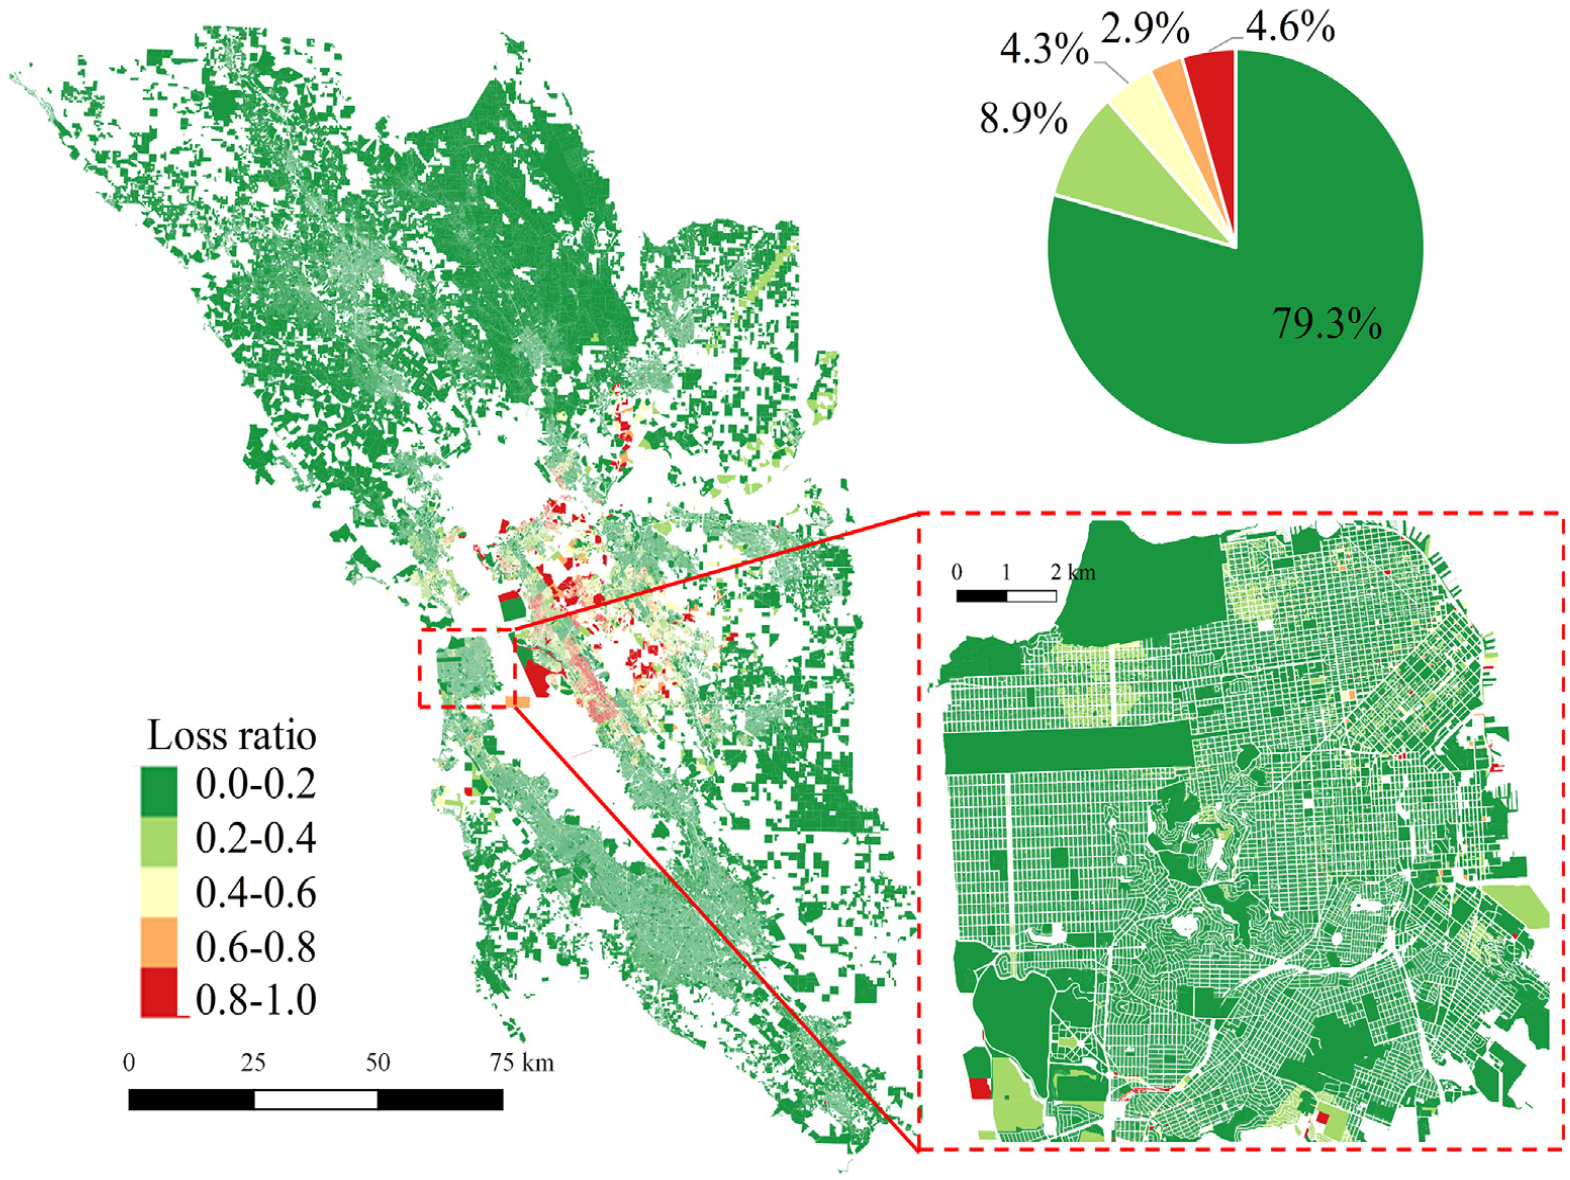
Distribution of median building loss ratios in the Bay Area.
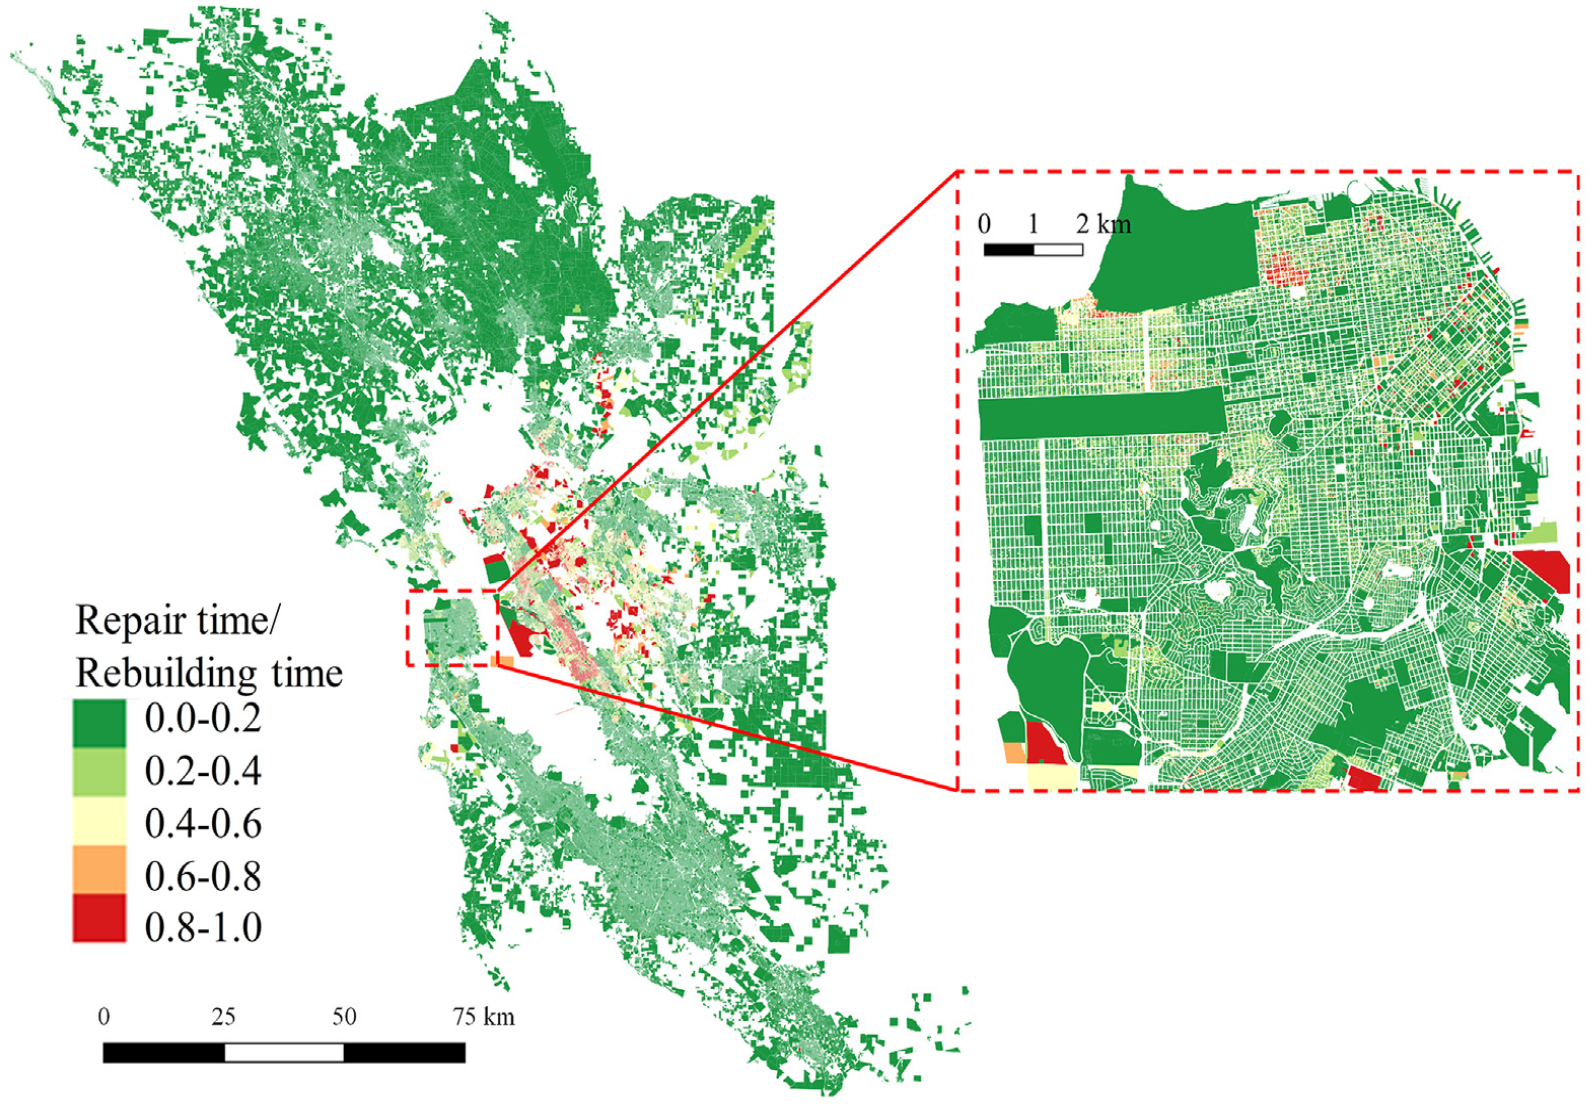
Distribution of the median building repair/rebuilding time in the Bay Area
Detweiler and Wein (2018) performed a similar simulation based on the Hayward Scenario using the HAZUS method. The distribution of the building damage ratio given by Detweiler and Wein (2018) is similar to the results calculated by the SimCenter Workflow, namely, the region near the HayWired fault is the area with high building damage ratio. It is important to point out that the results of the SimCenter Workflow are more fine-grained as they are analyzed on the building level, whereas the results of the HAZUS analysis in the Hayward Scenario are aggregated over zip code areas. In addition, the seismic loss of the component in the building can be given by the SimCenter Workflow because it incorporates the FEMA-P58 method.
It should be noted that the computational expense of the SimCenter Workflow is acceptable. And the simulation of the Bay Area case study can be finished within three days using three desktop computers (with Inter(R) Xeon(R) CPU E5-2630 v3 @2.40 GHz).
To further demonstrate the advantages of the proposed technique, the 3D dynamic visualization method proposed by Xiong et al. (2015) is used in this study. The buildings in downtown San Francisco are selected as a demonstration, and the results are shown in Figure 18, its animation is available in the electronic supplement (Animation 1). Different color contours in Figure 18 represent different displacement magnitudes, and the seismic response of each story in every building is visualized realistically. This type of information can provide an understanding of disaster risk to planners and policymakers to explore possible building mitigation and resilience strategies that might be effective in earthquake-prone urban areas.
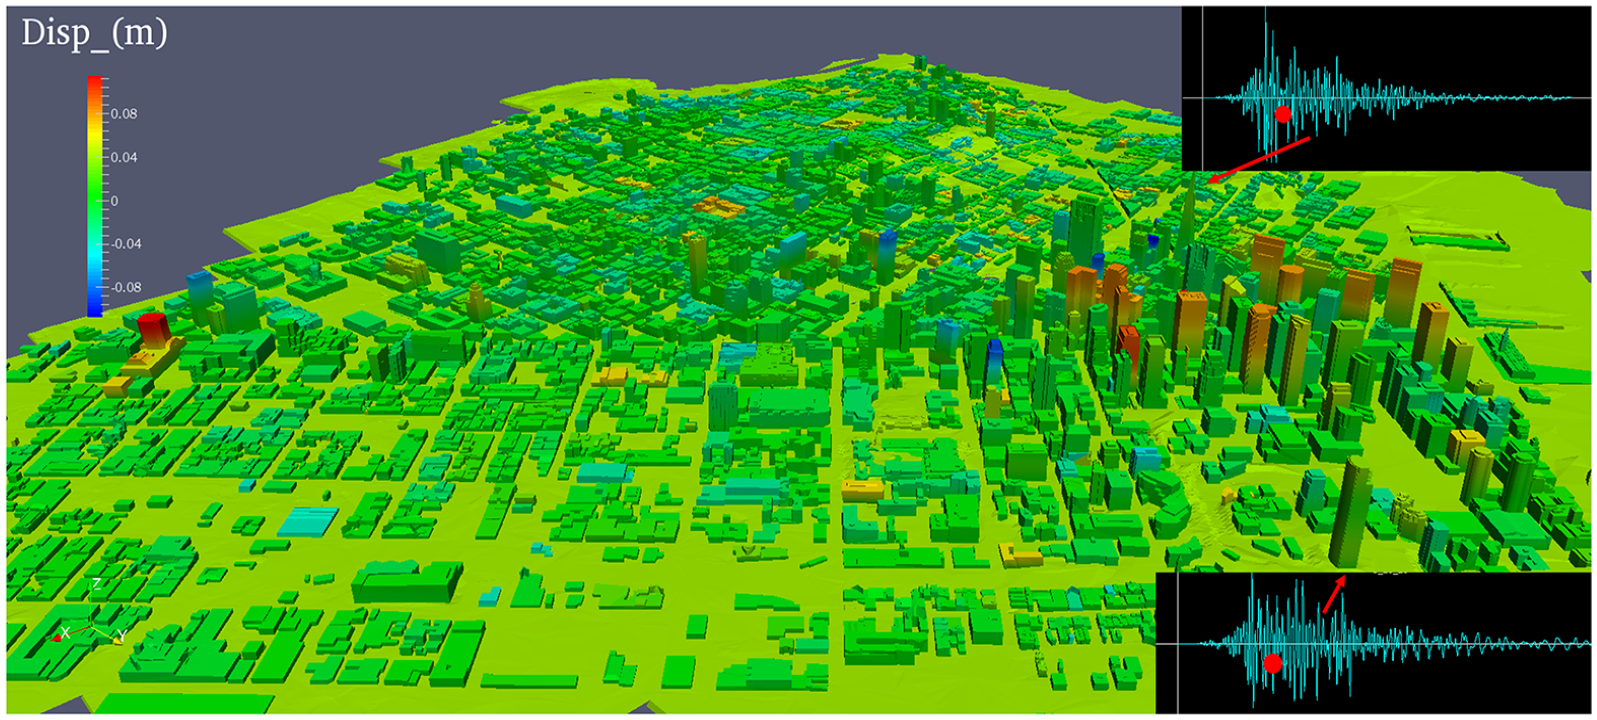
Visualization of the seismic response of buildings in downtown San Francisco (t = 13.2 s).
Conclusion
An open-source general-purpose scientific workflow application for seismic damage simulation and loss prediction, SimCenter Workflow, is presented in this study using the city-scale nonlinear time history analysis. To introduce the SimCenter Workflow process in detail and illustrate its advantages, a seismic damage simulation and loss prediction for 1.8 million buildings in the San Francisco Bay Area were performed using this application. The main conclusions are as follows:
The SimCenter Workflow can serve as a convenient open-source platform for seismic damage simulation of buildings in large urban areas.
Compared with the widely used HAZUS method, the Workflow can provide more detailed information for seismic loss assessment owing to the usage of actual building inventories, the MDOF models, the nonlinear THA of buildings, and the FEMA P-58 method.
The case study shows the applicability of the SimCenter Workflow in large-scale seismic damage simulation and loss prediction.
The open-source nature and the modularization of the SimCenter Workflow facilitate its extensibility, and thus make it practical for researchers to apply the SimCenter Workflow to seismic damage simulations in other regions.
Supplemental Material
supplemental_material – Supplemental material for An open-source framework for regional earthquakeloss estimation using thecity-scale nonlinear time history analysis
Supplemental material, supplemental_material for An open-source framework for regional earthquakeloss estimation using thecity-scale nonlinear time history analysis by Xinzheng Lu, Frank McKenna, Qingle Cheng, Zhen Xu, Xiang Zeng and Stephen A Mahin in Earthquake Spectra
Footnotes
Declaration of conflicting interests
The author(s) declared no potential conflicts of interest with respect to the research, authorship, and/or publication of this article.
Funding
The author(s) disclosed receipt of the following financial support for the research, authorship, and/or publication of this article: The authors are grateful for the financial support received from the National Natural Science Foundation of China (No. U1709212). The SimCenter is supported through a grant provided by the National Science Foundation (#1612843).
Supplemental material
Supplemental material for this article is available online.
References
Supplementary Material
Please find the following supplemental material available below.
For Open Access articles published under a Creative Commons License, all supplemental material carries the same license as the article it is associated with.
For non-Open Access articles published, all supplemental material carries a non-exclusive license, and permission requests for re-use of supplemental material or any part of supplemental material shall be sent directly to the copyright owner as specified in the copyright notice associated with the article.