
Abstract
Background:
Malnutrition remains a major public health challenge in Ghana, especially among children aged 6 to 59 months. While conventional anthropometry is accurate, it is resource intensive. The Paediatric Nutrition Screening Tool (PNST) provides simpler alternative. We evaluated the diagnostic performance of PNST with standard anthropometric indices in a child welfare clinic in northern Ghana.
Methods:
A cross-sectional study involving 144 caregiver–child pairs was conducted. Children were assessed with PNST and anthropometric indices. Diagnostic accuracy was evaluated using sensitivity, specificity, predictive values, and kappa statistics. Regression analysis examined associations between PNST scores and anthropometry.
Results:
PNST demonstrated high specificity but low sensitivity: underweight (85.2%, 32.7%), stunting (93.3%, 16.4%), and wasting (88.8%, 29.1%). PNST scores were significantly associated with WHZ (β = –.40) and WAZ (β = –.37), but not with HAZ.
Conclusion:
PNST is a rapid, specific screening tool but requires supplementation with anthropometry and dietary assessments for comprehensive malnutrition detection.
Introduction
Malnutrition in children is a major global public health challenge that undermines physical growth, cognitive development, and overall well-being. Malnutrition does not only affect physical growth but also inflicts long-term consequences on cognitive development, particularly when illness or disease increases dietary requirements. 1 Worldwide, approximately 45% of fatalities among children under the age of 5 are linked to undernutrition, with the impact being most pronounced in low- and middle-income countries (LMICs) (UNICEF). 2 In Ghana, the situation is equally concerning—17% of children under 5 are stunted, 6% wasted, and 12% underweight, with the northern regions bearing the highest rates; stunting prevalence in these areas ranges from 18% to 31%, with severe stunting affecting between 5% and 9% of children (Ghana Statistical Service [GSS] 3 and ICF). It is not only children’s physical nutritional status that poses a challenge in Ghana, but also the quality of their diets. Poor diet quality among children under 5 is common. According to the 2022 Ghana Demographic and Health Survey (GDHS), only 41% of children aged 6 to 23 months consumed the minimum number of food groups during the preceding day, and just 47% met the minimum meal frequency (Ghana Statistical Service [GSS] and ICF). These alarming statistics highlight the urgent need to address malnutrition in its early stages to prevent irreversible damage. Early detection of malnutrition is therefore critical to preventing consequential impairments that can affect a child’s development and future potential.
In Ghana, regular monitoring of children’s nutritional status is carried out through the Growth Monitoring and Promotion (GMP) component of the Child Welfare Clinic (CWC) within the Ghana Health Service. This process involves taking monthly anthropometric measurements (weight and age) and plotting them on standardized growth charts in a child welfare book, under the assumption that a child’s weight should consistently increase with age. Alongside this, caregivers receive nutrition education via group sessions and individualized counseling—especially in cases where a child’s weight gain falters—to enhance child care and feeding practices.4,5 Despite its widespread use, this system may not be sensitive enough to detect children who are at the borderline of malnutrition as it does not have a comprehensive and systematic assessment of the dietary risk of children. Dietary indicators such as frequency of meals, dietary diversity, and diet adequacy which can inform the dietary adequacy of children are usually not taken. Thus, the majority of children may be missed out but may be at risk of dietary inadequacy. Globally, well-accepted indices such as weight-for-height and body mass index (BMI)-for-age Z-scores are used to detect malnutrition. However, these objective anthropometric measures often fail to capture the early stages of nutritional decline, thus delaying necessary interventions. 6 In response, nutrition screening tools like the Paediatric Nutrition Screening Tool (PNST) have been developed to rapidly identify children at risk of malnutrition within hospital settings. Nonetheless, the application and effectiveness of the PNST in the community-focused CWC setting remain underexplored, and its comparative performance against routine anthropometric measures is unclear. While the current approach relying on anthropometric measurements under the GMP program provides valuable information, it may miss the early warning signs of nutritional deficits or risk of dietary inadequacy, especially among children who are on the borderline of malnutrition. This gap is particularly critical in Ghana, where the prevalence of malnutrition poses a significant public health threat, especially within its northern regions. Early and accurate detection methods are needed to prompt timely interventions and prevent long-term developmental consequences. We evaluated the sensitivity and specificity of the PNST in detecting malnutrition among children aged 6–59 months at the CWC, an out-patient preventive care setting, of a health facility in northern Ghana. In addition, we compared the malnutrition risk identified by the PNST with that determined through anthropometric assessments.
Methods
Study Design and Study Area
We conducted a cross-sectional study between January and April 2022 at Tamale Central Hospital, located in the Tamale Metropolis—one of the sixteen administrative districts in the Northern Region. As one of two government hospitals in the Tamale Central sub-district, this facility is equipped with diverse clinical units, including the outpatient department, antenatal care and labor ward, theatre, emergency department, nutrition department, and CWC. This setting provided a comprehensive spectrum of routine paediatric services, making it an ideal site for the study. The cross-sectional design made it possible to capture a snapshot of the nutritional status and associated factors among children attending routine visits, thereby minimizing variations that could affect the outcomes.
Study Population, Inclusion and Exclusion Criteria
The study population consisted of both male and female children aged 6 to 59 months who attended routine visits at the CWC of Tamale Central Hospital. The clinic, operating on weekdays, offers services such as growth monitoring, health promotion, and routine immunizations. Sampling children during their routine visits ensured a representative sample of the general paediatric population served by the clinic, thereby enhancing the external validity of the study. To be included, children had to be within the 6 to 59 months age range and attend the CWC during the study period. Verbal informed consent was obtained from their parents or guardians before enrollment. Children with a clinical diagnosis of malnutrition were excluded, as including them could have biased the assessment of the screening tool’s effectiveness in detecting previously unrecognized nutritional risks. This careful selection process ensures that the study accurately evaluates malnutrition risk in a population representative of routine paediatric care while minimizing confounding factors
Recruitment, Sampling and Sample Size and Data Collection Procedure
We recruited 144 caregiver-child pairs from the waiting areas of the CWC at Tamale Central Hospital. Eligible caregivers of children aged 6 to 59 months attending routine services were selected using a purposive, consecutive sampling approach. This method ensured that we maximized recruitment efficiency despite time constraints and relatively low daily attendance at the clinic. Permission was first obtained from the Nurse In-charge to enter the waiting area. We then informed caregivers of the study’s objectives, provided clear explanations of the research purpose, and obtained verbal informed consent. After consent, we assisted participants in completing the online questionnaire. This approach balanced logistical feasibility with ethical rigor and ensured the collection of timely, relevant data.
Data Collection Methods
We administered structured questionnaires to parents/caregivers using online Google Forms. The questions were drafted in plain English and, when necessary, verbally translated into Dagbani—the local language—to ensure clear understanding. This dual-language approach was essential to maximize comprehension and participation in the study. The questionnaire comprised 4 parts. The first part collected demographic and socio-economic data, including the child’s age and sex, and the caregiver’s age, sex, religion, education, marital status, occupation, and financial capacity to provide food. This information is critical as socio-economic factors significantly influence nutritional status and access to food. The second part assessed feeding practices and dietary diversity based on caregivers’ recall of the child’s consumption over the previous day. Derived from the Food and Agriculture Organization’s knowledge, attitudes and practices concerning nutrition and feeding of infants and young children, a previously validated tool, 7 questions covered breastfeeding frequency, the number of complementary feeding occasions, and the types of foods provided. We categorized foods into 7 groups—grains, roots and tubers; legumes and nuts; dairy products; flesh foods; eggs; vitamin A-rich foods; and other fruits and vegetables—and calculated a dietary diversity score by summing the number of food groups consumed. This measure is a validated proxy for overall dietary quality and nutrient adequacy. 7 The third part employed the Paediatric Nutrition Screening Tool (PNST), which consists of 4 questions assessing recent weight loss, poor weight gain, reduced intake, and visible underweight status.8,9 The PNST was designed for simplicity in screening hospitalized children, with questions chosen for ease of use and minimal space on admission forms already crowded with clinical information.9,10 The PNST was administered by final-year medical students during their senior clerkship, who received extensive training to ensure standardized and reliable application of the tool. A score of at least 2 indicates a risk of malnutrition, providing a rapid and simple screening method for acute nutritional deficits. 10 It’s been reported to have moderate validity and reliability in hospital settings.10,11 The fourth part involved anthropometric measurements of weight and height. All children were measured regardless of their scheduled services. We used a spring balance for most children and a weighing scale for those older than 2 years. Children aged 24 months and below had their length measured with an infantometer, while the height of older children was recorded using a stadiometer. This combined approach of structured questionnaires and objective anthropometric measurements enhances the ability to correlate self-reported data with clinical nutritional indicators, providing a comprehensive picture of both short-term and long-term nutritional status in the study population.
Data Analysis
The data taken with the google forms was transferred to Microsoft Excel and subsequently exported into the Statistical Package for the Social Sciences (SPSS) for data analysis. Frequencies and percentages were used to describe categorical variables of the participants. Means and standard deviation were used to summarize continuous variables were applicable. Anthropometric indices of the children were generated using the WHO Anthro software application to generate weight-for-age, weight-for-height and height-for-age z-scores. Children with z-scores below −2 standard deviations were classified as underweight, stunted, or wasted, respectively (WHO Multicentre Growth Reference Study Group). 12 This standardization is justified by its global recognition and application in assessing child nutritional status. Pearson correlation was conducted to determine the relationship among continuous variables including child’s age, age of mother/caretaker, total PNRS scores, WHZ, WHZ and HAZ. Cross-tabulation was used to measure sensitivity, specificity, negative and positive predictive values of the PNST compared to the anthropometric indices of the children. A P-value of less than .05 was set as the level of significance for all statistical analysis.
Ethical Approval and Informed Consent
Ethical approval was obtained from the University for Development Studies Institutional Review Board (Approval no. UDS/RB/021/22). Written informed consent was obtained from mothers/care givers prior to enrollment in the study.
Results
Socio-Demographic Characteristics of Participants
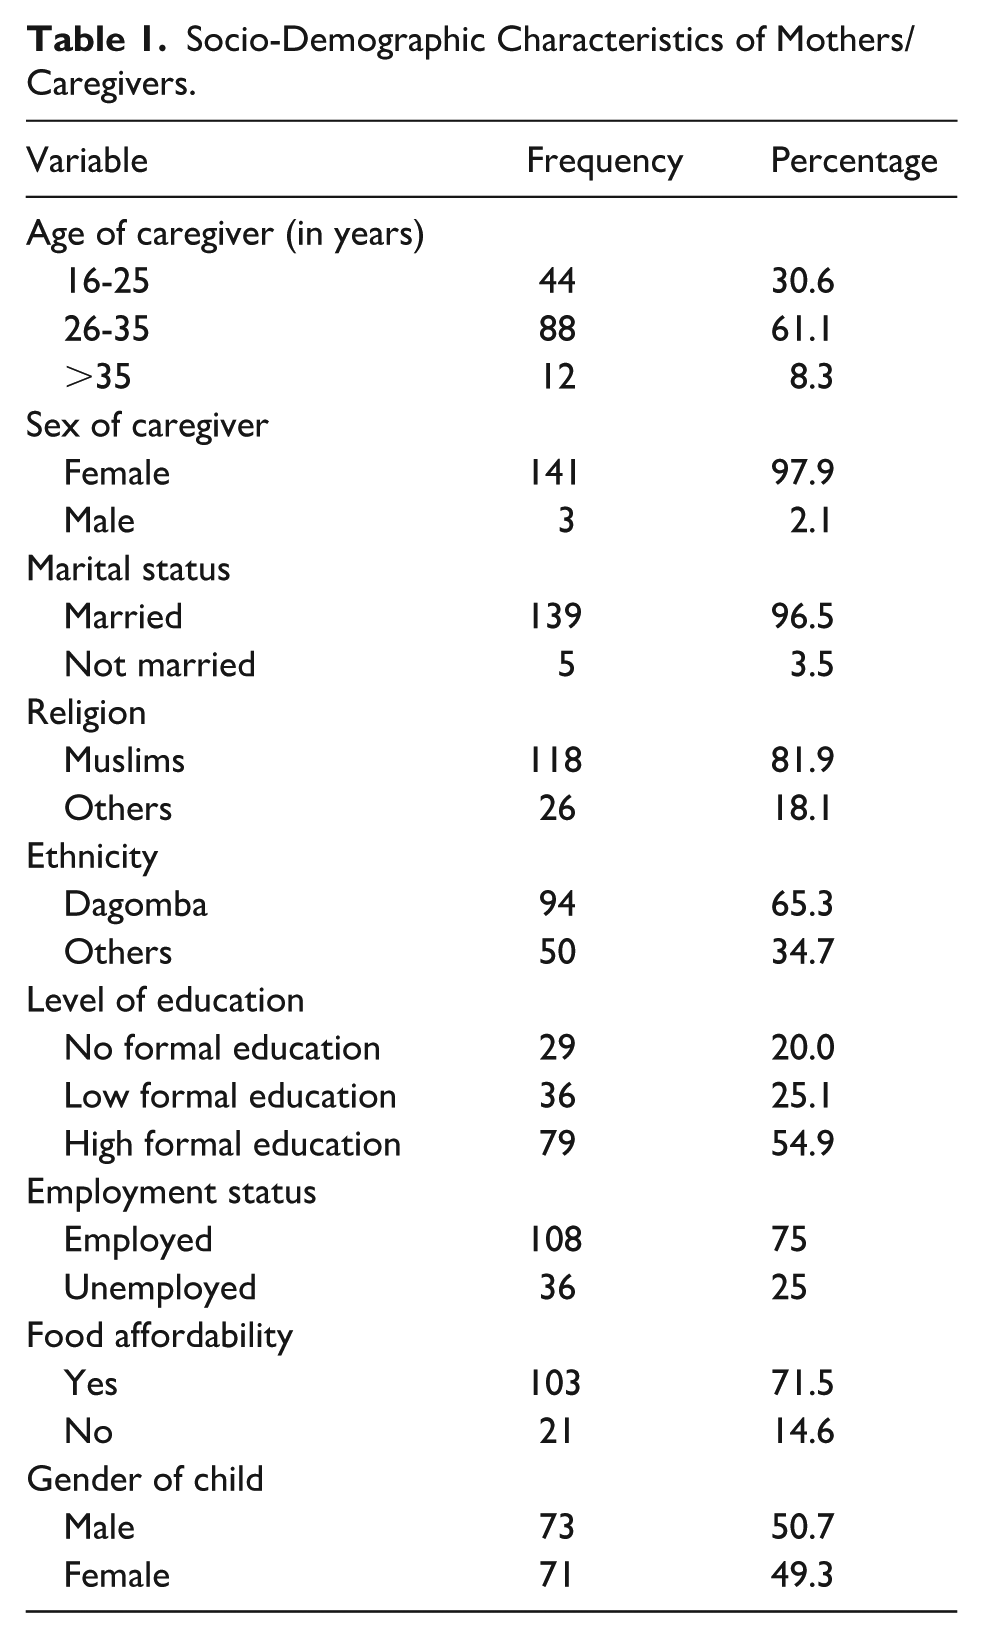
A total of 144 questionnaires were administered, and all were returned (100% response rate). Table 1 shows the socio-demographic characteristics of the participants. Majority of the mothers/caregivers were married (96.5%), 80% had some level of formal education and over 60% lived in urban Tamale. The mean (SD) age of the mothers/care givers and the children was 28.5(5.2) years and 12.5 (7.2) months respectively.
Socio-Demographic Characteristics of Mothers/Caregivers.
Feeding Practices and Dietary Diversity
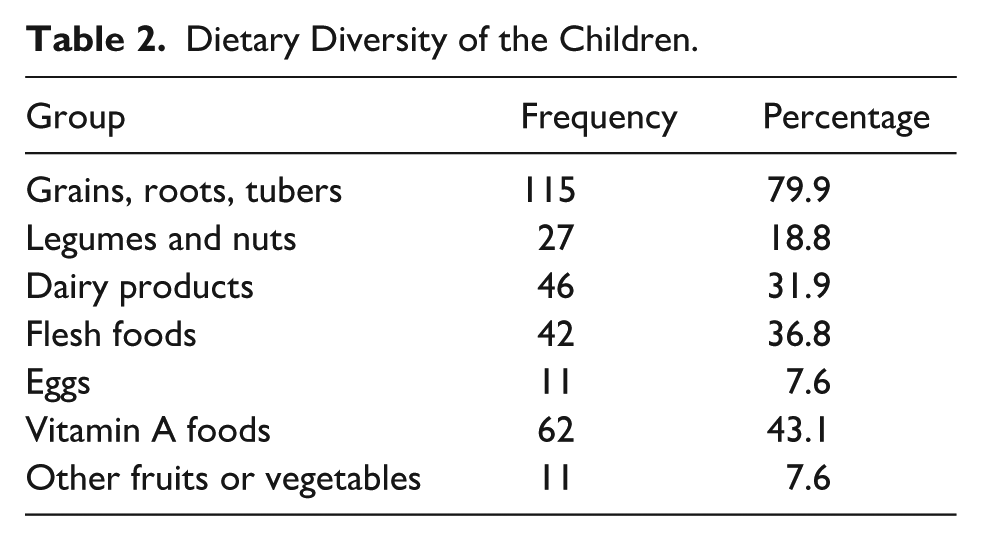
Eighty-five percent (n = 123) of the children were breastfed the night before the visit and 66.7% (n = 96) breastfeed at least 4 times daily, 4.2% (n = 6) twice daily, 14.6% (n = 21) thrice daily and 14.6% (n = 21) were not breastfed. Table 2 illustrates other foods the children were given and these were placed into 7 food groups. Only 7.6% (n = 11) children were fed fruits or vegetables the day before their visit to the CWC while majority (79.9%) of the children were fed foods containing grains, roots and tubers.
Dietary Diversity of the Children.
Nutritional Screening Using the Paediatric Nutrition Screening Tool (PNST)
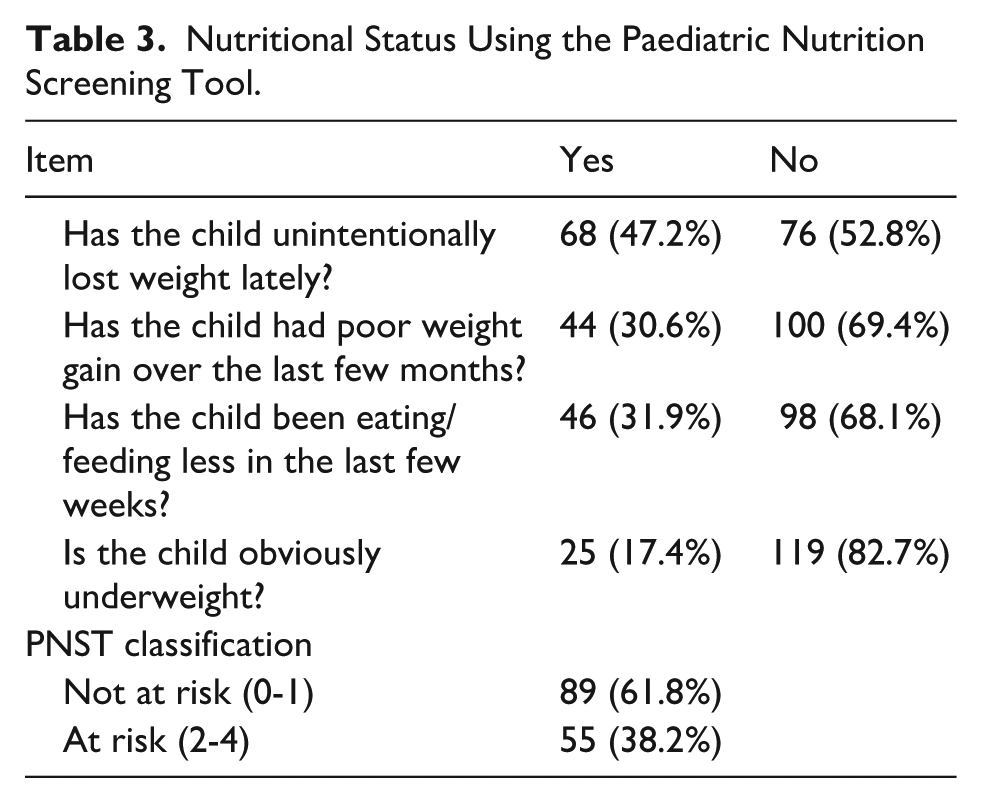
Table 3 describes the results from the nutrition screening of the children using the PNST. The mean (SD) PNST scores was 1.3(1.2). Also, 47.2% had lost weight unintentionally and 30.6% had poor weight gain over the last few months. Regarding screening status, 38.2% of the children were at risk of malnutrition.
Nutritional Status Using the Paediatric Nutrition Screening Tool.
Nutritional Status of the Children by Anthropometric Measurements and z-Scores
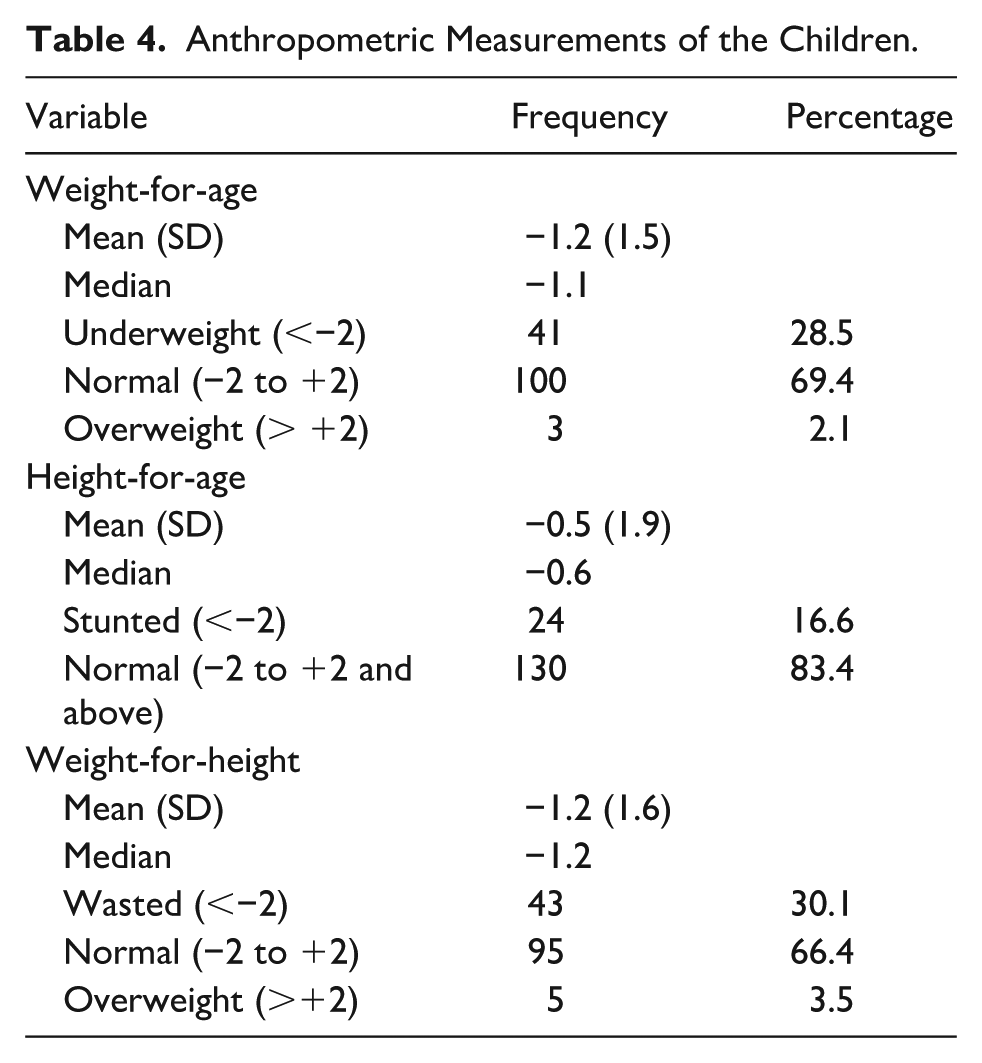
The mean (SD) weight and height of the children were 8.2(2.3) kg and 73.1(7.7) cm. Of the children who participated in this study, 28.5% (n = 41) of them were found to be underweight, 16.6% (24) were stunted and 30.1% (43) were wasted (Table 4)
Anthropometric Measurements of the Children.
Comparison Between PNST Scores and z-Scores
As shown in Table 5, PNST correlated negatively with WHZ (r = −0.316, P < .001, HAZ (r = −0.171, P < .05) and WAZ (r = −0.336, P < .001).
Correlation of Risk of PNST, z-Scores, Diet Diversity Scores and Age.

Abbreviations: DDS, dietary diversity scores; WHZ, weight-for-age z-scores; HAZ, Height-for-age z-scores; WAZ, weight-for-age z-scores.
P-value < .01, *P-value < .05.
Table 6 shows the diagnostic accuracy of the PNST compared to anthropometric measurements. For underweight, the PNST correctly identifies 85.2% of non-malnourished children but only detects 32.7% of those who are underweight by z-scores, resulting in a modest positive predictive value (58.1%) and negative predictive value (67.0%), with a kappa statistic of 0.20. For wasting, the PNST’s sensitivity stands at 29.1% while specificity is 88.8%, with a PPV of 61.5%, an NPV of 66.9%, and a kappa of 0.20.
Diagnostic Accuracy of the PNST Compared with Nutritional Status of the Children Based on z-Scores.

Underweight was defined as weight for age z-scores ≤ −2, Stunting as height for age z score ≤ −2 and Wasting was weight for height z score ≤ −2.
Abbreviations: PPV, positive predictive value; NPV, negative predictive value; AUC, area under the curve; PNST, paediatric nutritional screening tool.
Table 7 shows that higher PNST scores are significantly associated with lower WHZ and WAZ scores. Specifically, a one-unit increase in PNST score corresponds to a decline of 0.40 units in WHZ and 0.37 units in WAZ (both P < .001). In contrast, the PNST score was not significantly related to HAZ. Instead, higher dietary diversity was positively linked with HAZ (β = .33, P = .003), while increasing child age was negatively associated with HAZ (β = −0.07, P = .002).
Linear Regression Comparing PNST with WHZ, HAZ and WAZ.

Abbreviations: WHZ, weight-for-age z-scores; HAZ, height-for-age z-scores; WAZ, weight-for-age z-scores.
Discussion
This study evaluated the diagnostic performance of the Paediatric Nutrition Screening Tool (PNST) in identifying children at risk of malnutrition in an outpatient Child Welfare Clinic (CWC) setting. The PNST showed high specificity but low sensitivity across all anthropometric indices, with significant associations for weight-related indicators (WAZ and WHZ) than for height-for-age (HAZ). These findings confirm its utility in ruling out non-malnourished children but highlight its limitations in detecting chronic malnutrition.
In comparison with those of previous studies in hospital settings, the results demonstrated comparable or higher specificity but lower sensitivity. Carter et al. 8 reported sensitivity of 58%, specificity of 88%, and κ of 0.601, while White et al. found sensitivity values as high as 100% for WAZ and 60% for HAZ, alongside lower specificity estimates. 9 Ong and Chen similarly reported higher sensitivity but lower specificity than our study. 11 These differences may be partly explained by setting: hospitalized populations typically present with higher prevalence and severity of malnutrition, improving sensitivity, whereas outpatient populations, such as those attending CWCs, include relatively healthier children, leading to higher specificity but lower sensitivity.
The findings align with the PNST’s original purpose as a simple tool for rapid screening of hospitalized children.10,11
Despite the relatively low sensitivity observed in this study, our findings were consistent with previous research comparing the PNST against anthropometric indices, where both sensitivity and specificity scores for HAZ were generally low, but comparatively higher for WAZ and WHZ. Furthermore, regression analysis revealed that PNST scores were significantly associated with lower WHZ and WAZ, but not with HAZ, reinforcing its strength in detecting acute malnutrition (wasting and underweight) while being less effective in identifying chronic malnutrition (stunting). These results highlight the PNST’s utility in identifying weight-related nutritional risks and confirm its value for detecting acute conditions. Confirming the findings of this study, Becker et al.’s systematic review confirmed its (i.e. PNST) moderate validity for weight-based indicators but poor validity for HAZ. 10 This suggests that the PNST may be effective in detecting acute malnutrition (wasting and underweight) than chronic malnutrition (stunting), a characteristic that appears consistent across inpatient and outpatient settings. Despite these limitations, PNST remains a valuable, user-friendly screening tool in resource-limited contexts. However, its reduced sensitivity underscores the need for complementary use with anthropometric and dietary assessments to capture the full spectrum of malnutrition. For settings such as Ghana’s Child Welfare Clinics, a combined approach integrating PNST with conventional anthropometric measurements may therefore provide the most robust strategy for early identification and timely intervention in malnutrition.
Beyond the diagnostic performance of the PNST, this study highlights concerning levels of undernutrition among children attending Child Welfare Clinics. The prevalence of underweight (28.5%), wasting (30.1%), and stunting (16.6%) underscores the dual burden of acute and chronic malnutrition in the study population. While the stunting rate is similar to the national prevalence of 17% reported in the 2022 Ghana Demographic and Health Survey (GDHS) it is lower than the 30% reported in the Northern Region (Ghana Statistical Service (GSS) and ICF). These findings suggest that despite ongoing national programs, undernutrition remains a persistent challenge, with acute malnutrition particularly prominent in this cohort.
Dietary patterns further revealed significant gaps in diet quality. Although breastfeeding rates were encouragingly high (85%), 14.6% of children had never been breastfed, indicating potential barriers such as maternal employment constraints, cultural practices, or health complications. Complementary feeding practices were suboptimal: diets were dominated by grains, roots, and tubers (79.9%), with very limited intake of fruits and vegetables (7.6%). These results are consistent with previous findings in Ghana 13 and highlight the risk of micronutrient deficiencies that compromise growth, immunity, and cognitive development.14,15
Regression analysis provided additional insights into associated factors. Dietary diversity was positively associated with HAZ, underscoring its role in supporting long-term linear growth. Conversely, older child age was negatively associated with HAZ, suggesting cumulative exposure to dietary inadequacies and recurrent infections increases vulnerability to stunting over time. These patterns align with prior research linking dietary diversity and socio-demographic factors to child growth outcomes in Ghana and across sub-Saharan Africa.4,16
Taken together, these findings point to an urgent need for integrated interventions that address both acute and chronic forms of malnutrition. Efforts should prioritize improving dietary diversity through community-based nutrition education, targeted support for vulnerable households, and policies that strengthen access to nutrient-rich foods. Additionally, interventions should consider caregiver education, cultural contexts, and structural barriers to breastfeeding and complementary feeding. By addressing these multiple determinants, progress can be made toward reducing the high prevalence of malnutrition and improving child health outcomes in northern Ghana.
Strengths and Limitations of the Study
This study has several notable strengths. To our knowledge, it is the first to evaluate the PNST in an outpatient, community-based setting such as Child Welfare Clinics. The use of multiple complementary methods—including anthropometric assessments, dietary diversity evaluation, socio-demographic assessment provides a comprehensive picture of child nutrition and its determinants. Furthermore, the focus on a large outpatient cohort enhances the generalizability of findings to routine preventive child health services. Nonetheless, certain limitations should be acknowledged. The cross-sectional design, reliance on caregiver recall, and the tool’s low sensitivity limit causal inference and may underestimate the true burden of malnutrition.
Conclusion
The PNST demonstrated high specificity but low sensitivity in Child Welfare Clinics, performing better for weight-related indices than for height-for-age. While the PNST could be useful as a rapid screening tool for acute malnutrition, it should be complemented with anthropometric assessments and indices to ensure comprehensive detection. The high prevalence of undernutrition and poor dietary diversity observed further emphasize the need for integrated community-based interventions to strengthen child nutrition in Ghana.
Footnotes
Acknowledgements
Authors wish to thank the staff of the Tamale Central Hospital, especially, those of the Child Welfare Clinic for granting access to the children and their care givers. In addition, authors will like to thank the District Director of Health Services and the entire staff of the district health directorate for their assistance and support.
Ethical Considerations
Ethical approval was obtained from the University for Development Studies Institutional Review Board. Informed written consent was obtained from all participants.
Author Contributions
KBE, MZQ & VM formulated the research question(s), and designed the study, KBE & MZQ undertook data collection, VM analysed the data and VM and PKG wrote the article. All authors agreed for the manuscripts to be published in its current form.
Funding
The authors received no financial support for the research, authorship, and/or publication of this article.
Declaration of Conflicting Interests
The authors declared no potential conflicts of interest with respect to the research, authorship, and/or publication of this article.
Declaration of Generative AI and AI-Assisted Technologies in the Writing Process
During the preparation of this work the author(s) used Chat GPT 4.0 in order to improve the readability of the manuscript. After using this tool/service, the author(s) reviewed and edited the content as needed and take(s) full responsibility for the content of the publication.