
Abstract
This study evaluates the impact of the recently developed BSSI on diabetic adults in Pakistan. A comparative analysis was conducted between BSSI, body mass index (BMI), and body surface area (BSA) to assess the performance of BSSI and identify ideal measures that can accurately predict the incidence of diabetes in Pakistani adults. The research is based on a cross-sectional dataset collected from 1,928 individuals in Pakistan over 2-years. Pregnant women were excluded from the study, and all participants aged 20 years or older, including both males and females, were included and provided required information. Quantile regression curve analyses were employed to investigate the projecting influence of baseline BSSI, BSA, and BMI on the development of Type-2 diabetes. The findings revealed that during the follow-up period, 511 new cases of Type-2 diabetes emerged. The results suggest that BSSI is the most effective measure for predicting Type-2 diabetes in males, as evidenced by quantile regression curve analyses. In contrast, for women, the predictive abilities of BSSI and BMI are similar and superior to those of BSA. For both sex, BSA was found to be the weakest factor. Notably, BSSI and BMI emerged as the best predictors of Type-2 diabetes, while BSA was identified as the weakest measure for assessing diabetes in adults.
Keywords
Introduction
Theoretical Background
The prevalence of Type-2 Diabetes Mellitus (T2DM) has been increasing globally, and it has been posing a significant threat to public health (Saeedi et al., 2019). Early identification of individuals at risk of developing T2DM is crucial for timely intervention and prevention of complications. Body mass index (BMI) is a widely used measure for assessing body fatness, but its limitations have been recognized (Haththotuwa et al., 2020). BMI does not account for differences in body composition and may not accurately reflect body fat distribution, which is an important risk factor for T2DM (Wang et al., 2019). Body surface area (BSA) is another measure that has been used to assess obesity, but its correlation with T2DM is not well established (Adeva-Andany et al., 2024). Body shape and size index (BSSI) is a recently developed measure that takes into account both body shape and size, which may be more effective in predicting T2DM risk than BMI or BSA alone (Gomez-Peralta et al., 2018; Hussain et al., 2021). The BSSI is based on the principles of body composition and takes into account the distribution of body fat, which is an important risk factor for T2DM (Wang et al., 2019).
The development of T2DM is a complex process that involves multiple factors, including genetic predisposition, lifestyle factors, and environmental factors (Basukala et al., 2018). Obesity is a major risk factor for T2DM, and it is estimated that up to 90% of individuals with T2DM are obese or overweight (GBD 2015 Obesity Collaborators, 2017). The measurement of body composition and body fat distribution is important for understanding the relationship between obesity and T2DM.
Diabetes Prevalence
In Pakistan, diabetes prevalence is high and growing globally. According to a recent study, in Pakistan, 27.4 million people 20 years old have diabetes (Tariq et al., 2020). A significant independent risk factor for type 2 diabetes is obesity (Scheen, 2020). Lifestyle measures including weight loss have shown that people at elevated risk for type 2 diabetes will benefit from clinical trials (Abdul-Ghani & DeFronzo, 2017; O’Donoghue et al., 2019), so WHO advised simple methods to identify early lifestyle measures for people at risk of diabetes (World Health Organization, 2016). Obesity metrics like the Body Mass Index (BMI) were proposed and implemented in the prevention of diabetes as easy to function and noninvasive. It has been apparent in recent years that noninfectious chronic disease is predominantly concerned with visceral, rather than subcutaneous fats (Gariballa et al., 2017; Grundy, 2016; Hidayat et al., 2016; Lopes et al., 2016; Son et al., 2016). This conclusion indicates a larger measure in the prediction of type 2 diabetes for the measure of centrally distributed weight, such as Waist circumference (WC), waist-to-hip ratio (WHpR), and waist-to-hip ratio (WHtR) than that of BMI. However, the most important interventions for obesity to be linked with the risk of type 2 diabetes have not yet been identified. Patients with SARS-CoV-2 (COVID-19) have a high prevalence of diabetes, and the presence of diabetes is a predictor of severity and fatality. Due to a compromised immune system and enhanced viral entrance into cells, diabetes may make it easier to contract COVID-19. For all individuals who have diabetes and COVID-19 infection, blood glucose management is crucial. Patients with diabetes who now have restricted access to healthcare facilities can benefit greatly from telemedicine (Lee et al., 2018; Son et al., 2016; Yang et al., 2018).
From the point of view of clinical and public prevention, the ideal or more accurate obesity index for diabetes occurrence must be explained. As far as it is aware, the number of forward-looking studies in mainland Pakistan is small. Consequently, based on the prospective study conducted in Pakistani adults, this study compared BSSI’s ability with Body mass index (BMI), Body Surface Area (BSA), Weight, and Height. In Asia, obesity is in the same circumstances as in whites (Fauziana et al., 2016; Zonash & Arouj, 2019).
Aim of Study
In this study, we aimed to investigate the relationship between BSSI, BMI, and BSA with T2DM in Pakistani adults. We hypothesized that BSSI would be a better predictor of T2DM than BMI or BSA due to its ability to account for differences in body composition and body fat distribution. Our study contributes to the growing body of literature on the importance of integrating multiple obesity measures in predicting T2DM risk.
Methods
Study Design and Sampling Technique
The study employed a cross-sectional design with a sample of 1,928 respondents from Multan, Pakistan. The data collection process employed Simple Random Sampling, a technique that ensures every member of the population has an equal chance of being selected as a respondent. To achieve this, we first created an exhaustive list of all adults living in Multan City, which comprised the population of interest. Next, we used a random number generator to randomly select a subset of individuals from this list. This approach ensures that each individual in the population has an equal probability of being selected, regardless of their characteristics or location. In other words, every adult in Multan City had an equal chance of being selected for the survey. A random number generator selected a sample of 1,928 respondents from this list. Through this procedure, a representative sample of the adult population of Multan City was obtained, ensuring that the findings could be applied to a larger population.
Setting and Participants
The study population comprised all adults, both male and female, aged 20 years or older. Pregnant individuals were excluded from the research. Notably, all participants in the study were at least 20 years of age, ensuring that the sample was comprised entirely of adults in this demographic range.
Variables and Data Collection
The factors that made up the data were sex, age in years, weight in kilograms, and height in meters. The data were measured using established methods and tools from Pakistan and included several characteristics, including sex, age in years, weight in kg, and height in meters. Three quantitative factors are included in our study: age, weight, and height. Standard instruments for determining the weight and height of respondents were used to gather data. This valuable data were collected with the help of a specialized team. Below the lines, there is another discussion of data bias.
Patient and Public Involvement
We encounter several challenges when gathering data from our participants, which we subsequently resolve to ensure efficient data collection. We get data from the patients in a self-administered manner; precise measurements of their height and weight were made.
Reliability of Data
Prior to statistical analysis, the dependability of the data were assessed using Cronbach’s Alpha. The resulting value of .789 fell within the conventional range of .70 to .90, indicating a high level of internal consistency and reliability in the data.
Bias
In order to mitigate the potential influence of bias, the data were carefully curated by excluding certain anomalous and irrelevant observations prior to its modification and restructuring.
Population Background
The study population consisted of adults aged 20 years or older, who were recruited from the population in Multan, Punjab, Pakistan. The sample was representative of the local population in terms of age, sex, and socioeconomic status. The participants were predominantly Pakistani, with a majority of them being from rural areas. The demographics of the study population included 64% males and 36% females, with a mean age of 42.5 years and an age range of 20 to 60 years.
The majority of participants had a primary education or higher (85.2%), and most were employed or had a regular income (64.3%). The study aimed to investigate the relationship between body shape and size index (BSSI), body mass index (BMI), and body surface area (BSA) with Type-2 diabetes mellitus (T2DM) in Pakistani adults. The study population was not limited to any specific group or population, such as diabetics or obese individuals, but rather aimed to investigate the relationship between these variables in the population.
Sample Size
This study uses the sample size determination formula given by Yamane (1967):

Where;
N = population size
n = sample size
e = level of precision
Now,
N = 1,872,000 e = 0.023

n = 1,928
Hence, 1,928 adolescents and adults are taken from Multan, Punjab, Pakistan.
Usefulness of Sample Size Determination by Yamane Method
The Yamane formula is a widely accepted method in medical research, particularly in epidemiological studies, for calculating the required sample size. The formula takes into account the population size (N), the level of precision (e), and the desired sample size (n). This method is extremely useful in medical studies as it ensures that the sample size is sufficient to accurately represent the population, reducing the likelihood of sampling errors and bias. The benefits of using the Yamane formula are numerous. By calculating the optimal sample size, researchers can minimize the number of participants needed to achieve their study goals, reducing the burden on participants and resources. Additionally, a smaller sample size reduces the cost of data collection, analysis, and interpretation, making the study more feasible and cost-effective. Furthermore, with a representative sample size, researchers can generalize their findings to the larger population, increasing the study’s validity and applicability. The Yamane formula ensures that medical research is conducted with precision and accuracy, leading to more reliable and trustworthy results.
Anthropometric Measures
Body Shape and Size Index (BSSI)
Body Shape and Size Index is an anthropometric measure that is used to deal with both body shape and body size at the same time while assessing the weight level of individuals (Hussain et al., 2021). The expression of BSSI is given as:

Where WT shows body weight, HT represents body height, BSA, and BMI stands for body surface area and body mass index respectively (Hussain et al., 2021).
Significance of BSSI
In the present study, we chose to use Body Shape and Size Index (BSSI) as a measure of body shape and composition because it offers a more comprehensive and nuanced assessment of body shape and size compared to traditional measures such as BMI. BMI has been shown to be a limited measure of adiposity, as it does not take into account the distribution of body fat or the shape of the body. BSSI takes into account the ratio of body mass to size, which provides a more accurate assessment of adiposity. Additionally, BSSI is sensitive to changes in body shape and composition, allowing for a more detailed understanding of the relationships between body shape and size and health outcomes.
In the present study, we used BSSI as a measure of body shape and composition because we were interested in examining the relationship between body shape and size and type 2 diabetes mellitus (T2DM). We found that BSSI was significantly associated with T2DM, even after adjusting for BMI. This suggests that BSSI is a more accurate measure of adiposity and its relationship with T2DM. Furthermore, using BSSI allowed us to examine the relationships between specific aspects of body shape and size, and T2DM. This provides a more detailed understanding of the underlying mechanisms driving these relationships and highlights the importance of considering body shape and composition in addition to BMI. Its sensitivity to changes in body shape and composition makes it a valuable tool for examining the complex relationships between body shape, size, and health outcomes.
Body Mass Index (BMI)
BMI is an obesity index that is obtained from the department of rectangular of body level using mass and is imparted inside the unit as kg/m2 that is come about because of level in meters square and weight in kg (Z.-P. Huang et al., 2019). The mathematical explanation for BMI is given as:

The inspiration using conveying a document like BMI is to understand issues of robustness and to prepare folks who are not looking proper and precise and are with odd weight (Borga et al., 2018).
Body Surface Area (BSA)
BSA is used to notice and count the area of the human body to such an extent that game plans with living animals like physiology and prescription (Itoh et al., 2016; Lopez et al., 2017). The mathematical expression for the estimation of BSA is given below:

where WT addresses body weight and HT tends to body level.
Growth Charts
Improvement twists are the perceptible show of a youngster’s genuine turn of events and improvement. These are moreover called “road to prosperity” diagrams. Development twists are utilized by pediatricians and different medical blessing vendors to observe unequivocal development over a prolonged time. Advancement twists have been labored by seeing the development of character’s long term. The extent, weight, BSSI, BMI, BSA, and so forth of individuals can compare the normal limits of a comparative age and sex to pick out if the man or woman is developing fittingly. Improvement curves can moreover be used to predict the ordinary individual’s level and weight considering the way that overall, individuals keep a consistent advancement twist. Right when a particular wanderer from there as of late settled improvement twist, an assessment concerning the explanation is overall legitimate. For example, a decrease being development could show the start of a continuous illness (Zong et al., 2017).
This study aims to discover an ideal obesity measure for the incident diabetes in Pakistani Adults. Quantile regression curve analyses were used to associate the projecting influence of baseline BSSI, BSA, and BMI for the growth of type 2 diabetes. To the best of the authors’ knowledge, there is no literature on this type of investigation.
Tools for Data Analysis
For continuous variables, the mean ± SD or median is expressed accordingly. The Student’s t-test for the normally distributed variables and Mann–Whitney’s rank test for variables with skewed distribution are tested between participants with and without diabetes. Frequencies were used to express categorical variables. The Chi-square test tested the differences between people with and without diabetes. The sample was stratified into sex-specific percentiles of BMI, BSSI, BSA, weight, and height. Quantile Regression analyses were implemented to check the connection of baseline obesity indices (BSA, BSSI, BMI, Weight, Height) with an incidence of diabetes type 2, and in this regression model, different powers of age (Age, Age2, and Age3) are considered as covariates. Sex, marital status, and family monthly income were fitted as categorical variables.
Quantile regression curve analyses were used to associate the predictive power of baseline BSA, BSSI, BMI, Weight, and Height on the risk of diabetes type 2 in men and women respectively. All analyses for males and females were implemented individually. The Minitab and SPSS were used for the statistical analyses of data. The statistical significance of all statistical tests was found to be two-sided and the p-value is less than .05 (p-value < .05).
Results
Basic Characteristics of Subjects
For respondents suffering from diabetes type-2 are 511, between these 273 were women and 238 were men. Standard physiognomies according to sex are given in Table 1.
Baseline Characteristics of Study Variables Distinguish by Sex.

Note. Comparison with non-diabetes.
p-Value < .05.
From the above table, it is observed that the average age of diabetic and non-diabetic men is 42.95 and 43.88 respectively, which means that diabetic men have a low average age as compared to non-diabetic men. Similar findings have been obtained for the average age of women. Men had elderly diabetes than people who did not have diabetes (p-value < .05). Women also have the same association (Figures 1 and 2).

Diabetes status in male respondents.
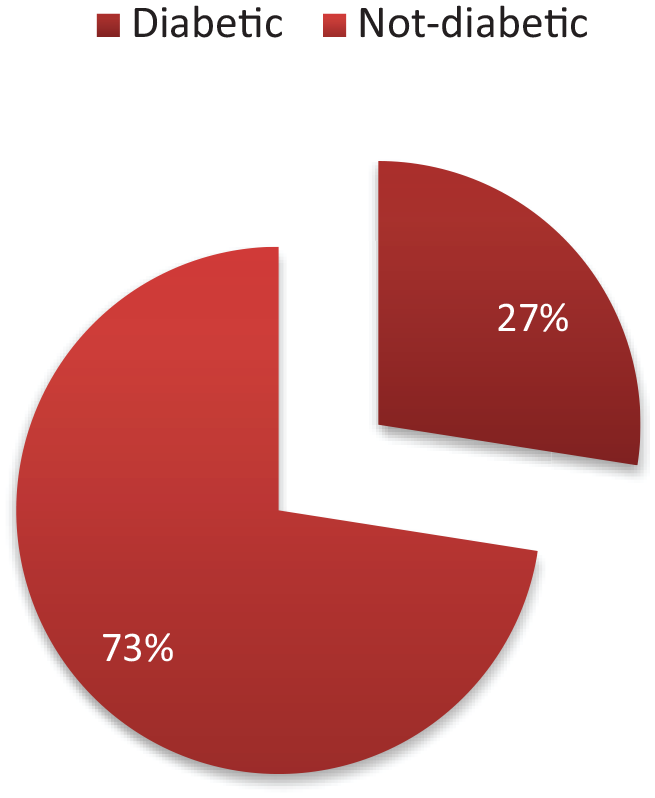
Diabetes status in female respondents.
The average value of BSSI for men is 0.22040 and 0.21804 for diabetic and non-diabetic patients respectively, which means that diabetic men have a high average value of BSSI as compared to non-diabetic men. Similarly, the average value of BSSI for women is 0.24676 and 0.24302 for diabetic and non-diabetic patients respectively, which means that diabetic women have a high average value of BSSI as compared to non-diabetic women. In comparison, participants with diabetes during the follow-up phase had a higher BSA, BMI, BSSI, Weight, and Height in both sex (p-value < .05).
Quantile Regression Analysis
The analyses have been made for combined and separate data (men and women). For both analyses, the median (50th quantile) regression model is used to check the standing position and the effects of covariates, by Eviews 7.0. Results are recorded and discussion is made in both analyses.
For overall data, quantile regression analysis indicated that the BMI, BSA, and BSSI were 26.56, 0.00918, and 0.34337 respectively. Based on the discussed analysis, BSSI was the finest forecaster of diabetes type 2 (p-value < .05). BSA and BMI had the parallel ability to envisage diabetestype2 (Table 2 and Figure 3). In men, quantile regression analysis indicated that the BMI, BSA, and BSSI were 25.61, 0.00559, and 0.21130 respectively. Based on the discussed analysis, BSSI was the finest forecaster of diabetes type 2 (p-value < .05). BSA and BMI had the parallel ability to envisage diabetes type 2 (Table 2 and Figure 4). Similarly, in women, quantile regression analysis indicated that the BMI, BSA, and BSSI were 27.53, 0.01189, and 0.23692 respectively. BSSI and BMI were the finest forecasters of diabetes type 2 (p-value < .05) based on this analysis. BSA was the weediest forecaster in females for predicting type 2 diabetes. The quantile regression curves were constructed for major indices of obesity after standardizing them (Table 2 and Figure 5). In the quantile regression model, including age and major anthropometric measures, this study consequently evaluated the development of prediction for these three obesity indices. The BMI for a quantile regression model predicting diabetes type 2 was 25.61 for males and 27.53 for females, this developed significantly to 1.92 and 0.0063 with BSA in women. The BSSI for a quantile regression model predicting diabetes type 2 was 0.21130 for males and 0.23692 for females.
Quantile Regression Estimates of Major Obesity Indices for Median Percentile


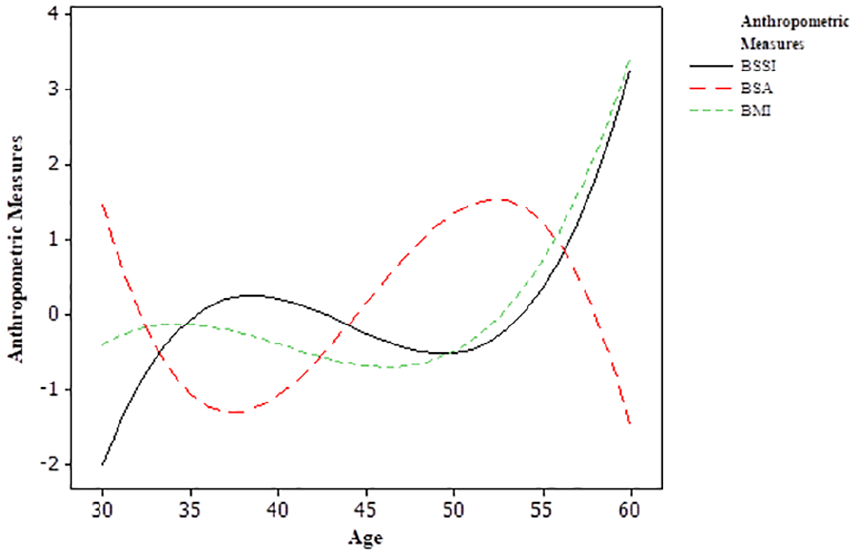
Standardized quantile curves for BMI, BSA and BSSI for the prediction of diabetes type 2 for complete data.

Standardized quantile curves for BMI, BSA and BSSI for the prediction of diabetes type 2 for male.
Standardized quantile curves for BMI, BSA and BSSI for the prediction of diabetes type 2 for female.
The results of the quantile regression analysis, which examined the relationship between body shape and size indices, BMI, and the risk of developing type 2 diabetes, are presented in this section. The analysis was conducted separately for men and women, as well as for the combined dataset. The results showed that the Body Shape and Size Index (BSSI) was the strongest predictor of type 2 diabetes in both men and women, with a significant p-value less than .05. This suggests that BSSI is a useful tool for identifying individuals who are at risk of developing type 2 diabetes. In addition, BMI and Body Surface Area (BSA) were also found to be significant predictors of type 2 diabetes, although their predictive ability was slightly weaker than that of BSSI. The quantile regression curves were constructed to visualize the relationship between the three obesity indices and the risk of developing type 2 diabetes. The curves showed that BSSI was a more accurate predictor of type 2 diabetes than BMI and BSA, particularly at higher levels of adiposity. This suggests that BSSI may be a more effective tool for identifying individuals who are at high risk of developing type 2 diabetes.
The analysis found that age and anthropometric measures, such as BMI, BSA, and BSSI, were significant predictors of type 2 diabetes in both men and women. The results also showed that the inclusion of these variables in the quantile regression model improved the predictive ability of the model. The results of this study suggest that BSSI is a useful tool for identifying individuals who are at risk of developing type 2 diabetes. The study also highlights the importance of considering age and anthropometric measures in addition to BMI when evaluating the risk of developing type 2 diabetes.
Discussion
This study showed that after controlling several possible confounders, obesity, and men were closely correlated with the diabetes risk. These confounders include age, sex, marital status, and monthly family income. By analysis of quantile regression curves, it is found that BSSI was the strongest assessment of the risk of diabetes in men and women in comparison with other obesity measures, while BSA was the worst assessment measure. Related predictive effects for diabetes risk were seen in women by BMI and BSSI. BSSI was the better diabetic risk indicator than BSA and BMI among men.
Previous reports comparing the occurrence of diabetes with BMI, BSA, WC, WHpT, and WHtT were contradictory (Abroug et al., 2014; Assiri et al., 2013; Benvenuto et al., 2020; Carlos et al., 2020; Cascella et al., 2020; Chang et al., 2020; Chen et al., 2020). The differences rely on sex, nationality, and methods of analysis. For instance, results from Chinazzi et al. (2020) and Chung et al. (2020) presented that as compared to other obesity indices, WHtR was a basic but stronger indicator of diabetes type 2. In a study by Corman et al. (2020) of individuals who are 35 to 65 years old, WHtR seemed like WC, but in the prediction of the incidence of diabetes, it was slightly better as compared to the BMI or WHpR. These observations are very close to our results. BSSI is the most suitable for diseases that are not communicable. In a cohort study (de Groot et al., 2013), WC appeared as a better diabetes assessment in the case of women but the better assessment measure in the case of men was BMI. However, an indication from Deng et al. (2020), Tripp and Tompkins (2018), and Fung and Liu (2019) researchers presented that WHpR was better than WC and WHtR than prospective type 2 diabetes. However, BSSI was not considered in these trials. The current study is conducted in Multan City Pakistan. Therefore, the findings of this study cannot be generalized to the whole world. Additional analysis is required. The results showed that sex, ethnicity, and obesity are the best assessment measures for future diabetes. The change in the preview is tested for these three anthropometric measures by introducing age and major anthropometric measures to the quantile regression model. The BMI for a quantile regression model predicting diabetes type 2 was 25.61 for males and 27.53 for females, this developed significantly to 1.92 and 0.0063 with BSA in women. The BSSI for a quantile regression model predicting diabetes type 2 was 0.21130 for males and 0.23692 for females.
The identification of new cases of diabetes in a wide group of Pakistani adults is one of the strengths of our research. The strength is that all centers have used a standardized protocol, and all anthropometric variables have been collected by trained enumerators. There are certain limitations to our study. The first is that the follow-up time of this analysis was relatively short. The relation between anthropometric measurements and the risk of diabetes may be underestimated. Although other reports have shown similar short-term follow-ups (Gorbalenya et al., 2020; Gralinski & Menachery, 2020). The second is that the number of males is higher than females, but it is evaluated all of them in terms of sex. The analysis does not take much bias due to this limitation. Thirdly, the participants have been removed with coronary conditions and pregnant women from baseline that could bias the outcome. Previous studies have indicated an elevated risk of cardiovascular problems for obese individuals (Guan et al., 2020). Thus people with cardiovascular disease may have a greater hazard for the occurrence of diabetes type 2. The relation between anthropometric measurements and the incidence of diabetes may be underestimated with this restriction.
Advantages and Limitations of Quantile Regression Analysis
Quantile regression analysis is a statistical tool that has obtained a lot of attention in recent years because of its capability to explain the connection between a measure of a continuous response variable and one or many covariates at different points of the quantile of the distribution (Quantile Regression, 2017). The first benefit of employing quantile regression analysis is that it enables the analyst to capture any non-linear relationship between different variables, something that is often the case in trade and commerce, economics, medicine as well as the social sciences (Koenker, 2017). Yet another advantage of IA and QR is that they allow modeling the overall distribution of an outcome variable, rather than the just mean or median. It can be especially helpful when an outcome variable has an effect on other variables that is not the same for different levels of the variable. It makes it possible to estimate different parts of the distribution of the result in conjunction with a large standard deviation in the result variable (Waldmann, 2018).
One of the main drawbacks of this method is that it can be risky when it means that it can be affected by a few outliers or missing values. Moreover, while the quantile regression analysis puts a strong assumption on the functional form of the relationship between different variables; they also assume the relationship to be the same at all points within the distribution (Staffa et al., 2019). The analysis using the quantile regression may be time-consuming, especially more so when dealing with a large database. The other disadvantage of using quantile regression analysis is that the results are often hard to explain for those who are not conversant with fixed and random effects models. This is because quantile regression analysis has many estimates that indicate the nature of related factors at a given quantile level of distribution; it is difficult to come up with summary measures of these estimates (Wei et al., 2019). Furthermore, the practice of quantile regression does not yield the chance of an event happening like what the logistic regression does, which might be a drawback in other sciences like medical and social sciences. Quantile regression analysis is comparably novel to other regression methodologies such as linear, logistic, and Poisson regression analysis. This means that there are likely to be few tools and resources to learn about and apply, quantile regression analysis and there are few softwares to use to do the analysis. Nevertheless, this approach has some weaknesses, but quantile regression analysis is a rather effective method for obtaining insights into various interactions (Q. Huang et al., 2017).
Conclusion
This study has checked the influence of recently developed BSSI by Hussain et al. (2021) on diabetic adults in Pakistan. The comparison of the recently proposed body shape and size index (BSSI) by Hussain et al. (2021) has been made with already available obesity indices such as body surface area, body mass index, and many more, for the Pakistani Population. This study intended to discover an ideal obesity measure among body surface area, body shape and size index, and body mass index for incident diabetes in Pakistani Adults. Body surface area, Body shape and size index, Body mass index, weight (gram), and height (meter) were obtained using some standard tools. Quantile regression curve analyses were used to associate the projecting influence of baseline BSSI, BSA, and BMI for the growth of type 2 diabetes. During the follow-up, there were 511 new Type-2 diabetes cases. BSSI is the best assessment measure of type 2 diabetes for males, as seen in quantile regression curve analyses. For women, the predictive abilities of BSSI and BMI are similar and are higher than BSA. For both sex (male and female), BSA had been the weakest factor. BSSI, and to some extent BMI, are the best factors for diabetes type 2, while BSA is the weakest assessment measure in adults. Hence it is concluded that the proposed BSSI by Hussain et al. (2021) is the best anthropometric measure of diabetes type 2 as compared to other obesity indices like BMI, BSA, body mass and body length, etc.
Clinical Usefulness
Generally speaking, BSSI is one more extent of weight that can be used to deal with both body shape and body size of a human body all the while evaluating overweight and rotundity in youths and adults in the clinical setting (Hussain et al., 2021). The BMI is proposed for surveying overweight and weight in children and adolescents in the clinical setting (Andreoli et al., 2016). In clinical practices, while assessing the BMI of a particular it considers the body shape. BSA gauges the total surface district of the body and is used to determine drug estimations and clinical markers or assessments. In clinical practices, while assessing the BSA of a particular it considers body size only (Redlarski et al., 2016).
Strength and Limitations
The critical advantage of this study is that it examines three novel records of heftiness regarding type 2 diabetes. Furthermore, it perceived a couple of obstacles in our research. One potential issue is the shortfall of control for explicit economics, for instance, smoking and non-smoking status, pregnancy, monetary status, etc. These issues may be significant focuses for future work.
Footnotes
Acknowledgements
The authors are thankful to respondents for sharing information for this study.
Abbreviations
BSSI: body shape and size index
BMI: body mass index
BSA: body surface area
WC: waist circumference
WT: weight
HT: height
WHO: World Health Organization
CVD: cardio vascular disease
T2DM: type-2 diabetes mellitus
Ethical Considerations
This study has been ethically approved by the Department of Statistics, The Islamia University of Bahawalpur, Bahawalpur, South Punjab, Pakistan.
Consent to Participate
The data for this study has been collected with the consent of patients or guardians. The data was collected in written format.
Author Contributions
Study concept and design: Waqas Ghulam Hussain, and Farrukh Shehzad; acquisition of data: Waqas Ghulam Hussain and Atif Akbar; analysis and interpretation of data: Waqas Ghulam Hussain and Atif Akbar; drafting of the manuscript: Farrukh Shehzad and Waqas Ghulam Hussain.
Funding
The author(s) received no financial support for the research, authorship, and/or publication of this article.
Declaration of Conflicting Interests
The author(s) declared no potential conflicts of interest with respect to the research, authorship, and/or publication of this article.