
Abstract
Introduction:
Obesity and income (wage) distribution have emerged as one of the most serious public health concerns but in this research, the study is continued under body mass index (BMI) and body shape and size index (BSSI) among children and adults in Pakistan.
Methods:
This cross-sectional study investigated the health-related behaviors and outcomes of 2,223 children and adults aged 2 to 19 years from Multan, Pakistan, including both males and females, providing a comprehensive understanding of the health status in this population. Data about gender, weight, height, age, family income and other demographic measures are recorded. For the measurement of BMI and BSSI, the latest formulas and methods were used. Different variables were applied through statistical description understudy. To check out the wage distribution in BSSI and BMI, the comparative approach was used and performed a role in making charts for BSSI and BMI against family income, age group and gender.
Results:
The mean BMI and BSSI for complete data are 18.00 and 0.23 for the age group of 2 to 5 years of children with family income less than 10,000. Similarly, these figures are 20.59 and 0.29 for the family income greater than 50,000.
Conclusion:
Most important things have been observed by this study, that income greatly affected the rate of obesity. BMI and BSSI increased by increasing the family income of children and adults in Pakistan. BMI and BSSI show high figures for female respondents as compared to male ones, observed by this research.
Introduction
Obesity is characterized by an excess of body fat or adiposity. It usually used to measure body weight a described that this is a worldwide challenge to public health. This type of weight is not considered healthy. BMI, or the weight-for-height index, is a mathematical formula that is frequently used to determine obesity. The World Health Organization (WHO) refers to it as a “global epidemic” since it carries a multitude of hazards in addition to physical and psychological ones (Mathur & Barlow, 2015). More than 1.1 million people in the world are estimated to be overweight a 320 million are calculated to be obese, according to the conclusion of recent reports. Obesity caused 2.5 million deaths every year related to obesity. It is expected to be doubled until 2030 (Cho et al., 2018). Numerous severe health issues and maybe fatalities are estimated, which is why several recent research found it alarming. Hypertension, Type-1 Diabetes, cardiovascular illnesses, infertility, renal disorders and an increased chance of some cancers, such as those affecting the colon, prostate, endometrial, and perhaps the breasts, are among these issues (Bray & Bouchard, 2024; Brix et al., 2019; Dean & Liebow, 2022; Fathy et al., 2022).
Based on national survey data, the Unites States found common diseases like measuring heights and weights in adult population overall trends in obesity. For population prevalence obesity also defined as Body Mass Index (BMI) of 30 or more than it, based on national survey data. It usually calculated as weight in holograms decided by height in Meyer squared. The 1960 to 1980 survey shows minimal changes over time, however the 1976 to 1980 survey shows an 8% point gain and the 1988 to 1994 survey and the 1999 to 2000 survey show a comparable rise (Aggarwal et al., 2021; Alvarez-Cisneros, 2021; Rejeski et al., 2017; Zhang & Moran, 2017). However, the smaller changes appear in men while no significant changes happen in women as compared to men over the period 1999 to 2008 (Muntner et al., 2020). Changes in the distribution of BMI in population reflect the changes in the prevalence of obesity. The entire distribution of BMI increased with great changes at higher BMI levels showed by previous analysis (Wabitsch et al., 2014). A recent report and research work described not the only connection between obesity and overweight but other prevalence chronic conditions including high blood pressure and high blood cholesterol level in national health and Nutrition Examination Survey (NHANES) III Data (Kaczmarski et al., 2019). The relationship between obesity and low levels of high-density lipoprotein cholesterol (HOL-C), high blood pressure, and high blood cholesterol was demonstrated by males, women and members of various ethnic groups (Buchan et al., 2017; Gan et al., 2022; Horwich et al., 2018; Johnson et al., 2020; Kotseva et al., 2019; Li et al., 2020; Şener, 2023; Tadic & Cuspidi, 2019; Xuan et al., 2017; Zhou & Fang, 2019).
In medical sciences, body surface area is used to measure the surface of the human body. Not only in the field of medicine but included the calculation of drug amounts and the amount of fluid to be controlled is also measured by the tool. BSA is estimated daily especially in anesthesiology and critical care medicine. BSA is also useful in the calculation of the metabolism of the body such as fluid requirements, ventilation, extracorporeal circulation and dosage of drugs in several areas (Choudhury et al., 2017). The daily basis usage of BSA is revealed by a lot of literature a material. For example, chronic kidney disease directly depends on the accurate value of the glomerular filtration rate (GFR) rate is revealed by modification of diet for rental disease equation and normalizes to BSA (Liyanage et al., 2022). Patients often took a dose of cardiac drugs or other drugs Glucocorticoid according to BSA condition (Bebeau et al., 2022). Red cell volume (RCV) and plasma volume estimation for total blood volume (TBU) rely on the widespread usage of BSA. In cardiovascular investigations, electrocardiography is utilized to identify hypertension, an independent risk factor. It has been shown that there is a clear relationship between left ventricular mass and BSA (Asif et al., 2021). After dividing by the patient’s BSA, strike volume and cardiac output are standardized into the stroke index and cardiac index (Villa et al., 2017).
The Body Mass Index (BMI) is a commonly used metric to assess health risks and body composition in the medical sciences. However, even when a person’s BMI falls within a certain range, his or her physique will not appear the same as that of others in the same range. This demonstrates that looking at BMI alone is insufficient; other indices should also be taken into account. In light of this, body weight is an important consideration. Gaining weight in the upper body rather than the lower body puts a person’s health at greater danger. It is believed that this distribution of fats raises the chance of developing chronic illnesses. Another helpful metric for determining body shape is the Body Shape metric (ABSI), which is typically used in conjunction with the BMI to provide a more comprehensive picture of body growth. Furthermore, the Body Surface Area (BSA), which can describe body size and general health state, is calculated using weight + height factors. Furthermore, we employed a brand-new method known as the Body form and Size Index (BSSI) that combines BSA and BMI into a single metric for evaluating body shape and size (Hussain et al., 2021).
The Body Shape and Size Index (BSSI) is a new index created to measure the size and shape of the human body (Hussain et al., 2021). Body surface area (BSA), body mass index (BMI), weight (WT), and height (HT) are the components that make up this composite anthropometric measure. Therefore, in comparison to BMI, which is based just on weight and height, BSSI, which uses these factors, provides a more adequate evaluation of the form and size of the body regarding weight.
Since, there is no such literature is available to compare BMI and BSSI on the basis of age, gender and family income of children and adults. Thus, in this report, we focused on obesity and wage distribution in BMI and BSSI with specified age duration of 2 to 19 years of Pakistan. To check out the wage distribution in BSSI and BMI, the comparative approach was used and we also provide graphical presentation for BSSI and BMI against family income, age and gender.
Methodology
Study Setting
This section describes the location where the study was conducted. The study included all adult individuals, both males and females, within the specified age range (2–19 years) from the cities of Bahawalpur and Multan. This means that the study population consisted of individuals who reside in these two cities and meet the age criteria.
Study Design
This section introduces the type of study being conducted, which is a cross-sectional study. A cross-sectional study is a type of observational study that collects data at a single point in time, providing a snapshot of the population being studied. In this case, the study aims to investigate the demographic and anthropometric characteristics of children and adults aged 2 to 19 years from Bahawalpur and Multan, Pakistan.
Study Participants
This section defines the population being studied, which is children and adults aged 2 to 19 years.
Study Variables
This section lists the variables that were collected in the study. The variables are:
➢ Gender: This is a qualitative variable that classifies individuals as male or female.
➢ Monthly family income: This is also a qualitative variable that captures information about the economic status of the participants’ families.
➢ Age in years: This is a quantitative variable that measures the age of each participant in years.
➢ Weight in kilograms: This is a quantitative variable that measures the weight of each participant in kilograms.
➢ Height in meters: This is also a quantitative variable that measures the height of each participant in meters.
Data Collection
This section describes how the data was collected. The cross-section participants were selected through a combination of electronic and paper-based methods, using a random number generator and a standardized sampling frame. The study used standardized techniques and equipment from Pakistan to ensure accuracy. Participants’ weight and height were measured directly, while questionnaires were used to collect data on gender and monthly family income. This means that participants were asked to provide information about their gender and monthly family income through a written questionnaire.
Patient and Public Involvement
This section highlights the importance of patient involvement in the study. The study was designed to be voluntary, and participants were asked to provide informed consent before participating in the study. Patient participation was essential to ensure that accurate data was collected.
Bias
This section acknowledges that bias can occur during data collection and analysis. To minimize bias, the researchers excluded unusual and irrelevant observations during data editing and formatting.
Study Size
This section reports on the number of participants included in the study, which is 2,223 children and adults from Bahawalpur and Multan.
Statistical Methods
BMI was measured in such a way: weight in kilograms divided by height in meters squared and rounded to the nearest 10th. The formula of BSSI (Hussain et al., 2021) is as follows:

The results of this reports shown that BMI equal to or greater than 25 is considered overweight and above 30 is taken in the disease of obese while BMI of less than 18.5 as underweight and may indicate malnutrition, an eating disorder and other health problems regarded by World Health Organization (WHO; Dietz & Baur, 2022). These ranges of BMI values given in Table 1 are valid only as statistical categories.
Categories of BMI.

Children and adults, we’re grouped into 2 to 5 years of age, 6 to 5 years of age and 16 to 19 years of age because based in age at interview. The main aim of this report was to classify gender between male and female and family income that was self-supported. All gender groups and separately participants were analyzed through the data of BMI and BSSI. Minitab and E-VIEWS statistical packages were continued for statistical analysis.
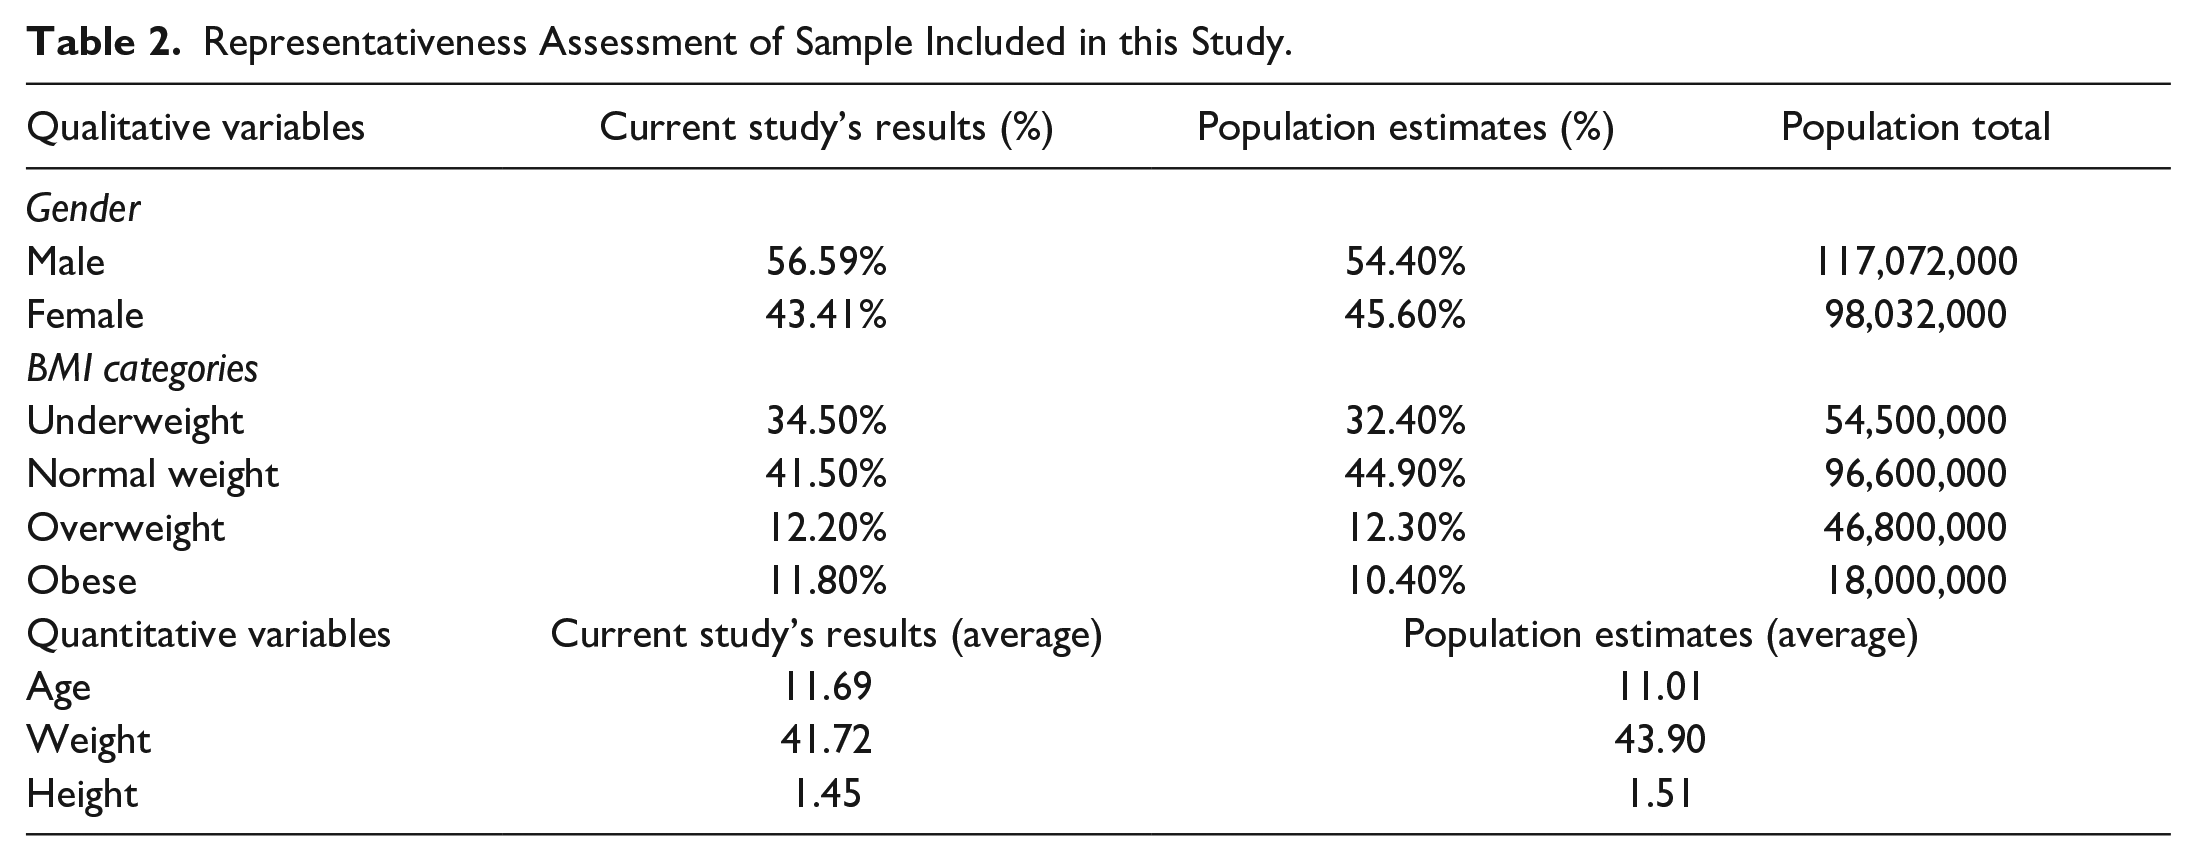
Representativeness Assessment of Sample
To get a representative sample of the population under investigation for a research, the sample must fairly and impartially reflect the features of the population. To do this, the study compares the target population’s demographics with those of the sample, considering factors like age, gender, weight, height, and family monthly income. In this study, we have the following outcomes regarding the representative distribution of the sample:
In order to assess the representativeness of our sample, we compared the demographic characteristics of our participants with those of the general population. As shown in Table 2, our sample was found to be similar to the population in terms of gender distribution, with 56.59% of males and 43.41% of females, closely matching the estimated population proportions of 54.40% and 45.60%, respectively. Similarly, our sample’s BMI distribution was found to be comparable to that of the population, with 34.50% of participants classified as underweight, 41.50% as normal weight, and 11.80% as obese, closely mirroring the estimated population proportions of 32.40%, 44.90%, and 10.40%, respectively. These findings suggest that our sample is representative of the general population and provides a reliable basis for our study’s findings.
Representativeness Assessment of Sample Included in this Study.
Results
In the current study, children and adults sample consisted of 2,223 males and females aged 2 to 19 years of whom 1,258 (56.59%) were male and 965 (43.41%) were female with measured weights and heights. The Mean ± SE of age (years) of all individuals was reported to be 11.69 ± 0.11. Whom, these figures for the male and female individual were 12.01 ± 0.14 and 11.15 ± 0.18, respectively. We calculate the mean ± SE of the individual’s BMI which is reported to be 20.22 ± 0.09, and the mean ± SE of the individual’s BSSI which is reported to be 0.2146 ± 0.0011 and the mean ± SE of the individual’s body mass which is reported to be 41.72 ± 0.38.
Table 3 shows that the percentage of individuals for underweight is 34.5%, for normal weight is 41.5%, for overweight is 12.2% and for obesity is 11.8%. Thus from the above results, we conclude that in Multan city the maximum percentage of normal weight children and adults is living according to our sample. But there is an alarming point that 11.8% of children and adults are obese. So there is a need to reduce the obesity in Multan among children. The above table also shows mean BMI, mean BSSI, mean weight, mean height and mean age of children and adults aged 2 to 19 years, against each category of BMI.
Summary Statistics of Study Variables w.r.t BMI Categories.

Table 4 shows detailed information on BMI, overall and by gender, family income. This table shows that for both gender of age group 2 to 5 years BMI is 18.00 for children and adults having family income less than 10,000, for family income 10,000 to 19,999, BMI increases to 18.73 and similarly, for children and adults having family income greater than 50,000, BMI tends to 20.59. Approximately similar conditions are found for other age groups. For 2 to 5 yeas aged male children and adults, BMI is 17.37 for those families who have income less than 10,000 and this value increased to 21.86 for greater than 50,000 income families. Similar results found for female children and adults. Generally speaking, BMI is high in female children and adults as compare to male and as family income increases BMI is also increases for children and adults. Figure 1 portrayed the graphical presentation of BMI with respect to age and gender.
Mean BMI for Children and Adults Aged 2 to 19 Years With Family Income.


Comparison chart of family monthly income and BMI with different age groups.
Table 5 shows detailed information on BSSI, overall and by gender, family income. This table shows that for both gender of age group 2 to 5 years BSSI is 0.18 for children and adults having family income less than 10,000, for 10,000 to 19,999 family income BSSI also 0.18 and similarly, for children and adults having greater than 50,000 family income BSSI tends to 0.19. Approximately similar conditions are found for other age groups. For 2 to 5 yeas aged male children and adults, BSSI is 0.33 for those families who have income less than 10,000 and this value increased to 0.41 for greater than 50,000 income families. Similar results found for female children and adults. Generally speaking, BSSI is high in female children and adults as compare to male and as family income increases BSSI is also increases for children and adults. Figure 2 portrayed the graphical presentation of BSSI with respect to age and gender.
Mean BSSI for children and adults aged 2 to 19 years with family income.


Comparison chart of family monthly income and BSSI with different age groups.
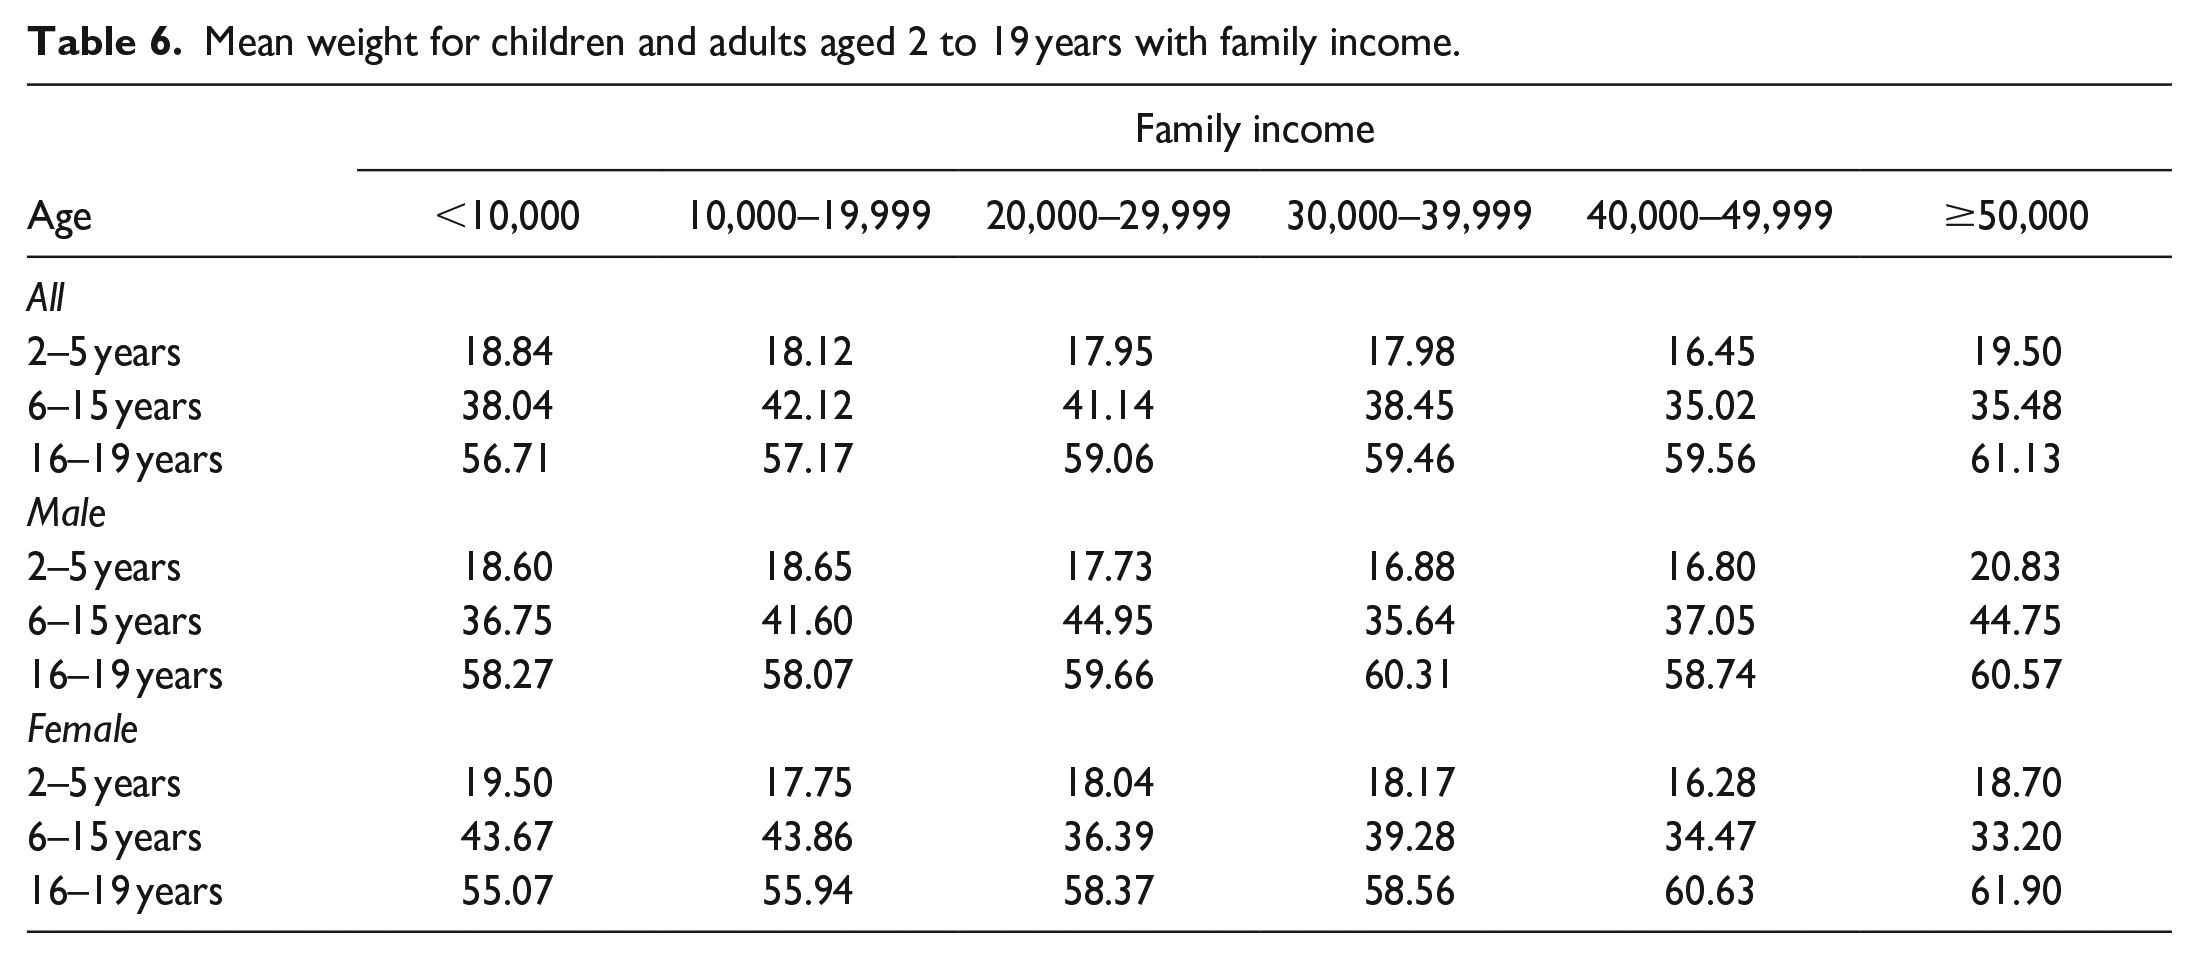
Table 6 represents similar setting for Weight and Table 7 represent a similar setting for Height as given below:
Mean weight for children and adults aged 2 to 19 years with family income.
Mean Height for Children and Adults Aged 2 to 19 Years With Family Income.

Discussion
This study highlights the correlation between family income and Pakistani children’s and adults’ Body Mass Index (BMI) and Body Shape Index (BSI). The results indicate that BMI and BSSI are significantly influenced by family income, with both indices rising as family income increases. The substantial variation in BMI and BSSI levels between males and girls is one of the study’s most notable findings. In every household income level, females showed higher BMI and BSSI values than males. This was true for both children and adults. This is in line with earlier research that showed women typically had greater body fat percentages and body mass indices (BMIs) than males (Bull et al., 2020). Hormonal and sociological variables, including variations in metabolism, muscle mass and lifestyle choices, may be responsible for these discrepancies.
This study shows a positive association between family income, BMI and BSSI. The findings indicate that BMI and BSSI fluctuate in tandem with changes in family income. This shows that among Pakistani children and adults, family wealth has a significant role in determining body composition. The greater socioeconomic level is linked to greater BMI and body fat percentage, according to earlier research, which also indicated that socioeconomic status is a strong predictor of body composition (Padilla et al., 2021). The results of this study confirm earlier findings and emphasize the need to take socioeconomic factors into account when assessing body composition. BMI is discussed against age, gender family income and results show that for both gender of initial ages BMI is 18.00 for children and adults having low family income, for moderate family income BMI increases to 18.73 and similarly, for children and adults having high family income BMI tends to 20.59. Approximately similar conditions are found for other age groups. Generally speaking, BMI is high in female children and adults as compare to male and as family income increases BMI is also increases for children and adults (Table 4, Figure 1). Family income, BMI and BSSI have a complicated association that is impacted by several variables, including access to healthcare, food security and lifestyle choices (Suthahar et al., 2022). For instance, there is evidence connecting food insecurity to poor diet quality and an elevated risk of obesity (Goldschmidt et al., 2018). In a similar vein, delayed identification and treatment of obesity-related health issues may result from inadequate access to healthcare (An et al., 2017). Lifestyle choices like the degree of physical exercise and sedentary behavior also have a big impact on body composition (Dain et al., 2023).
BSSI is also discussed against age, gender family income and results show that for both gender of initial ages BSSI is 0.18 for children and adults having low family income, for moderate family income BSSI remains 0.18 and similarly, for children and adults having high family income BSSI tends to 0.19. Approximately similar conditions are found for other age groups. Generally speaking, BSSI is high in female children and adults as compare to male and as family income increases BSSI is also increases for children and adults (Table 5, Figure 2). It has been noticed in this research that more symptoms of BMI and BSSI are shown in female adults and children as compared to males. Standardized procedure and accurate tools are used to measure weight and height while estimates are based on a large sample of self-administered collected data. The definition of obesity is not based on body fatness but on distribution between BMI and BSSI that give results in the ratio of height and weight in adults and children. Resultantly, family income and gender differences entirely draw differences in BMI and BSSI. So, the overall sample size precisely shortened or limited for smaller subgroups by age, family income and gender. Thus it is approved by this research that family income affected the results of BMI and BSSI, when family income increases or decreases then BMI and BSSI also change according to the population of Pakistan. There is no such study available in literature which compares BMI and BSSI on the basis of age, gender and family income of children and adults in Pakistan.
The results of this study have significant implications for Pakistani public health policy and practice. The findings imply that programs to raise socioeconomic standing, such as those related to employment and education, could also aid in lowering the prevalence of obesity in Pakistani adults and children. Programs aimed at improving access to healthcare, physical activity levels and diet quality may also be successful in fostering a healthy body composition.
This study offers fresh perspectives on the connection between monthly family income, BMI and BSSI in adults and children from Pakistan. The results indicate that BMI and BSSI are significantly influenced by family income, with both indices rising as family income increases. The findings emphasize how crucial it is to take socioeconomic factors into account when assessing body composition and imply that programs targeted at raising socioeconomic status might be useful in lowering Pakistan’s obesity rate.
Conclusion
In the end, it is concluded that the current research was to determine the correlation between family monthly income, BMI as well as BSSI of children and adults in Pakistan. The results of this study are significant to understanding the relationship between socioeconomic status and adiposity in the Pakistani population. The findings reveal that family income affects BMI and BSSI whereby the values for both parameters increase with an increase in the family income. This implies that the level of obesity and body composition is greatly influenced by the Socio-Economic Status (SES) and the development of programs to enhance SES could be useful in the prevention of obesity in Pakistan. The findings of this study have important policy and practice implications for Pakistan’s public health system. Drawing from the findings of the existing research, it is possible to assume that interventions aimed at diet quality, physical activity and healthcare may help to improve overall health and body composition. Thus, it can be also concluded that attempts to advance the education and employment status of Pakistanis might also contribute to the decrease in obesity rates among the country’s children and adult population. The government and policymakers should be advised of these findings while forming policies and creating programs for combating the increasing obesity problem in Pakistan.
The study also underlines the necessity of taking into account the influence of such factors as socioeconomic status for body composition assessment. As seen from the results presented above, BMI and BSSI are not only dependent on the personal characteristics of a person but also on such factors as family income. This implies that public health interventions should aim at tackling both the personal level and the social level. Therefore, this study generates novel findings regarding the association of family income with BMI and BSSI in children and adults in Pakistan. The results of the study underline the role of socioeconomic status as one of the predictors of body composition and indicate that the interventions targeting the improvement of socioeconomic status may be useful for decreasing the rate of obesity in Pakistan. Therefore, the finding of this study has key policy and practice implications for public health in Pakistan, especially in dealing with the increasing obesity issues.
Study Limitations
It is important to recognize the study’s shortcomings. Due to the sample size’s restriction to a certain age range (5–19 years), it could not entirely represent Pakistan’s overall population. Furthermore, the study’s family income data came from self-reported sources, which might be biased. Future research should use bigger sample numbers and objective socioeconomic status measurements to address these constraints.
Future Recommendations
The study’s conclusions lead to the following recommendations:
Interventions in public health should be comprehensive, addressing socioeconomic as well as individual-level variables.
Socioeconomic status should be improved by implementing initiatives targeted at enhancing employment and educational possibilities.
Policies that focus on access to healthcare, physical activity levels and diet quality should be created to support a healthy body composition.
Investigating the processes behind the association between body composition and socioeconomic level should be the focus of future research.
Larger sample numbers and objective socioeconomic status assessments should be used in future research to address the limitations of this study.
Footnotes
Acknowledgements
The authors would like to thank respondents for their assistance in the collection of data for this study.
Author Contributions
Waqas Ghulam Hussain Atif Akbar & Farrukh Shehzad conceived, designed and did statistical analysis & editing of manuscript.
Waqas Ghulam Hussain did data collection and manuscript writing.
Farrukh Shehzad & Atif Akbar did review and final approval of manuscript.
Declaration of Conflicting Interests
The author(s) declared no potential conflicts of interest with respect to the research, authorship, and/or publication of this article.
Funding
The author(s) received no financial support for the research, authorship, and/or publication of this article.
Ethical Approval
This study was approved by Department of Statistics, The Islamia University of Bahawalpur, Bahawalpur, South Punjab, Pakistan.