
Abstract
Background:
Obesity leads to other fatal diseases like diabetes, cardiovascular diseases, depression, and some forms of cancer. Still, the well-known tool to measure obesity is the body mass index. But it usually failed in the measurement of adipose tissues. So, we present a novel anthropometric measure, called body shape and size index which is developed by the combination of major anthropometric determinants: body surface area, body mass index, weight, and height.
Methods:
This study is based on cross-sectional data consisting of 7224 individuals that were taken from the city Multan, Punjab, Pakistan. All the individuals, both males, and females, of age 2 years and above were included in the study except the pregnant women. The variables included in this study are gender, area (urban and rural), age (years), weight (kg), and height (meters). Growth charts of quantile regression are used for the inferential analysis of data. Comparison of proposed body shape and size index at different obesity levels has also been made to access the relationship of proposed body shape and size index with obesity.
Results:
The results show that the proposed body shape and size index has a great association with body surface area, body mass index, weight, height, and age. The proposed body shape and size index has a high negative association with body surface area, moderate negative association with body mass index and weight, and low negative association with height and age. According to growth charts of body shape and size index, after the age of 25 years, body shape and size index curves go upward while it smoothly goes downward at the age of 50 years but decreases in earlier ages. Body shape and size index showed a significant association with body shape and body size (body development) at the same time.
Conclusion:
Body shape and size index is found, generally linear with age, and increased with decreasing body mass index and body surface area. The proposed index has an indirect relationship with obesity. Body shape and size index with low values indicates a high risk of obesity. While, however, body shape and size index with high values indicates a low risk of obesity. Applications of the proposed body shape and size index are also presented in statistical modeling.
Keywords
Introduction
The major obesity-related complications are depression, high blood pressure, cancer, 1 and the disease of joints to become stiff and painful. 2 Obesity can lead to type-I, type-II diabetes, and cardiovascular disease (CVD). Obesity has become a major public challenge of health for humanity,3–5 identified by the World Health Organization (WHO). 6 Different countries face different challenges on different rates of obesity.
It is one of the top searched Google diseases in America according to the Centers for Disease Control and Prevention (CDC) (https://www.cdc.gov/diseasesconditions/index.html). Google query analysis of 38 diseases shows that overweight and obesity ranked 16th place in Google search for diseases across the Globe (see Supplemental Figure S1). Supplemental Figure S1 shows the yearly country count of 250 countries of the world, who searched the diseases through Google search engine. This online search behavior analysis is found valuable in showing public concerns on medical and social issues.
Pouliot et al. 7 and Ohrvall et al. 8 displayed diameter to quantify the tissue collection of fatty internal organs that are related to emotions, heart, and blood vessels. The two-dimensional (2D) and three-dimensional (3D) measurements are also studied in connection with obesity as a disease with one-dimensional (1D) measurement. Furthermore, 2D measures body surface area (BSA), 9 and 3D measures body volume index (BVI).10–13
The best-known device that indicates value and quantity about the composition of a body is the body mass index (BMI). BMI categories are divided into groups of individuals like underweight, normal weight, overweight, and obese.14,15 Increasing BMI tends to cause increasing CVD and diabetes U-shaped16,17 or J-curved shape18,19 usually occurs to reveal a relation of BMI with morality. The individuals who faced the problem of being underweight and obese had a higher rate of mortality, while overweight and normal weight also face similar issues. Several researchers have offered the hypothesis that BMI is a composition of mutually fat-free mass and fat 20 has resulted in an indirect relationship between BMI and mortality, but it usually not substitutes all aspects of adiposity. According to this observation, measurement of adiposity points out the limitation of BMI.
Results obtained from Krakauer and Krakauer 21 suggested that A Body Shape Index (ABSI) made efficient effects rather than mutually waist circumference (WC) and BMI toward all-cause hazard prediction of mortality. However, previous studies discussed that the performance of ABSI is not good rather than WC for patients with diabetes mellitus (DM). 22 According to He and Chen, 22 for the population of Chinese, three anthropometric measures show approximately similar results; these measures are ABSI, WC, and BMI. As described by Zhang et al., 23 the anthropometric measure ABSI is not the best especially for patients with metabolic syndrome (MetS) and CVDs. From previous studies, it is observed that there is no single anthropometric measure that captures complete characteristics of obesity and its relevant problems.
This study aims to develop a new anthropometric measure (named as body shape and size index (BSSI)) that combines the major obesity indices such as BMI, BSA, weight, and height. The newly developed measure is a hybrid obesity index that simultaneously accommodates body shape and body size. This kind of obesity index is not available in the literature to the best knowledge of the authors. Many researchers assessed only one aspect of the body (i.e. size or shape), but the proposed index deals with both aspects (shape and size). This duality is the core competency of the proposed index. Applications of BSSI are also provided with different demographic indicators.
Existing anthropometric indices
BMI
BMI, as a Quetelet index, is a conclusion of the mass and height of an entity. BMI is actually a value that is obtained from the division of square of body height by mass and is expressed in the unit as kg/m2 that is resulted from height in meters square and weight in kg. It also used other units for measurement and displayed its value, quantity of height, and weight by contouring that is particularly drawn on the chart to the table to specify its value. It is used to quantify the rate and amount of fatness, muscles, and bones. However, it also describes a category of fatness that an individual faces like overweight, underweight, normal weight, or type of obese that is generally based on value.
As we made a discussion about its unit that kg/m2 is actually the result of mass and height, but sometimes units are omitted or not used because BMI is formally used as a unit. About pounds and inches, the BMI formula for the unit kg/m2 or lb/in 2 in a conversion factor of 703 is listed in equation (1)

BMI does not only provide information related to thinness and thickness, but it also allows patients to discuss issues with their trainer. Simply, the purpose of producing an index like BMI is to know about problems of obesity and to categorize persons who are not physically fit and active and are with abnormal weight. 24
BMI shows its optimal rates on its scale as 18.5 up to 25 kg/m2 while 25–30 value indicates overweight. It also shows about obese that upward from 30 showed the type in which an individual suffers. BMI is not accurate for every kind of fatness or obesity because it usually misleads the person who suffers from fatty disease due to lean male athletes.
BSA
BSA is used to observe and count the area of the human body in a way that deals with living beings like physiology and medicine. BSA as an indicator does not give much better results and does not have a great impact on the human body while it is faithfully used to measure body mass than weight. However, there have been many suggestions of BSA that can be used to quantify the amount of medicine or drugs for producing good effects on the body like the usage of chemicals to control the disease or chemotherapy. Generally, environmental factors and the genetic appearance of using drugs can also harm the individual’s body that is related to the interpretation of 4–10 folds. This disease can be greatly affected by over-dosing or under-dosing. It is also observed that this is a type of factor that can change normal or natural shape, and it provides a very helpful application to cure disease in Phase-I and Phase-II very earlier.25,26 This approach is also used to know about the weakness of a particular person and its medicine.
The formula of BSA 27 is given as

Growth charts
Growth charts are the visible display of a child’s physical growth and development. These are also called “road-to-health” charts. Growth charts are used by pediatricians and other healthcare providers to follow specific growth over time. Growth charts have been constructed by observing the growth of individuals over time. The height, weight, BMI, BSA, and so on of individuals can be compared to the expected parameters of the same age and sex to determine whether the individual is growing appropriately. Growth charts can also be used to predict the expected individual’s height and weight because in general, individuals maintain a fairly constant growth curve. When an individual deviates from his or her previously established growth curve, an investigation into the cause is generally warranted. For example, a decrease in growth may indicate the onset of a chronic illness.
Methods
Study design
A cross-sectional data consisting of 7224 children and adults were taken from Multan, Pakistan. These data have been collected in 2020. Before statistical analysis of data, the outliers have been deducted or (if needed) removed from it.
Setting and participants
All the individuals, both males, and females, of age 2 years or more were included in the study, but the pregnant women were excluded. Our participants are all adult individuals of age 2 years and more.
Variables and data collection
The data consisted of different variables such as gender (male and female), area (urban and rural), age in years, weight in kg, and height in meters were measured using standardized techniques and equipment from Pakistan. Age, weight, and height are included in this study as quantitative variables. Data were collected using standard tools for measuring the weight and height of respondents. A special team was hired for the collection of these precious data. The bias of data is also discussed in below lines.
Tools of data collection
To measure the weight of respondents, a weighing scale has been used. Similarly, for measuring the height of respondents, a stadiometer has been used. These measurements have been taken under the supervision of a special team, which was hired for that important task. While measuring weight and height, respondents were barefooted with empty pockets. 44
Reliability of data
Reliability of data is also checked before the statistical analysis using Cronbach’s alpha. The value of Cronbach’s alpha is 0.78 which lies in the normal range, that is, (0.70–0.90).
Patient and public involvement
While collecting data from participants, many hurdles were faced and then resolved for effective data collection. We collected data through a self-administered way from the patients; their weight and height were measured accurately.
Bias
While editing and formatting of data, some unusual and irrelevant observations are excluded to remove the effect of bias.
Study size
In this study, we use the following formula provided by Lamola and Yamane 28 to determine the sample size

where n is the sample size, N is the population size, and e is the level of precision.
Now N = 1,872,000 and e = 0.035

n = 7224
Hence, 7224 children and adults are taken from the city Multan, Pakistan.
Proposed BSSI
Need of new index
Now, we will discover why BMI and BSA are not sufficient? Why there is a need for a new index and what should be the actual index to find both shape and size by one indicator? BMI provides information only about the body shape of an individual, but two persons of the same category could have different body shapes. However, normal body weight is an important factor in finding issues or health risks. Two different persons have different bodyweight around the midsection or peripheral part, the person who has much weight on the upper part has a great risk of disease than the person who has much weight on the lower part. As well as body shape, the body size is also an important factor. As we know, the BSA is used to provide the value or rate of body size, while the BMI only indicates the measurement of body shape. According to the literature review, there is no device to measure shape and size by one index. We, therefore, proposed a new index, named as BSSI, that provides a single value for both shape and size on a single scale (Figure 1). It is the implication of the proposed BSSI over other indices of obesity.

Connection among weight, BMI, height, and BSA for known categories of BMI.
BSSI
As already discussed that BMI is an index that is used to measure body shape and is also used in other applications. If two persons are taken under observation, then findings will show that two individuals of the same category can have different body shapes. While predicting health risk, body weight plays an important role over absolute weight. The symptoms and issues of disease increase when body weight increases especially around the midsection (upper part) as compared to the lower body that is distributed among different parts. Many other indicators like BMI and ABSI are usually used to measure body shape. BSA, in this way, measures body size by these indices because it also tells us about body height. As a result, for creating a new indicator, we proposed to make a combination of BSA and BMI for measuring the body shape and size. The theoretical model of the proposed BSSI is given in Figure 2.

The theoretical model of body shape and size index.
BSSI construction
A particular method is used for the construction of BSSI that was used by Rahman and adjeroh 29 for the construction of obesity-related surface-based body shape index (SBSI). We also use the same method for the construction of the proposed BSSI with four key anthropometric measures. Consider the linear relation between BMI and BSA and weight (WT) and height (HT) using a linear regression model as

and the estimated model, based on complete data is
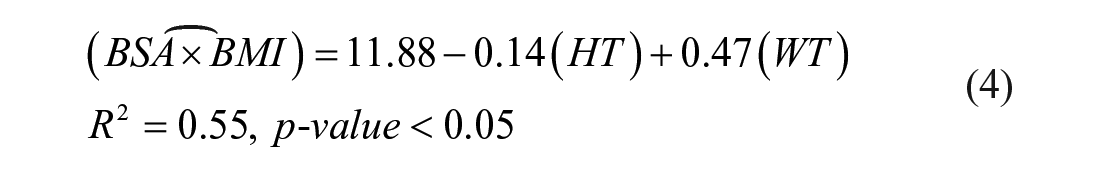
which shows that height and weight have a negative relationship with BSA and BMI, respectively. From the above equation (4), one can infer the relationship

By taking ratio, we can define BSSI as given below

A comprehensive study is performed for the implication of this newly developed index called BSSI. Growth charts are used by pediatricians and other healthcare providers to follow specific growth over time. So, growth charts are constructed for the BSSI with different demographic indicators for combined data, separately for males and females and then for different BMI categories against age. The newly proposed BSSI is also compared with existing anthropometric indicators of body shape and size.
Quantile regression model
The quantile regression model (QRM) approach is used as a statistical technique to construct growth charts of proposed BSSI against age with different quantiles (i.e. 5th, 10th, 25th, 50th or median, 75th, 90th, 95th). QRM is one of the best tools for obtaining such quantiles. It describes all aspects of shape and location of the regressend. QRM explained the significance of the model when the distribution of regressend is non-normal. 30 Usually, for non-normal distribution, the median is used as a measure of location as compared to the mean. QRM offers estimates of median regressend distribution with the association of regressors effect. It also explained the dispersion of distribution that was analyzed by many data points such as quartiles, deciles, and percentiles. The advantages of QRM are as follows: no assumption of distribution is compulsory, and is robust in treating outliers and extreme observations. QRM provides a complete image of the association of regressend and regressors.
Recalling ordinary quantile (percentile), let a random variable described by the given distribution function

then

where

where
The following is the QRM function

where
Model formulation
In the context of QRM, we can formulate models for BSSI over different powers of age for our data set for different categorical variables.
Model 1
QRM for complete data

Model 2
QRM for male respondents

Model 3
QRM for female respondents
Model 4
QRM for underweight respondents

Model 5
QRM for normal weight respondents
Model 6
QRM for overweight respondents

Model 7
QRM for mildly obese respondents
Model 8
QRM for severely obese respondents
Results
This section includes a discussion on the analysis of data, combine and gender-wise. Table 1 represents summary statistics of anthropometric measures which were used in this study. Here, the proposed BSSI shows better performance as compared to other indices of obesity. The purpose of correlating the proposed BSSI with BMI is to just see obesity trends. The proposed BSSI is superior to BMI because it tackles both body shape and body size at the same time, but BMI only tackles body shape. Hence, we developed a new index that accommodates both body shape and size at the same time. As discussed earlier that there is no such anthropometric measure that tackles both body shape and size, so we provided such index called BSSI which deals with both body shape and body size. Hence, the performance of the proposed index is superior to other indices of obesity that tackle body shape and body size. The proposed BSSI also provides significant results in all settings.
Summary statistics for key anthropometric measures.

BSA: body surface area; BMI: body mass index; BSSI: body shape and size index.
Bold text showed the significance of the results of the proposed index BSSI. at 5% level of significance.
Table 3 shows the summary statistics of proposed BSSI and already available obesity indices according to the major categories of BMI for the comparison of BSSI with BMI, BSA, weight, and height. Here, it is observed that for underweight individuals, the mean value of BSSI is 0.003305, for normal-weight individuals, it is 0.002281, for overweight individuals, it is 0.001897, for obese individuals, it is 0.001660, and at severe obesity, its mean value is 0.001233. This shows that the proposed BSSI has a decreasing relationship with BMI and obesity. The relation of proposed BSSI with obesity is decreasing. It means that by increasing the risk of obesity, the value of the proposed BSSI decreases. While analyzing data, we observe that at a high risk of obesity, the value of BSSI is low, and at low risk of obesity, the value of the proposed BSSI is high. The given table also showed the significance of the proposed BSSI (p-value < 0.05) for all categories of BMI. BMI is the measure of obesity, but it only considers a single parameter of the body (shape). BSA is also a measure of obesity and it considers body size. In the literature, there is no index available that accommodates both body shape and body size at the same time. Hence, we proposed the BSSI to fill this gap. BSSI is an important addition to anthropometric measures.
Supplemental Table S1 shows a relationship between BSSI and other measures of anthropometry for body shape and size using Pearson’s (upper half) and Kendall’s (lower half) measures of correlation. For the given raw data sets, z-scores are obtained that provide unit-less values by considering mean and variability in a set of raw values. There is a negative high correlation between BSSI and BSA, a negative moderate correlation of BSSI is observed with BMI and weight, and BSSI has a negative low correlation with height and age. In simple words, we can say that the proposed BSSI decreased by increasing BSA, BMI, weight, height, and age. All these correlations are significant. Such kind figures were also obtained by Rahman and adjeroh 29 in his work.
Construction of growth charts
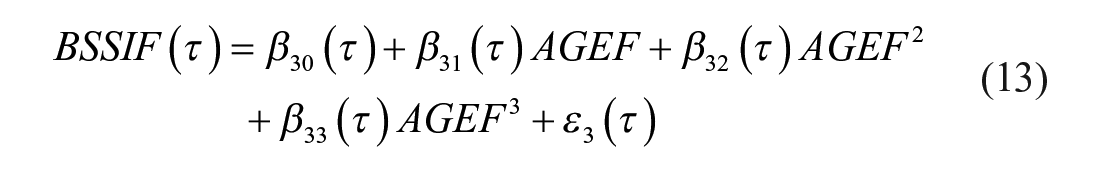
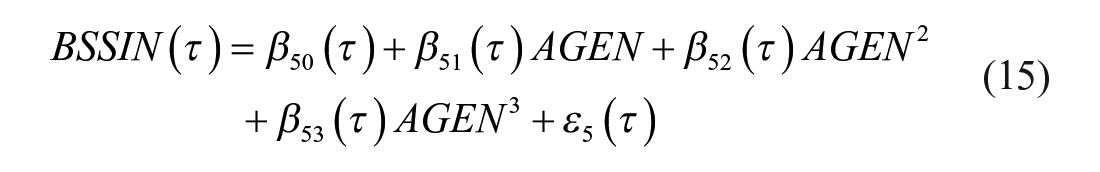
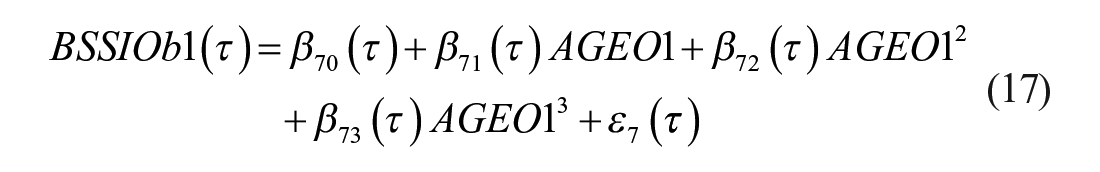
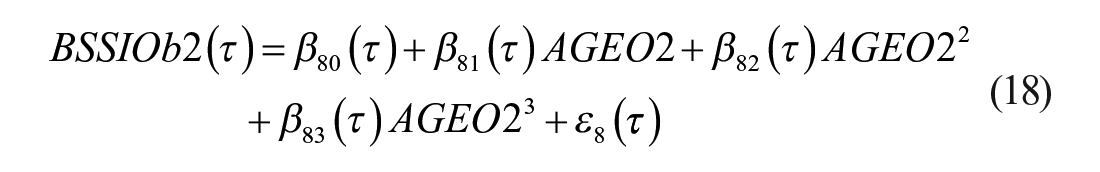
In this study, we use QRM for the construction of growth charts of BSSI using three different powers of age
QRM estimates of BSSI for complete and gender-wise (τ = median).

Model 1
Figure 3 shows growth charts of BSSI for complete data. From this figure, it is clear that the BSSI is quickly downward between ages 2 and 25 years for all quantiles and then quickly growing upward between the ages 25 and 50 years and after that this behavior speedily moves down for 75th, 95th, and 99th quantile but 1st, 5th, 25th, and median quantile of BSSI slowly going downward between ages 25 and 50 years. Generally speaking, body development of individuals is high in start ages and then going down till the age of 25 years and then grows upward till the age of 55 years and then again it shows downward behavior till end ages.
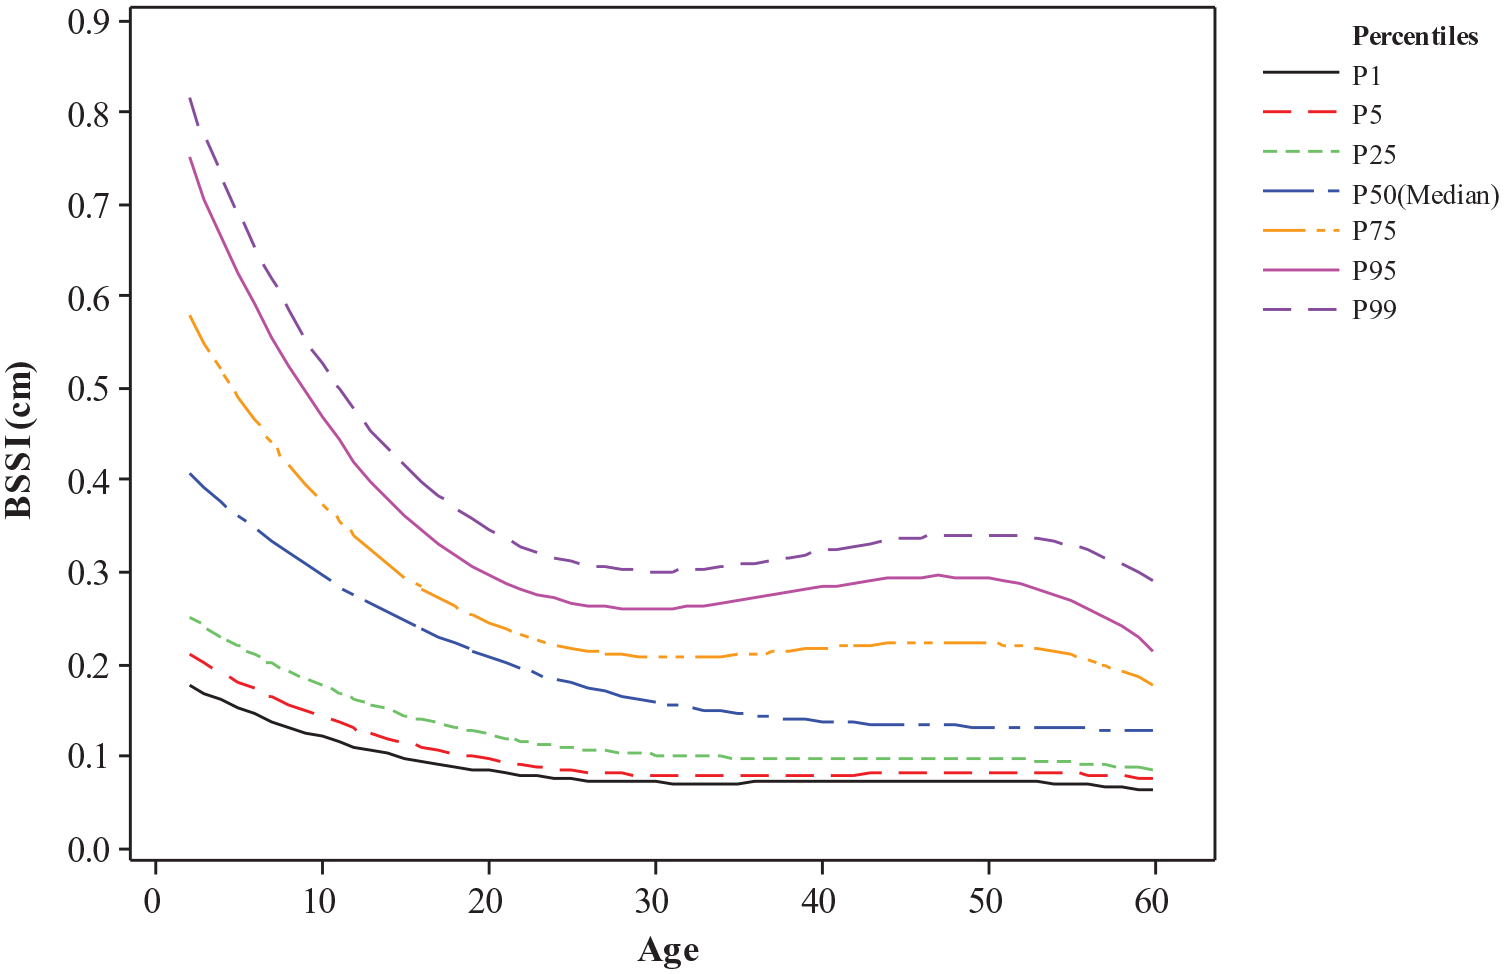
Growth chart of BSSI for complete data.
Similarly, we constructed growth charts for males and females separately in Supplemental Figures S2 and S3, respectively. Table 2 shows coefficients of three powers of the age and their p-values using male and female data for median percentile. Here, all the coefficients are highly significant at
Model 2

Model 3

Growth charts of BSSI for different categories of BMI
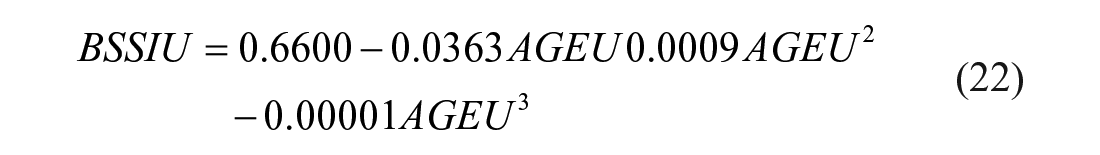
Supplemental Figures S4–S8 show growth charts of BSSI for different categories of BMI. Here, we observed the behavior of BSSI for Pakistan’s population under different BMI categories. BSSI is showing logical behavior, that is, high value in the early ages and then goes down till the age of 25 years and then this pattern increased till the ages of 55 years and then shows decreasing behavior. Supplemental Table S2 shows the coefficients of QRM estimates and their standard errors under different categories of BMI separately for 50th (median) percentile. In this table, all the coefficients of QRM estimates play a significant role in the modeling of quantile regression.
Model 4
Model 5

Model 6
Model 7

Model 8

Comparative analysis of BSSI with different anthropometric measures
In Table 3, the proposed BSSI is compared with some other anthropometric measures. Some summary statistics have been computed for these measures under different categories of BMI. The significance of each anthropometric measure is also checked using a one-sample t-test. It is observed that for each category of BMI, the proposed BSSI shows significant results (i.e. p-value < 0.05). Here, three p-value shows the significance of the results that are presented in the table below. This study aims to present a new index and provide its applications in the context of statistics.
Comparative analysis of proposed index (BSSI) with different anthropometric measures under different categories of BMI.

BSA: body surface area; BMI: body mass index; BSSI: body shape and size index.
Discussion
The development of BSSI is based on four key measures of anthropometry of body size and body shape: weight, height, BSA, and BMI. Considering a given weight divided by height, BMI, and BSA. While BSA accounts for the size of the body and BMI measures the shape of the body. More importantly, BMI and weight have a high association with abdominal fat. Recent studies33–36 explained that serious mortality is highly related to abdominal fat. Definition of BSSI for this study, established on BMI and BSA, suggests that the BSSI also shows significant association with body shape, body volume, abdominal fat, and body size. The BSSI provides realistic presentation when associated with body size and body shape indicators. Particularly, it formed a presentation that is related to BSA in many circumstances, and it is also good for some categories of BMI. 37 However, the obtained expression for BSSI is usual to reflect more or fewer changes on defining BSSI.
Age also plays an important role in the analysis of an individual’s body development. Although BSSI usually decreased by increment in age, still it is not clear that how an individual’s body development will affect by age. 38 For further verification of this statement, we made categories of the understudy population in many age groups as: <5 (279 individuals with mean BSSI 0.003734), 5–15 (2511 individuals with mean BSSI 0.002950), 16–25 (2230 individuals with mean BSSI 0.001968), 26–35 (744 individuals with mean BSSI 0.001688), 36–50 (994 individuals with mean BSSI 0.001566), and >50 (466 individuals with mean BSSI 0.001501). 39 From these outcomes, the BSSI is providing more precise results for individuals older than 25 for all subjects. For both females males, BSSI performed very well. 40 Generally speaking, the proposed BSSI shows superior figures as compared to other anthropometric measures in all settings such as overall, gender, age, and different categories of BMI.
BMI and BSA are the measures of obesity but consider only one parameter: body shape and body size, respectively. In the literature, there is no index available that accommodates both body shape and body size at the same time. Hence, we proposed the BSSI to fill this gap. BSSI is an important addition to anthropometric measures. The results of BSSI about obesity showed in all settings such as overall data, gender, age, and different categories of BMI. The 7224 individuals for this study were categorized according to BMI categories as 1630 underweight, 2766 normal weight, 947 overweight, 1256 Obese-I, and 625 Obese-II. The result shows that an individual’s body development as measured by BSSI is not increasing with BMI. For example, overweight category (mean = 0.001897, p-value < 0.05) presented a lesser mean BSSI than the normal weight category (mean = 0.002281, p-value < 0.05). Similarly, the normal weight group had a lower mean BSSI than the underweight group (mean = 0.003305, p-value < 0.05). The mean BSSI is high for the Obese-I category (mean = 0.001660, p-value < 0.05) than the Obese-II category (mean = 0.001233, p-value < 0.05). 29 Gonzalez et al. 41 described this situation as an “obesity paradox.” Generally speaking, the proposed BSSI has low values at a higher risk of obesity and it has high values at a low risk of obesity. BSSI shows significant results in all settings. Growth charts of different percentiles of BSSI show a quiet smooth pattern and are inversely proportional to age.
Clinical usefulness
Generally speaking, BMI has been recommended for evaluating overweight and obesity in children and adolescents in the clinical setting. 42 In clinical practices, while measuring the BMI of an individual, we consider body shape only. BSA measures the body’s total surface area and is used to calculate drug dosages and medical indicators or assessments. In clinical practices, while measuring the BSA of an individual, we consider body size only. 43 The proposed BSSI is an anthropometric measure used for evaluating obesity in children and adults in the clinical setting. The proposed BSSI considers both body shape and body size to access obesity in individuals.
Limitations and strength
We identify some limitations in this study. One potential problem is the lack of control for certain demographics, for instance, smoking and non-smoking status, pregnancy, socio-economic status, ancestry, and so on. These issues may be valid topics for future work. The lack of validity is also a limitation of the proposed BSSI. The major advantage of this study is the development of a new anthropometric measure which deals with both the body shape and size of an individual.
Conclusion
In this study, results are reported based on an individual’s body shape and size using a quantile regression approach. Different models are suggested and then growth charts are constructed for different quantiles using the quantile regression approach. Implementation of the proposed index is provided through the data collected from different areas of Multan, Punjab, Pakistan. Asia Pacific region BMI categories were used for the comparison of proposed BSSI with obesity. These categories were provided by the World Health Organization (WHO). It is observed that the proposed BSSI has low values at a higher risk of obesity and it has high values at a low risk of obesity. Hence, the proposed BSSI has an inverse relationship with obesity. We combine measures of both body shape and body size to construct a novel anthropometric measure, the BSSI. BSSI is generally linear with age and increases with decreasing risk of obesity when compared with other popular anthropometric indices of body shape.
Supplemental Material
sj-pdf-1-smo-10.1177_20503121211036135 – Supplemental material for Establishing growth charts for proposed body shape and size index of the Pakistani population, using quantile regression approach
Supplemental material, sj-pdf-1-smo-10.1177_20503121211036135 for Establishing growth charts for proposed body shape and size index of the Pakistani population, using quantile regression approach by Waqas Ghulam Hussain, Farrukh Shehzad, Rashid Ahmad and Atif Akbar in SAGE Open Medicine
Footnotes
Acknowledgements
The authors are thankful to Dr. Muhammad Omar, Department of Computer Science, The Islamia University of Bahawalpur, Pakistan, for his valuable suggestions on this manuscript. The authors thank respondents for their assistance in the collection of data for this study. The authors are also thankful to the Editor and anonymous reviewers for their insightful comments on this manuscript.
Author contributions
W.G.H., F.S., and A.A. contributed to the study concept and design. W.G.H. and A.A. contributed to the acquisition of data. W.G.H. contributed to the analysis and interpretation of data. W.G.H. contributed to the drafting of the manuscript. R.A. contributed to the critical revision of the manuscript. W.G.H. and F.S. contributed to the statistical analysis. F.S. contributed to the study supervision.
Declaration of conflicting interests
The author(s) declared no potential conflicts of interest with respect to the research, authorship, and/or publication of this article.
Ethical approval
The study has been approved by the Board of Studies of the Department of Statistics and BASR, The Islamia University of Bahawalpur.
Funding
The author(s) received no financial support for the research, authorship, and/or publication of this article.
Supplemental material
Supplemental material for this article is available online.
References
Supplementary Material
Please find the following supplemental material available below.
For Open Access articles published under a Creative Commons License, all supplemental material carries the same license as the article it is associated with.
For non-Open Access articles published, all supplemental material carries a non-exclusive license, and permission requests for re-use of supplemental material or any part of supplemental material shall be sent directly to the copyright owner as specified in the copyright notice associated with the article.