
Abstract
Aortic stenosis (AS) is one of the most prevalent valvular diseases. Doppler echocardiography is the most common imaging modality for the assessment of AS severity. Cardiac catheterization is also used when there are discrepancies between clinical and echocardiographic data. However, there exist many pitfalls in the assessment of the flow rate and pressure gradient by both imaging strategies. Doppler echocardiography assumes a circular left ventricular outflow tract (LVOT) and a flat velocity profile through the LVOT and does not account for pressure recovery. While cardiac catheterization accounts for pressure recovery, the formulas used to calculate oxygen consumption needed for cardiac output are also a source of inaccuracy in assessing the aortic valve area (AVA). Therefore, less flow-dependent modalities can be used to assess AS severity. Those methods can be divided into non-invasive such as 3-dimensional and resting flow rate assessment of AVA, invasive such as valvular resistance and valvulo-arterial impedance, and surrogate markers like the degree of aortic valve calcification, the degree of cardiac damage, and the delay between left ventricular and aortic systolic pressure peaks. Multimodality imaging, specifically dobutamine stress echocardiography and non-contrast cardiac computed tomography (CT) can also be used to assess the severity of moderate AS with discordant criteria on Doppler echocardiography. Finally, cinefluoroscopy, cardiac CT, cardiac magnetic resonance, and nuclear imaging can be used to assess prosthetic aortic valves when valve dysfunction is suspected or when there is discordance between the echocardiographic assessment and the patient's clinical status.
Keywords
Key Points
Echocardiography is the main imaging modality for assessing aortic stenosis (AS) severity. Cardiac catheterization and cardiac magnetic resonance imaging can be used to resolve discrepancies between clinical and echocardiographic data. The assessment of aortic valve (AV) flow and pressure gradient is prone to inaccuracies by echocardiography and cardiac catheterization. Less flow-dependent assessment of AS severity with invasive, non-invasive, and surrogate markers can be helpful. Dobutamine stress echocardiography and non-contrast cardiac computed tomography can also be utilized to assess the severity of moderate AS with discordant criteria on Doppler echocardiography. Cinefluoroscopy, cardiac computed tomography, cardiac magnetic resonance, and nuclear imaging can be used to assess prosthetic aortic valves when valve dysfunction is suspected or when there is discordance between the echocardiographic findings and the patient's clinical status.
Introduction
Aortic stenosis (AS) is one of the most common valvular diseases. Patients above the age of 75 are mainly affected due to degenerative calcification, but other less common mechanisms are bicuspid aortic valves (AV) and rheumatic disease.1–3 Initial diagnosis of AS usually occurs during routine physical examination, and this is suggested by an abnormal heart sound such as a murmur or a click. Other patients present with symptoms such as syncope, angina, or dyspnea. Mortality at 5 years is high if left untreated.4–7 Therefore, early diagnosis is important, and the integration of imaging modalities to better understand hemodynamics in those patients is crucial. The main modalities used for hemodynamic assessment are echocardiography, cardiac catheterization, and cardiac magnetic resonance imaging (CMR). This article aims to review how those 3 main imaging modalities are used to assess AV flow, pressure hemodynamics, and area, the pitfalls and discrepancies between the imaging strategies, and clinical implications including less flow-dependent assessment of AS severity, and assessment of moderate AS and prosthetic aortic valves.
Pressure gradient assessment
Doppler echocardiography
Transthoracic echocardiography is the gold standard for initial diagnosis and subsequent evaluation of AS. 8 It is a non-invasive modality that is used to assess flow and anatomy. The transvalvular aortic pressure gradient is an important measure of AS severity.9,10 Multiple acoustic windows are needed for accurate assessment to determine the highest AS jet velocity. Apical 5-chamber, suprasternal, and right parasternal views most frequently yield the highest velocity. 8 Doppler measurements may be needed in multiple directions to accurately assess the severity of AS. 11 Continuous-wave Doppler tracings through the aortic valve are used to directly measure AS jet velocity. The pressure gradient is calculated from velocity using the simplified Bernoulli equation.12,13 The mean gradient (MG) is the average gradient across the valve during the entire duration of systole. The simplified Bernoulli equation is derived from the more complex Bernoulli equation, assuming that viscous losses and acceleration effects are negligible, and by using an approximated constant relating to blood mass density. 12 Moreover, the simplified Bernoulli equation assumes that the proximal velocity can be ignored, especially when it is less than 1.5 m/s.12
Cardiac catheterization
With the development of percutaneous valve disease treatments, more importance has been given to invasive hemodynamics. Coronary angiography is usually sufficient prior to valve replacement if clinical and echocardiographic data indicate severe AS. 14 Cardiac catheterization can be used when there are discrepancies between clinical and echocardiographic data. 8 However, multidetector computed tomography (MDCT) or dobutamine stress echocardiography (especially in patients with depressed ejection fraction) remain the first choice when discrepancies between clinical and echocardiographic data exist.15,16 Furthermore, catheterization with dobutamine infusion can be utilized in patients with classical low-flow low-gradient AS. 17 The pressure gradient between the LVOT and the ascending aorta is measured directly using double-lumen fluid-filled catheters for simultaneous measurements of pressures at both locations. In case of artifacts, or when more precision is needed, micromanometer-tipped catheters can be used. Gradients acquired by the pullback method are inaccurate for diagnostic purposes.
Transvalvular flow and aortic valve area assessment
Doppler echocardiography
Doppler velocity and pressure gradients are flow dependent; they both increase with an increase in transaortic flow rate and decrease with a decrease in flow rate. This is important when calculating the effective aortic valve orifice area (EOA) since it is calculated from the continuity equation, based on the concept that stroke volume (SV) ejected through the left ventricular outflow tract (LVOT) all passes through the stenotic AV orifice. 12 For accurate SV calculations, precise measurements of LVOT cross-sectional area and LVOT velocity time integral (VTI) are needed. For that, it is assumed that the LVOT is circular for echocardiography purposes, although 3-dimensional echocardiography and computed tomography (CT) have shown that the LVOT is not truly circular but more elliptical.18–20 The LVOT diameter is measured from a parasternal long-axis view of the LVOT, and the LVOT VTI is obtained using a pulsed-wave Doppler signal. 8 LVOT diameter measurement is ideally made at the aortic annulus, but flow acceleration can occur at that level, particularly in patients with calcific AS. If that is the case, it can be measured 0.5-1.0 cm apically, although the LVOT diameter measurement below the annulus could be different.21–23 It is important to note that the continuity equation provides EOA as opposed to the anatomic or geometric orifice area (GOA), which is better assessed by 3-dimensional echocardiography, CT, or CM.EOA is defined as the minimal cross-sectional area of the flow jet downstream of the aortic valve, 19 whereas GOA is the true anatomical measure of AVA obtained by planimetry from echocardiography, computed tomography angiography, or magnetic resonance imaging images during systole.24,25
Cardiac catheterization
Cardiac output is assessed by 2 methods: Fick and thermodilution. 26 For the Fick method, arterial and mixed venous saturations, oxygen consumption, and hemoglobin levels are obtained. As for thermodilution, cold or room-temperature saline is injected, and the change in temperature as it passes from the injection port to the thermistor on the Swan-Ganz catheter is measured. 8 After obtaining the pressure gradient and cardiac output, the Gorlin equation is used to calculate EOA. 27 This differs from that measured by echocardiography since it is difficult to accurately position the aortic side catheter at the vena contracta of the flow jet. In addition, mean and peak gradients can be measured, but only mean cardiac output can be calculated. It is recommended that the operator perform a quick calculation of EOA by using the simplified Hakki equation, although it is a potential source of inaccuracies. 28
Pitfalls of echocardiography
2-Dimensional echocardiography assumptions for assessment of AV area
For AV area assessment by Doppler echocardiography, 2 critical assumptions are made to simplify the LVOT geometry and flow profile: the assumption of a circular LVOT, and the assumption of a flat velocity profile through the LVOT. 29 The advent of transcatheter aortic valve replacement has led to more use of CT, which confirmed the elliptical shape of the LVOT and AV annulus as opposed to the assumption of a circular LVOT by echocardiography.18–20 This assumption leads to an underestimation of LVOT cross-sectional area, SV, and eventually AVA.30,31 This can be overcome by using the dimensionless valve index (DVI) which is the ratio between LVOT VTI and AV VTI. This ignores LVOT diameter and is thus less subject to measurement errors, but it does not account for variations in patient size. Indexed EOA is generally used to account for variations in patient size. As for the flat LVOT velocity profile assumption, the velocity is overestimated by Doppler echocardiography. 29 Comparing Doppler echocardiography to 4-dimensional flow CMR for AV assessment, the LVOT area measured by echocardiography was 25% lower compared to CMR, whereas the LVOT VTI was 25%–30% higher, leading to a similar AV area. 29
Pressure recovery
The pressure gradient measured during cardiac catheterization is higher than that measured by Doppler due to pressure recovery.32,33 Potential energy is converted to kinetic energy across a narrow valve resulting in a higher velocity and a drop in pressure, but after the narrowed orifice, flow decelerates again, and some of the kinetic energy remaining after dissipating into heat is converted back into potential energy, thus increasing measured pressure. 12 Pressure recovery is greatest in stenoses with gradual widening since turbulence would be reduced, but given the abrupt widening from small orifice to wide aorta occurring in AS, the magnitude of pressure recovery can be ignored as long as the diameter of the ascending aorta is > 30 mm. If the diameter is < 30 mm, then the magnitude of pressure recovery is more significant, and the AV gradient may be overestimated by Doppler since it does account for pressure recovery.
Discordance between invasive and Doppler Peak Pressure Gradient
Another concern regarding the comparison of pressure gradients calculated from Doppler velocities to those measured during cardiac catheterization is that the peak gradient by Doppler is not the difference between peak left ventricular (LV) and peak aortic pressure, but the maximum instantaneous difference in pressure across the valve. Therefore, the peak gradient is an overestimation of the difference between peak LV and peak aortic pressures. Moreover, studies have shown discordance between gradients measured invasively and those measured by Doppler 34 post-TAVR.
Other limitations of echocardiography
A few other potential sources of error arise when using echocardiography. Misalignment of the ultrasound beam with the AS jet underestimates the jet velocity, causing a greater underestimation of pressure gradient according to the Bernoulli equation. This can be overcome by using multiple acoustic windows for the continuous wave Doppler assessment of AS. 12 Furthermore, the variability in acquiring and measuring data needed to calculate EOA from the continuity equation is important, 35 especially LVOT diameter, in which the variability in measurement ranges from 5 to 8%. 12 Moreover, laminar flow is needed to accurately measure SV. However, in the case of combined AS and aortic regurgitation, subaortic membrane, or dynamic subaortic obstruction, this may limit the accuracy. In such cases, placement of the sample volume in the middle of the LVOT cross-section is reasonable. 12 Inadvertent recording of mitral regurgitation (MR) jet and neglecting elevated proximal velocity are other sources of error.
Pitfalls of cardiac catheterization
Gorlin equation, EOA and GOA
A separate Gorlin equation is used for EOA and GOA. It is important to distinguish the difference between GOA and EOA while using the Gorlin equation since the constant used in the equation is different in each. 8 The interchangeable use of these terms and thus using the wrong constant can lead to erroneous assessment of AS severity. Furthermore, the original Gorlin equation included the empirical constants; cc which is the contraction coefficient, and cv which accounts for turbulence and viscous losses, and those were derived for the pulmonary valve; it was suggested that this could be used for the AV. 27 However, avoiding the use of an assumed value of cc is important for diagnostic purposes. Studies focused on identifying methods to accurately calculate cc based on the valve opening to calculate EOA.36,37 The continuity equation measures EOA, which is smaller than GOA due to the contraction of the flow stream downstream from the stenosis. 12 Inaccuracies in the Gorlin equation occur when valve areas are <1.5 cm2 38 and in low-flow aortic stenosis. 39 Most studies were done using EOA, which could be more clinically relevant since it represents the workload on the LV that is needed to overcome the resistance to flow, imposed by the stenotic AV.
Fick method and thermodilution method for cardiac output
The Fick method is the gold standard for determining cardiac output invasively. 40 It requires measurement of oxygen uptake. However, direct measurement can be time-consuming and involves specific equipment that requires frequent calibration. Therefore, oxygen uptake is estimated using derived formulas such as the LaFarge formula, Dehmer formula, and Bergstra formula.41–43 When comparing the estimates from these formulas to measured oxygen uptake, the measured and estimated values differed by more than 25% in 17% to 25% of patients depending on the formula used, 44 especially in obese patients. The Fick method is also not ideal with rapid change as in exercise hemodynamic studies. Therefore when an accurate assessment of hemodynamics is needed, oxygen uptake should be measured directly and not estimated. As for the thermodilution method severe tricuspid regurgitation, atrial fibrillation, and low cardiac output are causes of inaccuracy. 45 Moreover, in elderly patients, the AV area assessed invasively by direct measurement of oxygen uptake, and thermodilution, and non-invasively by 3-dimensional Doppler echocardiography showed poor correlations with each other. 46
Other limitations of cardiac catheterization
LV pressures must be measured using side-hole catheters because end-hole catheters may lead to damping. In double-lumen catheters, the smaller aortic side lumen must be well-flushed to avoid damping which can lead to a falsely elevated gradient. Catheters must be constantly aspirated and flushed because small thrombi may cause inaccurate tracings. The pressure transducers must be zeroed at the midchest level. Pressure contours must be constantly analyzed throughout the study. All these are important considerations during cardiac catheterization and can lead to inaccuracies in the assessment of AV severity. AV pullback, peak-to-peak, and simultaneous LV and femoral arterial pressures are not recommended for diagnostic purposes.
Cardiac magnetic resonance imaging
CMR is not commonly used to diagnose AS. The ability to combine the benefits of CT and echocardiography by obtaining hemodynamic and 3-dimensional anatomic data, without exposure to radiation makes CMR more attractive. Multiple studies assessed EOA measured by CMR by using CMR data combined with the continuity equation or a modified form of the Gorlin equation.47–50 The results showed a good correlation between EOA measured by CMR and that measured by echocardiography. CMR can be used when echocardiographic criteria for AS are discordant. 51 Advantages of CMR include the ability to measure both EOA and GOA by the same modality, in addition to being able to account for pressure recovery. Another advantage is that CMR does not require multiple imaging windows. Disadvantages include long scanning time, higher costs, underestimating calcification,8,52 lower spatial resolution relative to CT, and artifacts due to implantable medical devices.8,52 Furthermore, due to the low spatial and temporal resolution, phase-contrast CMR tends to significantly underestimate the peak velocity (and thus the gradient) and the VTI.
Table 1 summarizes the advantages and disadvantages of Doppler echocardiography, cardiac catheterization, CT, and CMR for assessment of AS severity.
Advantages and disadvantages of echocardiography, cardiac catheterization CT, and CMR for assessment of AS severity.

EOA: effective orifice area; GOA: geometric orifice area; LVOT: left ventricular outflow tract; CMR: cardiac magnetic resonance imaging.
Implications
Less flow-dependent assessment of AS severity
Given the relative inaccuracy of assessing flow in patients with AS, there are multiple methods to assess AS severity that are less flow-dependent. Those methods are especially useful in patients with low-flow low-gradient (LFLG) AS, and when echocardiographic parameters are inconclusive. They can be divided into non-invasive, invasive, and surrogate markers (Figure 1).
Non-Invasive:
3-dimensional assessment of AVA. Resting flow rate. Invasive:
Valvulo-arterial impedance Aortic valve resistance. Surrogate Markers:
Aortic valve calcification. Time between left ventricular and aortic systolic pressure peaks. Degree of cardiac damage.
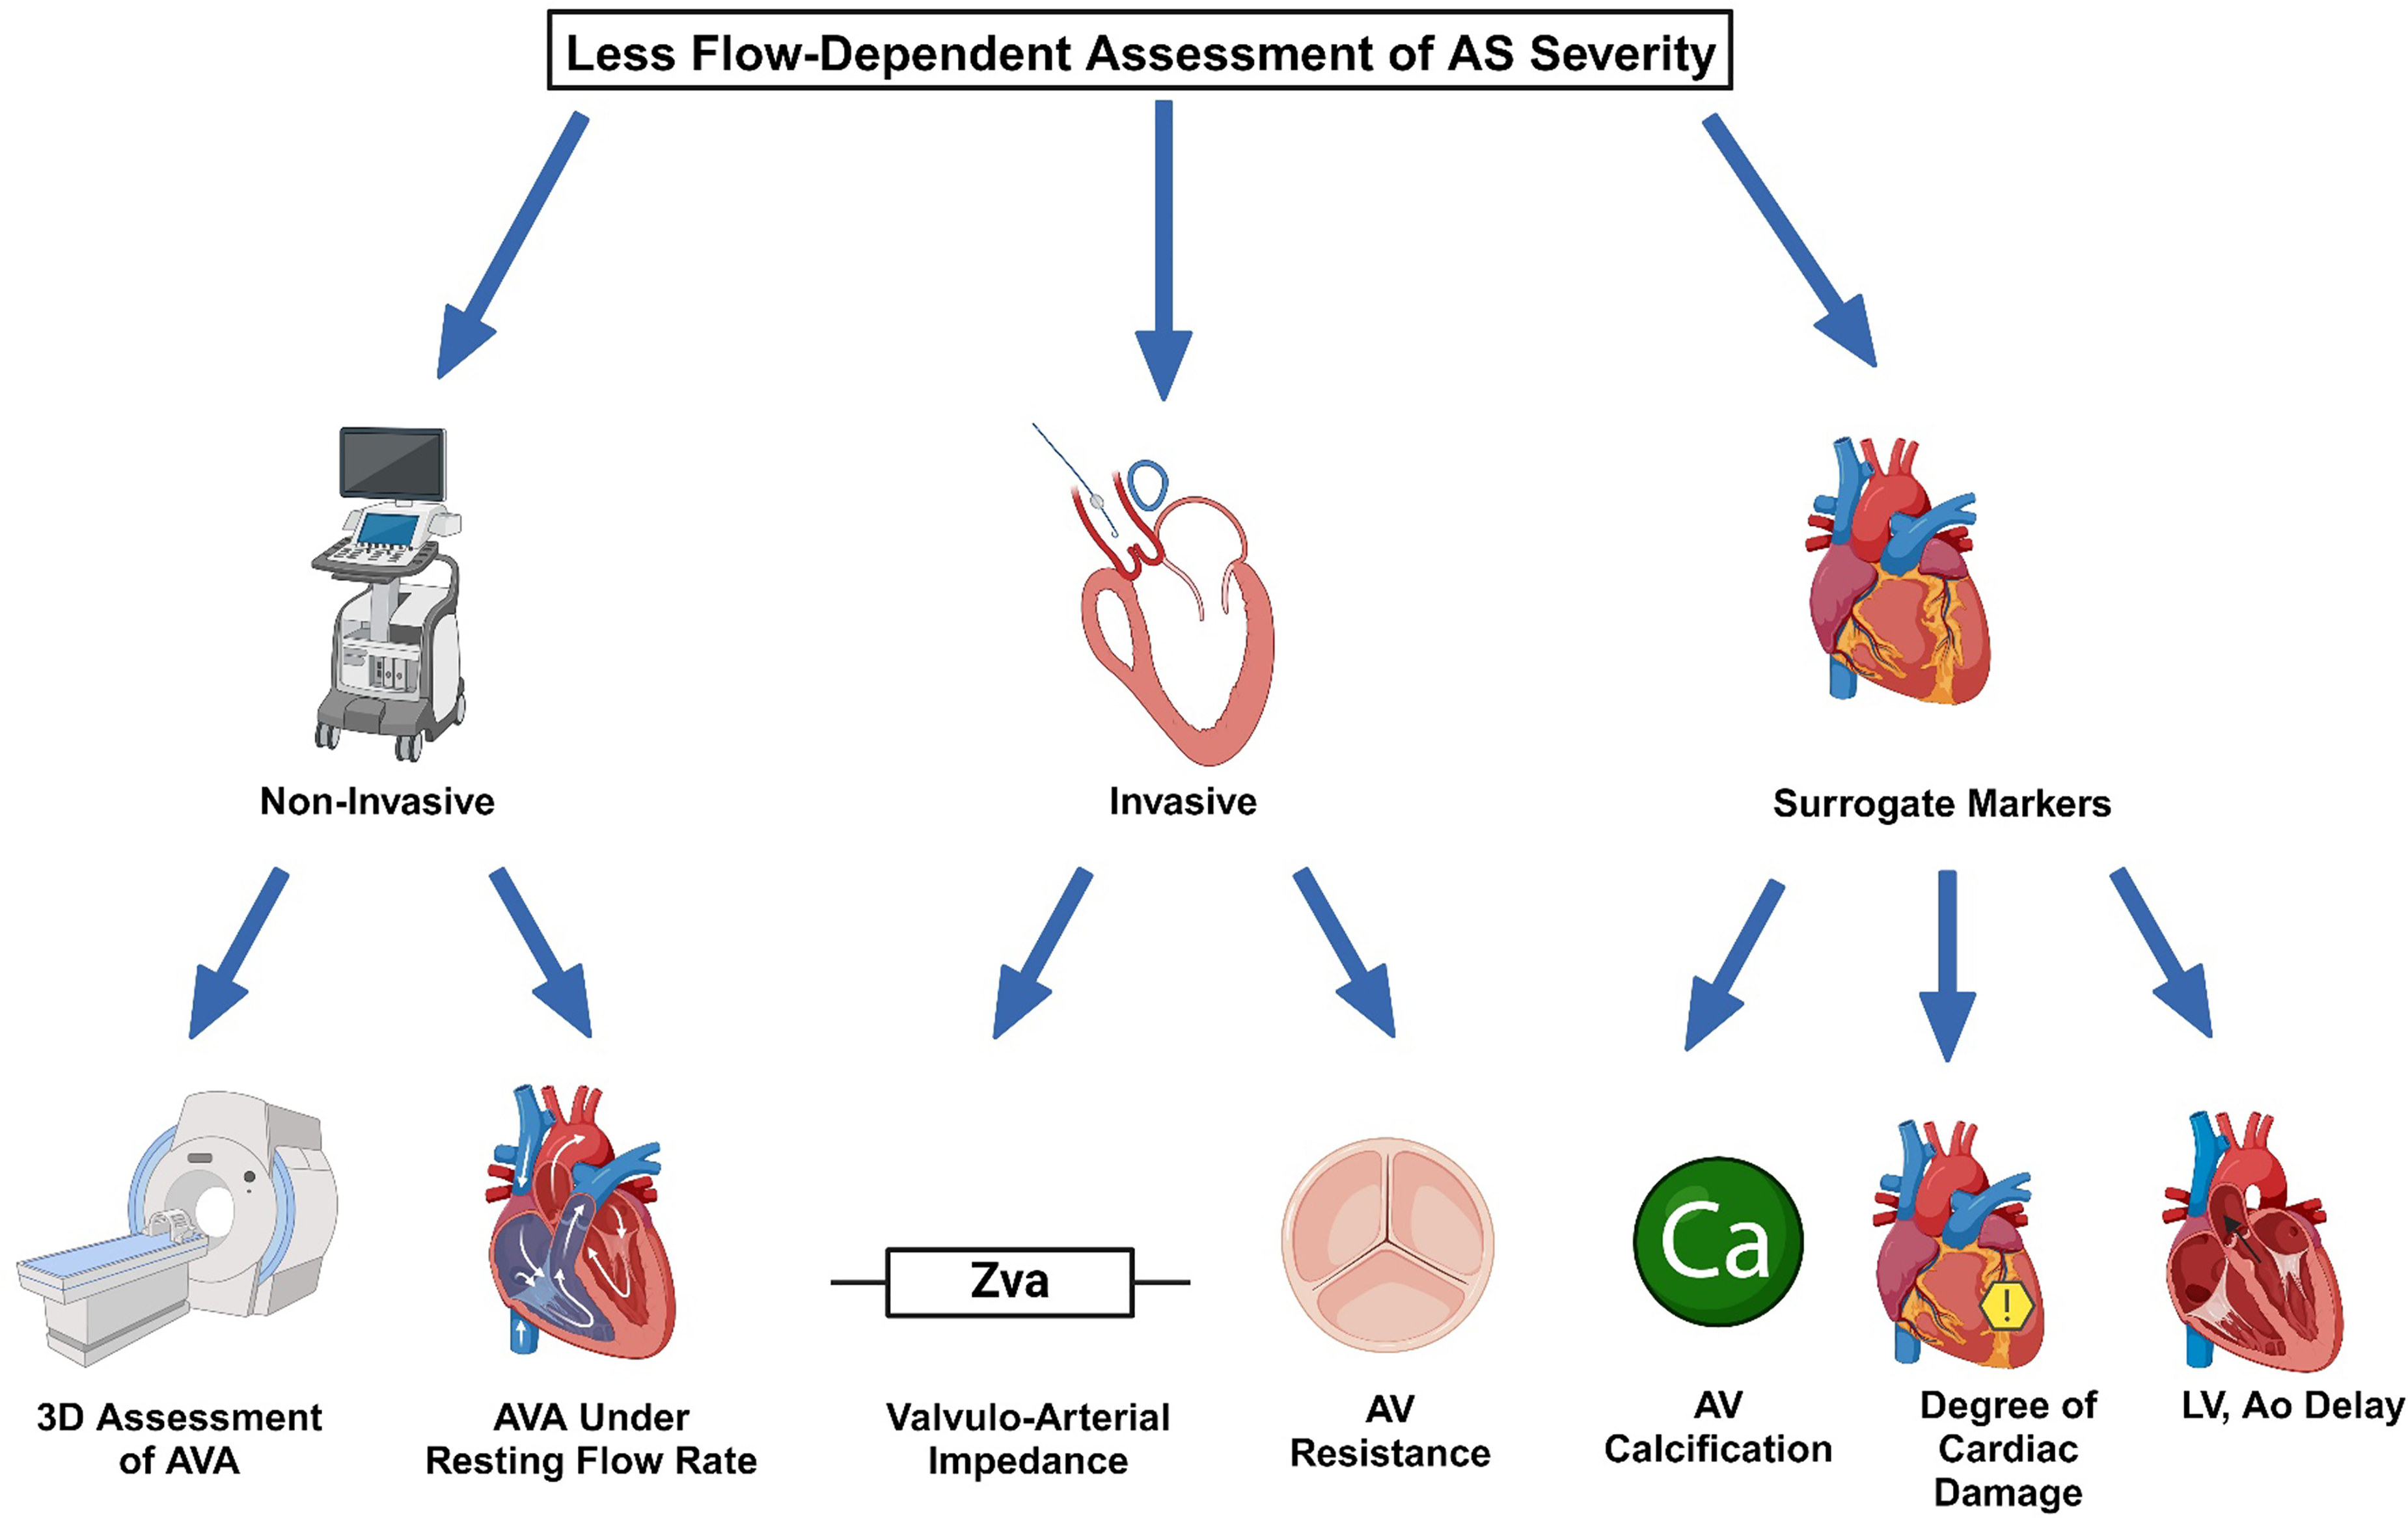
Summarizes the less flow-dependent assessment of AS severity.
Non-Invasive less flow-dependent assessment of AS severity
Multidetector CT is an accurate and non-invasive method for the assessment of AVA. It has shown a good correlation with CMR, transesophageal echocardiography (TEE) and transthoracic echocardiography (TTE). 53 CMR planimetry has also shown a good correlation with TEE for the assessment of AVA 50 and is another accurate and non-invasive method that can be utilized.
Another method is the resting flow rate by Doppler echocardiography. LFLG AS is a form of severe AS in which there is low stroke volume and low AV mean gradient, creating a discordance between the AVA and mean gradient. Accurate assessment of gradients and EOA is critical for optimal management in those patients. LFLG AS is divided on the basis of left ventricular ejection fraction (LVEF) into 2 categories; classical LFLG AS when the LVEF <50% and paradoxical LFLG AS when the LVEF ≥50%. It is important to distinguish classical LFLG AS from pseudo-severe AS. Patients with classical LFLG AS have a low mean pressure gradient, with low transvalvular flow, and a reduced ejection fraction. On the other hand pseudo-severe AS occurs due to LV dysfunction. This leads to decreased cusp opening, and a smaller EOA, leading to overestimation of AS severity, since EOA measured by the continuity equation changes with flow rate. Dobutamine stress echocardiography (DSE) can be used to distinguish classical LFLG AS from pseudo-severe AS. A study has shown that in patients with LFLG AS, if the resting flow rate is normal (>200 ml/s), then the AVA assessed under resting conditions reflects the true severity of AS and is unlikely to change significantly with stress echocardiography. 54 Dimensionless valve index (DVI) is the ratio between LVOT VTI and AV VTI. It is a classical marker for the severity of AS. It ignores LVOT diameter and is thus less subject to measurement errors. However, it does not account for variations in patient size. Studies showed its prognostic implications in patients with AS, where a DVI <0.25 was associated with poorer outcomes. 55
Invasive less flow-dependent assessment of AS severity
Valvuloarterial impedance (Zva) is a measure of the global left ventricular afterload. It is the ratio of the global left ventricular systolic pressure over stroke volume indexed to body surface area. 56 The left ventricular systolic pressure has 2 main components: the systolic aortic pressure, and the mean aortic valve gradient, 57 therefore Zva = (systolic aortic pressure + MG)/stroke volume index). The invasive thermodilution and Fick methods are the established clinical standards to measure cardiac output. 58 More recently TTE has been proposed to measure the global left ventricular afterload.56,59 Severe AS is when Zva is greater than 4.5–5.0 mm Hg/ml/m2. Elevated Zva is a predictor of poor outcomes in patients with AS,60,61 even after transcatheter aortic valve replacement. 62 It is a flow-independent measure and can be useful for risk stratification to help guide decision-making.
Aortic valve resistance is defined as the ratio of pressure gradient over the flow rate expressed in units of dyne.s.cm−5. Aortic valve resistance is commonly calculated using cardiac catheterization with the following equation: (1.333 × MG × heart rate × systolic ejection period / cardiac output) where 1.333 is the conversion factor from mm Hg to dyne.s.cm−5. Valve resistance represents a functional index of hemodynamic impairment rather than an anatomic index. In addition, it is less flow-dependant than AVA assessed by cardiac catheterization,63,64 and by Doppler echocardiography.65,66 This is reasonable since in the formula used to calculate area, the pressure gradient is proportional to the square of flow while in the formula used to calculate resistance, the pressure gradient is proportional to the first power of flow. Moreover, unlike the Gorlin equation, valve resistance calculation does not require any empirical constant: it is simply the gradient divided by the flow.
67
Left ventricular mass correlates better with aortic valve resistance than with AVA.
68
Aortic valve resistance >280 dyne.s.cm−5 is the cutoff to define severe AS. Aortic valve resistance can also be accurately measured by Doppler echocardiography.65,66,69,70 Incorporation of such an index, especially since it is less flow-dependent than AVA, is important and should be used in clinical practice. Table 2 shows the formula and reference for each of Zva and AV resistance.
Formula and reference range for Zva and AV resistance.

AV: aortic valve, CO: cardiac output, HR: heart rate, MG: mean gradient, SEP: systolic ejection period, SVI: stroke volume index.
Surrogate markers for assessment of AS severity
Several surrogate markers that are flow-independent can be utilized for the assessment of AS severity. One such marker is the degree of aortic valve calcification as measured by CT. Rounded thresholds of 1200-1300 Agatston unit (AU) for women and 2000 AU for men have been validated to identify severe AS,71–73 and these thresholds are included in the guidelines.14,16 This can be utilized when echocardiographic parameters are inconclusive. Calcifications with higher density have been identified as a limitation of the Agatston score for coronary arteries since atherosclerotic lesions with dense calcifications could be stable and less likely to rupture. However, density weighting could be an advantage instead of a limitation in aortic stenosis since dense calcifications are more likely to result in leaflet stiffening and hemodynamic obstruction. 74
Prolonged ejection time and delayed peak velocity assessed by Doppler echocardiography are associated with severe AS.75,76 A novel marker that follows a similar concept is the time between left ventricular and aortic systolic pressure peaks assessed invasively. Prolonged time between left ventricular and aortic systolic pressure peaks is associated with severe AV calcification, 77 and thus can be used as an additional surrogate to differentiate low-gradient true severe AS.
Another staging system for AS was suggested based on the extent of upstream cardiac changes and damage, and it includes 5 stages; no cardiac damage, left ventricular damage, left atrial or mitral valve damage, pulmonary vasculature or tricuspid valve damage, and right ventricular damage. 78 This is important, especially given that left ventricular dysfunction has prognostic implications in patients with severe AS.79–82 Table 3 summarizes the surrogate markers that can be used to assess the severity of AS. Figure 1 summarizes the less flow-dependent assessment of AS severity.
Surrogate markers for assessment of AS severity.

Ao: aorta, AS: aortic stenosis, AV: aortic valve, CT: computed tomography, LV: left ventricle.
Moderate AS
Although aortic valve replacement is indicated in severe AS when the patient is symptomatic, or when LVEF is <50%,14,16 Moderate AS is associated with an elevated risk of cardiovascular events and mortality. 83 It is defined as AVA 1-1.5 cm2, and AV MG 20-40 mm Hg, and/or AV peak velocity 3-4 m/s. Echocardiography is still the most common imaging modality for AV assessment. When the criteria are concordant, moderate AS is diagnosed.14,16 But in 20%–40% of patients, the criteria are discordant84–86 if 1 parameter suggests moderate AS while the other parameters suggest mild or severe AS, and this in part could be due to the inaccuracies in the flow assessment previously discussed. DSE and cardiac CT are used in the case of discordant criteria to confirm the diagnosis of moderate AS. 83 DSE is generally utilized in patients with reduced LVEF but may also be considered in those with preserved LVEF if the flow rate normalizes with the use of dobutamine. 83 Severe AS is confirmed if the mean gradient is >40 mm Hg or peak velocity is >4 m/s and the AV area is <1 cm2 at a normalized flow rate with DSE. However, some patients with paradoxical LFLG moderate AS have a restrictive physiology with a small, thick left ventricle, and this can preclude flow normalization with DSE. If that is the case, the projected AVA at normal flow rate can be calculated (250 ml/s is the median value of normal flow rate).83,87 In cases where patients show no notable increase in flow rate (<15%) and DSE is inconclusive, or when DSE is contraindicated, non-contrast-enhanced cardiac CT for aortic valve calcium scoring can be utilized to confirm the severity of AS. A calcium score between 800 to 2000 AU in men and 400 to 1200 AU in women is consistent with moderate AS.71,88 However, CT calcium score may underestimate the severity of AS caused by leaflet fibrosis. Therefore, moderate AS should not be ruled out in patients with a low calcium score and degenerative leaflets on echocardiography. 89 Non-contrast CT and/or DSE remain the standard of care when TTE shows discordant criteria. If the results are still inconclusive and the true severity of AS is still not confirmed, cardiac catheterization with the administration of nitroprusside or dobutamine can be utilized. 90
Assessment of prosthetic aortic valves
Aortic valve replacement (AVR) has improved the longevity and quality of life of patients with aortic valve disease. However, prosthetic heart valves (PHV) suffer from several limitations including limited durability, suboptimal hemodynamics, and increased thrombogenicity. 91 Routine assessment is important given that PHV dysfunction and complications are potentially life-threatening. 91 Doppler echocardiography remains the imaging modality of choice for routine assessment, but other imaging modalities may be useful when valve dysfunction is suspected or when there is discordance between the echocardiographic assessment and the patient's clinical status.92,93
The morphology of the PHV is assessed by Doppler echocardiography. PHVs are known to cause artifacts that may affect the image quality. 94 For hemodynamic assessment, Doppler echocardiography is also the modality of choice. The antegrade flow pattern is unique for each PHV. Transprosthetic pressure gradient is measured similarly to native AV, using the simplified Bernoulli formula. Underestimation of the gradients may occur with failure to align the Doppler beam parallel to the highest velocity jet. This can be addressed by using multiple acoustic windows. Moreover, gradients may underestimate the presence and severity of PHV stenosis in the presence of a low-flow state or elevated systemic blood pressure. 93 Overestimation of the gradient occurs in high-flow states, the presence of significant pressure recovery, or capturing a mitral regurgitation flow signal. 93
The EOA of the PHV is less flow-dependent than the gradient, yet it is still prone to measurement and technical errors. Similarly to the native valve, the continuity equation is used. It is important to not have opening or closing clicks on the signal used to measure the LVOT VTI. 93 LVOT diameter should be measured just proximal to the apical border of the stent from the outer border to the outer border of the stent. It is important to not mistake the inner border of the prosthesis stent or ring for the inner edge of the LVOT. 93 In balloon-expandable transcatheter heart valves, LVOT diameter and velocity are measured immediately proximal to the apical end of the stent, 95 whereas in self-expandable transcatheter heart valves, LVOT diameter is measured within the apical portion of the stent. The EOA of a given prosthesis size varies significantly depending on the annulus size, which is not the case with surgical PHVs. 96 Since the DVI is less dependent on valve size, it can be used to assess for prosthetic valve stenosis, particularly when it is difficult to accurately measure the LVOT diameter. The normal range for DVI of a prosthetic aortic valve is >0.30–0.35. 93 Flow ejection dynamics can also be used to assess for PHV stenosis. Continuous wave Doppler flow velocity through the PHV is used to measure acceleration time. If the acceleration time indexed to left ventricular ejection time is >0.37, this suggests aortic PHV stenosis. 93 Furthermore, as with native aortic valves, ignoring pressure recovery could lead to an overestimation of the severity of PHV stenosis. The energy loss coefficient can be used to correct for pressure recovery.
Other imaging modalities can be helpful if PHV dysfunction is suspected. Cinefluoroscopy is the most accurate, and least invasive method to assess the valve occluder mobility in mechanical aortic PHVs.97,98 It can be used to differentiate patient-prosthesis mismatch from acquired PHV stenosis, but cannot assess the etiology of reduced occlude mobility. 93 Cardiac CT can be used to assess most PHVs except those containing cobalt-chrome alloy rings.99,100 It can be used to assess the morphology and mobility of the PHV, to detect the cause and etiology of valve obstruction,92,101–103 and to assess the severity of PHV stenosis by planimetry. However, it is limited in the assessment of flow and hemodynamics. CMR can be beneficial as it can be used to measure the aortic regurgitant volume and fraction using phase-contrast imaging, the GOA of bioprosthetic valves by planimetry or cine CMR, and the EOA of all types of PHVs by phase-contrast CMR (using the continuity equation) or by direct measurement of the vena contracta.104–108 18F-NaF nuclear scanning can be used to visually highlight various pathological processes related to structural valve deterioration, including overt nodular calcification, thrombus, pannus, and non-specific leaflet thickening. 109 However, this method is experimental and is not currently used in a clinical setting. Finally, nuclear imaging with positron emission tomography (PET) or single photon emission computed tomography (SPECT), fused with CT can be used to detect PHV endocarditis and associated septic embolism. 110 Table 4 summarizes the different modalities that can be used to assess prosthetic aortic valve function.
Different modalities used to assess prosthetic AV function.
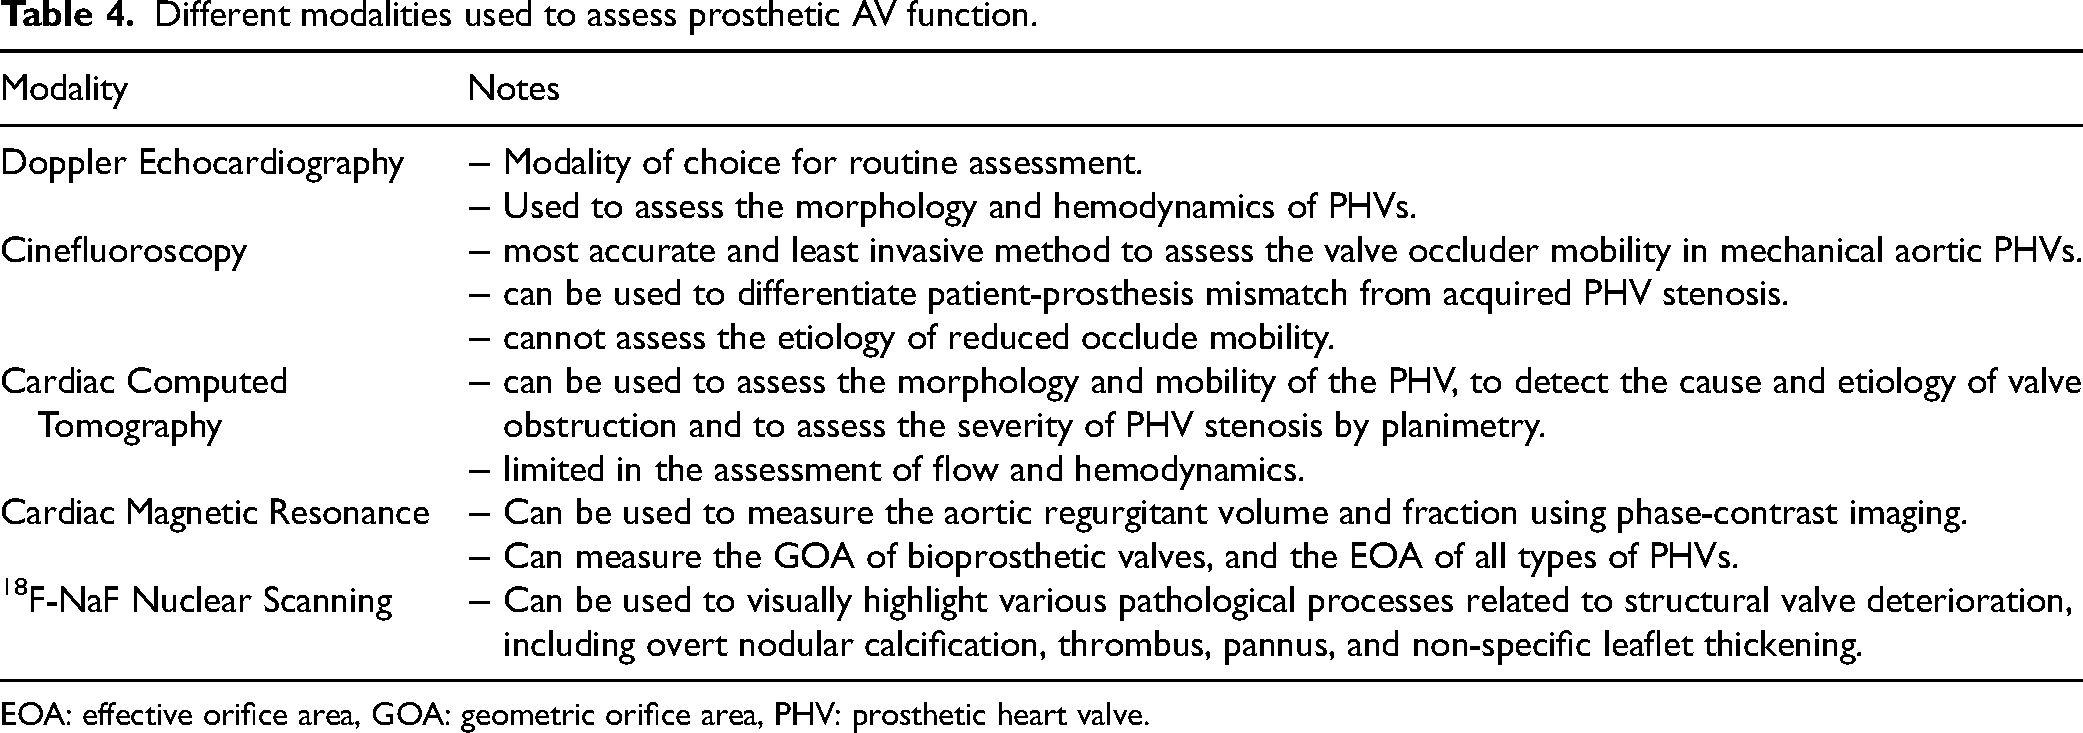
EOA: effective orifice area, GOA: geometric orifice area, PHV: prosthetic heart valve.
Conclusion
Doppler echocardiography is the most commonly used modality for the assessment of AS severity. Cardiac catheterization and CMR can also be utilized to resolve discrepancies between echocardiographic and clinical findings. Due to the inaccuracies in flow assessment, less flow-dependent methods for assessing AV severity can be utilized. Multimodality imaging is important in confirming the diagnosis of moderate AS with discordant criteria, and in the assessment of prosthetic aortic valves when valve dysfunction is suspected or when there is discordance between the echocardiographic assessment and the patient's clinical status.
Footnotes
Funding
The authors received no financial support for the research, authorship, and/or publication of this article.
Declaration of conflicting interests
The authors declared no potential conflicts of interest with respect to the research, authorship, and/or publication of this article.
References
Supplementary Material
Please find the following supplemental material available below.
For Open Access articles published under a Creative Commons License, all supplemental material carries the same license as the article it is associated with.
For non-Open Access articles published, all supplemental material carries a non-exclusive license, and permission requests for re-use of supplemental material or any part of supplemental material shall be sent directly to the copyright owner as specified in the copyright notice associated with the article.