
Abstract
Background
Muscle wasting is a critical and underrecognized determinant of outcomes in intensive care, yet conventional core muscle measurements such as computed tomography (CT)-derived L3 Skeletal Muscle Index (L3 SMI) may overlook localized muscle loss and be confounded by fluid shifts. Point-of-care ultrasound (POCUS) offers a bedside, repeatable method for assessing peripheral muscle thickness.
Objectives
To determine the prognostic value of peripheral muscle thickness, measured by POCUS, in predicting mortality, frailty, and functional outcomes in critically ill patients; and to compare these findings with core muscle mass assessed by L3 SMI.
Design
Prospective, single-center, observational study of critically ill adults admitted to the ICU with sepsis or requiring organ support.
Methods
Fifty critically ill adults meeting Sepsis-3 criteria or requiring respiratory/vasopressor support underwent POCUS assessments of biceps brachii, rectus femoris, and vastus intermedius thickness at days 1, 7, and 14 post-ICU admission. Twenty-eight patients also had CT scans within 7 days for L3 SMI calculation. The primary outcome was in-hospital mortality; secondary outcomes included Clinical Frailty Score and Zubrod/ECOG performance status, 90-day mortality and hospital readmission, and number of organ dysfunction-free days. Muscle measurements were analyzed both raw and indexed to body surface area, with predictive performance assessed via correlation and receiver operating characteristic analysis.
Results
Day 1 biceps brachii thickness strongly predicted in-hospital mortality (area under the curve [AUC] 0.84; sensitivity 1.0, specificity 0.67) and retained predictive value for 30-day and 90-day mortality. Vastus intermedius thickness on Day 1 was moderately predictive (AUC 0.79). At later time points, larger vastus intermedius measurements correlated negatively with ICU- and ventilator-free days, suggesting edema-related pseudohypertrophy. L3 SMI did not significantly correlate with ultrasound-based muscle measurements or clinical outcomes. POCUS-derived peripheral muscle indexing was associated with frailty indices, highlighting its role in capturing meaningful functional deficits.
Conclusion
POCUS-based muscle assessments, particularly of the biceps brachii and vastus intermedius, provide valuable prognostic insights beyond conventional L3 SMI.
Introduction
In critically ill patients, timely and accurate prognostication is essential for guiding clinical decisions and improving patient outcomes. While various tools have been utilized to assess the severity of illness and predict recovery, point-of-care ultrasound (POCUS) serves as a rapidly accessible and noninvasive method to provide valuable insight to real-time patient assessment. Traditionally, ultrasound has been used in monitoring hemodynamic, cardiac function, and fluid status. 1 More recently, its role in evaluating skeletal muscle mass has emerged as an area of interest given that muscle wasting is known to have profound implications in critically ill adults. 2
During critical illness, muscle mass can decrease by as much as 15% with 1 week, which equates to nearly 2% of skeletal muscle loss per day during the first week of ICU admission.3,4 The accelerated rate of muscle mass loss in critically ill patients stems from multiple converging processes, including upregulated catabolic pathways, suppressed protein synthesis, excess cortisol, and reduced physical activity, all of which contribute to muscle atrophy. 5 Furthermore, low muscle mass is associated with a myriad of negative health outcomes: prolonged hospitalization, hospital readmission, increased risk of long-term disability, increased risk of mortality, and poor functional recovery.6–8
Computed tomography (CT) has traditionally been a central diagnostic tool in critical care and is often used to quantify muscle loss by focusing on core musculature. A key metric, the L3 Skeletal Muscle Index (L3 SMI), involves measuring the cross-sectional area of core muscles—such as the psoas major, erector spinae, quadratus lumborum, paraspinals, transversus abdominis, rectus abdominis, and internal and external obliques—at the third lumbar vertebra and normalizing this area to body surface area. 9 Although L3 SMI is a popular method for assessing muscle mass, low values can be mistaken for sarcopenia unless reduced muscle function is also demonstrated. 10
However, relying solely on core muscle measurements may overlook key aspects of a patient's condition, particularly fluid imbalances arising from systemic inflammation, organ failure, and intravenous fluid administration. Such fluid shifts can distort muscle appearance on imaging, making tissues appear either edematous or atrophied regardless of true muscle mass. 11 By contrast, POCUS can rapidly evaluate peripheral muscle and thus offer a more comprehensive view of patient status. Incorporating POCUS findings into clinical practice may facilitate more accurate predictions of prognosis and guide targeted rehabilitation strategies in critically ill populations. 12
The goal of the present study was to explore the utility of POCUS as prognostic tool in critically ill patients. We hypothesized that appendicular muscle mass, assessed using POCUS, would correlate with nonappendicular muscle mass, quantified by L3 SMI, and that both measures would predict outcomes in critically ill patients. Our primary clinical outcome was in-hospital mortality; secondary outcomes included Clinical Frailty Score (CFS), Zubrod/ECOG Performance Status, 90-day mortality and hospital readmission, and number of organ dysfunction-free days.
Methods
Methodological Approach and Participant Selection
The study was designed as a single-center, prospective, observational cohort study. From April 2023 to July 2024, a Modified Early Warning Score-based algorithm was employed to identify critically ill patients with potential sepsis.13,14 Dual, independent investigator reviews were conducted to ensure unbiased identification of eligible patients from electronically flagged medical records.
Adult patients aged 18 years or older were eligible if identified within 48 h of critical illness onset and met Sepsis-3 criteria, defined as an increase in SOFA score of 2 or more in the context of suspected or confirmed infection. 15 Exclusion criteria included pregnancy, hematologic malignancies, long-term immunosuppression, hospice/palliative care status, and non-English language fluency without translation services available. Critical illness was further characterized by the requirement for continuous intravenous vasopressors or noninvasive/invasive respiratory support. The study was conducted in accordance with Strengthening the Reporting of Observational Studies in Epidemiology Initiative checklist for cohort studies. 16
Clinical Variables and Data Collection
Comprehensive clinical data were obtained through electronic medical records and supplemented by postdischarge interviews where appropriate. Severity of illness was assessed using the Charlson Comorbidity Index 17 and the Acute Physiology and Chronic Health Evaluation (APACHE) II score. 18 The primary outcome measure was in-hospital mortality. Secondary outcomes included 30-day CFS,19,20 30-day Zubrod/ECOG Performance Status, 21 30- and 90-day mortality, 90-day hospital readmission, and number of organ dysfunction-free days. The Zubrod and CFS were calculated using a standardized telephone questionnaire that assessed the following criteria: (1) mobility, (2) indicators of assistance with activities of daily living, including walking, dressing, transferring, toileting, and navigating stairs. Additional adjustments were made based on food intake and weight loss, where severe reductions in food intake or significant weight loss raised the frailty score by one point, emphasizing the impact of nutritional decline.
Assessment of Low Muscle Mass by CT
Axial CT images, 3.0 mm in thickness, obtained at the L3 vertebral level were retrieved in Digital Imaging and Communication in Medicine format from the Picture Archiving and Communication System. Abdominal or pelvic CT scans performed within 7 days of the index hospitalization were used to assess skeletal muscle mass. CT scans used for this study were obtained as part of routine clinical care. Given the critical condition of the enrolled patients, it was neither safe nor feasible to transport them to the imaging suite for research purposes alone.
Skeletal muscle area was manually measured using ImageJ software (version 1.53t; National Institutes of Health, Bethesda, MD, USA), 22 following standardized protocols (Figure 3).23,24 Both contrast-enhanced and noncontrast CT images were included in the analysis to calculate muscle area, consistent with previously validated methods. Low muscle mass, by CT measurement, was defined as an L3 SMI below the fifth percentile of a sex-matched reference population (41.6 cm2/m2 for males and 32.0 cm2/m2 for females), as previously reported.25,26
Peripheral Muscle Measurement by POCUS
POCUS was used to assess the muscle thickness of the biceps brachii, rectus femoris, and vastus intermedius of each patient within 48 h of critical illness onset. While the patient was lying supine, at 30° head elevation and with legs extended and arms supinated, the ultrasound transducer was placed perpendicular to the long axis of the targeted muscle, as previously described (Figure 4).27,28 Briefly, measurement of the biceps brachii muscle was made at the location two-thirds of the distance between the elbow fold and the tip of the acromion. 29 To measure the rectus femoris and vastus intermedius, the transducer was placed at the location halfway between the anterior superior iliac spine and the patella. All measurements from both the upper and lower extremities were taken from the same laterality. Three consecutive measurements were taken of each muscle by the same investigator on Day 1, Day 7, and Day 14. Muscle measurements were assessed both in raw form and indexed to body surface area, as calculated by the Mosteller formula. 30
Statistical Analysis
Our sample size was calculated based on a recent report comparing CT measurements of psoas area with ultrasound measurements of quadriceps depth to discriminate between frail and nonfrail patients. 27 All variables were summarized with descriptive statistics prior to any inferential analysis to assess their distributions. This included using histograms, normal probability plots, and tests for normality for continuous variables. All analyses were performed using SAS version 9.4 (SAS Institute, Cary, NC) using a significance level of .05.
A receiver operating characteristic analysis utilizing the area under the curve (AUC) was applied to determine the association of the muscle measurements with binary clinical outcomes such as in-hospital mortality, 30-day mortality, 90-day mortality, and 90-day readmission. For each clinical outcome, the Youden Index 31 was used to find the optimal cut point for each muscle measurement that maximizes both the sensitivity and specificity simultaneously, and the association of this cut point was then tested against the outcome using logistic regression which resulted in an odds ratio to estimate the magnitude and direction of the association.
Spearman correlation was applied to investigate the relationship between the muscle measurements and continuous clinical outcomes. We modeled frailty (CFS) and performance status (Zubrod score) using median (quantile-0.5) regression, with each indexed muscle size entered as the primary predictor and age and sex included as covariates.
Differences in the median of muscle measurements between categories for multinomial clinical outcomes with more than 2 groups such as discharge location and residence at 30 days were tested with a Kruskal–Wallis test including pairwise comparisons using Wilcoxon Rank Sum tests adjusted for multiple group comparisons with the Dwass, Steel, Critchlow-Flinger method. 32
Results
Patient Cohort
Fifty patients were included in the investigation, with a mean age of 62.9 ± 16.6 years, mean APACHE II score of 21.2 ± 7.2, and mean SOFA score 8.3 ± 3.9 on the day of enrollment (Table 1). Recruitment and follow-up data is illustrated in Supplemental Figure S1. Clinical outcomes for these critically ill patients are shown in Supplemental Table S1. Briefly, nearly half (48%) of the cohort met sepsis criteria, and 44% experienced shock, while 74% required vasopressor support on or following enrollment. Renal impairment was common, with 34% developing acute kidney injury. Mean BMI was 31.3 ± 10.0, and average laboratory values (eg, lactate 4.7 ± 5.4 mmol/L, leukocyte count 17.2 ± 9.2 × 10⁹/L, and procalcitonin 6.3 ± 7.5 ng/mL) reflected the high acuity of these patients.
Demographics and patient characteristics.

Abbreviations: APACHE II, Acute Physiology and Chronic Health Evaluation II.
Clinical outcomes were similarly indicative of severe illness. In-hospital mortality was 12%, rising to 22% at 30 days and 32% at 90 days, and 10% of survivors were readmitted within 90 days. Muscle measurements in survivors versus nonsurvivors are shown in Table 2.
Muscle measurements by in-hospital survival status.

Abbreviation: SMI, skeletal muscle index.
*P-value by independent (unpaired) two-sample t-test.
Participants averaged 23.2 ± 8.2 ventilator-free days and 19.1 ± 8.8 ICU-free days over the first 28 days, although many required ongoing care postdischarge: 42% were transferred to a skilled nursing or rehabilitation facility, and only 38% were discharged directly home. At 30 days, 21 patients resided at home, while 13 remained in hospital or required assisted living, highlighting the long-term impact of critical illness on functional recovery.
Skeletal Muscle Measurements
Twenty-two patients underwent only ultrasound assessment of muscle mass, while 28 patients also underwent CT scan within 7 days of enrollment. Four of the 28 patients undergoing both tests (14%) experienced the primary outcome of in-hospital mortality. Mean duration between initial hospital admission and first POCUS measurement was 1.7 ± 2.0 days. Core muscle measurements, measured by abdominal CT imaging, and peripheral muscle measurements, measured by POCUS, are shown in Supplemental Table S2 and in Figure 1.

Comparison of indexed muscle sizes of biceps brachii, rectus femoris, and vastus intermedius at days 1, 7, and 14 following onset of critical illness. Boxplots depict the distribution of muscle sizes indexed to body surface area for each muscle group on the specified days, in cm/m2. The median and interquartile range are shown within each box, with whiskers extending to 1.5 times the interquartile range. Outliers are represented as individual points. n=50 at day 1, n=26 at day 7, and n=9 at day 14.
L3 Skeletal Muscle Index Does Not Correlate With Peripheral Muscle Wasting
Our analysis revealed no significant correlation between L3 SMI and peripheral muscle measurements obtained via POCUS, including the biceps brachii, rectus femoris, and vastus intermedius sizes. Statistically, the correlation coefficients between L3 SMI and peripheral muscles of the upper and lower extremities were consistently weak and not significant (eg, biceps brachii: Spearman ρ = −0.12, P = .36; rectus femoris: ρ = 0.10, P = .42; vastus intermedius: ρ = −0.08, P = .51). Furthermore, L3 SMI was not predictive of in-hospital mortality, frailty as quantified by CFS or Zubrod score, nor did it correlate with ICU-free days, ventilator-free days, or vasopressor-free days.
Biceps Brachii as a Strong Predictor of in-Hospital Mortality
Among muscle measurements, the biceps brachii size and BSA-indexed biceps brachii size on day 1 (Bbd1 and Bbd1i, respectively) emerged as robust predictors of in-hospital mortality (Table 3, Figure 2). Bbd1 demonstrated the highest predictive accuracy with an AUC of 0.84 (95% CI [0.67, 0.97], P < .001), perfect sensitivity, and a specificity of 0.67.

Biceps brachii size as a predictor of in-hospital mortality, in critically ill patients. (a) Biceps brachii, measured on Day 1, demonstrates AUC 0.84 (95% CI [0.67, 0.97], P < .001), Youden Index = 0.67, mean size = 1.57 cm, sensitivity = 1, specificity = 0.67, (b) biceps brachii, measured on Day 1 and indexed to body surface area, demonstrates AUC 0.75 (95% CI [0.44, 0.98], P = .050, n = 50), Youden Index = 0.51, mean = 0.55 cm/m2, sensitivity = 0.6, specificity = 0.91, n = 50. Red line indicates the “no-skill” reference (AUC = 0.5).

Quantification of skeletal muscle area at the L3 axial level using computed tomography and ImageJ software. (A) The entire abdominal wall is manually traced (yellow outline) to establish the total region of interest. (B) The outer boundary of the abdominal muscles is delineated (yellow outline), and the corresponding area is calculated. (C) The inner boundary of the abdominal muscles is then traced (yellow outline), and its area is measured. (D) The vertebral region is excluded by subtracting its area. To distinguish skeletal muscle, a radiodensity threshold range of −29 to 150 Hounsfield units was applied.
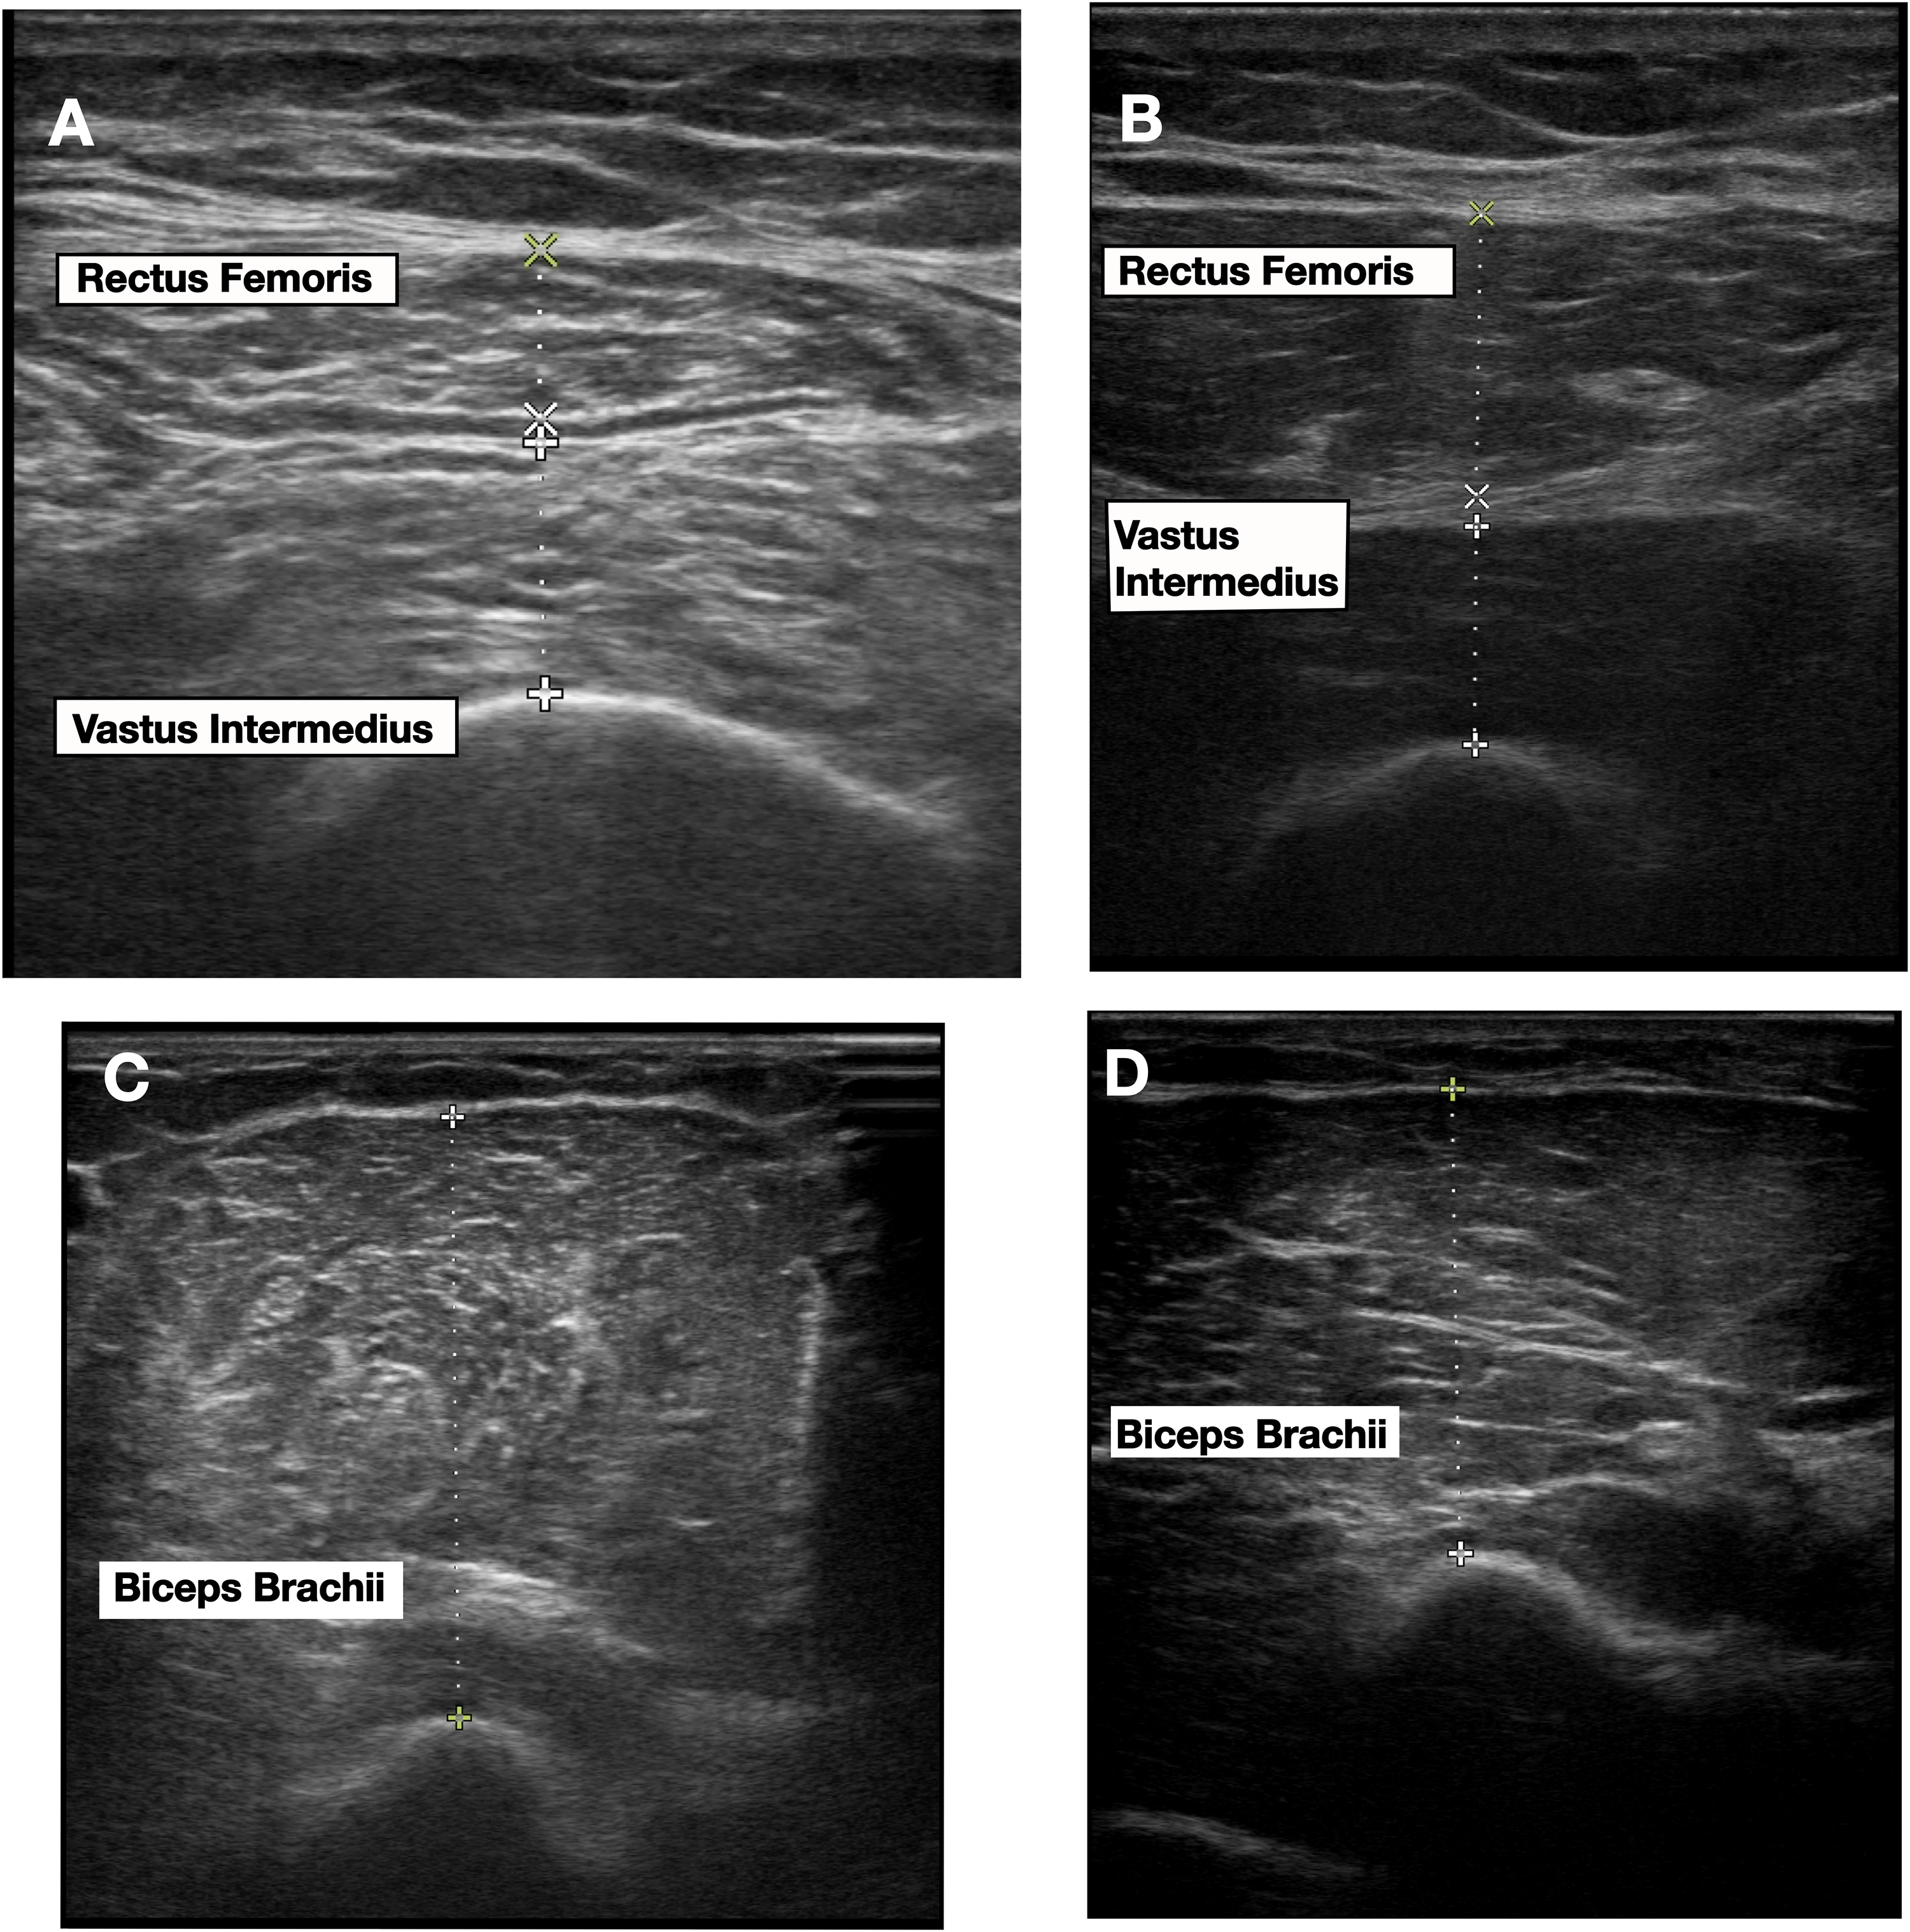
Point-of-care ultrasound for peripheral muscle measurement. Images (A) and (B) demonstrate measurements of rectus femoris and vastus intermedius muscles from two different patients, while images (C) and (D) demonstrate measurement of biceps brachii in these same two patients.
Biceps brachii measurements versus clinical outcomes.
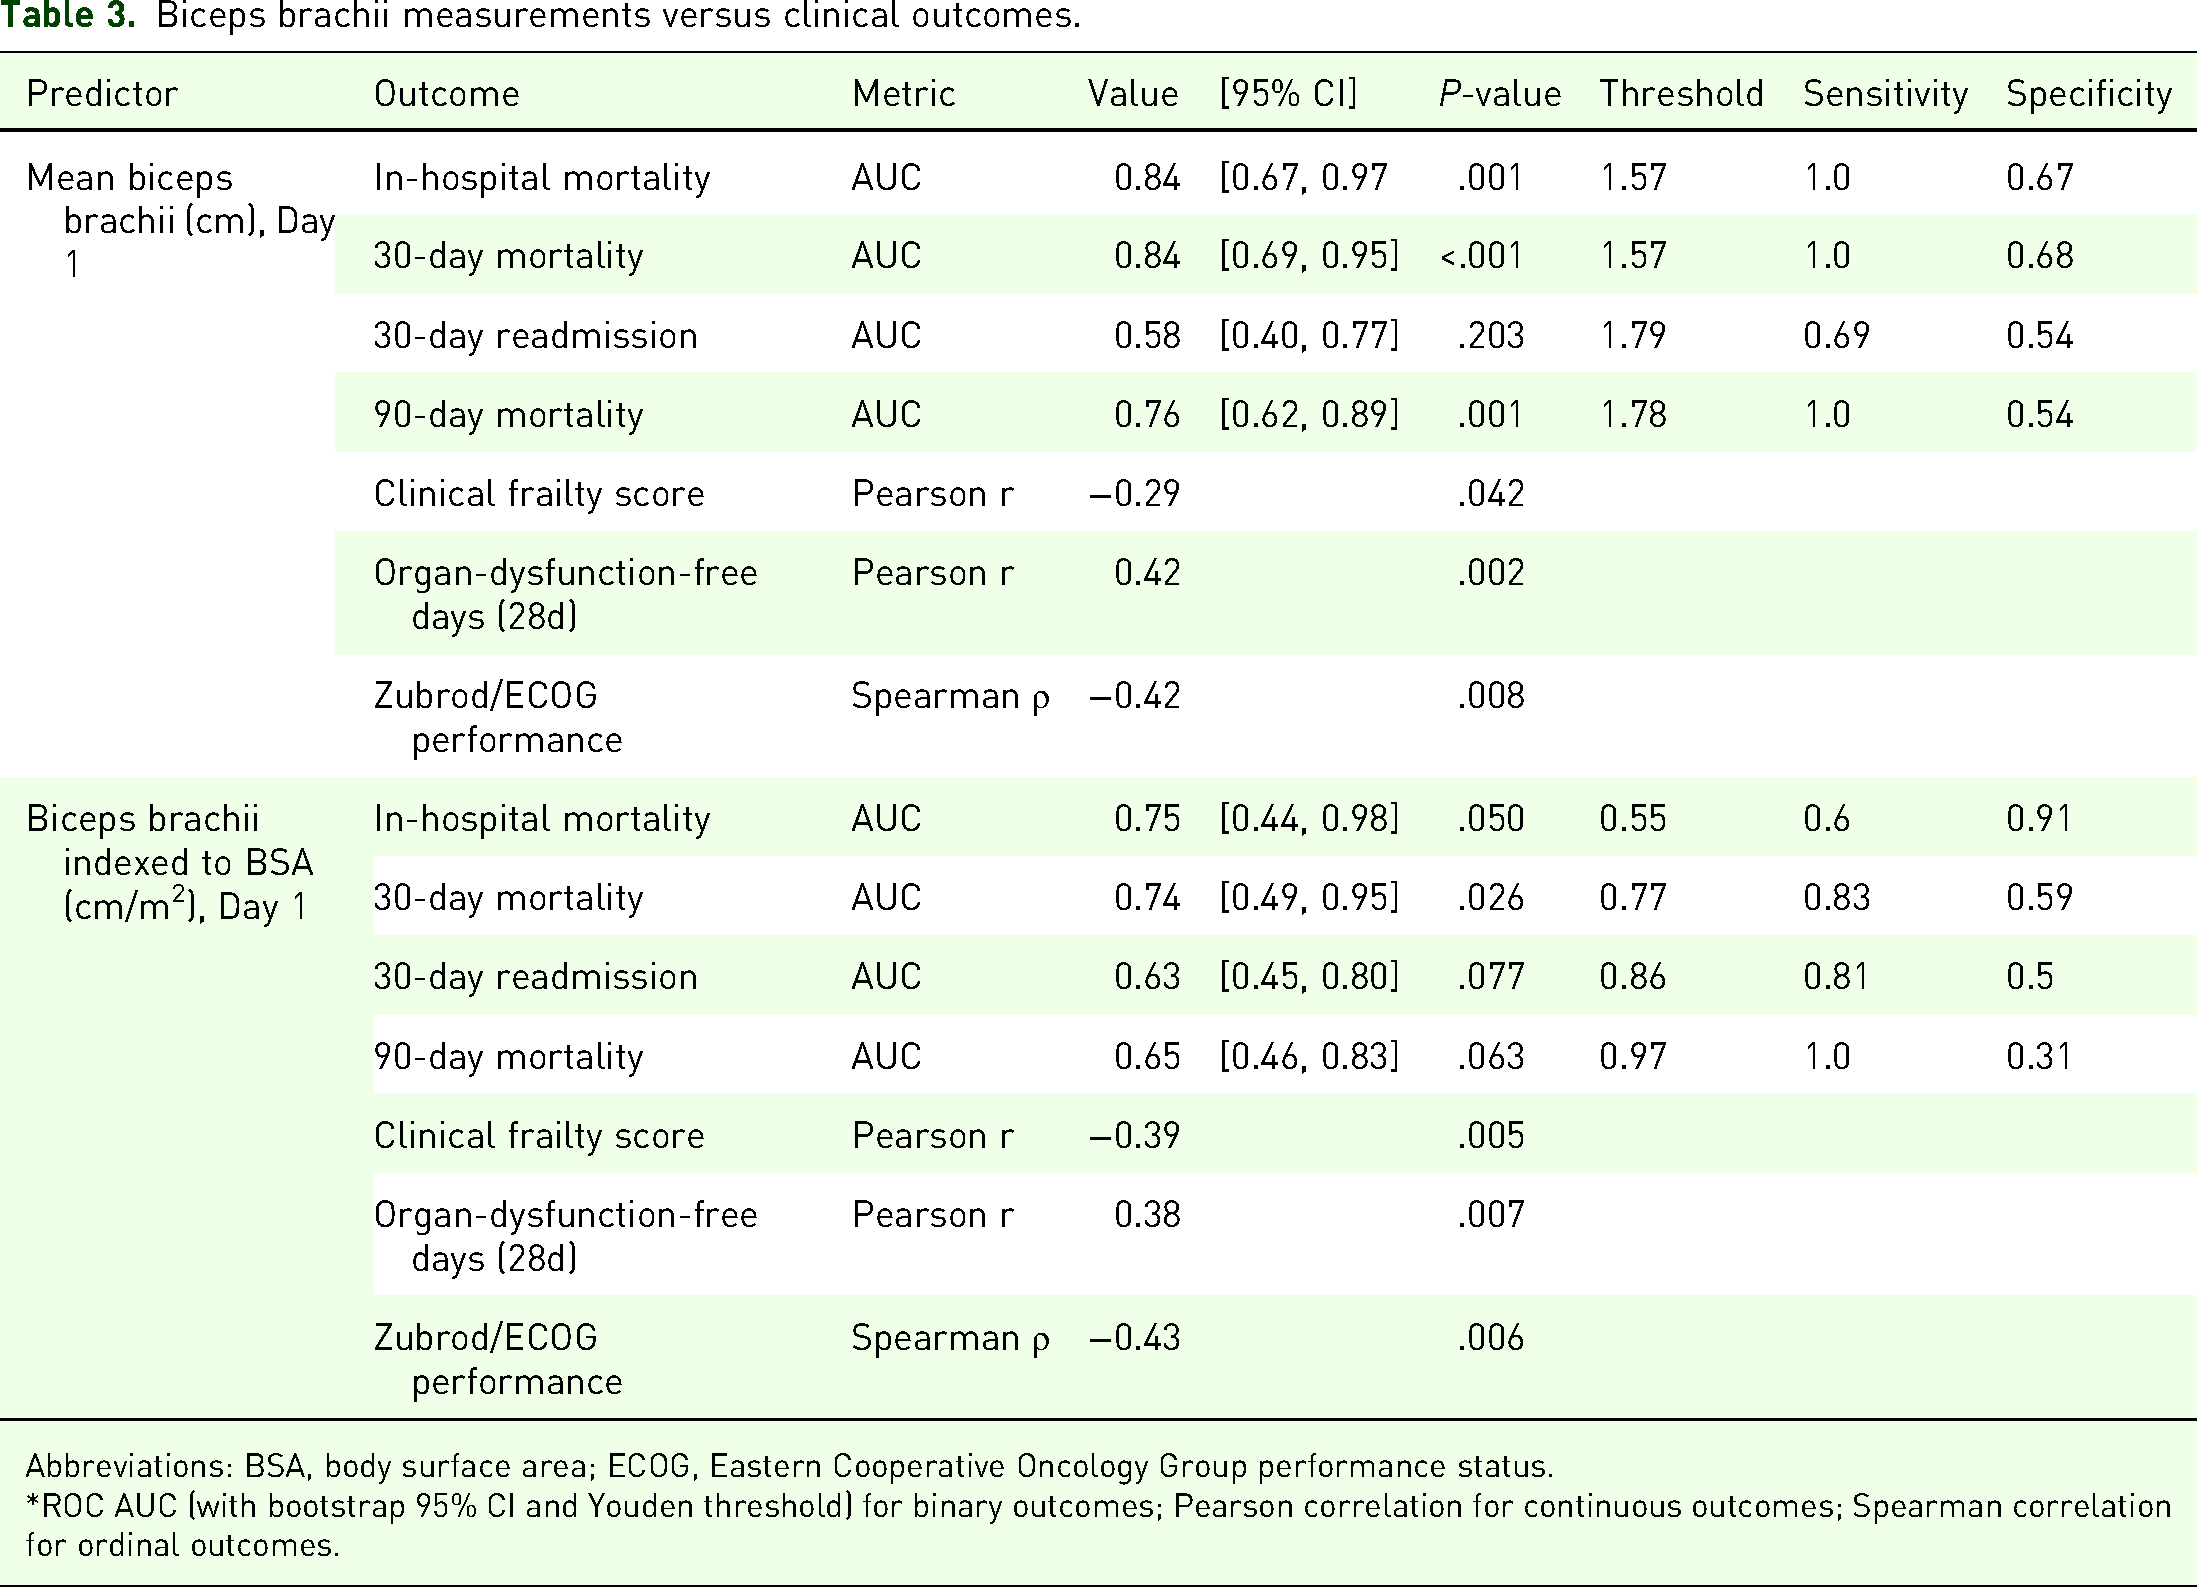
Abbreviations: BSA, body surface area; ECOG, Eastern Cooperative Oncology Group performance status.
*ROC AUC (with bootstrap 95% CI and Youden threshold) for binary outcomes; Pearson correlation for continuous outcomes; Spearman correlation for ordinal outcomes.
When indexed to BSA, the predictive performance of Bbd1i remained notable, achieving an AUC of 0.75 (95% CI [0.44, 0.98], P = .050) with improved specificity but reduced sensitivity. Similarly, vastus intermedius size on day 1 (Vid1) achieved statistical significance, with an AUC of 0.79 (95% CI [0.63, 0.95], P < .001), sensitivity of 1.0, and specificity of 0.6, while its BSA-indexed counterpart (Vid1i) had an AUC of 0.73 (95% CI [0.54, 0.92], P = .016), sensitivity of 1.0, and specificity of 0.49.
Biceps Brachii Indices as Predictors of 30-Day and 90-Day Mortality
For 30-day mortality, the biceps brachii size on day 1 (Bbd1) again demonstrated the highest predictive accuracy, with an AUC of 0.84 (95% CI [0.69, 0.95], P < .001), sensitivity of 1.0, and specificity of 0.68, maintaining its robustness when indexed to BSA (AUC = 0.74, 95% CI [0. 49, 0.95], P = .026). For 90-day mortality, Bbd1 also performed strongly, achieving an AUC of 0.76 (95% CI [0.62, 0.89], P < .001), sensitivity of 1.0, and specificity of 0.54.
Measurements at later time points were also informative; Bbd7i (Day 7, indexed to body surface area) achieved an AUC of 0.77 (95% CI [0.50, 1.00], P = .051), while Bbd14i (Day 14, indexed) displayed the highest overall accuracy for 90-day mortality, with an AUC of 0.88 (95% CI [0.63, 1.00], P = .003). Vastus intermedius (Vid1) had weaker, though still significant, predictive power for both 30-day (AUC = 0.71, P = .054) and 90-day mortality (AUC = 0.69, P = .023). These findings reinforce the superior utility of biceps brachii indices, particularly the indexed values at later time points, for predicting both short- and long-term mortality.
Relationship Between Muscle Size and Frailty Scores
Indexed muscle size on day 1 remained negatively correlated with frailty after adjustment for age and sex (Table 4). Spearman's ρ values were −0.38 (P = .007) for biceps brachii, −0.33 (P = .019) for rectus femoris, and −0.32 (P = .025) for vastus intermedius versus the CFS. In age- and sex-adjusted quantile regression, each 1 cm/m2 increase in biceps index predicted a −8.32-point change in CFS (95% CI [−13.99, −2.66]; P = .005), while rectus femoris remained borderline (–5.33; 95% CI [−10.61, −0.05]; P = .048) and vastus intermedius lost significance (P = .149).
Associations between Day-1 indexed muscle size and frailty/functional scores.

Abbreviations: CFS, Clinical Frailty Score; Zubrod, Zubrod/Eastern Cooperative Oncology Group performance status.
Note. *Spearman's ρ and p-values from unadjusted correlation analyses.
** Adjusted Δ per 1 cm/m2: change in median score associated with a 1 cm/m2 increase in muscle size, from quantile regression controlling for age and sex.
# QR p = P-value for the muscle coefficient in quantile regression, with each Day-1 indexed muscle size entered as the primary predictor and age and sex included as covariates to isolate the unique contribution of muscle size from these confounders.
For 30-day Zubrod/ECOG performance, Spearman's ρ was −0.43 (P = .007) for biceps, −0.28 (P = .084) for rectus, and −0.45 (P = .004) for vastus. Adjusted median regression confirmed biceps index as a robust predictor (–6.13; 95% CI [−9.97, −2.28]; P = .003), whereas rectus femoris (P = .070) and vastus intermedius (P = .004) were weaker or nonsignificant.
Low muscle mass by L3 SMI remained unassociated with either frailty measure, underscoring the superior sensitivity of early peripheral ultrasound indices for risk-stratification.
Relationship Between Muscle Measurements at Later Hospitalization Stages and Clinical Outcomes
Indexed muscle measurements at later stages of hospitalization tended to correlate negatively with key ICU outcomes. For instance, indexed biceps brachii size on Day 14 showed a strong negative correlation with 28-day ICU-free days (Spearman ρ = –0.72, P = .03, n = 9), whereas its relationship with ventilator-free days was weakly positive on Day 1 (ρ = 0.16, P = .26, n = 50) and nonsignificant on Day 14 (ρ = –0.23, P = .55, n = 9).
The Day 14 vastus intermedius index likewise showed a minimal negative correlation with ventilator-free days (ρ = –0.17, P = .67, n = 9) and a moderate negative correlation with organ-dysfunction-free days (ρ = –0.62, P = .08, n = 9). These patterns underscore how edema can inflate ultrasound measurements at later stages of critical illness, obscuring the true extent of muscle wasting.
Discussion
This study examined the size of various muscle groups (biceps brachii, vastus intermedius, and rectus femoris) in critically ill adults, revealing that each muscle group provided distinct and valuable insights into clinical outcomes. These findings underscore the importance of assessing multiple muscle groups to enhance prognostication and to guide clinical decision-making in critical care.
In the present analysis, the biceps brachii size measured early during critical illness demonstrated strong predictive capabilities for short- and long-term mortality outcomes. Its size on Day 1 showed significant predictive power for in-hospital mortality, indicating its utility as an early marker of systemic inflammation and catabolic states in critically ill patients. This aligns with prior studies linking upper limb muscle atrophy to adverse outcomes due to heightened proteolysis during systemic inflammation. 33 Additionally, our results align with those reported by Hadda et al, 34 who demonstrated that in patients with sepsis a decline in mid-arm muscle thickness of ≥ 6.6% between days 1 and 3 was a strong predictor of in-hospital mortality (AUC 0.81) and was associated with both ICU-acquired weakness and adverse 90-day outcomes. Similar to Hadda et al, in our analysis the Day-1 biceps measurement carried the greatest prognostic weight, but unlike their early-trajectory focus, its predictive strength diminished by days 7 and 14 (AUC falling from 0.84 on day 1 to 0.68 and 0.62, respectively). This decline likely reflects the confounding effects of fluid shifts—edema masking true muscle loss—and even compensatory fluid-driven “hypertrophy” as patients begin to recover, underscoring the importance of timing when using muscle ultrasound as a risk stratification tool. 3
Critically ill patients often accumulate fluid over time, which can artifactually enlarge muscle dimensions on ultrasound. 35 Although we did not detect significant increases in patient weight throughout hospitalization, this does not indicate an absence of net fluid accumulation—prolonged hospital stays are characterized by loss of lean muscle mass offset by interstitial fluid gain, often resulting in stable overall weight (and seemingly larger muscle measurements) despite major shifts in body composition.36–38 Consequently, those with more severe illness—and greater fluid shifts—may present with seemingly larger muscle measurements but experience poorer outcomes. These negative correlations may underscore late-stage muscle size (such as that of the vastus intermedius) as a marker of disease severity and fluid overload, rather than healthy muscle mass. Monitoring serial changes in muscle dimensions alongside fluid status may therefore provide valuable insights into the trajectory of critical illness and recovery potential. 39
The rectus femoris demonstrated weaker prognostic value as compared with the biceps brachii and vastus intermedius. Specifically, rectus femoris size correlated with frailty scores although its predictive utility for mortality and posthospitalization outcomes was limited. This may be due to its susceptibility to atrophy from prolonged immobility rather than systemic illness severity, consistent with findings in prior literature. 40
Contrary to our initial hypothesis, which predicted a strong correlation between L3 SMI and appendicular muscle mass assessed using POCUS, our results revealed no such relationship—and likewise no association between L3 SMI and long-term outcomes. However, multiple prior studies have demonstrated moderate to strong correlations between CT-derived L3 SMI and peripheral muscle ultrasound thickness in ICU and surgical cohorts. For example, Arai et al 41 found Spearman's ρ ≈ 0.57 for quadriceps layer thickness and ρ ≈ 0.48 for rectus femoris CSA versus L3 SMI, and similar ρ ≈ 0.57 to 0.60 for biceps brachii thickness. Nakanishi et al 42 reported that a composite upper-limb thickness index screened low L3 SMI with an AUC of 0.77 (95% CI [0.63, 0.91]). Lambell et al 43 demonstrated that summed mid-arm and bilateral thigh thickness correlated with CT muscle area at r = 0.85, while Paris et al 44 observed a more modest r ≈ 0.45 (P < .001) for quadriceps thickness alone. Even in non-ICU surgical patients, Hogenbirk et al 28 reported Pearson r ≈ 0.66 between bilateral biceps brachii thickness and L3 SMI.
Possible explanations for our null finding include the nonsimultaneous timing of CT and ultrasound (up to 7 days apart), small sample size (with only approximately 50% of study patients undergoing both CT and POCUS), unmeasured fluid shifts confounding POCUS assessments in the absence of detailed fluid-balance data, and heterogeneity in probe sites and patient clinical status. L3 SMI captures core musculature at a fixed anatomic site, whereas peripheral ultrasound reflects localized changes that may be more sensitive to edema, patient positioning, or regional atrophy. Together, these factors suggest that while POCUS is a valid screening tool for sarcopenia when properly timed and adjusted for fluid status, L3 SMI and peripheral muscle thickness measurements may diverge if those conditions are not met.
Alternatively, peripheral muscle wasting, particularly in weight-bearing muscles like the vastus intermedius, may better reflect clinical trajectories, as evidenced by their stronger correlations with functional outcomes. This discrepancy suggests that different mechanisms underlie core and peripheral muscle atrophy during critical illness, necessitating a nuanced approach to evaluating muscle health and frailty in this population.
Limitations
This study has several important limitations that should be considered when interpreting our findings. First, it was conducted at a single, tertiary-care academic center, which limits the external validity of our results; patient populations, treatment protocols, and resource availability may differ in smaller community hospitals or centers in other geographic regions. Second, we relied on postdischarge hospital interviews to assess long-term outcomes, and these can be subject to recall bias, incomplete reporting, or loss to follow-up, potentially affecting the accuracy of our outcome measures. Third, while our sample size was sufficient for preliminary analyses, a larger, multicenter cohort would be beneficial to strengthen the statistical power and increase the generalizability of the results. Fourth, although we measured muscle size, we did not directly assess functional outcomes such as handgrip strength or walking distance, which may more comprehensively capture the clinical significance of muscle wasting. Neither do we have information regarding physical therapy and rehabilitation during critical illness, which may influence muscle preservation and regrowth. For pragmatic reasons, we used CT scan measurements obtained within 7 days of study enrollment. While concurrently performed CT and ultrasound assessments would have minimized measurement error, this was not always feasible.
Conclusion
Despite these limitations, our results open new avenues for investigation, especially regarding the role of localized muscle size assessment with POCUS and its interplay with systemic inflammation, organ dysfunction, and fluid management. Future larger-scale studies that prospectively track muscle function, edema, and inflammatory markers across diverse patient populations will help clarify the mechanisms of peripheral muscle wasting in critical illness and refine our ability to predict patient recovery.
Supplemental Material
sj-docx-1-cra-10.1177_29768675251397475 - Supplemental material for Point-of-Care Ultrasound as a Prognostic Tool in Critically Ill Patients: Insights Beyond Core Muscle Mass
Supplemental material, sj-docx-1-cra-10.1177_29768675251397475 for Point-of-Care Ultrasound as a Prognostic Tool in Critically Ill Patients: Insights Beyond Core Muscle Mass by Rachel Skoczynski, Jonathan Hansen, Sanjib Das Adhikary, Erik Lehman and Anthony S Bonavia in Therapeutic Advances in Pulmonary and Critical Care Medicine
Supplemental Material
sj-docx-2-cra-10.1177_29768675251397475 - Supplemental material for Point-of-Care Ultrasound as a Prognostic Tool in Critically Ill Patients: Insights Beyond Core Muscle Mass
Supplemental material, sj-docx-2-cra-10.1177_29768675251397475 for Point-of-Care Ultrasound as a Prognostic Tool in Critically Ill Patients: Insights Beyond Core Muscle Mass by Rachel Skoczynski, Jonathan Hansen, Sanjib Das Adhikary, Erik Lehman and Anthony S Bonavia in Therapeutic Advances in Pulmonary and Critical Care Medicine
Footnotes
Acknowledgments
The authors would like to thank Ms Abigail Samuelsen and Ms Ruth-Ann Brown for coordinating the study.
Author Contribution(s)
Ethics Approval and Consent to Participate
This study was conducted following ethical approval from the Human Studies Protection Office/Institutional Review Board at the Penn State College of Medicine (IRB Approval No. 15328, approved on July 30, 2020 and modified on January 26, 2023). All procedures adhered to the ethical guidelines outlined by the Human Studies Protection Office and the Declaration of Helsinki.
Written informed consent was obtained directly from patients with decision-making capacity or from legally authorized representatives (LAR) for patients unable to provide consent. If LARs were not available to provide written consent in-person, they were allowed to provide consent over the phone instead, per IRB approval. This was done due to the time-sensitive nature of sample collection. The name of the patient's LAR, and the date and time of the phone consent was documented on the informed consent form by the study coordinator.
Funding
This study was funded by the National Institute of General Medical Sciences (Grant No. R35GM150695 (ASB)).
Conflict of Interest
The authors declared no potential conflicts of interest with respect to the research, authorship, and/or publication of this article.
Availability of Data and Materials
Data are available from the authors on reasonable request.
Supplemental Material
Supplemental material for this article is available online.
References
Supplementary Material
Please find the following supplemental material available below.
For Open Access articles published under a Creative Commons License, all supplemental material carries the same license as the article it is associated with.
For non-Open Access articles published, all supplemental material carries a non-exclusive license, and permission requests for re-use of supplemental material or any part of supplemental material shall be sent directly to the copyright owner as specified in the copyright notice associated with the article.