
Abstract
Poly(ethylene terephthalate) (PET) is one of the leading polymers in the packaging industry. It is often copolymerized with isophthalic acid (IPA) to tune its properties, yet its comonomer content is not always known. In this work, we develop simple Raman spectroscopy methods to quantify the IPA content of PET samples in the range most used for bottle production without any pretreatment. The calibration curves allow precise quantification of IPA content for amorphous samples (R2 = 0.997), and good estimates for semicrystalline samples (R2 = 0.952) and commercial products exhibiting common spectroscopic challenges. This work leverages the speed and accessibility of Raman spectroscopy for solid-state IPA quantification, making it a practical alternative to established techniques.
This is a visual representation of the abstract.
Introduction
Poly(ethylene terephthalate) (PET) is the third most widely used polymer in the packaging industry 1 behind only polyethylene and polypropylene.2,3 In particular, it is the most widely used polymer in single-use beverage packaging, with bottle production representing 80% of its market share.4,5 PET allows the production of transparent and colorless bottles that exhibit excellent barrier properties against moisture and CO2 while presenting high toughness and glass transition temperature.1,6 Like for other polymers, the properties of PET materials can be tailored by incorporating additives 7 and by tuning its forming processes, 8 but also by adapting its composition by copolymerization.
Poly(ethylene terephthalate) is most commonly synthesized by esterification of terephthalic acid (TPA) and ethylene glycol. A small fraction of isophthalic acid (IPA), the meta-substituted isomer of TPA, is often introduced to tune the properties of the polymer. The IPA repeat unit imposes a kink in the PET backbone, which breaks its regularity and effectively lowers its crystallinity by slowing crystallization kinetics 7 9–12 and hindering orientation-induced crystallization. 7 It also leads to a reduction of crystallite size because the IPA units are excluded from the crystalline phase.10,13 The combination of these phenomena reduces light scattering, allowing for clearer materials for packaging applications. 10 Increasing the IPA content also affects the processing properties by lowering the melting temperature.9–11,14 In addition, the meta substitution of IPA reduces benzene ring flipping, leading to increased gas barrier properties with IPA content.10,15 This comes with drawbacks as a higher IPA content has also been associated with lower glass transition temperature,9,10,14 lower modulus, 9 and higher thermal shrinkage. 7 For this reason, a delicate balance of TPA and IPA must be found for a given application. In injection stretch–blow molding of preforms for bottles, the IPA content typically ranges from 0 to 5%. 16
In this context, an accurate knowledge of IPA content in PET resins, preforms, and bottles is needed for both quality control and to tune the processing conditions. However, it can be withheld for industrial secrecy, 17 and it is unknown in mechanically recycled PET (rPET) due to variations in feedstock. PET is currently one of the most recycled polymers worldwide, with 23% of waste recycled to PET materials, 18 and the amount recycled is expected to keep growing in the upcoming years.19,20 Due to massive plastic pollution and fossil fuel depletion, several policies aim to increase the use of rPET in bottle manufacturing. The European Union is notably imposing a minimum incorporation of 25% rPET in single-use PET bottles by 2025, and of 30% by 2030. 19
A range of IPA quantification methods have been developed. The gold standard technique is solution proton nuclear magnetic resonance (NMR) because it allows the absolute determination of the comonomer content.21,22 However, the high cost of the NMR infrastructure restricts its accessibility and the slow solubilization step reduces the speed of the analysis. Liquid chromatography (LC) methods are well suited to quantify IPA in the context of the chemical recycling of PET because they require an initial depolymerization step.23,24 However, this first step limits their applicability in the context of mechanical recycling. A mass spectrometry approach has also been proposed, but it requires costly and inaccessible infrastructure. 25 Solution-based analysis is not the only way to quantify IPA. An instrument manufacturer has developed a near-infrared based solid-state approach that requires little sample preparation, but it relies on a proprietary chemometrics model. 26
Raman spectroscopy is a promising technique for IPA quantification because it allows for the rapid, non-destructive, and at-line analysis of solid-state samples, including with hand-held instruments. Raman methods are already well established to quantify a range of information on PET's structure, such as crystallinity, 27 amount of mesophase, 28 gauche and trans fractions of its ethylene glycol unit, 29 and molecular orientation.29–31 The Raman spectrum of PET resins copolymerized with IPA shows bands associated to its comonomer at 1002 and 655 cm–1. To our knowledge, this was exploited in only one public report for samples with ≥ 5% IPA, above the range typically present in resins used for PET bottles. 32 The calibration curve lost linearity below 10% IPA and the method was not directly applicable to bottles since the 1002 cm–1 band overlaps with a band associated to PET's crystalline and mesomorphic phases.
In this paper, we develop Raman spectroscopy methods to quantify the IPA content in solid-state PET samples in the composition range relevant to bottle production. Our calibration curves allow IPA quantification in both amorphous and semicrystalline samples without requiring chemometrics analysis or sample pretreatment. The method was also successfully used to estimate the IPA content in colored resins. Our results present Raman spectroscopy as a practical and reliable alternative for the quantification of IPA in copolymerized PET resins.
Experimental
Materials and Methods
A total of 8 resins were used to develop the calibration curves. Amorphous preforms and semicrystalline bottles from four resins (T60, RelPET H7761, FENC CB616, and RamaPET N180) were analyzed as received. The other four resins were provided as pellets. This included three semicrystalline resins (Cleartuf T95, Cleartuf P85HF, and RamaPET P184) from which at least five samples per resin were melt-quenched. About 15 mg of sample were placed in 40 µL aluminum pans (Perkin Elmer, cat. 0219-0041) and subjected to a 10-min 300 °C isotherm, followed by a ballistic cooling to room temperature in a Discovery X3 DSC (TA Instruments) equipped with an RCS90 cooler. Amorphous pellets were supplied for the other resin (Cleartuf P60), from which three samples were annealed at 170 °C for 30 min in the same instrument to produce semicrystalline samples. Additional challenging resins were delivered as amorphous preforms: A green LPR Ecocolor 0.8 resin made from recycled PET, and an opaque white Prelactia resin doped with titanium dioxide (TiO2) particles.
Raman Spectroscopy
Spectra were collected in the backscattering geometry with a LabRAM HR800 spectrometer (Horiba Scientific) coupled to an Olympus BX41 microscope. A 785 nm iXTRA laser (TOPTICA Photonics AG) was focused on the samples with a 10× Olympus MPlan N objective (NA = 0.25). The slit and confocal hole were set to 300 µm and a 600 grooves/mm grating was used. No waveplate or analyzer was placed in the optical path. Spectra were the result of 20 accumulations of 15 s, except for the green Ecocolor preforms, which saturated under these conditions. For these samples, acquisition parameters were adjusted to 75 accumulations of 4 s. All spectra used for IPA quantification were acquired as a single window from 525 to 1255 cm–1. Additional spectra were taken on both amorphous and semicrystalline samples of each resin from 580 to 1830 cm–1 to include the 1725 cm–1 carbonyl band. The full width at half-maximum (FWHM) of the carbonyl band was determined using the center of gravity option of the peak picking tool in the OPUS 6.0 software at 50% of the signal height.
Band intensities were determined with the OPUS 6.0 software using a Q integration method, which averages the local baseline on both sides of the peak. Table 1 shows the data ranges for the bands of interest.
Parameters used to determine Raman band intensities.

Proton Nuclear Magnetic Resonance
Solutions were prepared by dissolving 10 mg of PET resin in 1 mL of a 9:1 mixture of chloroform-d (Aldrich) and trifluoroacetic acid (Fisher Chemical). The dissolution of the TiO2-doped sample led to an opaque and milky solution which was centrifuged at about 6000 R/min for 15 min to extract the supernatant for analysis. All 1H NMR spectra were acquired on an AVANCE III spectrometer (Bruker) operating at 400.33 MHz and equipped with a 5 mm BBO Prodigy cryoprobe under Topspin 3.6.2. Experiments employed a 30-degree tip-angle pulse for excitation, data acquisition time of 4.09 s and a delay of 10 s between scans to permit relaxation of the spin system. Each spectrum was the sum 16 co-added scans.
The signals at 8.14 and 8.73 part per million (ppm), corresponding to four TPA protons and one IPA proton, respectively, were integrated. Absolute IPA contents were determined after correcting for the number of contributing protons.
Results and Discussion
Raman spectroscopy is a fast, non-destructive, and cost-effective technique commonly available in laboratories and readily implementable in production and recycling facilities. Figure 1 presents the Raman spectra of three amorphous PET resins with varying amounts of IPA. Two bands appear in the presence of the IPA comonomer: a more intense one at 1002 cm–1 and a less intense one at 655 cm–1 (inset). As detailed below, calibration curves based on both bands can be developed to quantify the IPA content.

Raman spectra of amorphous PET resins with varying IPA content (determined by 1H NMR), normalized to the 705 cm–1 band.
A set of eight PET resins with varying IPA content covering the range most used for bottle production, from 0 to 5% IPA, 16 was provided by Keiryo Packaging. It includes PET resins without any IPA comonomer, with a low IPA content such as RelPET H7761, which are designed for hot-filling applications, 33 with an intermediate IPA content like RamaPET N180 which are destined for heat set blow molding, 34 and with a higher IPA content such as the RamaPET P184 resin intended for thick-walled products. 34 Proton NMR spectra of each of the eight resins were measured in solution to quantify IPA content (see Supplemental Material for spectra). The NMR-derived IPA contents, such as those indicated in Figure 1, were then used as a reference to correlate Raman band ratios to actual IPA content.
Raman analysis was first carried out on essentially amorphous samples to avoid the aforementioned overlap with the 1002 cm–1 IPA band. Five resins were available as amorphous preforms or pellets. On the other hand, three resins in the form of pellets were semicrystalline and had to be melt-quenched to get amorphous samples. The low crystallinity of the samples was confirmed by Raman spectroscopy, which quantifies it in PET from the FWHM of the 1725 cm–1 carbonyl band as
35


Figure 2 shows the calibration curve for the 1002 cm–1 band normalized with respect to the 705 cm–1 band which serves as an internal reference to compensate for sample-to-sample variations in intensity due to difference in focus and surface roughness. The band intensities were determined without any pretreatment of the spectra. Each data point represents the average of 20 spectra taken from at least five independent samples of the same resin. The Raman data show strong agreement with the 1H NMR results, with linear regression yielding a coefficient of determination (R2) of 0.997. The method shows a similar linearity to the proprietary NIR-based approach, which is reported to present an R2 value of 0.995 over a smaller range (1.5 to 4.5%) of IPA content. 26 This indicates the I1002/I705 band ratio can reliably quantify the IPA content in amorphous PET samples. Spectra taken from the same resins show good repeatability, as manifested by the error bars corresponding to the standard deviation that are typically smaller than the symbol size. The variance is higher for pellets (from 0.03 to 0.08% IPA) than for preforms (from 0.02 to 0.04% IPA), most likely because the pellets had rougher surfaces which impacted the baseline.

IPA content calibration curve using the 1002 cm–1 band on amorphous samples.
The higher intensity of the 1002 cm–1 band makes it better suited for IPA quantification in amorphous samples than the 655 cm–1 band. In the amorphous phase, the ethylene glycol (EG) unit is predominantly present in its gauche conformation (∼80 to 90%). 36 However, it adopts a trans conformation in the crystalline phase and mesophase. 27 In semicrystalline samples, this translates to a drop in intensity of the 1044 cm–1 band, associated to the stretching of the C–O moiety in the gauche conformation, 37 and a rise of C–C and O–CH2 stretching bands of the trans conformer at 1000 cm–1. 29 This is illustrated in Figure 3, where a quenched sample (blue) is compared to a semicrystalline one (red) of a high IPA content resin (5.5%, top) and an intermediate content one (1.4%, bottom). The difference in crystallinity is also marked by the variation of the width of the carbonyl band, used with Equation. (1) and (2) to determine the degree of crystallinity.
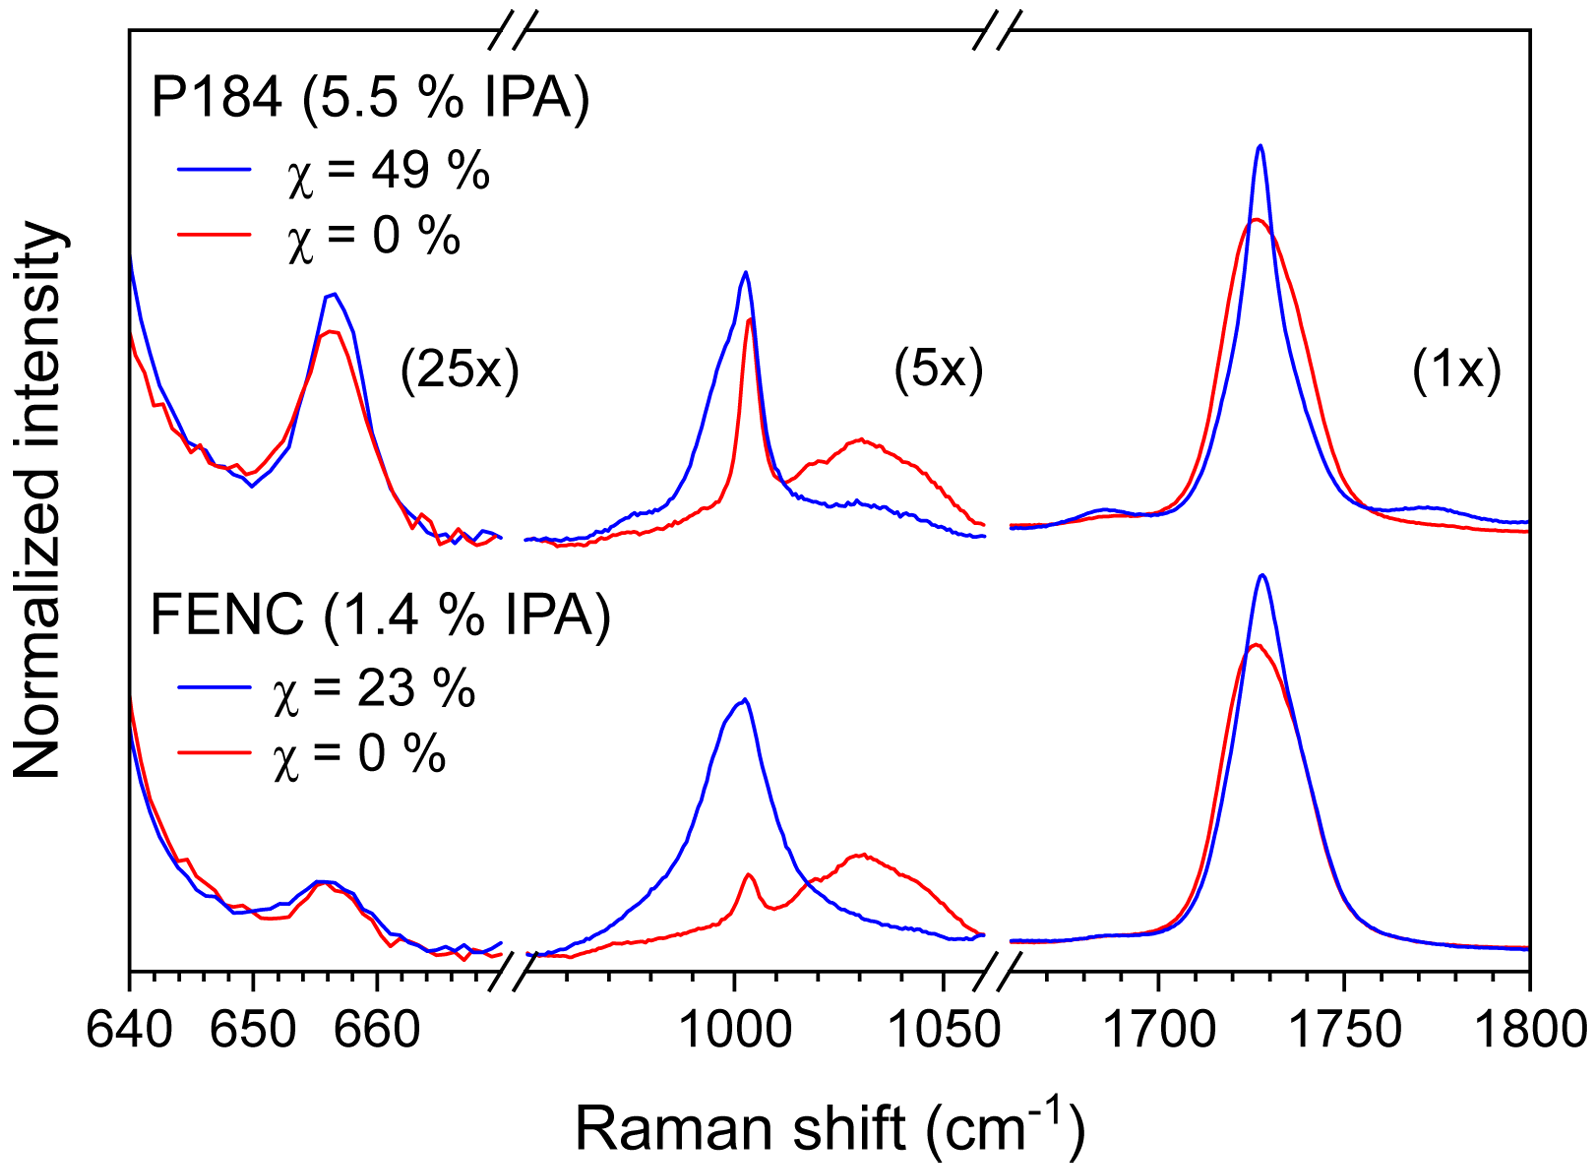
Raman spectra of amorphous (red) and semicrystalline (blue) samples of resins with high IPA content (top) and intermediate IPA comonomer (bottom). The intensity scales are adjusted in each break region as indicated.
The overlap of trans EG band and IPA band limits our ability to exploit the 1002 cm–1 calibration for semicrystalline samples. Unlike the 1002 cm–1 band, the 655 cm–1 band is largely unaffected by the conformation of the EG unit, which makes it more suitable for samples such as bottles, fibers, and semicrystalline pellets. Thus, a second calibration curve, presented in Figure 4, was generated using the I655/I705 band ratio for the same set of amorphous samples. It also presents a linear regression with the absolute IPA values determined by 1H NMR and a similar trend in repeatability, with higher variance for the quenched pellet samples compared to the preforms. The smaller intensity of the 655 cm–1 band results in a slope five times smaller than for the I1002/I705 curve. Despite this, the coefficient of determination remains respectable at R2 = 0.987.

IPA content calibration curve using the 655 cm–1 band on amorphous samples.
To evaluate the performance of the I655/I705 calibration, six spectra were taken on at least three independent semicrystalline samples from each of the eight resins. The crystallinity of these samples, determined by Raman spectroscopy, ranges from 17 to 35% for the four resins provided as bottles, from 49 to 52% for the three resins supplied as semicrystalline pellets, and is 29% for the annealed pellets of the initially amorphous resin. Figure 5 compares the IPA contents of the amorphous (red) and semicrystalline (blue) samples determined using the I655/I705 calibration plotted against 1H NMR results. While the performance is impacted by the increase in crystallinity (R2 = 0.952), the results indicate that Raman spectroscopy is a practical approach to estimate the IPA composition in semicrystalline samples, such as bottles and other packaging materials, without any sample pretreatment.
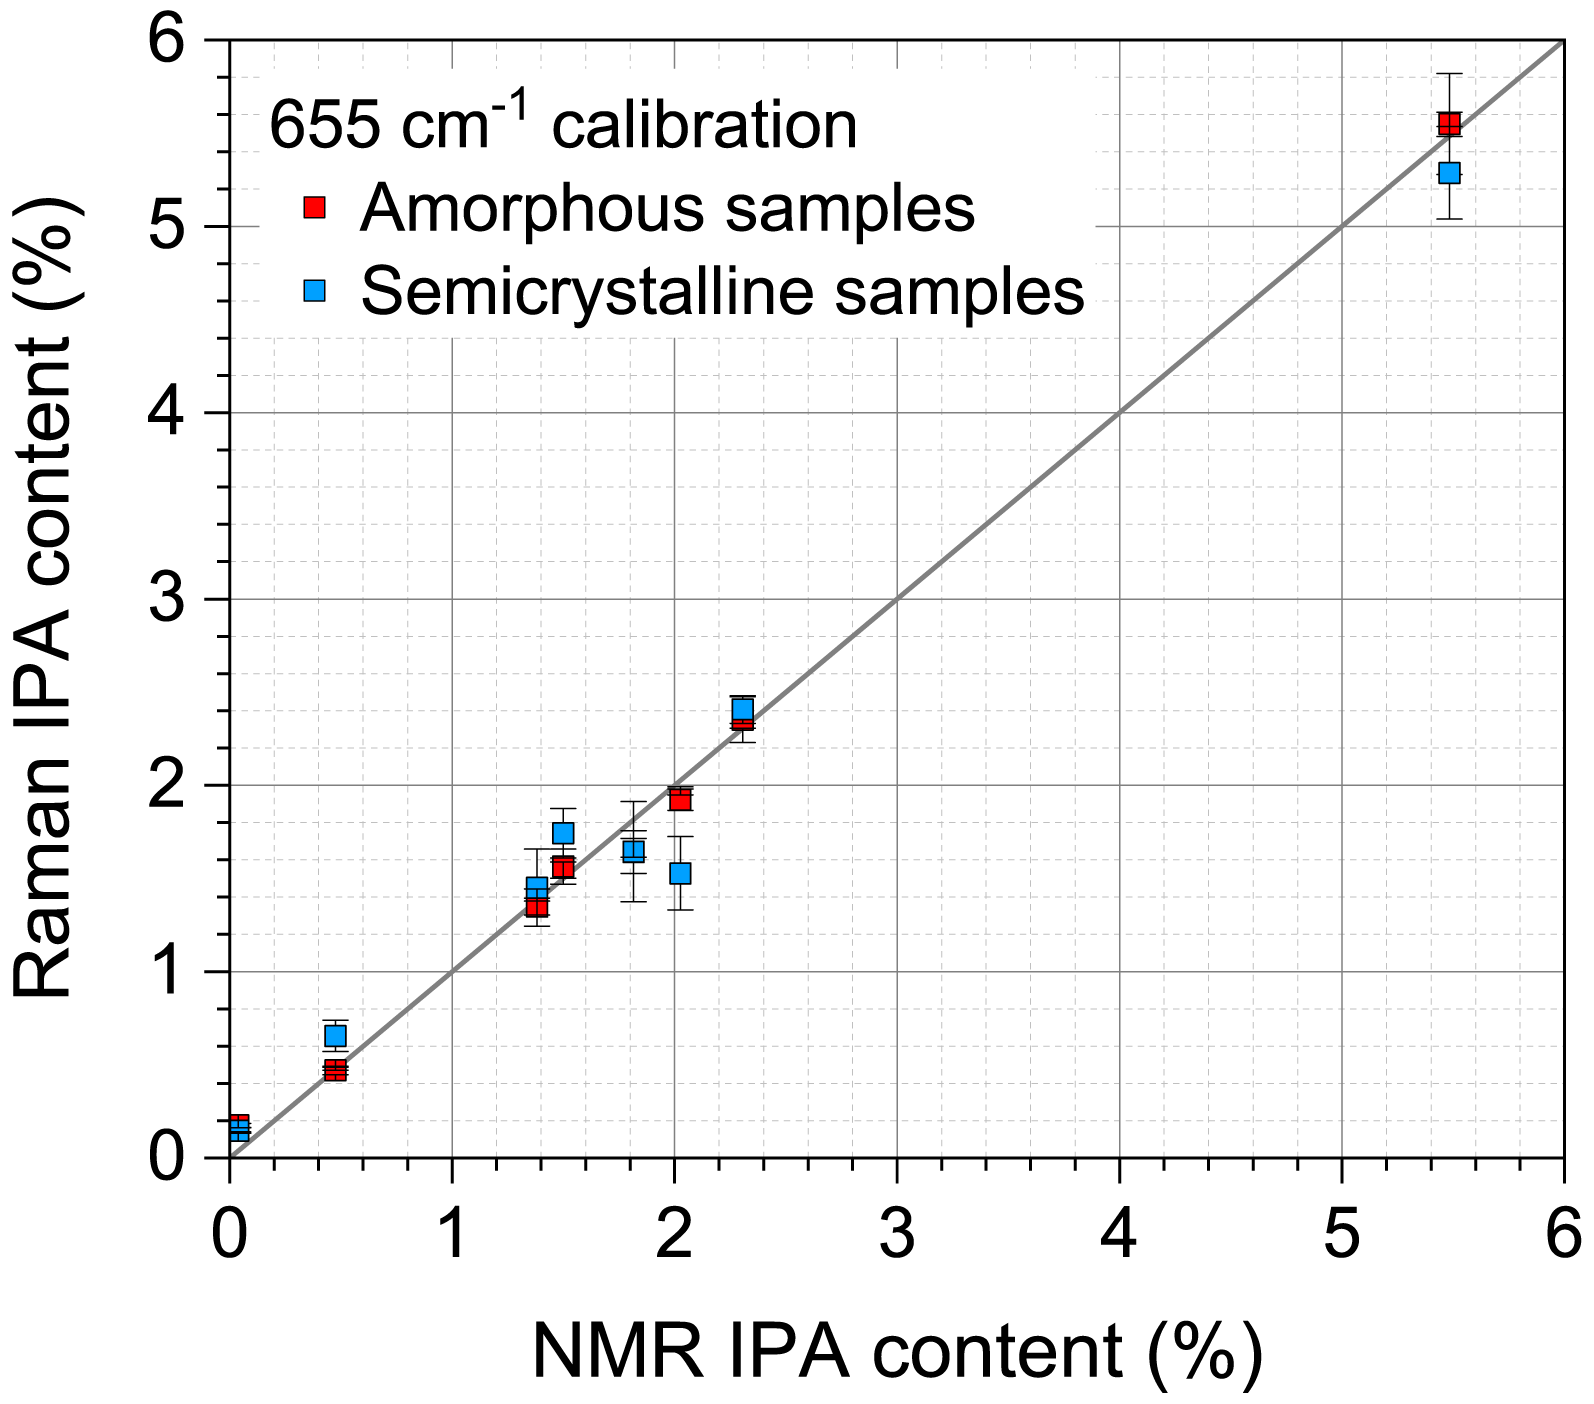
Performance of the I655/I705 calibration curve for amorphous (red) and semicrystalline (blue) samples.
Two additional samples, shown in Figure 6, were tested to demonstrate the ability of Raman spectroscopy to efficiently evaluate IPA content in challenging PET resins. The first sample is a green resin named Ecocolor which is composed of recycled PET and is produced through a process of the Lorraine Plast Recycling company that combines mechanical recycling and solid-state polymerization. 38 The colorant is added to extend the lifetime of the recycled resin but it introduces a strong fluorescence, a common challenge in Raman spectroscopy of commercial products. The second sample is a white resin dubbed Prelactia that takes its color from light scattered by TiO2 particles embedded in the matrix. TiO2 is frequently used in the packaging of food products such as milk and oils to protect them from ultraviolet (UV) radiation and to provide an opaque white appearance. 39 These two samples represent complex resins compared to the virgin PET pellets and preforms used to build the curves.

Raman spectra of green Ecocolor and white Prelactia amorphous preforms normalized to the 705 cm–1 band and pictures of the corresponding preforms.
The strong fluorescence of the Ecocolor resin and the presence of the 615 cm–1 TiO2 band (asterisk) of the Prelactia resin hindered our ability to exploit the 655 cm–1 calibration. Even so, the IPA contents determined from the I1002/I705 calibration were 1.88 and 2.53% for the Ecocolor and Prelactia resins and differed by only by 0.22 and 0.34% from the 1H NMR data, respectively. While the errors are higher than those observed for the clear preforms (typically 0.05% IPA), the method still provides a good estimate of the IPA content. Raman spectroscopy is thus a viable alternative to estimate IPA content in PET even in the presence of spectroscopically challenging additives.
Conclusion
Raman spectroscopy was successfully used to quantify the IPA content in copolymerized PET resins over the composition range (from 0 to 5.5%) most relevant to bottle production and recycling. Linear calibration curves were elaborated by plotting univariate Raman band ratios against reference IPA contents determined by 1H NMR. A high correlation (R2 = 0.997) was obtained using the 1002 cm–1 IPA band for amorphous samples. However, overlap with a trans conformer band of the ethylene glycol unit, abundant in the crystalline phase and mesophase, hinders its application for semicrystalline samples. An alternative calibration curve was developed using the weaker 655 cm–1 IPA band on the same set of amorphous samples (R2 = 0.987) and its applicability to semicrystalline samples was confirmed (R2 = 0.952). The robustness of the 1002 cm–1 calibration was further demonstrated on challenging commercial samples: a green and fluorescent recycled PET resin, and an opaque white TiO2-doped resin. These results enrich the already informative Raman spectrum of PET, and place Raman spectroscopy as a fast and accessible method for solid-state IPA quantification in copolymerized resins, which can be especially beneficial for at-line quality control and for recycled PET production.
Supplemental Material
sj-pdf-1-app-10.1177_27551857251398877 - Supplemental material for Determination of Isophthalic Acid Comonomer Content in Poly(Ethylene Terephthalate) (PET) Using Raman Spectroscopy
Supplemental material, sj-pdf-1-app-10.1177_27551857251398877 for Determination of Isophthalic Acid Comonomer Content in Poly(Ethylene Terephthalate) (PET) Using Raman Spectroscopy by Olivier Roy and Christian Pellerin in Applied Spectroscopy Practica
Footnotes
Acknowledgments
The authors thank Keiryo Packaging for generously providing the resins and preforms used in this study, and Dr. Pedro Aguiar for acquiring the NMR spectra.
Author Contributions
The manuscript was written through contributions of all authors. All authors have approved the final version of the manuscript.
Declaration of Conflicting Interests
The authors declared no potential conflicts of interest with respect to the research, authorship, and/or publication of this article.
Funding
This work was supported by a grant (RGPIN-05098-2020) and graduate scholarships from the Natural Sciences and Engineering Research Council of Canada (NSERC) and the Fonds de recherche du Québec–Nature et technologies (FRQNT).
Supplemental Material
All supplemental material mentioned in the text is available in the online version of the journal.
References
Supplementary Material
Please find the following supplemental material available below.
For Open Access articles published under a Creative Commons License, all supplemental material carries the same license as the article it is associated with.
For non-Open Access articles published, all supplemental material carries a non-exclusive license, and permission requests for re-use of supplemental material or any part of supplemental material shall be sent directly to the copyright owner as specified in the copyright notice associated with the article.