
Abstract
Anti-takeover provisions have long been associated with managerial entrenchment, self-interested strategic behaviors, and lower performance. Humphery-Jenner (2014) offers an opposing view, arguing that anti-takeover provisions can lead to beneficial managerial entrenchment for acquiring firms in hard-to-value industries. These firms are particularly vulnerable to opportunistic takeovers and once shielded from those threats, managers could undertake acquisition strategies that offer positive performance outcomes over a longer-term horizon. We replicate Humphery-Jenner's study to assess the boundaries and generalizability of his hypothesis. After we first reproduce his findings for his sample of 3935 acquisitions occurring between 1990 and 2005, we find no relationship between anti-takeover provisions, acquisitions by firms in hard-to-value industries, and firm performance in both an updated sample of acquisitions (3372 acquisitions made during 2006–2015) and a combined sample encompassing 7307 acquisitions spanning the complete 26-year period (1990–2015). We also find no relationships between anti-takeover provisions and acquisition performance in the replication. Overall, the beneficial managerial entrenchment hypothesis of acquisitions appears to have limits to its generalizability.
Introduction
Anti-takeover provisions (ATPs), such as poison pills, classified boards, and supermajority voting policies, protect firms from unwanted acquisitions (Agrawal & Mandelker, 1990; Davis, 1991; Wade et al., 1990). ATPs have traditionally been viewed through an agency theory lens, whereby they can lead to managerial entrenchment, self-interested acquisitions, and shareholder value destruction (e.g., Amihud & Lev, 1981; Mahoney & Mahoney, 1993; Morck et al., 1990; see Sundaramurthy, 1996 for a review). However, Humphery-Jenner (2014) (HJ) offers an opposing view, a “beneficial entrenchment” hypothesis for firms residing in “hard-to-value” (HTV) industries. He argues that these firms are difficult for outsiders to value, suffer discounted market valuations, and as a result, become prone to opportunistic takeovers (e.g., Mahoney & Mahoney, 1993). ATPs provide protection for these managers and gives them discretion to pursue acquisitions and performance objectives over a longer-term time horizon. Through insulating managers from corporate control contests, ATPs align managerial self-interests with ownership objectives to maximize performance. Data from 3935 acquisitions occurring from 1990 through 2005 support HJ's hypothesis. 1
The contradictory nature of HJ's argument motivates additional investigation to determine whether his insights represent a departure, revision, or a special case qualification to the classic agency theory-managerial entrenchment hypothesis of acquisition performance (e.g., Bergh, 1997; Kesner & Dalton, 1985; Walsh & Seward, 1990; see Mahoney & Mahoney, 1993, for a review.). A replication study provides that illumination: It affords a direct test of the generalizability of HJ's results to different time periods, ATP measures, and analytical approaches, and positions his hypothesis and findings in the cumulative knowledge base of managerial entrenchment and acquisition performance. The findings from such a study would offer perspective into the merits and scope of HJ's challenge to one of strategic management's most central theories, cornerstone concepts, and widely accepted relationships.
We attempt to replicate HJ's study. We vary his methodological decisions in stages “so that any differences in results can be attributed to the particular measures, method, or model” (Bettis et al., 2016: 2196) and allows us to examine the “robustness of the findings to different empirical approaches” (Ethiraj et al., 2016: 2191). Specifically, we reproduce HJ's exact data set and then replicate it using different entrenchment measures and time-period (e.g., Köhler & Cortina, 2023), similar in methodological process to another replication of agency theory and acquisitions (e.g., Lane et al., 1998). The replication is conducted using three samples of acquisitions: HJ's sample (1990–2005, n = 3935), a replicated sample of acquisitions occurring from 2006 to 2015 (n = 3372), and a combined sample encompassing the complete 26-year period (1990–2015, n = 7307). The first stage in the replication varies the ATP measure. We test HJ's ATP proxy, the GIM index (Gompers et al., 2003), replace it with the Bebchuk, Cohen and Farrell (BCF) E-index measures (Bebchuk et al., 2009) and re-examine the models using each of the three samples. 2 The second stage in the replication compares the findings of alternative longitudinal regression methods: Standard ordinary least squares (HJ's approach), firm fixed effects, and then hybrid mixed variance models (Allison, 2005).
Findings show that only one of the two acquisition-performance hypotheses retains its empirical support in HJ's sample when the GIM index is replaced by the BCF measure. That relationship, however, fails to receive any empirical support in the replicated and combined samples, leading to a non-replication outcome (Bonett, 2021). We next retest the samples using alternative longitudinal analytical models that can reveal sample-specific features that might lead to the non-replicability of the original findings. HJ's sample is found to have high between-firm variance that is statistically related to performance that does not exist in the replicated and combined samples. In addition, HJ's observed relationship exists for the GIM index in his own sample only. Further, in supplemental tests of the replication sample, HJ's empirical relationships are not apparent in endogeneity tests, using non-ratio dependent variables, subsamples of serial acquirers, and whether the acquisition occurred before or after implementation of the Sarbanes-Oxley (SOX) Act. Overall, the findings do not support the beneficial managerial entrenchment hypothesis. It is our conclusion that contextual factors unique to HJ's sample and his choice of ATP measure appear to drive his findings and conclusions.
Collectively, these findings alter the balance of evidence pertaining to the managerial entrenchment hypothesis of acquisition behaviors. HJ's challenge to the conventional agency view of managerial entrenchment, acquisition and performance is confirmed for his sample-period. In addition, methodology matters: Changes in how ATPs are measured and tested over time can lead to different results and introduce inconsistencies in knowledge accumulation. Overall, ATPs in the replication sample have no stable relationship to acquisition performance independently or in combination with the firm's industry membership, suggesting a larger challenge to the traditional agency theory entrenchment view than HJ might have originally envisioned. Indeed, the managerial entrenchment hypothesis, a longtime cornerstone of the agency theory explanation of acquisitions and takeovers, appears to have limitations to its generalizability.
Theoretical model and hypotheses
HJ's theoretical model draws from the concept of managerial entrenchment, which is rooted in the agency theory framework (e.g., Fama, 1980; Fama & Jensen, 1983; Shleifer & Vishny, 1989). He posits that ATPs shield managers from the “market for corporate control” (e.g., Faleye, 2007; Mahoney & Mahoney, 1993; Walsh & Seward, 1990), allowing them to pursue opportunistic strategies with less fear of external discipline (Bates et al., 2008; Jensen & Ruback, 1983; Walsh & Kosnik, 1993). Mahoney and Mahoney summarize this logic as follows: The separation of ownership and control allows entrenched managers a wide range of discretion … The managerial entrenchment hypothesis suggests that top management proposes and supports antitakeover amendments … to reduce employment risk and insulate themselves from competition in the takeover market (page 19).
By contrast, HJ posits that ATPs can also lead to beneficial entrenchment (Harris, 1990; Stein, 1988). He argues that the safeguards from ATPs will be particularly beneficial for firms susceptible to opportunistic takeovers due to their vulnerability to discounted market values, such as those residing in HTV industries. Specifically, ATPs reduce managerial risk aversion and incentivize managers to undertake longer-term strategic initiatives that would include acquisitions. HJ notes that “…[i]n HTV companies, takeover protection (i.e., managerial entrenchment) might actually encourage managers to pursue investments that … could encourage long-term value creation …” (2014: 669). Conversely, if firms in HTV industries are not protected from takeovers, their managers would be less likely to make investments that could increase their uncertainty, potentially reduce their market value, and make them more susceptible to opportunistic takeover. When ATPs are present, managers have more discretion to make acquisitions that might increase uncertainty but result in longer-term performance benefits. Thus, ATPs help to align managerial and ownership interests, leading to the “beneficial entrenchment” hypothesis.
ATPs might further serve as an information signal of an acquiring firm's unobservable quality. HJ (2014: 670) argues that the presence of valuation difficulties for firms in HTV industries will lead investors to “rely on publicly available information about the acquirer to appraise the value of its investments” (Schijven & Hitt, 2012). While the stock market might “down-value” these firms due to difficulty in understanding their resources and performance prospects, investors could use ATPs to “offset this down valuation and infer quality”. ATPs would reflect a credible commitment that the HTV firm's governance has made to reduce its management's risk aversion. The stock market might therefore attribute that if a board of directors, which has access to internal information about the HTV firm and is presumably knowledgeable of its unobservable quality, is willing to protect the firm from takeover through ATPs, then the firm is likely to be more investment worthy. Further, these ATPs signal that the board has concluded that having these features in place will allow the firm to provide greater value to shareholders than they might otherwise receive from the acquisition of the firm by another.
Collectively, HJ predicts that acquiring firms having higher numbers of ATPs (e.g., are more entrenched) and that reside in HTV industries will receive more positive market reactions to their acquisition announcements and that these acquisitions will ultimately lead to higher post-acquisition performance than acquiring firms having fewer numbers of ATPs and do not reside in HTV industries:
Method
HJ's sample is “a cross-sectional dataset that comprises 3935 acquisition observations that were made between 1990 and 2005 by companies listed in the United States” (2014: 671). These acquisitions include only those that were 100% purchased by the acquirer, where data were available for both acquirer and target and did not have dual-class shares. In addition, the bidding firm must own less than 50% of the target before the acquisition, the transaction value must exceed $1 million, the target is at least 1% of the bidder's market capitalization 11 days before the announcement, and the bidder's data is available on Compustat, the Center for Research in Security Prices (CRSP) for 210 trading days prior to announcement, the Investor Responsibility Research Center governance dataset (later acquired by RiskMetrics) and the Thomson Reuters SDC Platinum M&A database.
Our replication uses these sources and selection criteria, began the next year after HJ's (2006), and ends with acquisitions made in 2015. Our final replication sample is 3372 acquisitions. The dependent variable measures including the stock market reaction (cumulative abnormal returns for the same temporal windows), Tobin's Q for years 1, 2, and 3 after the acquisition announcement date, and the data exist in CRSP and Compustat. HJ reports five independent variables for ATPs (GIM, BCF, I(CBOARD), I(GIM ≥ 10), and I(BCF ≥ 3)) though only I(GIM ≥ 10) is reported in the hypothesis tests. Since the GIM was not available in RiskMetrics after 2005, we used an alternative ATP index and its corresponding count variable (BCF E-Index). More specifically, the Bebchuk et al. (2009) BCF E-Index measure is a count of six ATPs, including staggered boards, limits to shareholder bylaw amendments, poison pills, golden parachutes, and supermajority requirements from mergers and charter amendments and is computed as I(BCF ≥ 3 = 1 or 0 if BCF ≤ 2). 3 Further, HJ's Table 5 reports that GIM and BCF correlate at 0.71 and the GIM index and BCF index correlate at 0.59 for his sample of acquisitions. All variable definitions, calculations for the HTV industries, control variables, instruments, and data sources are based on HJ's descriptions (pages 672–676).
Findings
Comparisons of HJ's sample and the replication sample based on independent t-tests are reported in Table 1. The two samples differ relative to CAR (replication, 0.930; HJ, 0.301, t = −4.30, p = 0.000), BCF (for the index: replication, 0.771; HJ, 0.450, t = −29.85, p = 0.000; for count: replication 3.483; HJ, 2.270, t = −37.55, p = 0.000), and almost all controls. Notably, the percentage of acquiring firms residing in HTV industries and acquiring firm size are about equal across the samples. Overall, the replication sample seems sufficiently different in context yet similar in acquiring firm characteristics to provide a credible assessment of the generalizability of HJ's hypothesis. 4
Descriptive statistics and comparisons of HJ and replication samples
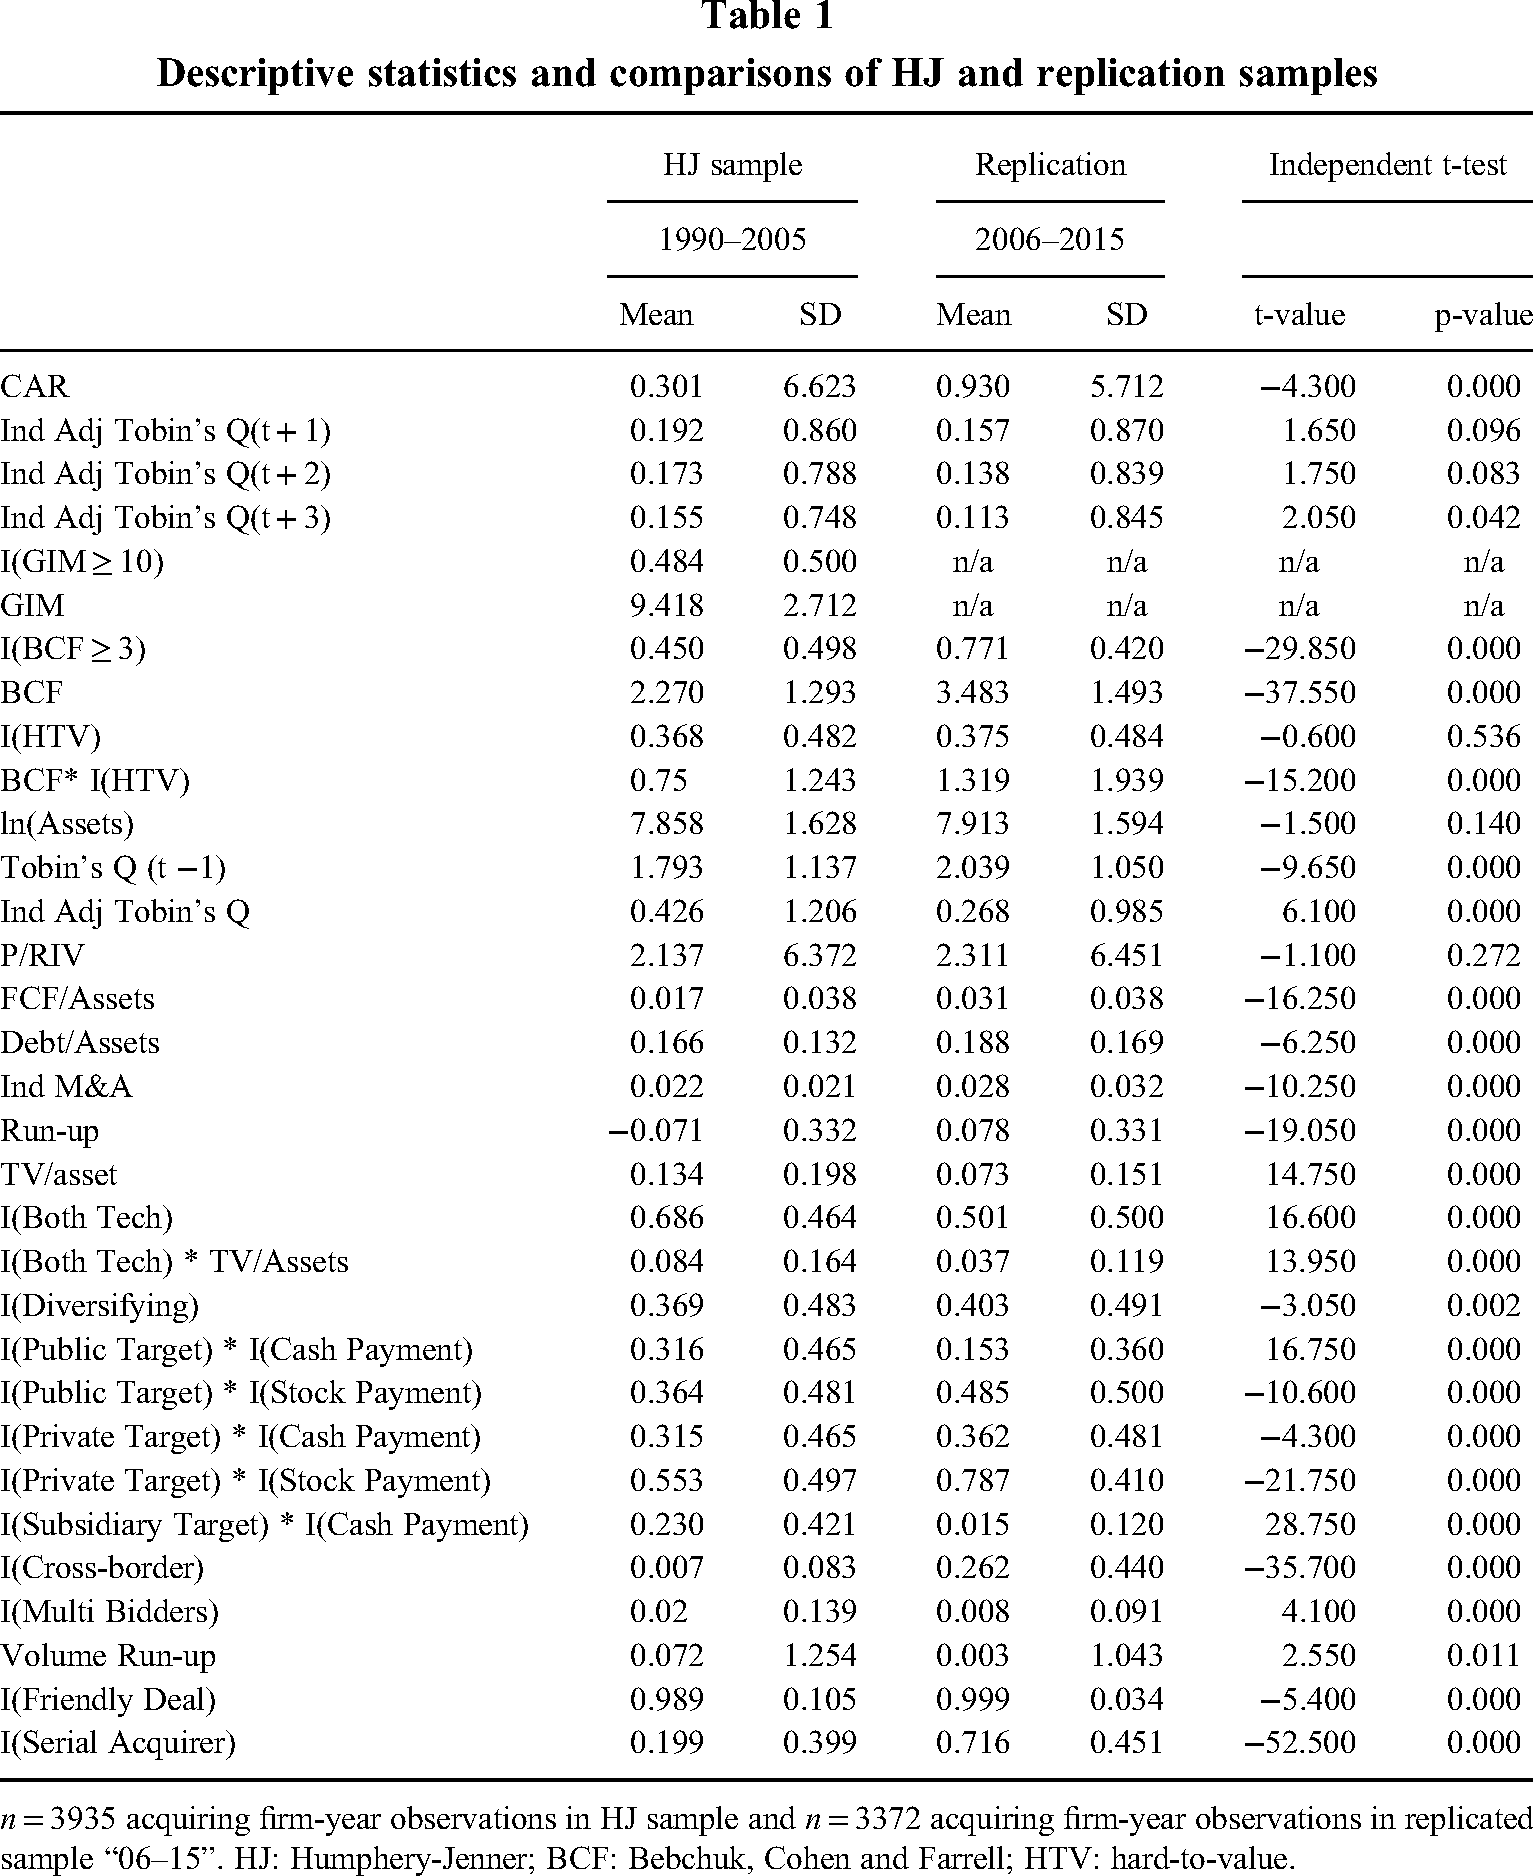
n = 3935 acquiring firm-year observations in HJ sample and n = 3372 acquiring firm-year observations in replicated sample “06–15”. HJ: Humphery-Jenner; BCF: Bebchuk, Cohen and Farrell; HTV: hard-to-value.
Reproducing HJ findings
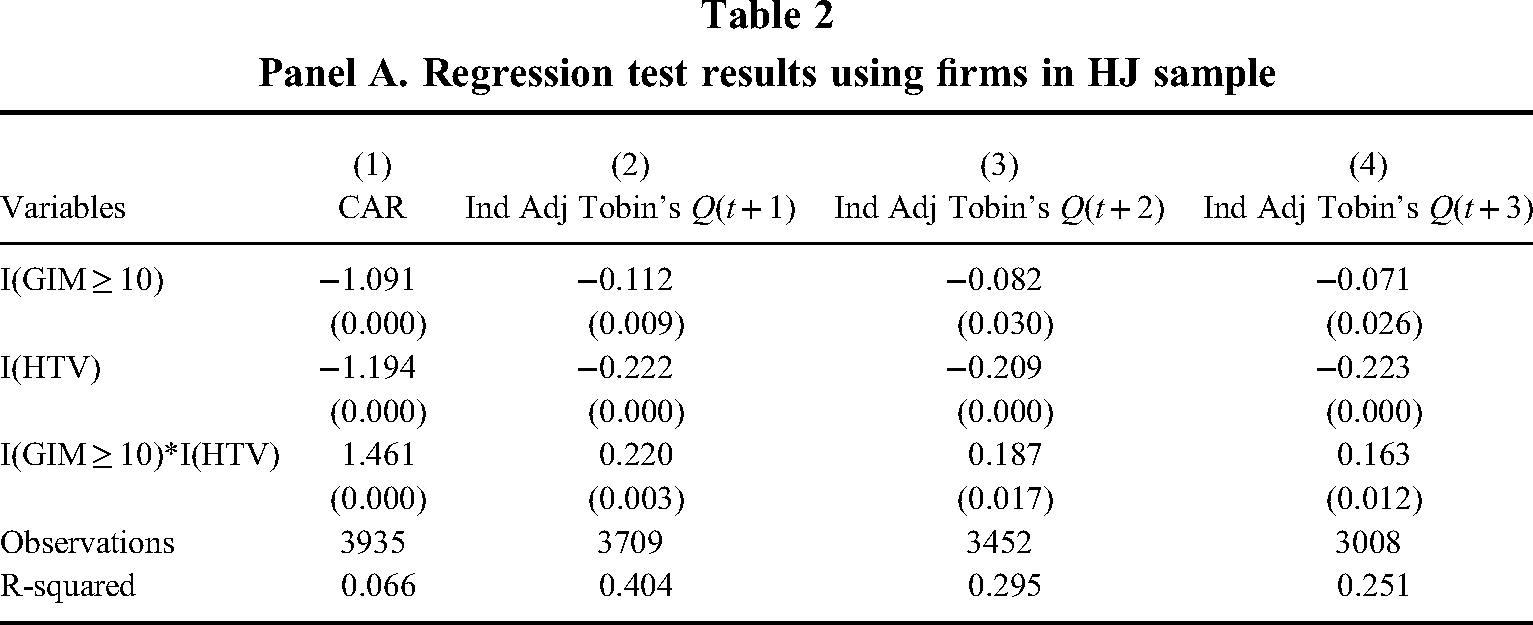
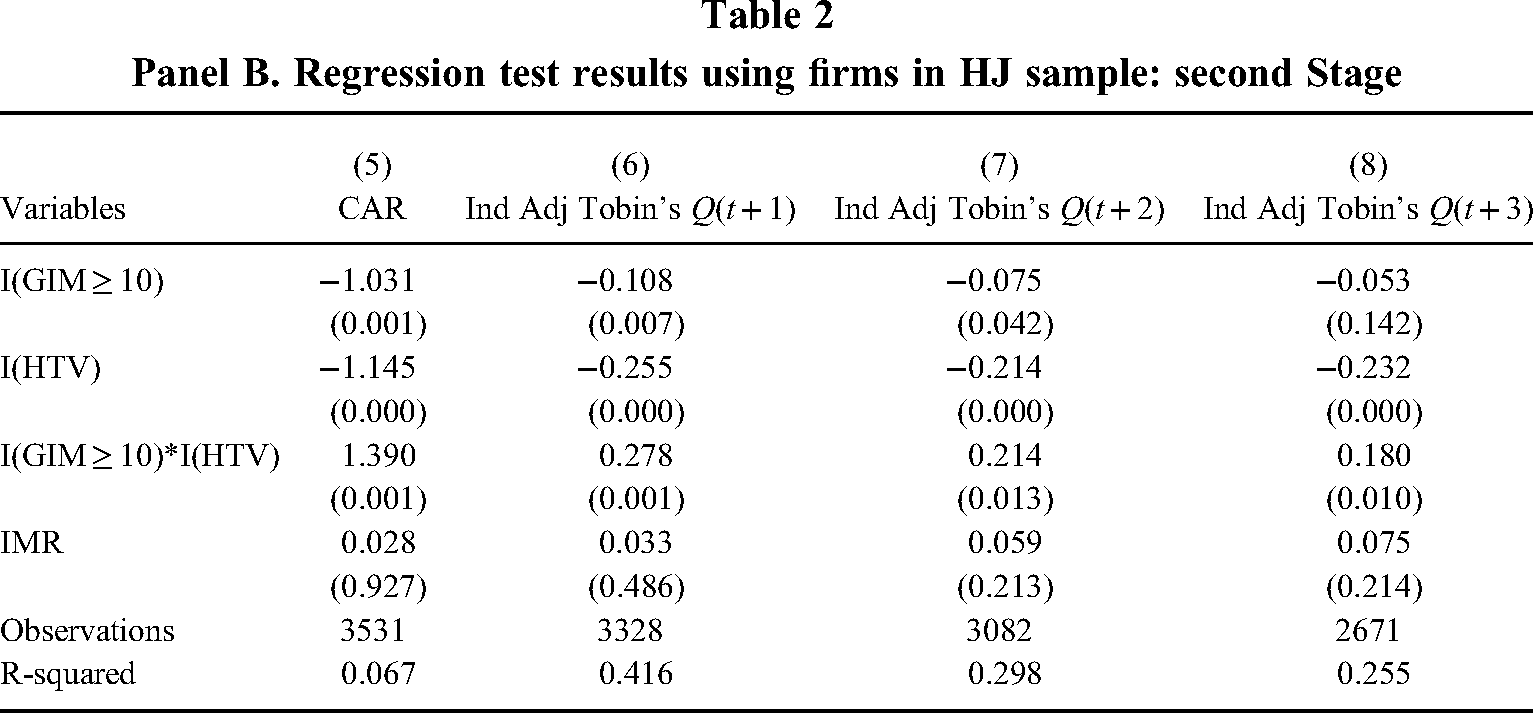
We first reproduce HJ's findings using his sample of acquisitions, reported ATP measure (I(GIM)), and disclosed and undisclosed analyses (Heckman 2SLS models, and including data adjustment for outliers, industry, year, and firm effects; the instrument variable is the average ATPs in the firm's home state on a state-year level basis, see Appendix Table A1 for the first stage model). Complete models including controls are available upon request. The results appear in three panels in Table 2.
Panel A. Regression test results using firms in HJ sample
Panel B. Regression test results using firms in HJ sample: second Stage
Panel C. Regression test results of firms in HJ sample and firm effects
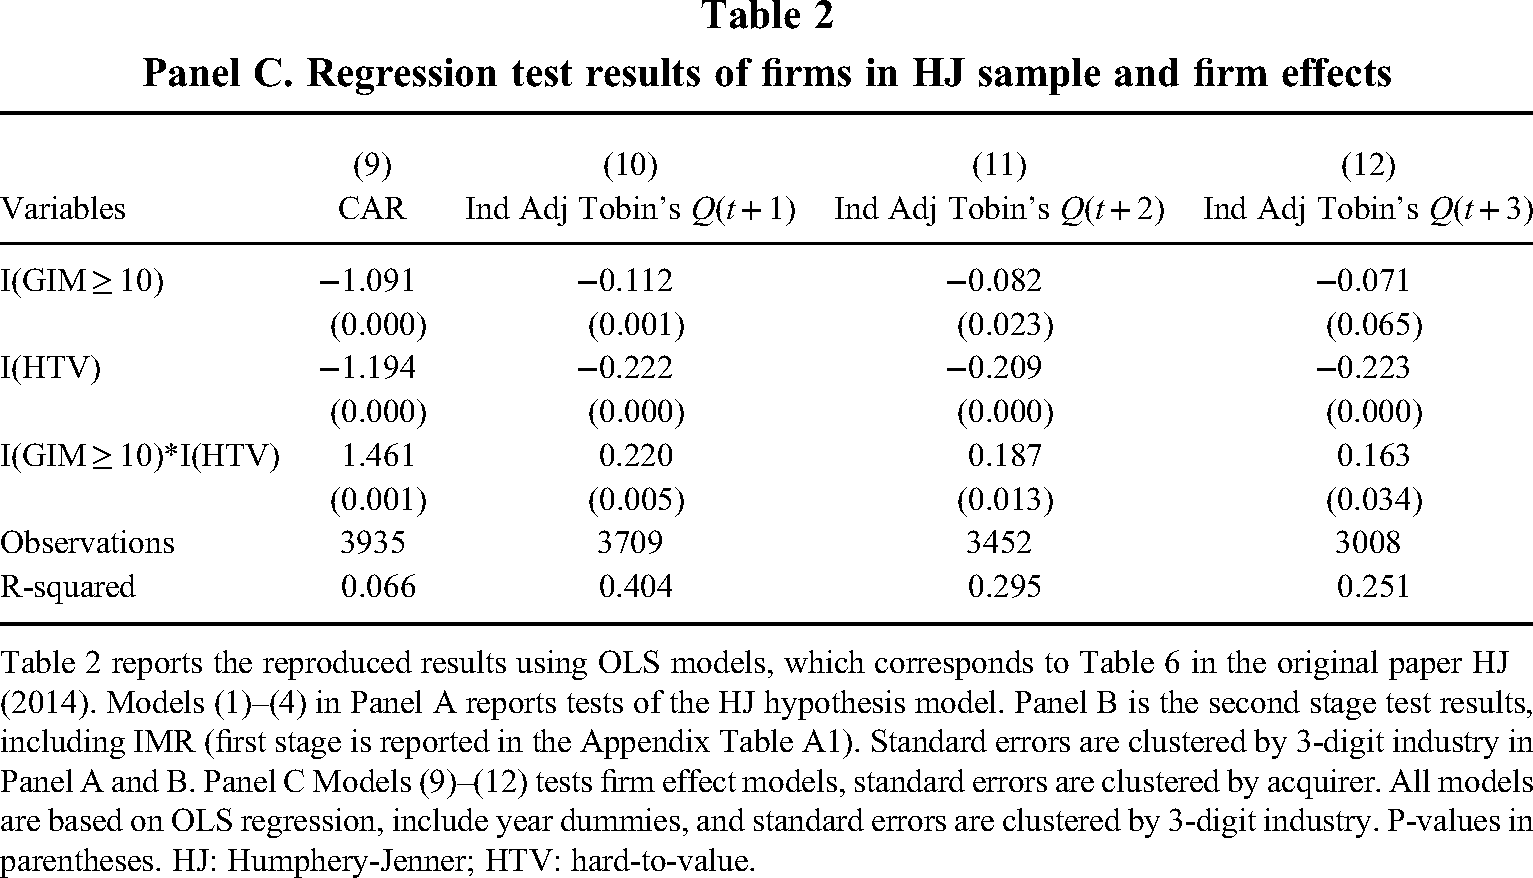
Table 2 reports the reproduced results using OLS models, which corresponds to Table 6 in the original paper HJ (2014). Models (1)–(4) in Panel A reports tests of the HJ hypothesis model. Panel B is the second stage test results, including IMR (first stage is reported in the Appendix Table A1). Standard errors are clustered by 3-digit industry in Panel A and B. Panel C Models (9)–(12) tests firm effect models, standard errors are clustered by acquirer. All models are based on OLS regression, include year dummies, and standard errors are clustered by 3-digit industry. P-values in parentheses. HJ: Humphery-Jenner; HTV: hard-to-value.
HJ reproduction. Panel A presents the hypothesis tests corresponding to HJ's Table 6. We find significant coefficients for his reported product variable (I(GIM ≥ 10) * I(HTV)), and CAR (Model 1: β = 1.461, p < 0.000), industry adjusted Tobin's Q (t + 1) (Model 2: β = 0.220, p < 0.003), industry adjusted Tobin's Q (t + 2) (Model 3: β = 0.187, p < .017), and industry adjusted Tobin's Q (t + 3), (Model 4: β = 0.163, p < 0.012) (the latter is not disclosed in HJ's Table 6). Panel B presents the results from the second stage Heckman analyses (see Table A1 in the appendix for the first stage model); firm effects (clustered by standard errors) are reported in Panels C, respectively. The findings across all three panels are consistent, confirm HJ's reported and non-reported findings, and support Hypotheses 1 and 2.
HJ reproduction using the BCF count measure. We next replace HJ's GIM index with the BCF continuous count measure and repeat the analysis of his sample of acquisitions. 5 Findings are presented in three panels in Table 3.
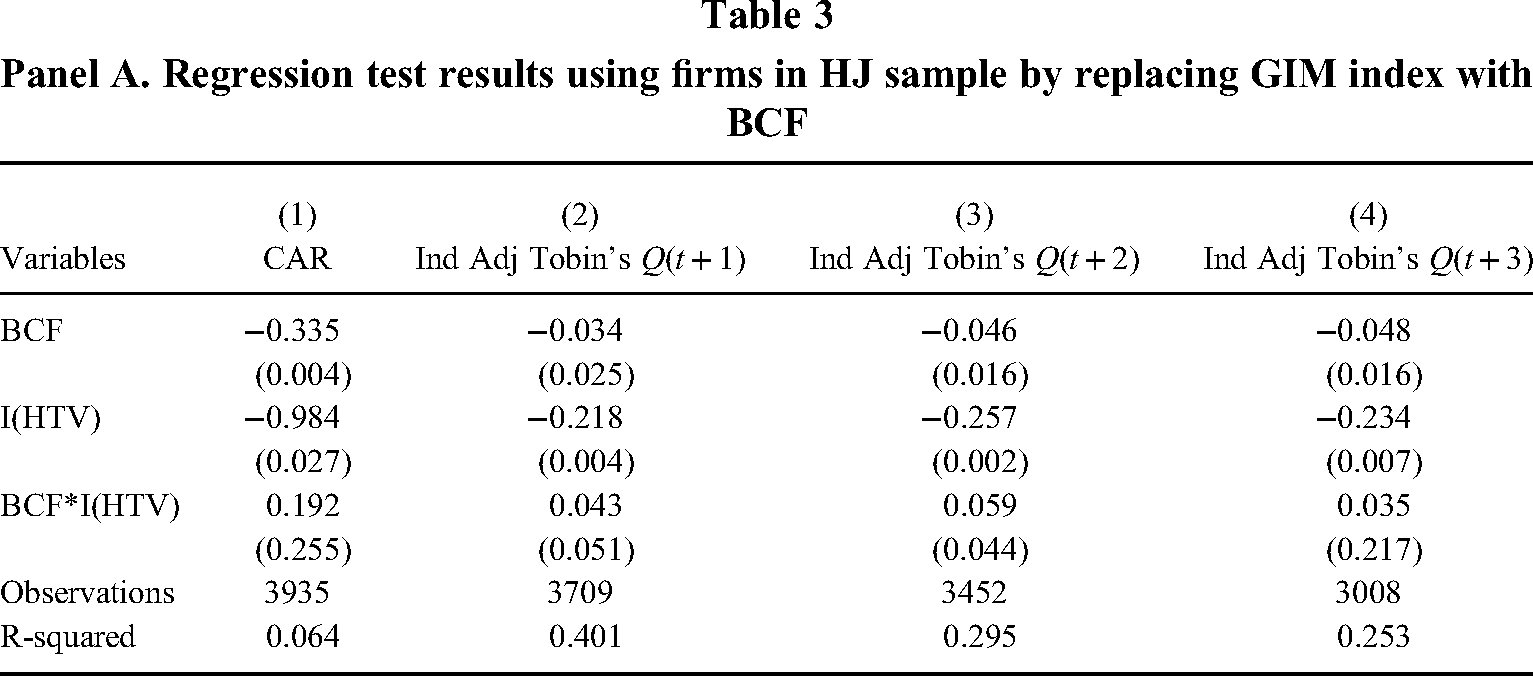
Panel A. Regression test results using firms in HJ sample by replacing GIM index with BCF
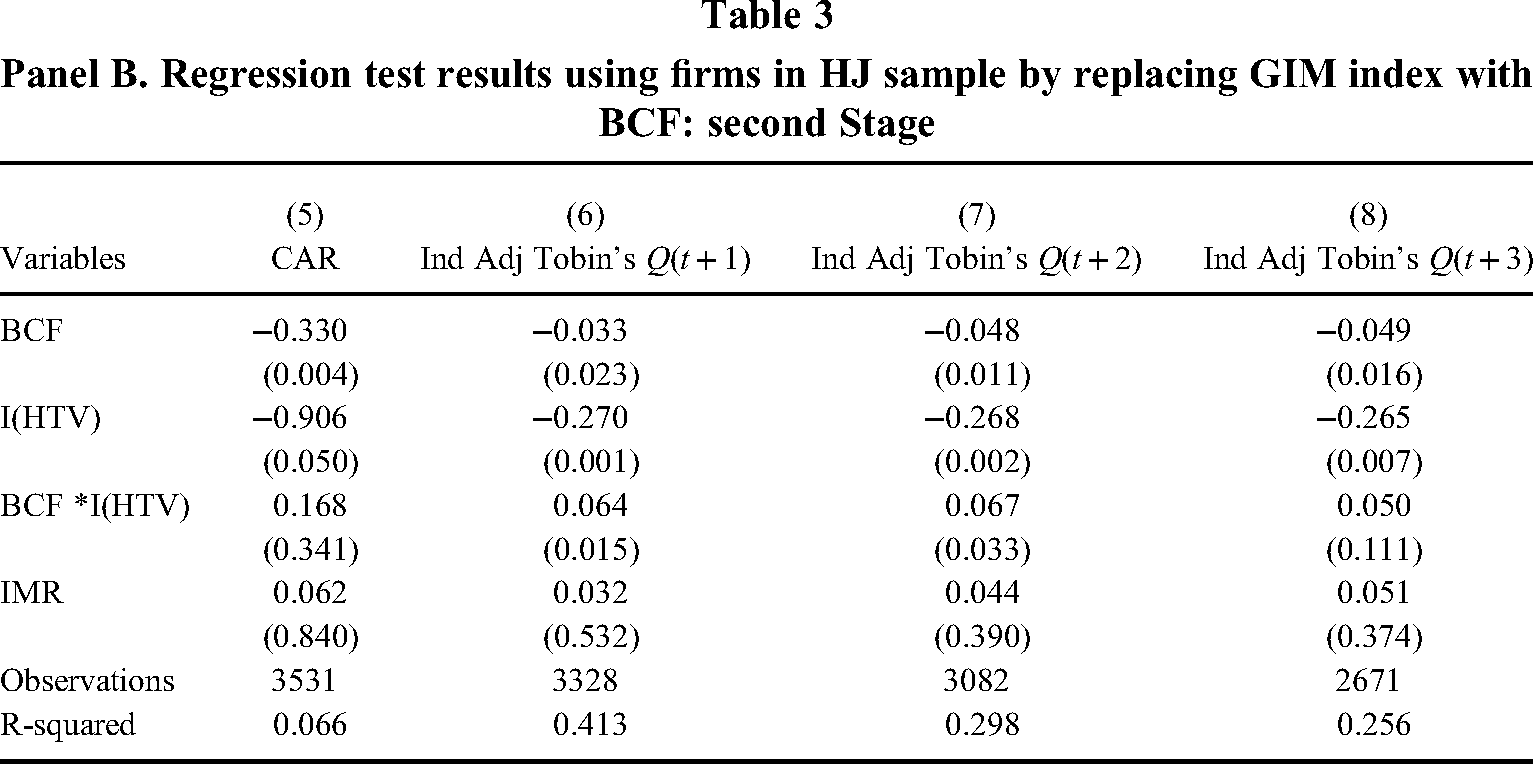
Panel B. Regression test results using firms in HJ sample by replacing GIM index with BCF: second Stage
Panel C. Regression test results of firms in HJ sample and firm effects (year effects as per HJ Table 6) by replacing GIM index with BCF
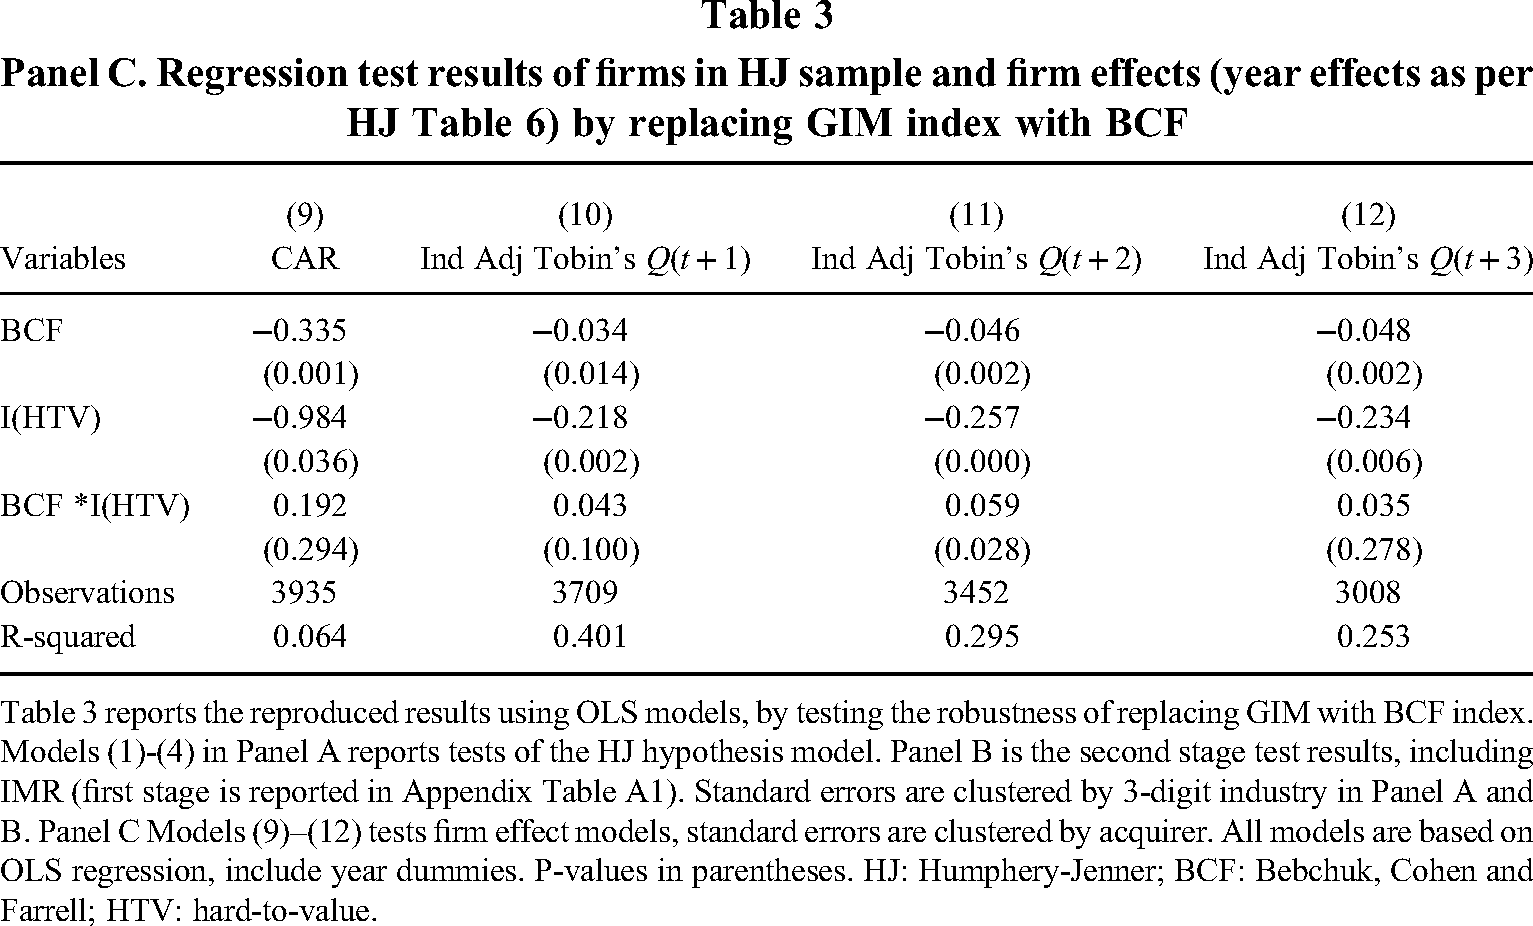
Table 3 reports the reproduced results using OLS models, by testing the robustness of replacing GIM with BCF index. Models (1)-(4) in Panel A reports tests of the HJ hypothesis model. Panel B is the second stage test results, including IMR (first stage is reported in Appendix Table A1). Standard errors are clustered by 3-digit industry in Panel A and B. Panel C Models (9)–(12) tests firm effect models, standard errors are clustered by acquirer. All models are based on OLS regression, include year dummies. P-values in parentheses. HJ: Humphery-Jenner; BCF: Bebchuk, Cohen and Farrell; HTV: hard-to-value.
Table 3 Panel A shows that the product of the BCF count measure and HTV industry is not related to CAR (Model 1: β = 0.192, p = 0.255), is marginally related to industry-adjusted Tobin's Q at year t + 1 (Model 2: β = 0.043, p = 0.051), is related significantly at year t + 2 (Model 3: β = 0.059, p = 0.044), but not at year t + 3 (Model 4: β = 0.035, p = 0.217). Similar findings are produced from Heckman second stage regressions in Panel B (see Table A1 in the Appendix for the first stage model) and when including firm effects (Panels C).
These results do not support H1 and provide partial support for H2. Replacing the GIM index with the BCF count measure produced non-significant and weaker overall relationships between the product of ATP and HTV and its relationship to different performance measures. HJ's results are sensitive to the ATP measure: there is no longer a relationship with CAR and the one with Tobin's Q is unstable.
Replication
We next attempt to replicate HJ's findings using the next 10-year period of acquisitions, the available ATP measures (BCF, (I(BCF)), and the disclosed and undisclosed analyses (Heckman 2SLS models, and including data adjustment for outliers, industry, year, and firm effects, are the same as above). The results appear in three panels in Table 4. 6
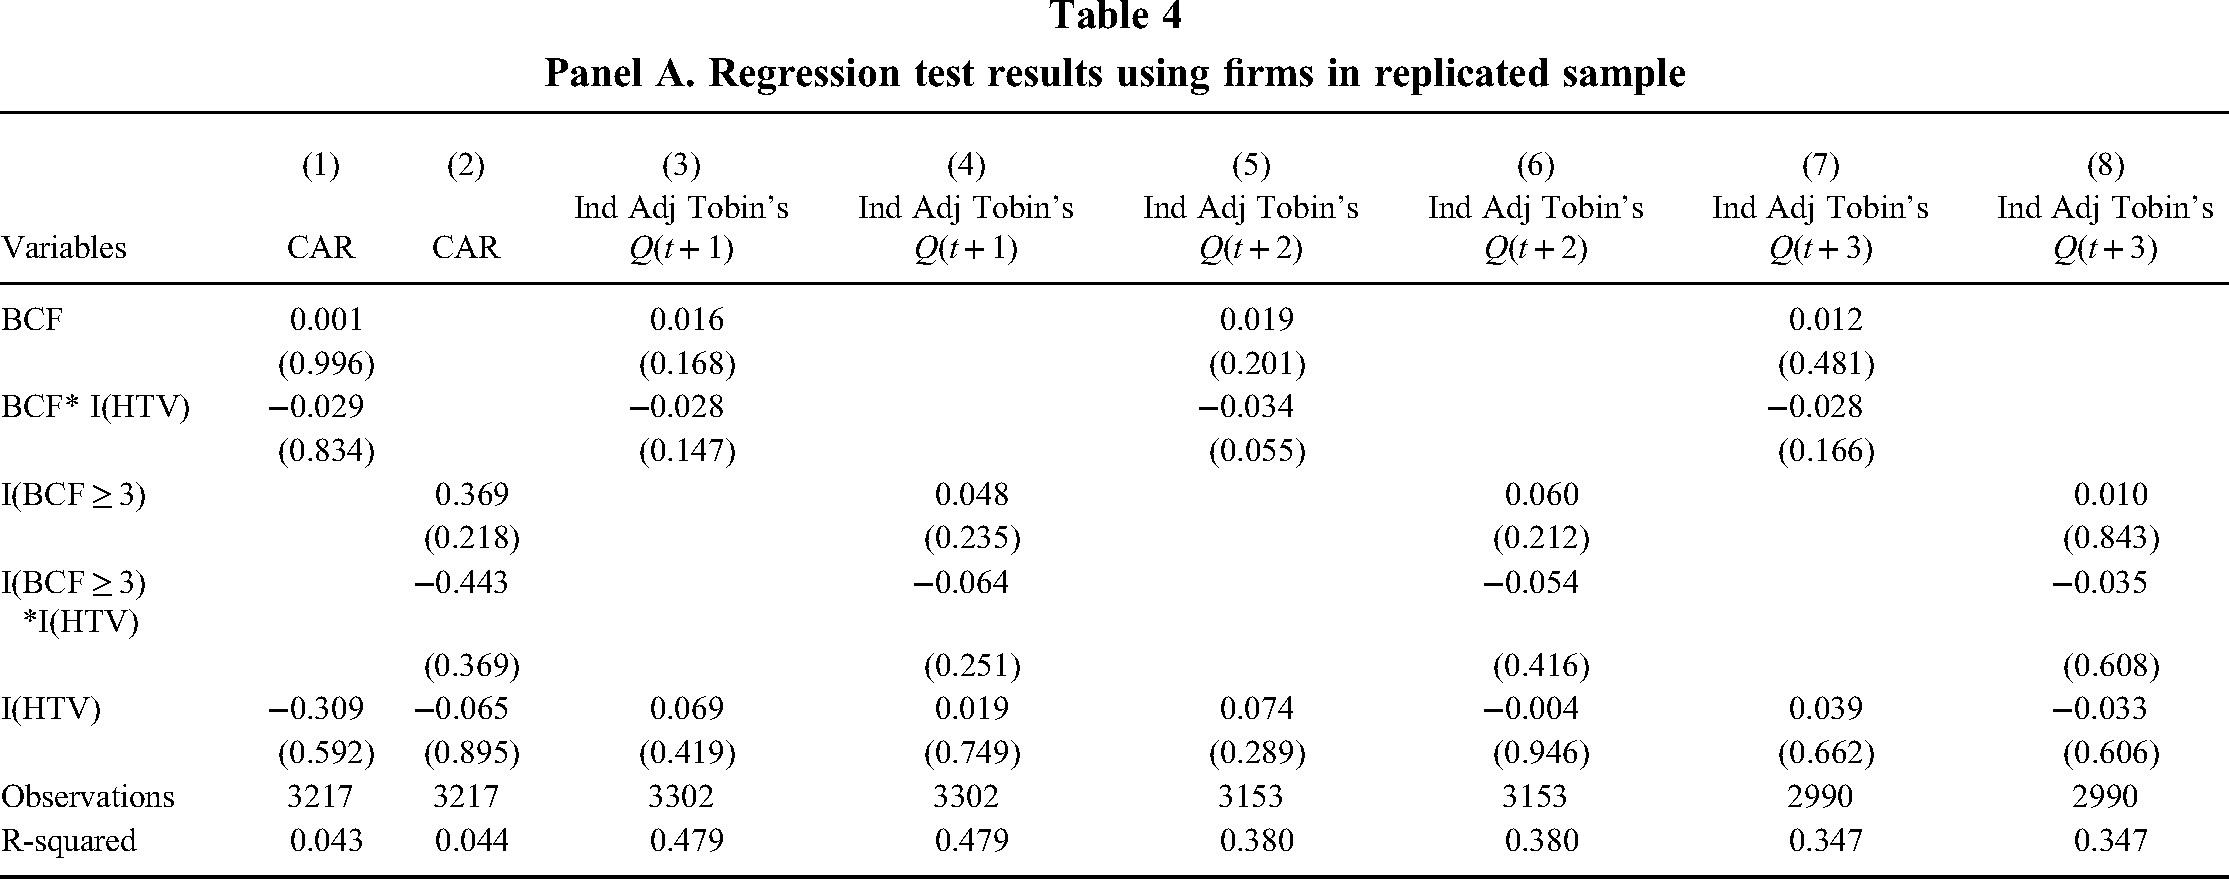
Panel A. Regression test results using firms in replicated sample
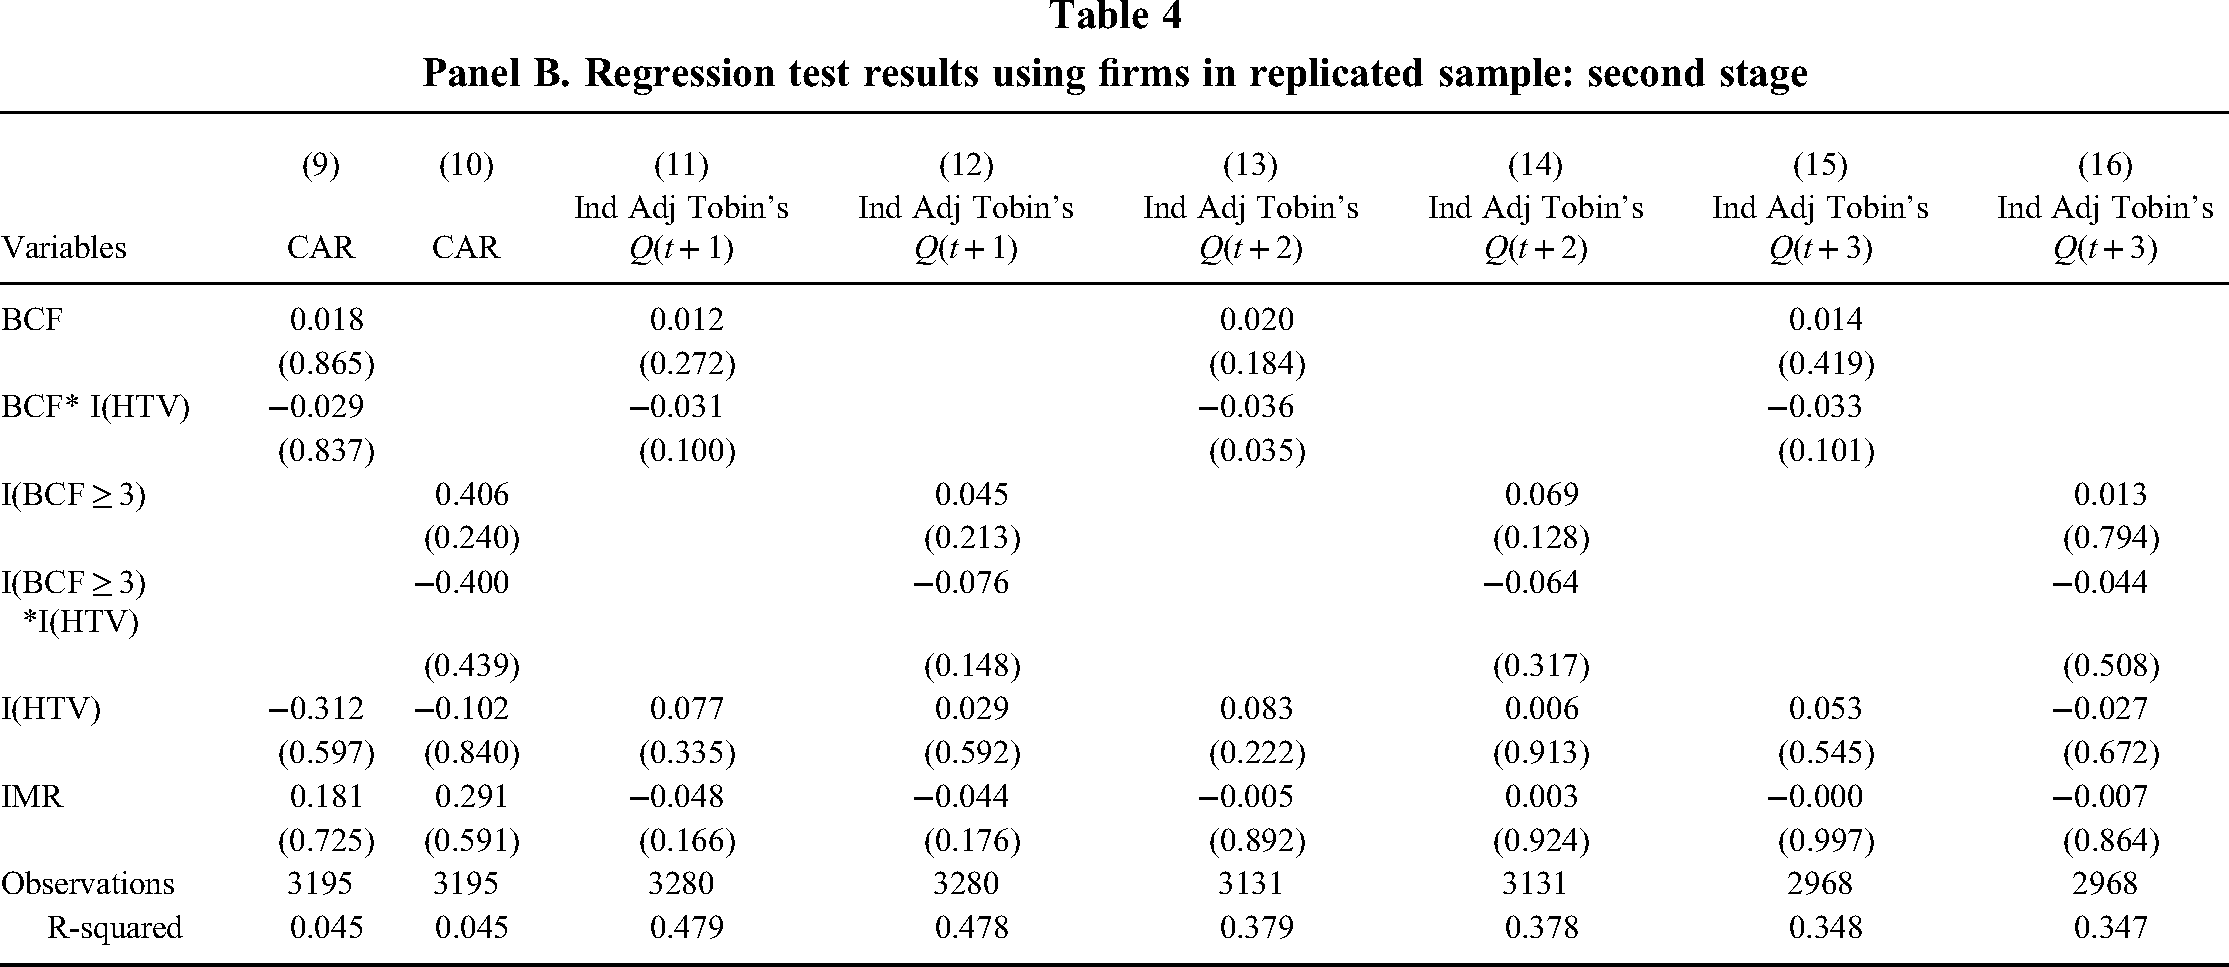
Panel B. Regression test results using firms in replicated sample: second stage
Panel C. Regression test results using firms in replicated sample and firm effects (include year effects as per HJ Table 6)
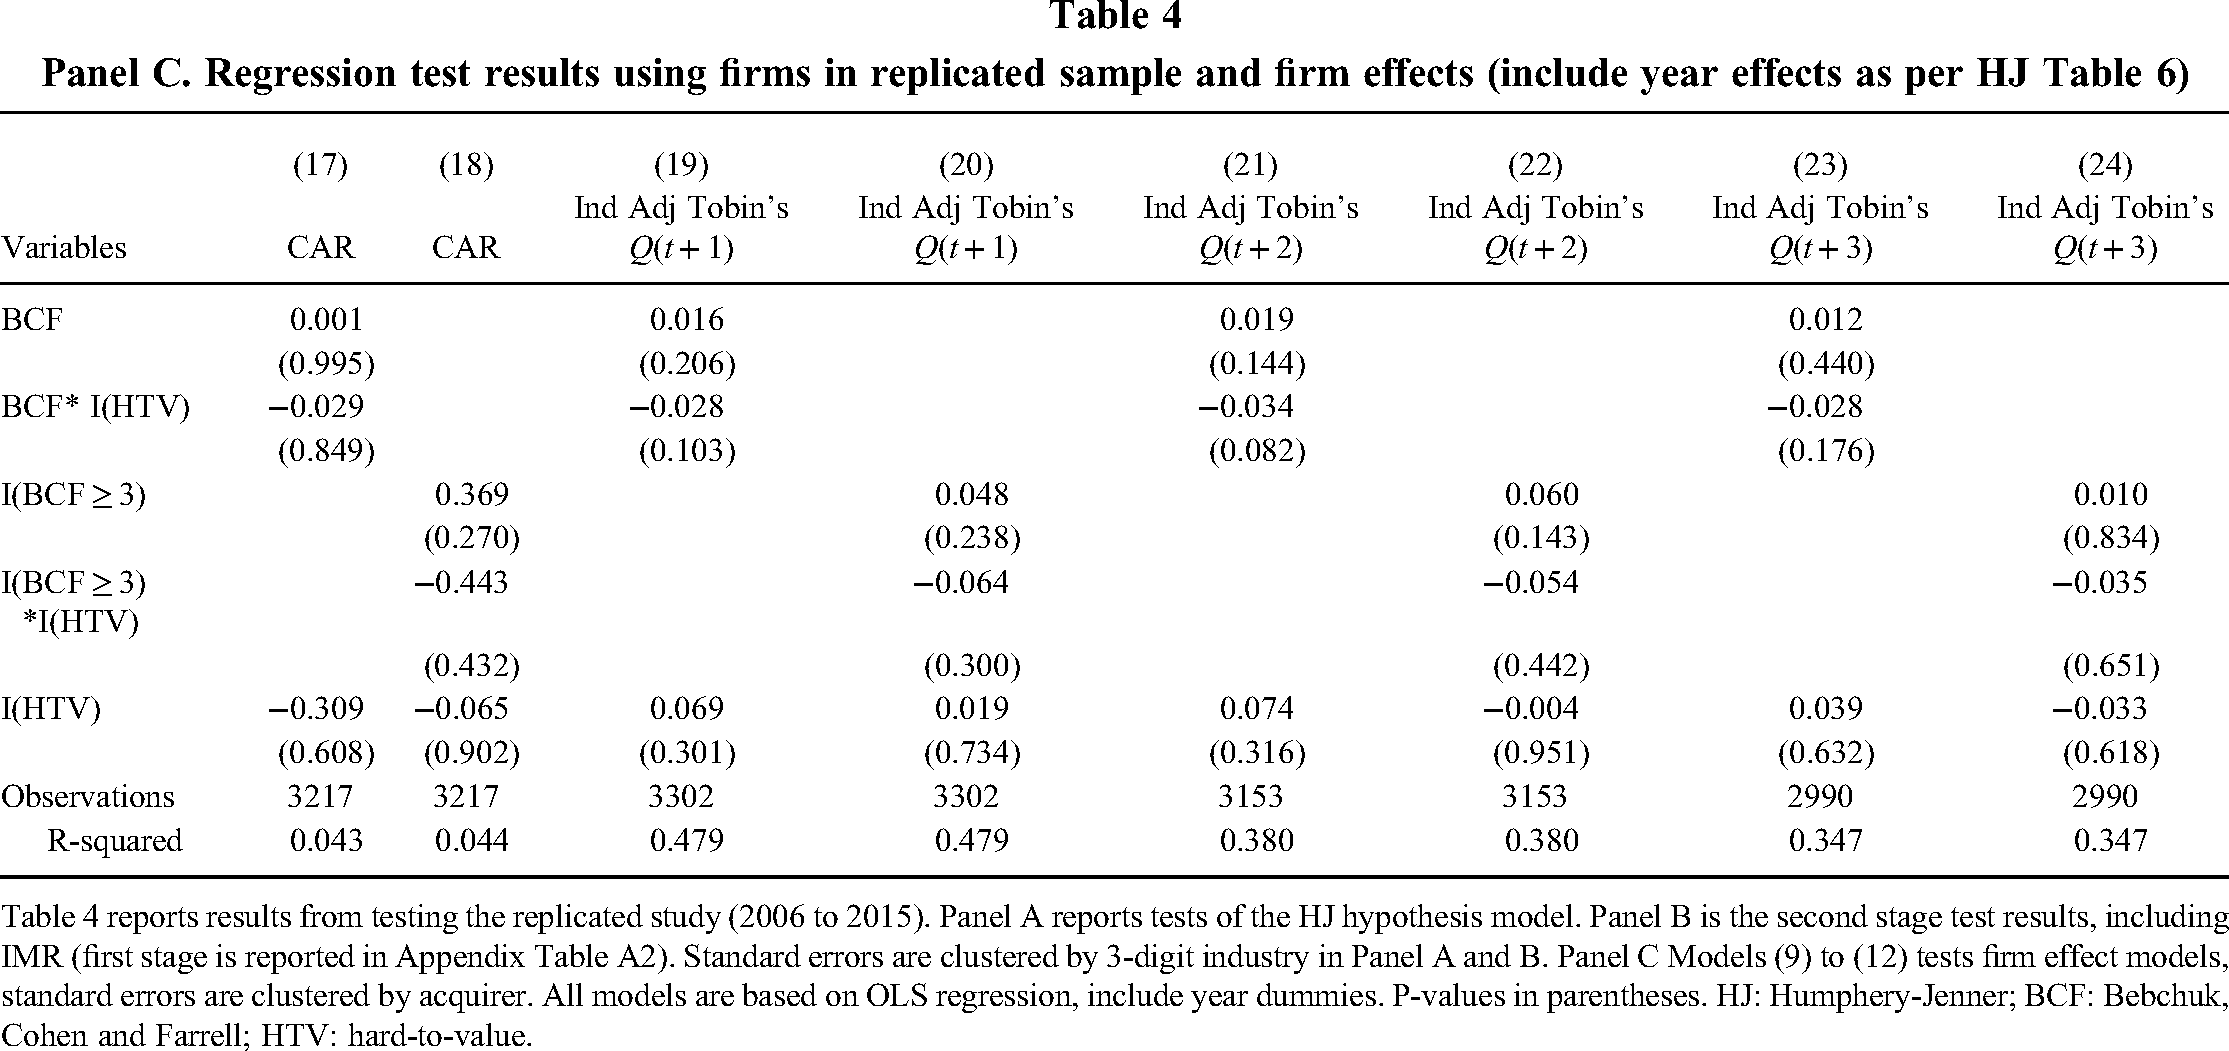
Table 4 reports results from testing the replicated study (2006 to 2015). Panel A reports tests of the HJ hypothesis model. Panel B is the second stage test results, including IMR (first stage is reported in Appendix Table A2). Standard errors are clustered by 3-digit industry in Panel A and B. Panel C Models (9) to (12) tests firm effect models, standard errors are clustered by acquirer. All models are based on OLS regression, include year dummies. P-values in parentheses. HJ: Humphery-Jenner; BCF: Bebchuk, Cohen and Farrell; HTV: hard-to-value.
Panel A shows that the product of the BCF count measure and HTV industry (BCF * I(HTV)) is not related to CAR (Model 1: β = −0.029, p = 0.834), to industry-adjusted Tobin's Q at year t + 1 (Model 3: β = −0.028, p = 0.147), is marginally related and with an opposite sign at year t + 2 (Model 5: β = −0.034, p = 0.055), but not at year t + 3 (Model 7: β = −0.028, p = 0.166). Tests of the product of the BCF index and HTV (I(BCF ≥ 3) * (I(HTV)) find that it is not related to CAR (Model 2: β = −0.443, p = 0.369), to industry-adjusted Tobin's Q at year t + 1 (Model 4: β = −0.064, p = 0.251), at year t + 2 (Model 6: β = −0.054, p = 0.416), and at year t + 3 (Model 8: β = −0.035, p = 0.608). Similar results are produced from the Heckman second stage regression results coefficients and analyses of firm effects (Panels B and C; first stage model reported in Table A2 in the Appendix).
Collectively, we are largely unable to replicate HJ's empirical relationships, finding support in one test, and marginally significant statistical evidence in two of 24 models. These findings mostly fail to support HJ's beneficial entrenchment acquisition-performance hypothesis in the replicated sample of acquisitions. The results also show that ATPs are not related to acquisition performance in the replicated sample, suggesting that entrenchment may not be applicable to acquisitions made during the 2006–2015 time period.
Combined samples
To gain insights into the relative strength of HJ's empirical findings, we combined his and the replicated samples together into one overall sample that consists of 7307 acquisitions occurring over the 26-year period 1990–2015 (before missing values). We attempt to replicate HJ's findings using the available ATP measures (BCF, (I(BCF)) and the disclosed and undisclosed analyses (same Heckman 2SLS models, and including data adjustment for outliers, industry, year, and firm effects as above). The results appear in three panels in Table 5.
Panel A. Regression test results using firms in combined sample

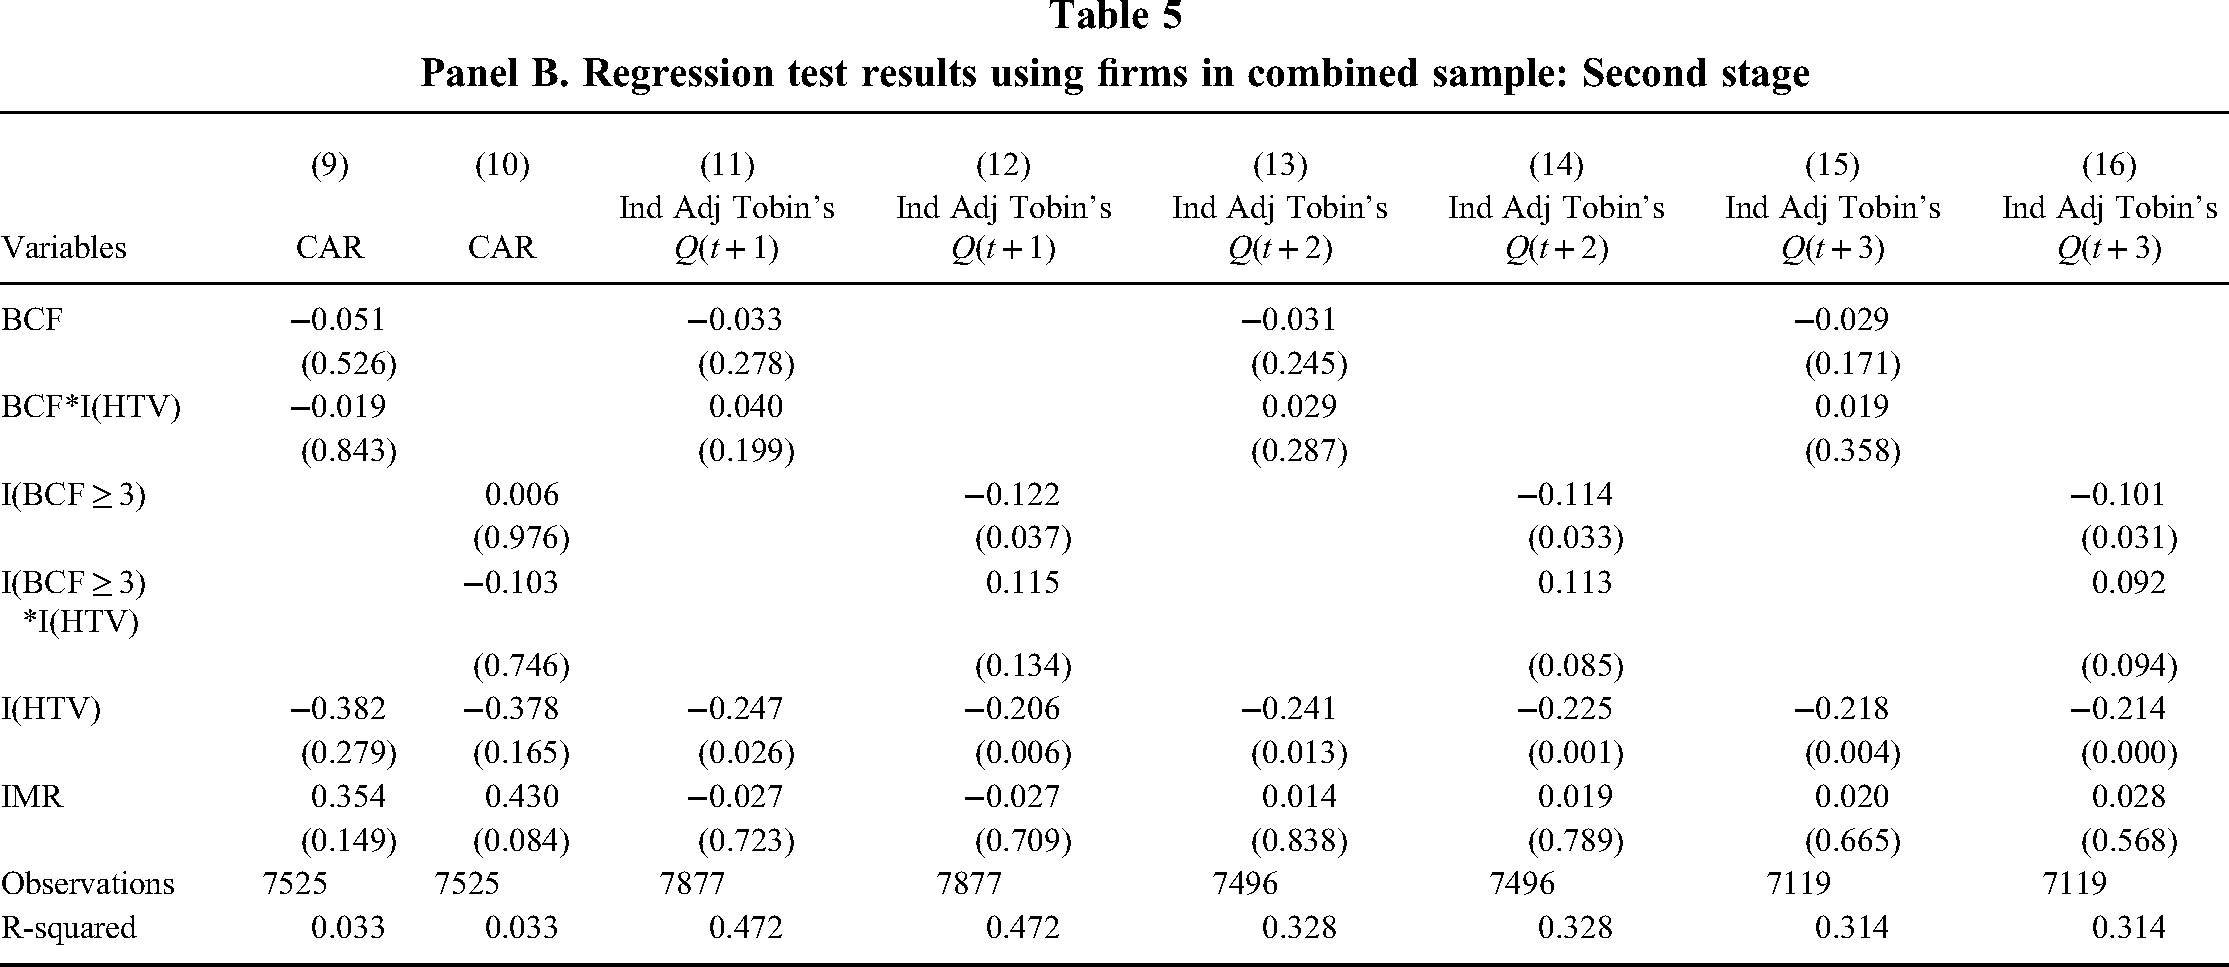
Panel B. Regression test results using firms in combined sample: Second stage
Panel C. Regression test results of firms in combined sample and firm effects (include year effects as per HJ Table 6)
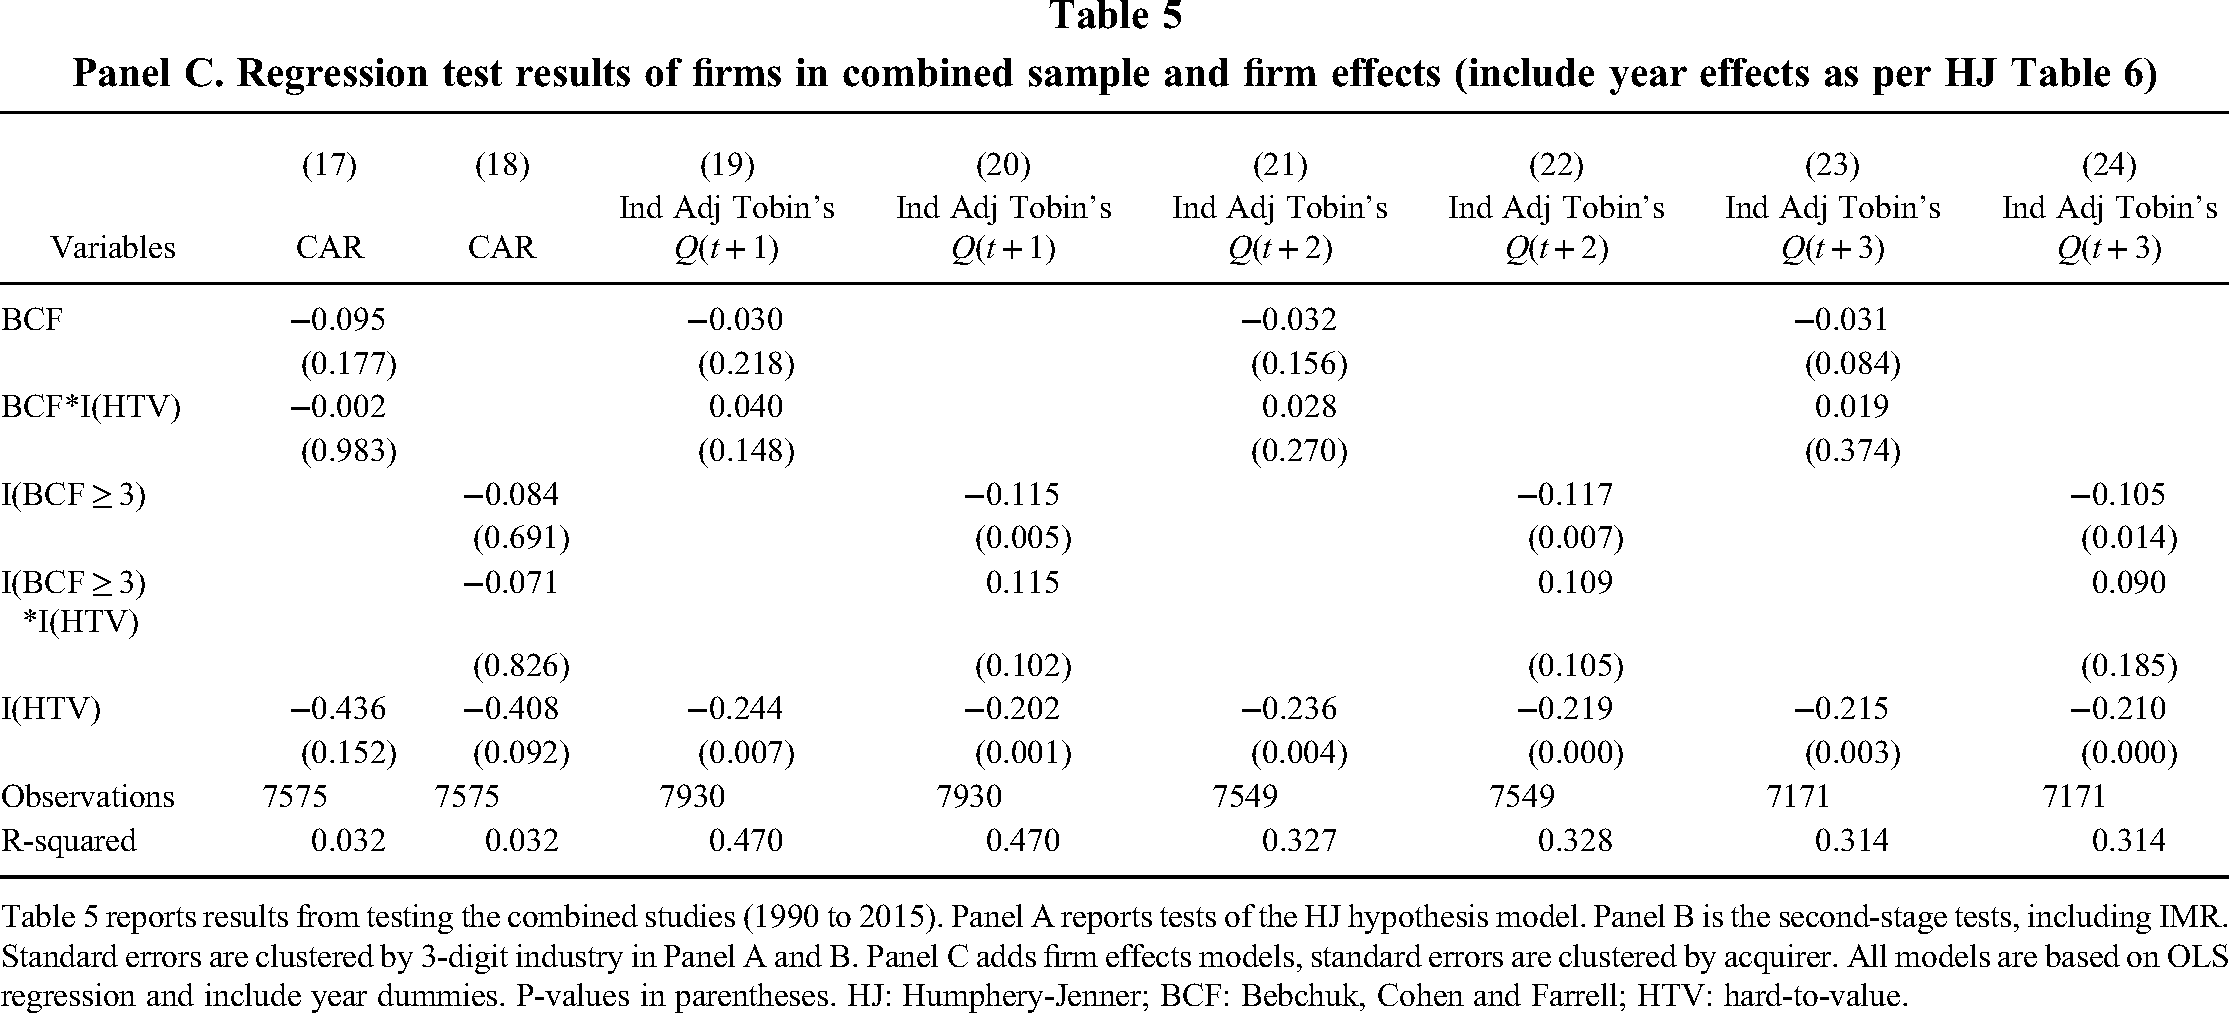
Table 5 reports results from testing the combined studies (1990 to 2015). Panel A reports tests of the HJ hypothesis model. Panel B is the second-stage tests, including IMR. Standard errors are clustered by 3-digit industry in Panel A and B. Panel C adds firm effects models, standard errors are clustered by acquirer. All models are based on OLS regression and include year dummies. P-values in parentheses. HJ: Humphery-Jenner; BCF: Bebchuk, Cohen and Farrell; HTV: hard-to-value.
Panel A shows that the product of the BCF count measure and HTV industry (BCF * I(HTV)) is not related to CAR (Model 1: β = −0.002, p = 0.983), to industry-adjusted Tobin's Q at year t + 1 (Model 3: β = 0.040, p = 0.188), year t + 2 (Model 5: β = 0.028, p = 0.293), and year t + 3 (Model 7: β = 0.019, p = 0.348). Tests of the product of the BCF index and HTV (I(BCF ≥ 3) * (I(HTV)) find that it is not related to CAR (Model 2: β = −0.071, p = 0.821), to industry-adjusted Tobin's Q at year t + 1 (Model 4: β = 0.115, p = 0.127), year t + 2 (Model 6: β = 0.109, p = 0.094), and at year t + 3 (Model 8: β = 0.090, p = 0.099). The results in Panel B (second stage regression results coefficients) and Panel C (firm effects).
Collectively, results from testing acquisitions occuring during the 26-year period do not support HJ's beneficial entrenchment acquisition-performance hypothesis, indicating that his empirical relationships observed in 1990 through 2005 disappear when aggregated with acquisitions occurring from 2006 through 2015.
Sources of non-replicability
We next sought to identify why we could not replicate HJ's findings. His study design is cross-sectional and time-series, consisting of 3935 acquisition-observations made by 1425 firms. This structure includes both between- and within-firm data points. If the between- and within-firm relationships differ in magnitude and/or direction, then testing them as an aggregate in standard OLS models, as HJ did, could lead to biased coefficient estimates (Allison, 2005). The second stage of our replication applies alternative analytical approaches to identify whether the presence of untested differentiating features in HJ's sample might be the reason for his nonreplicable results. We first test his sample using firm fixed effects models to determine if within-firm changes might be driving his findings. Next, we apply hybrid mixed variance approaches to compare between- and within-firm effects using all three samples.
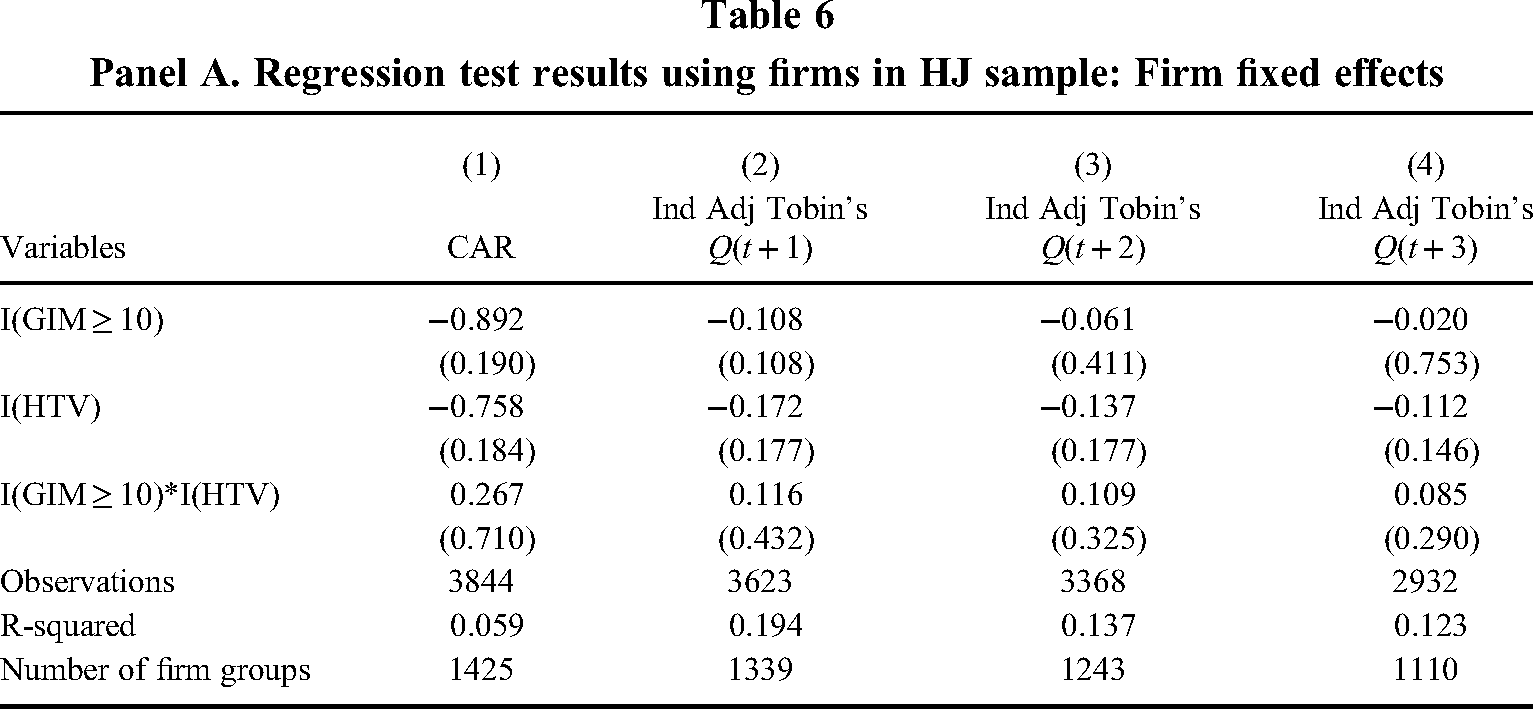
Firm fixed effects. HJ does not report whether he tested if “a set of relationships based on within-firm variance (e.g., fixed effects models) differ from a set of relationships based on a combination of both within- and between-firm variance (e.g., random effect models)” (Certo et al., 2017: 1537). Whether these two sets of relationships differ for the dependent and GIM index variables can be assessed using Hausman tests. 7 Further, Hausman tests provide an assessment of an additional source of endogeneity. Certo and colleagues note that “[i]n the presence of a statistically significant Hausman test, researchers rely on the fixed-effects instead of random-effects models” (2017: 1542). We applied this convention and present our results in two panels in Table 6.
Panel A. Regression test results using firms in HJ sample: Firm fixed effects
Panel B. Regression test results using firms in HJ sample: Second stage and firm fixed effects
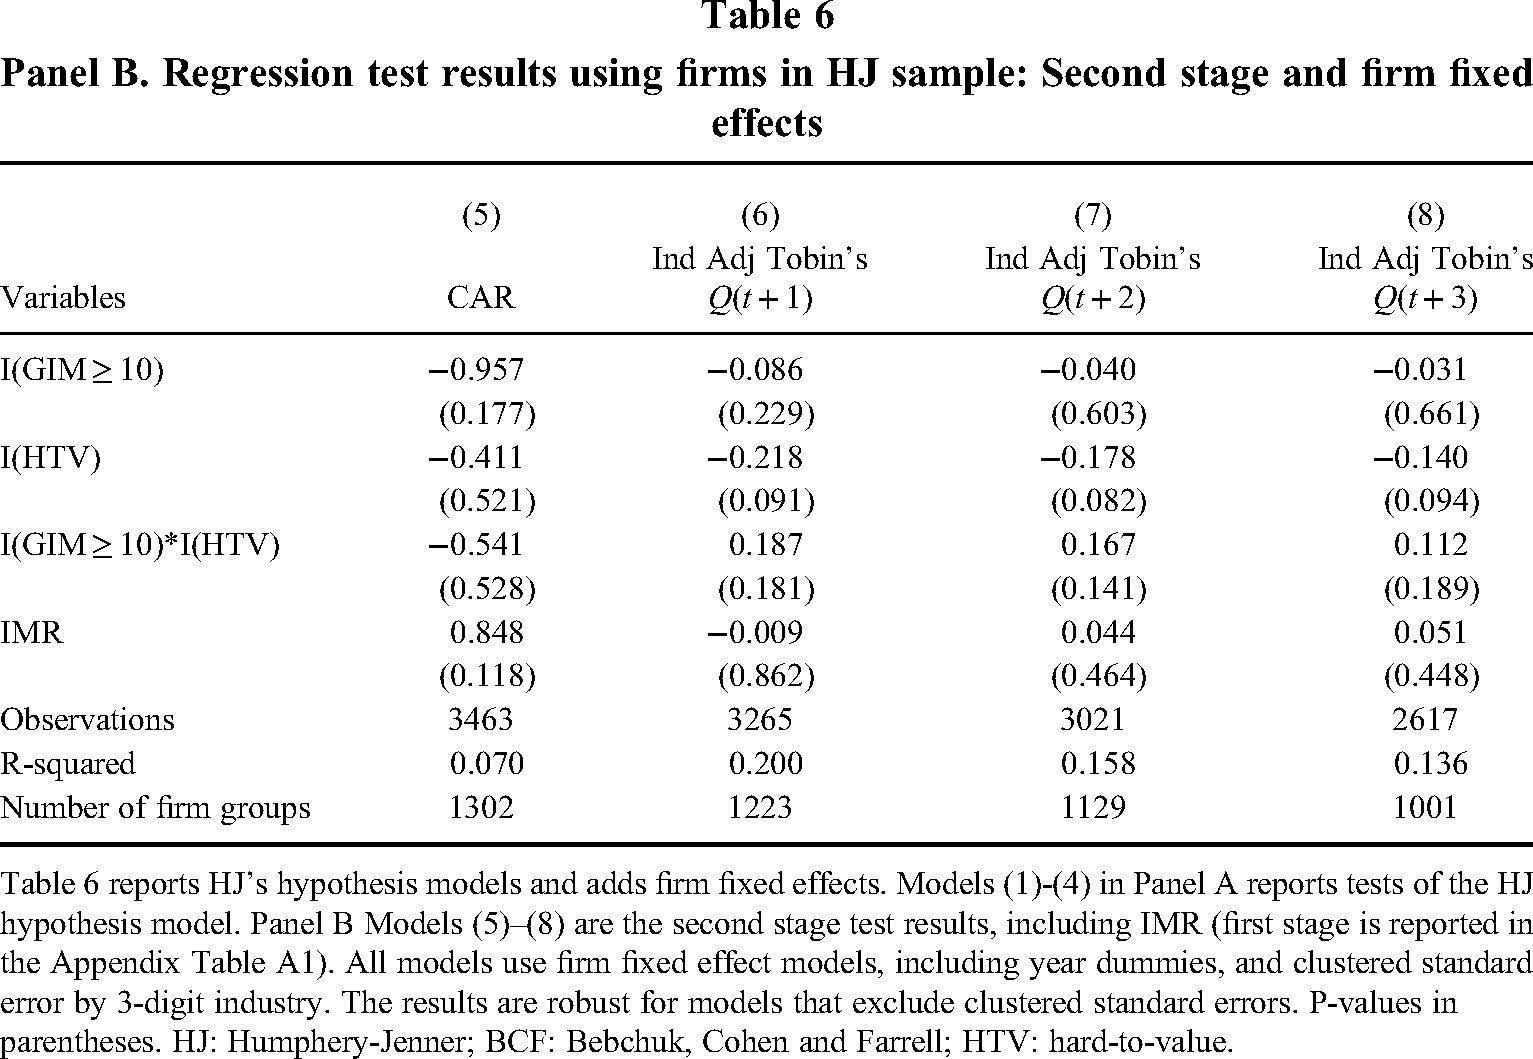
Table 6 reports HJ's hypothesis models and adds firm fixed effects. Models (1)-(4) in Panel A reports tests of the HJ hypothesis model. Panel B Models (5)–(8) are the second stage test results, including IMR (first stage is reported in the Appendix Table A1). All models use firm fixed effect models, including year dummies, and clustered standard error by 3-digit industry. The results are robust for models that exclude clustered standard errors. P-values in parentheses. HJ: Humphery-Jenner; BCF: Bebchuk, Cohen and Farrell; HTV: hard-to-value.
Table 6 Panel A shows that the product of the GIM measure and HTV industry is not related to CAR (Model 1: β = 0.267, p = 0.710), industry-adjusted Tobin's Q at year t + 1 (Model 2: β = 0.116, p = 0.432), year t + 2 (Model 3: β = 0.109, p = 0.325), and year t + 3 (Model 4: β = 0.085, p = 0.290). Panel B lists the second stage regression results coefficients (the first stage is reported in Appendix Table A1). The results are similar.
Overall, the hypothesized relationships are not supported in firm fixed effects models. 8 Thus, the significant findings reported by HJ would likely be associated with between-firm effects, which are not addressed in tests of firm fixed effects. We next apply an analytical technique which tests for the possible between-firm relationships.
Mixed variance models. A recently developed methodological approach, the “hybrid” mixed variance model, tests between- and within-firm variance as separate variables in a random effects equation (Allison, 2005). Following recent precedent (Certo et al., 2017: 1547), the between-effects variable for each independent and control variable is computed using their respective group means (titled “Mean” in the models). These variables remain constant over time. The within-firm effects variables are the group-mean centered scores for each variable, calculated by subtracting each variable's value from its group mean. Called “Deviation” in the models, these variables vary within each firm over time.
This analysis first requires an assessment of the ratio of between-firm to within-firm variance through Intraclass correlation coefficients (ICCs) to ascertain that sufficient between- and within-firm variance exists for a credible mixed variance evaluation. Higher values (ICC ≥ 0.50) indicate that the between-firm variance exceeds within-firm variation while lower values (ICC ≤ 0.50) mean the opposite. Relative equal influence occurs when between- and within-firm variance is approximately equal (ICC ≈ 0.50). Negative values are possible when within-firm variance is larger than between-firm variance. ICC tests of HJ's sample are reported in Table 7. 9 The most dramatic findings pertain to BCF values: 0.89 (BCF) and 0.84 (BCF Index) for HJ, and 0.56 and 0.42, respectively, for the replication sample. The ICC values for HTV are nearly identical across the two samples. Overall, the difference in the BCF ICC values indicates that higher relative between-firm variation exists in HJ's sample while a more equal amount of within-firm to between-firm variation exists in the replication sample. We next test whether these different proportions of between- to within-firm variances across the samples account for HJ's significant findings and why we find no relations in the replication sample. Four panels in Table 8 present the findings.
Intraclass correlation coefficients for key variables
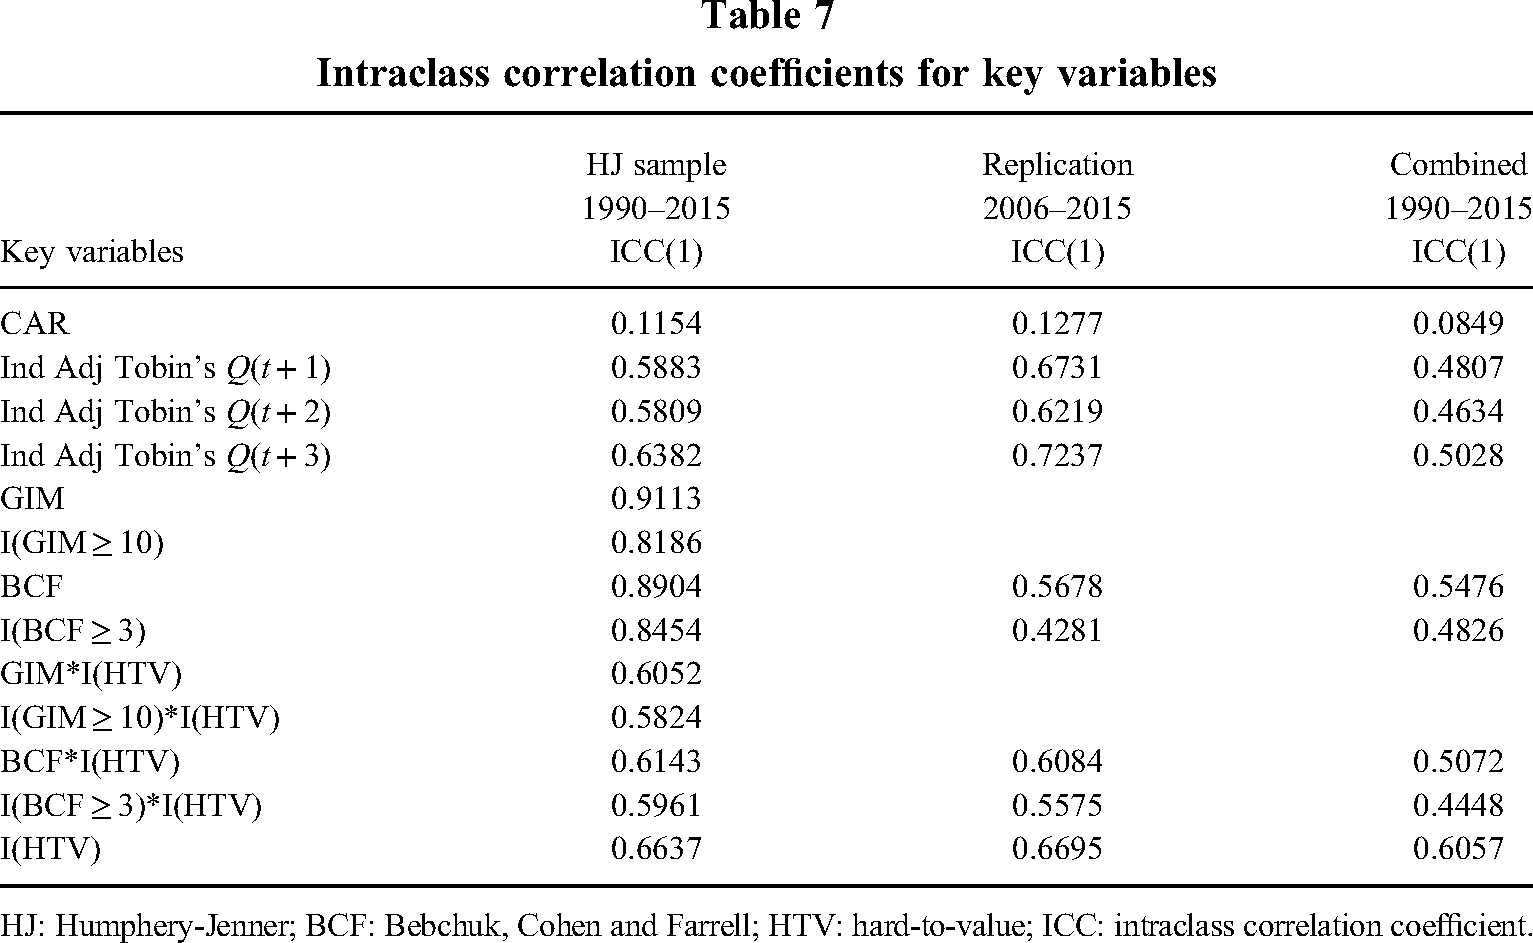
HJ: Humphery-Jenner; BCF: Bebchuk, Cohen and Farrell; HTV: hard-to-value; ICC: intraclass correlation coefficient.
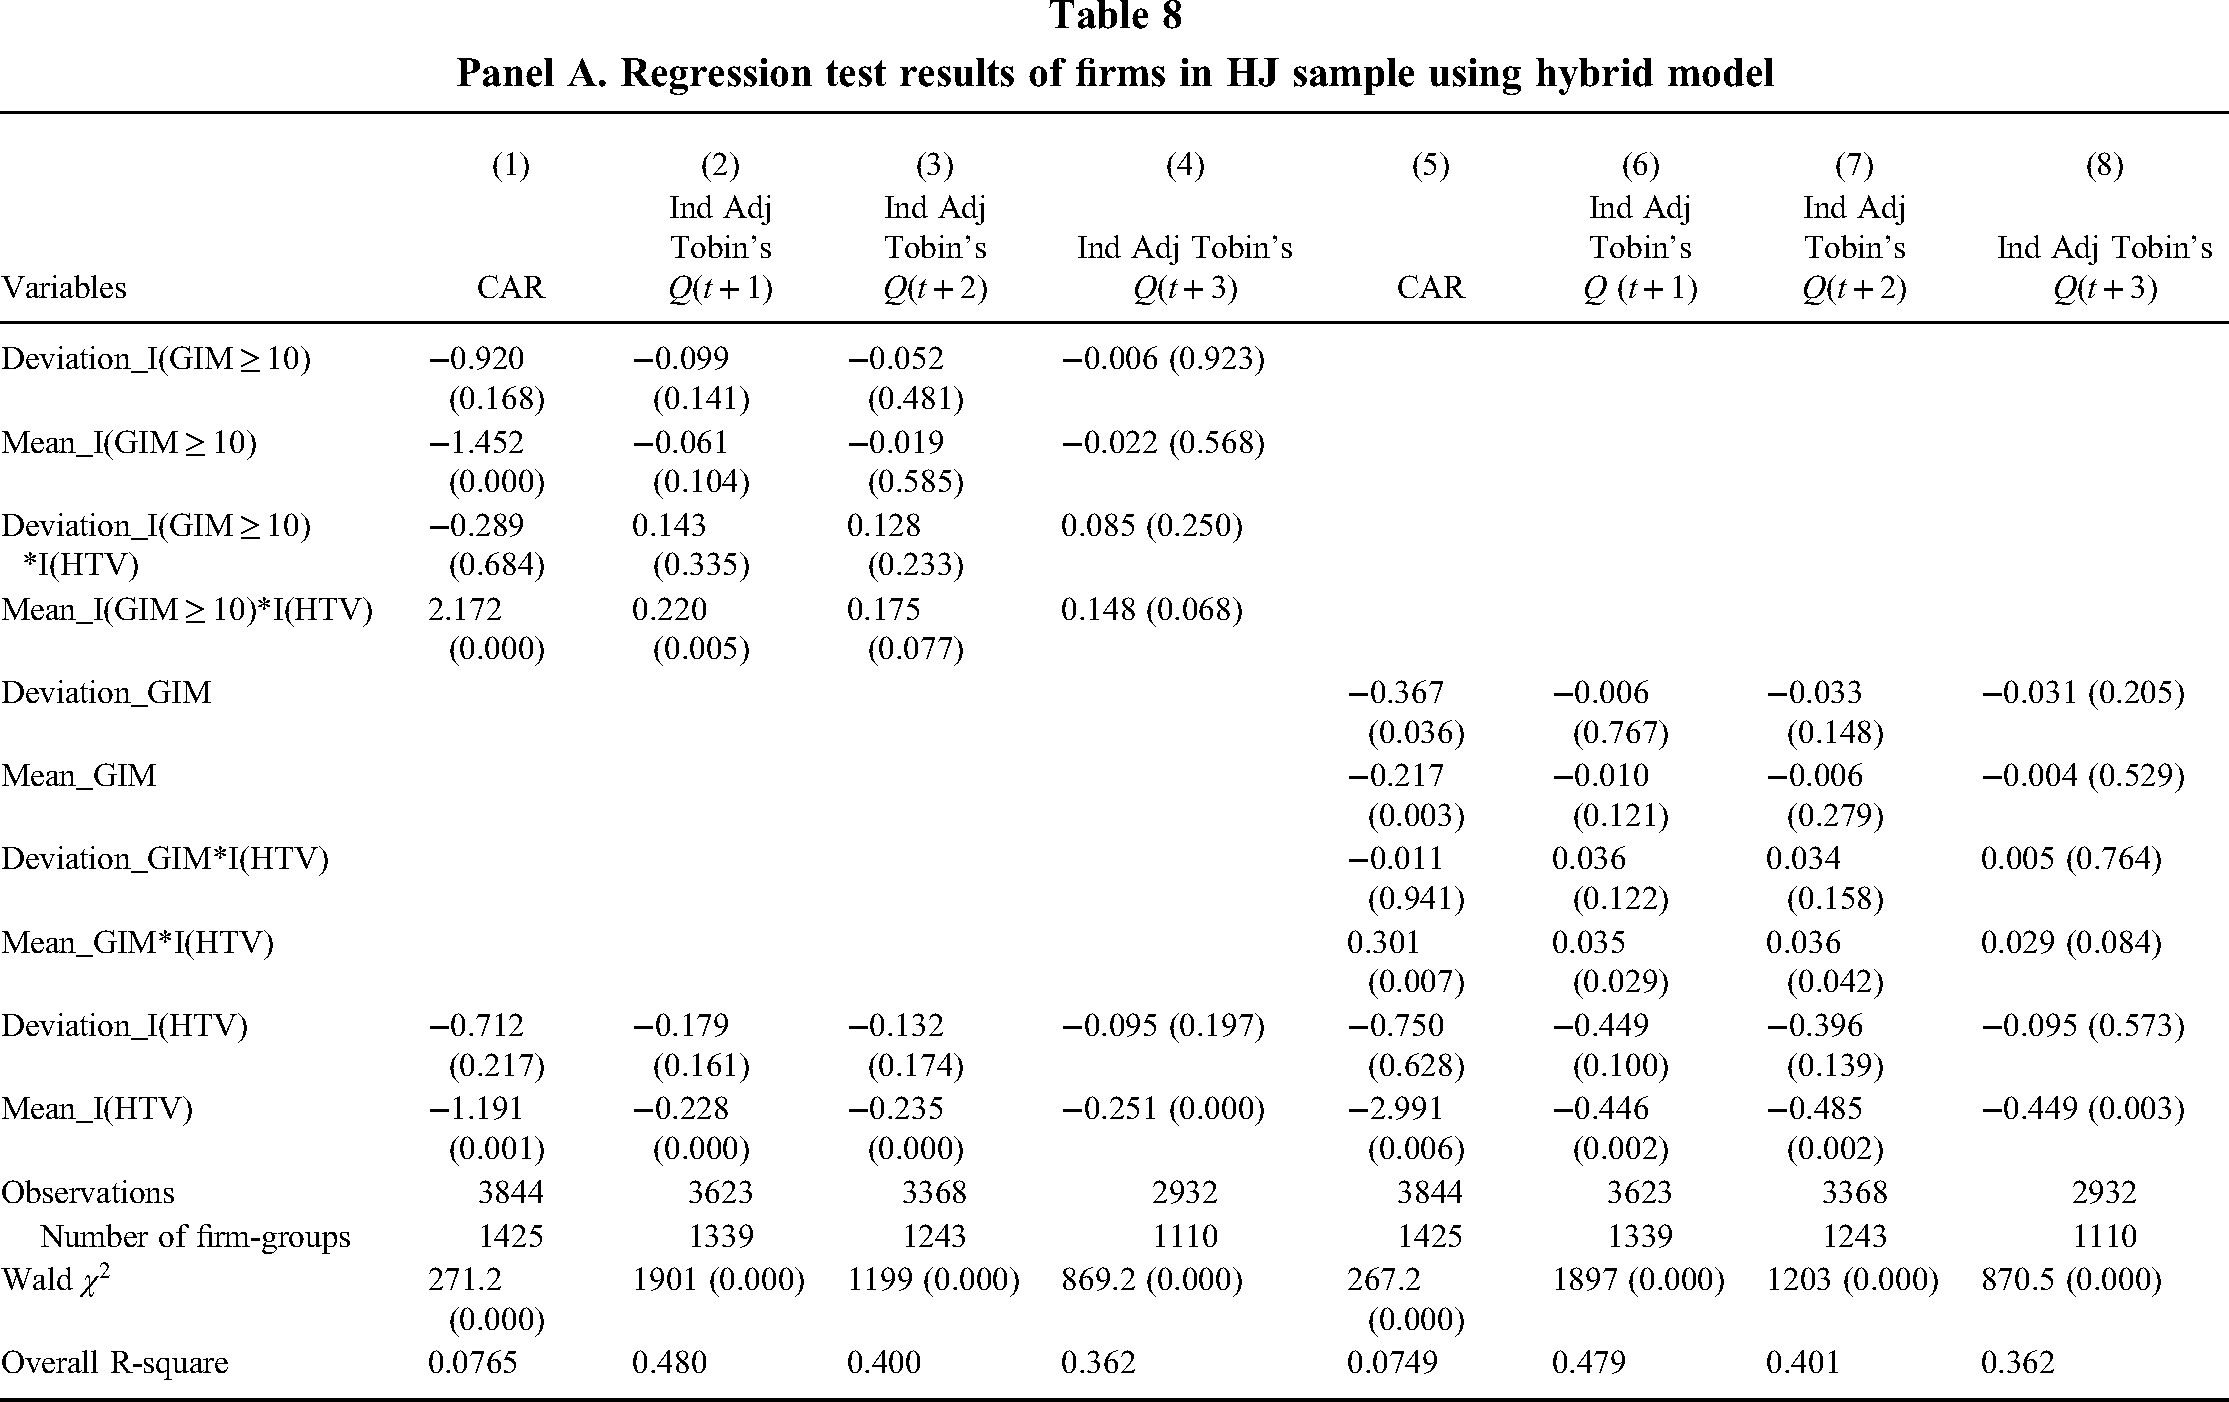
Panel A. Regression test results of firms in HJ sample using hybrid model
Panel B. Regression test results of firms in HJ sample using hybrid model by replacing GIM index with BCF index
Panel C. Regression test results of firms in replicated sample using hybrid model
Panel D. Regression test results of firms in combined sample using hybrid model
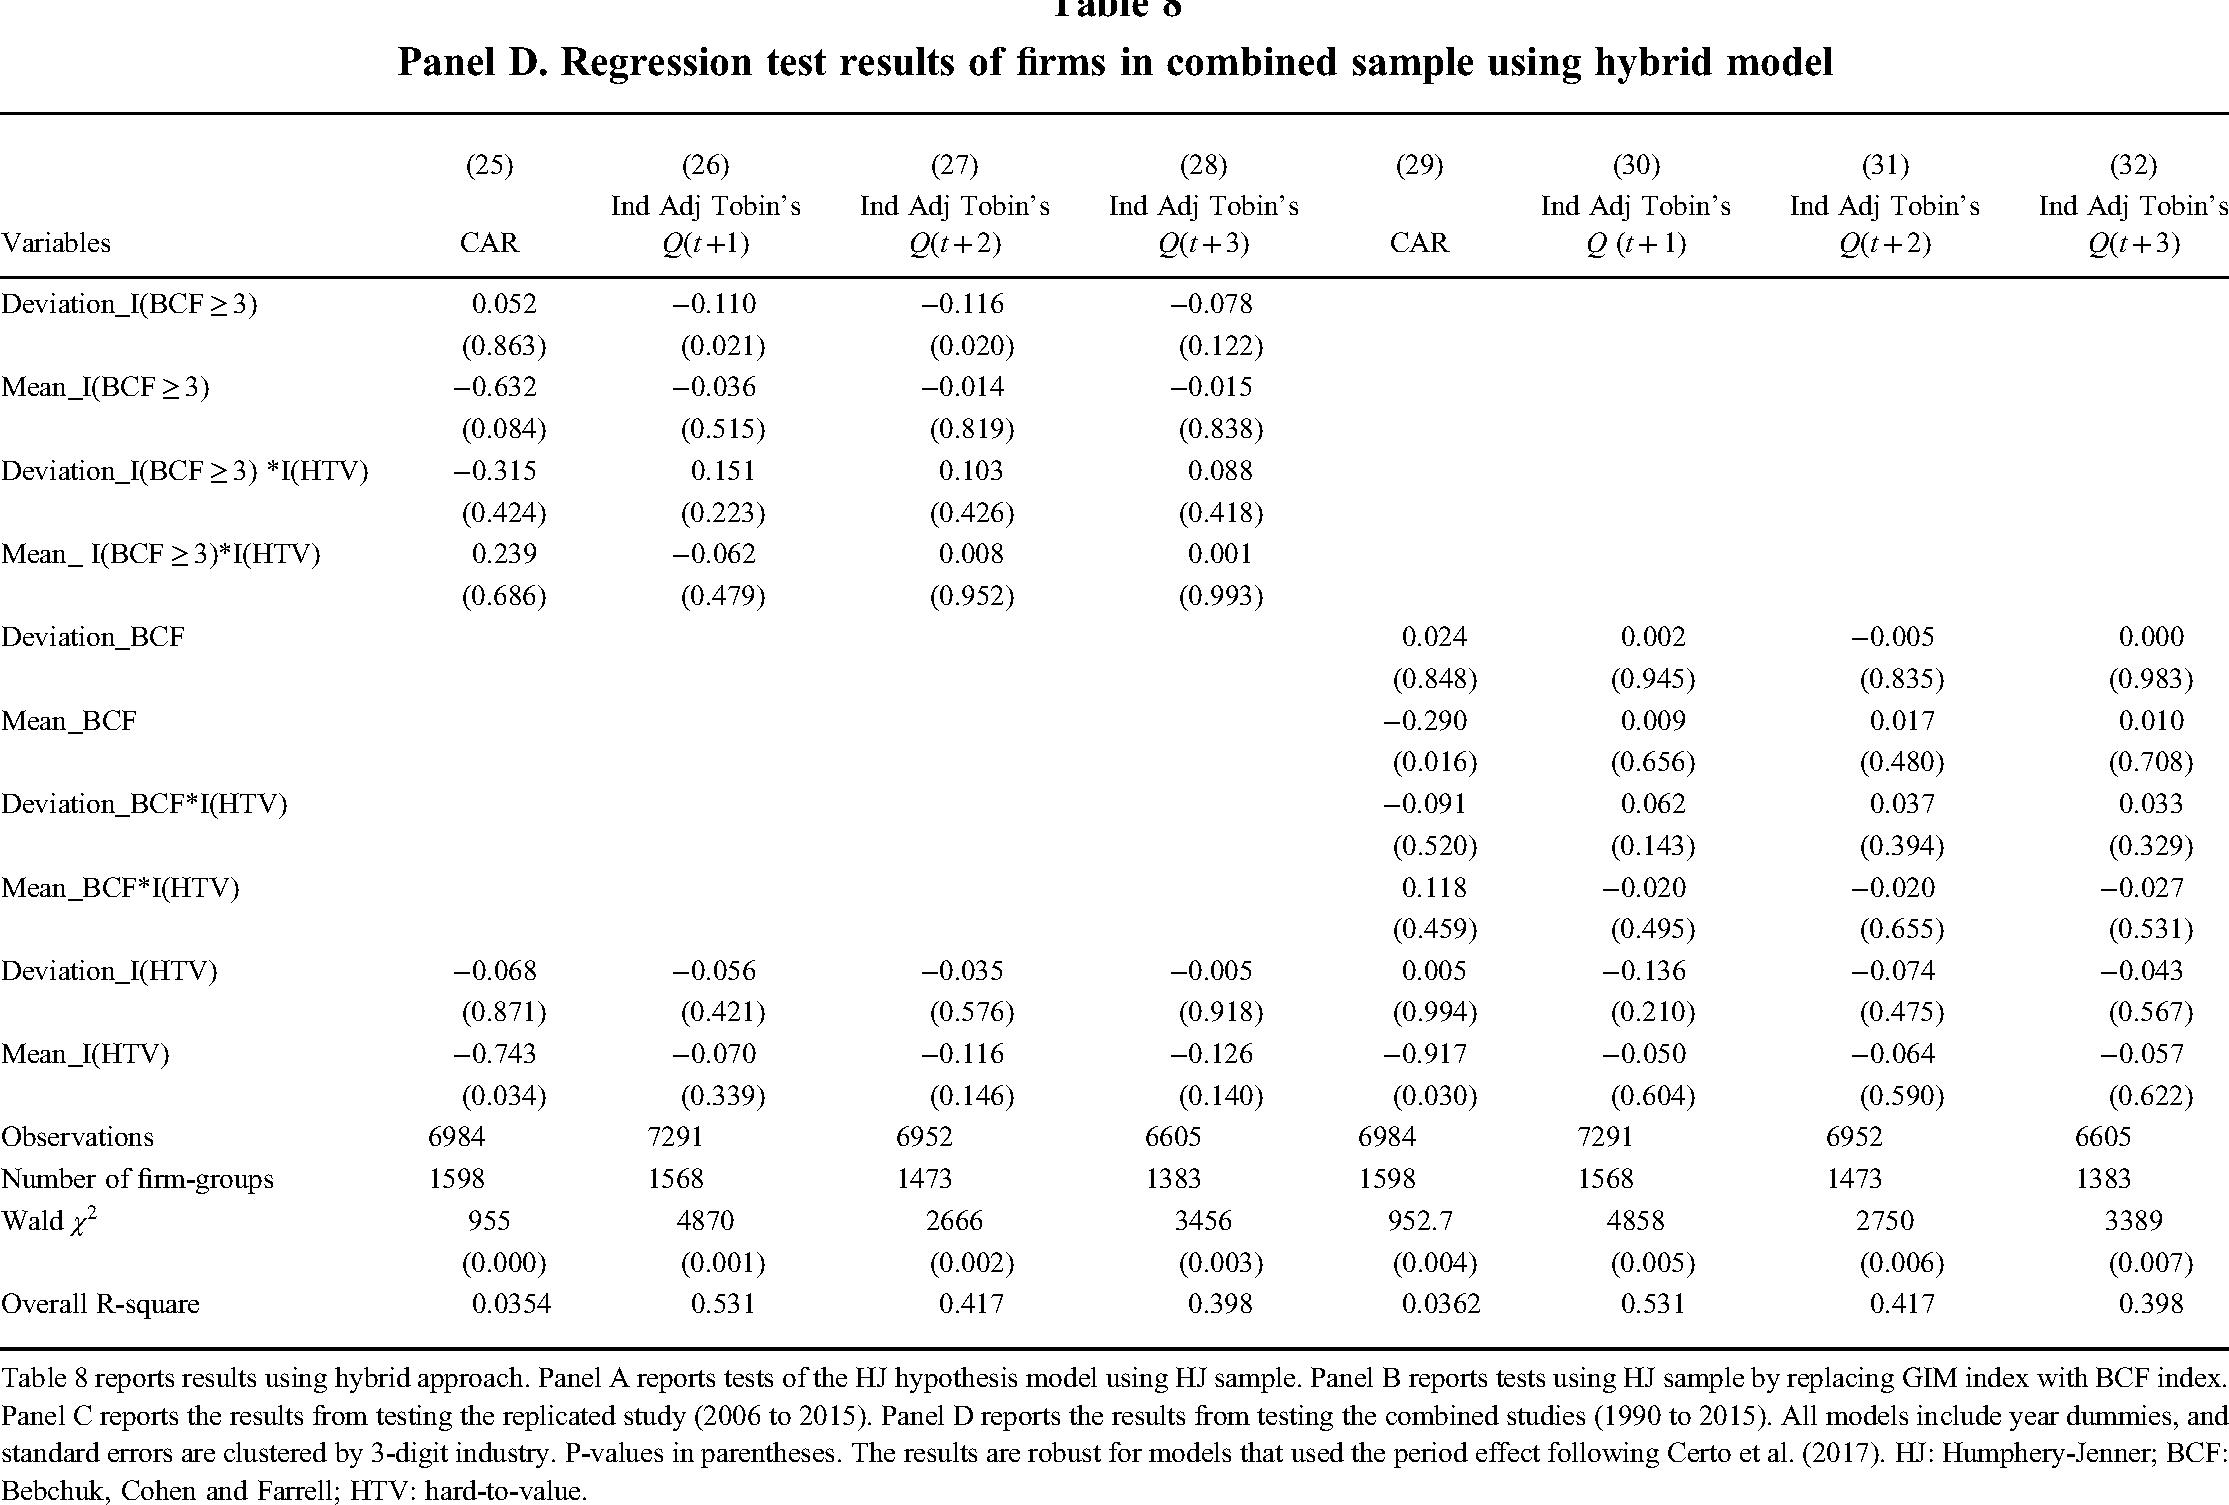
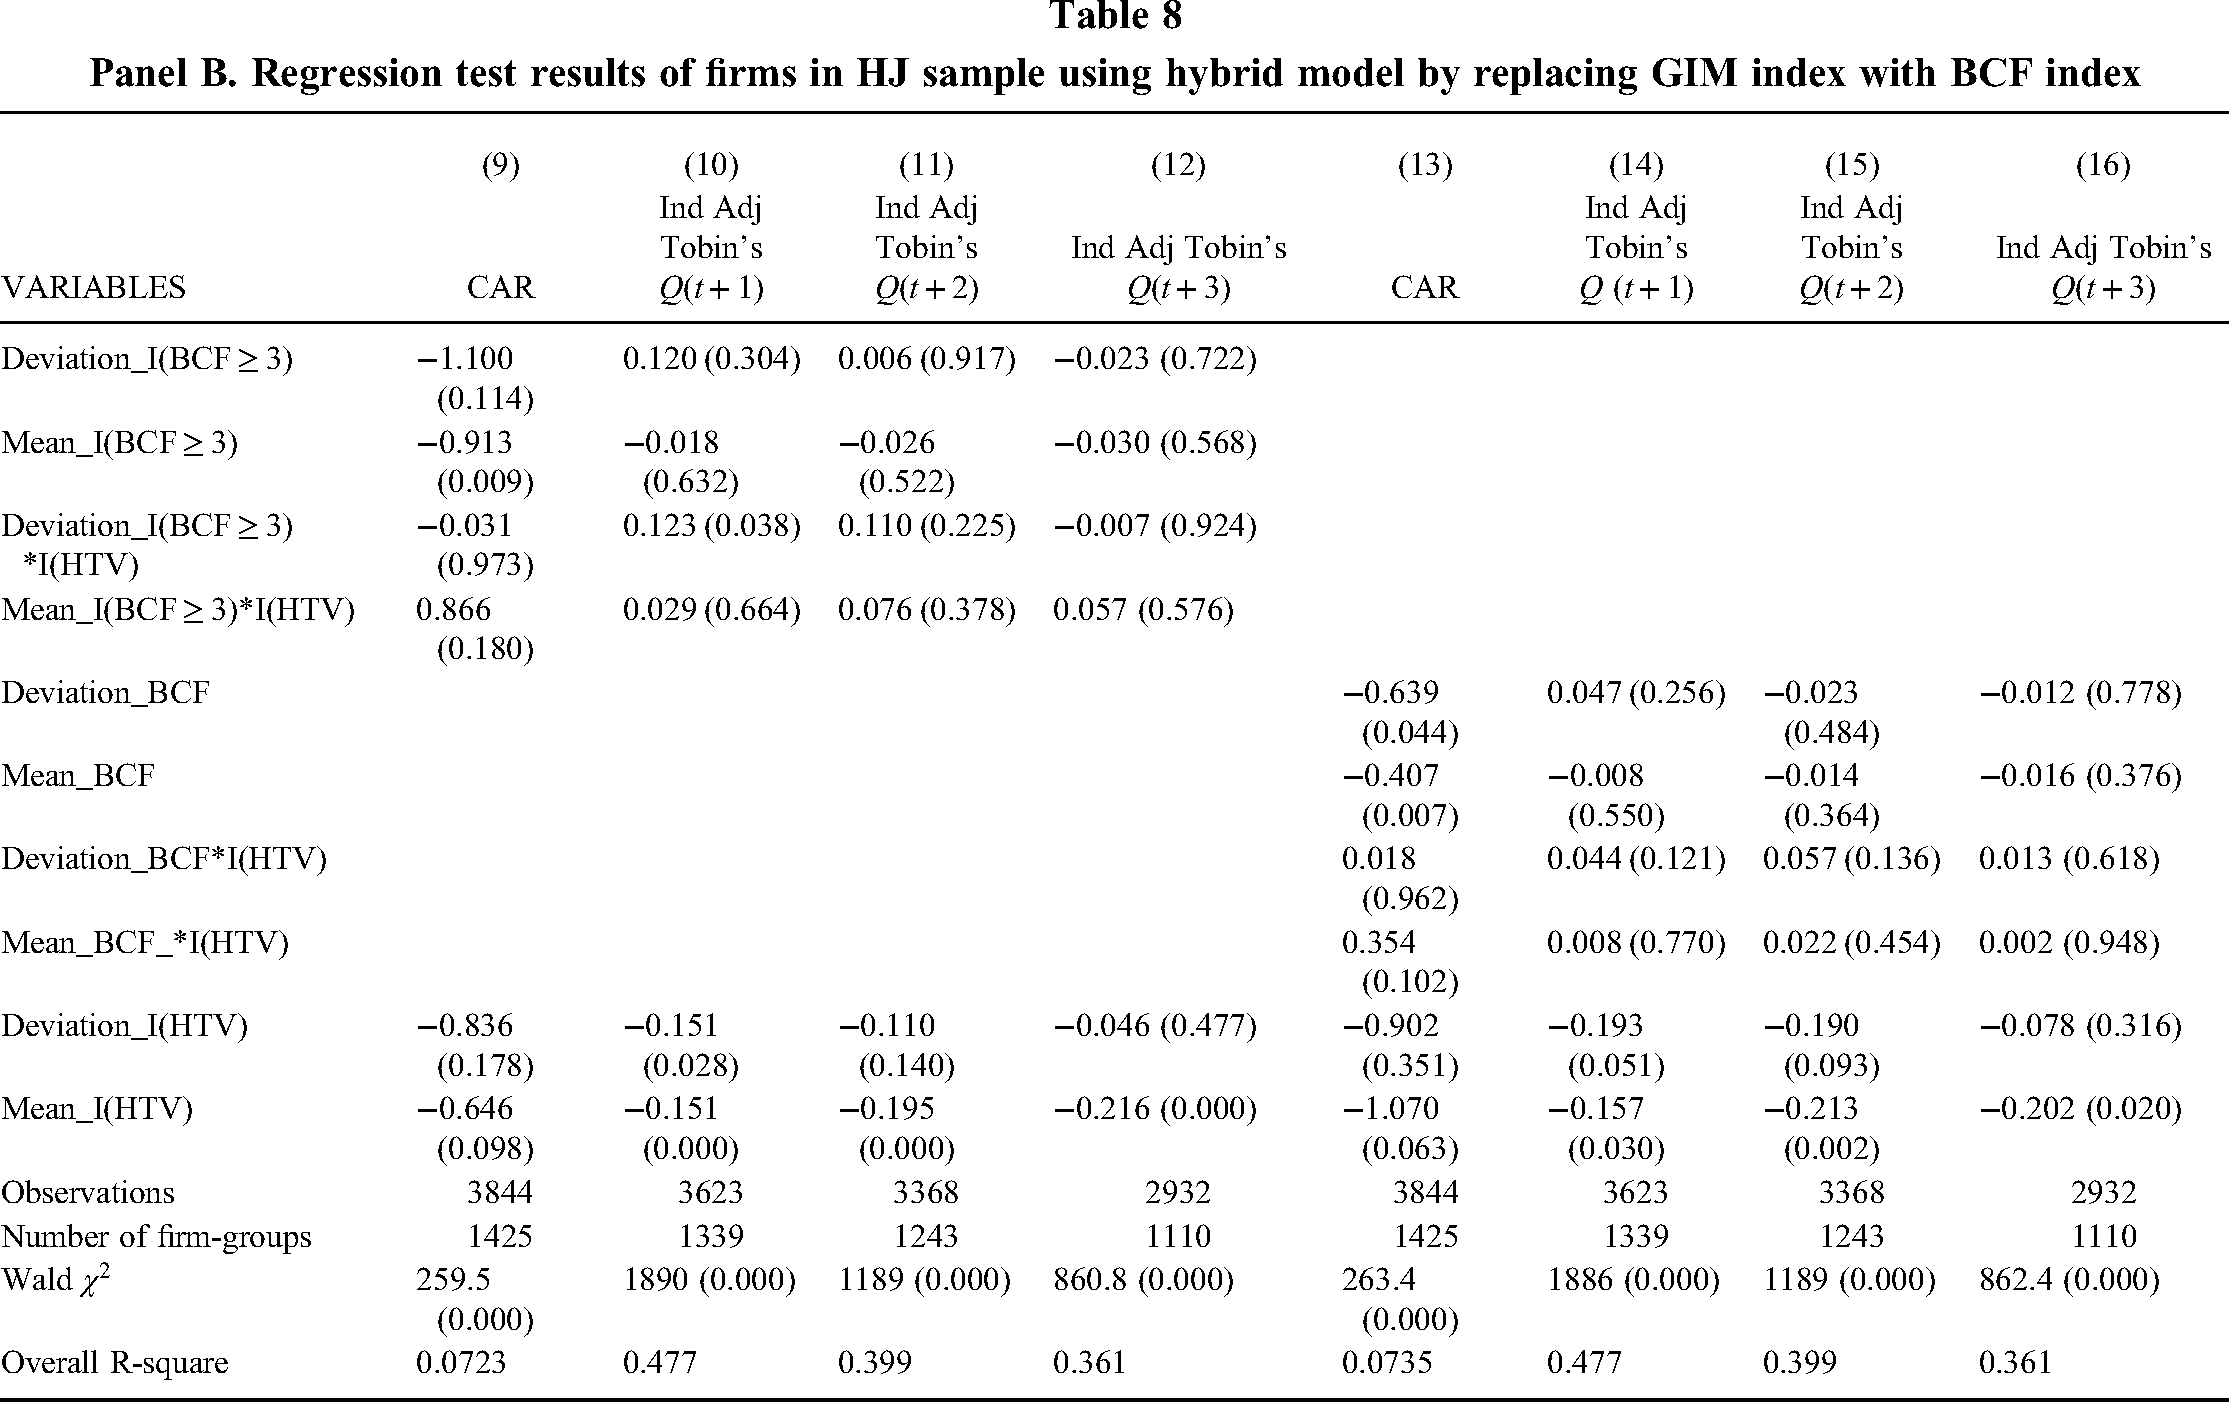
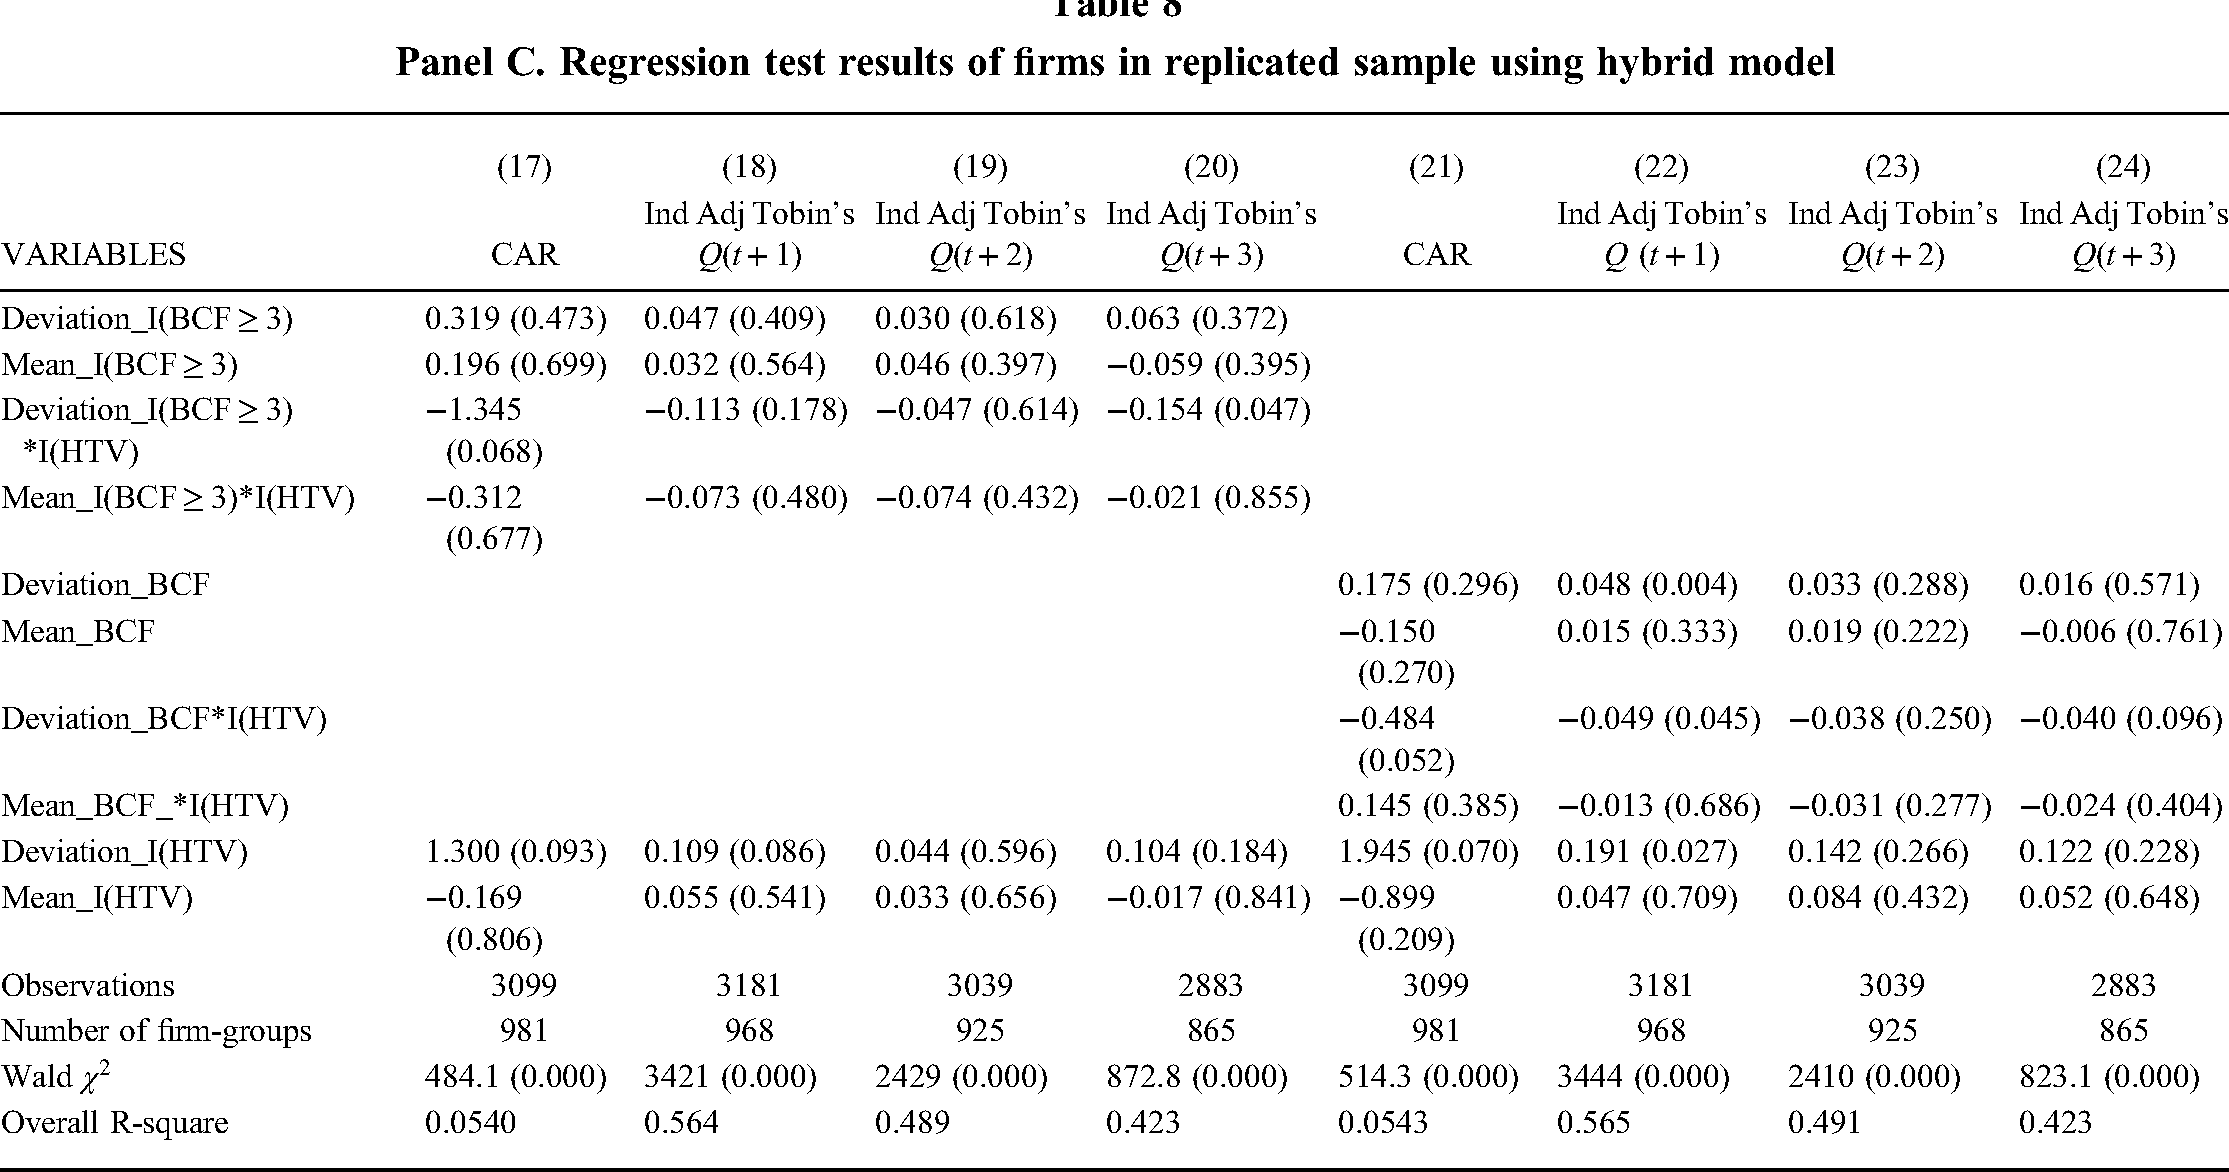
Table 8 reports results using hybrid approach. Panel A reports tests of the HJ hypothesis model using HJ sample. Panel B reports tests using HJ sample by replacing GIM index with BCF index. Panel C reports the results from testing the replicated study (2006 to 2015). Panel D reports the results from testing the combined studies (1990 to 2015). All models include year dummies, and standard errors are clustered by 3-digit industry. P-values in parentheses. The results are robust for models that used the period effect following Certo et al. (2017). HJ: Humphery-Jenner; BCF: Bebchuk, Cohen and Farrell; HTV: hard-to-value.
HJ's sample and measure. Panel A presents the mixed variance tests of HJ's original sample and measures. Findings show that the between-firm effects product variable (Mean_I(GIM ≥ 10)*I(HTV)) for the GIM index and HTV are significantly related to performance in models 1 and 2 (Model 1: β = 2.172, p = 0.000; Model 2: β = 0.220, p = 0.005) marginally in models 3 (β = 0.175, p = 0.077) and 4 (β = 0.148, p = 0.068). The product of GIM count and HTV is related positively to performance in models 5 (β = 0.301, p = 0.007), 6 (β = 0.035, p = 0.029), and 7 (β = 0.036, p = 0.042). By contrast, the within-firm effects product variable (Deviation_I(GIM ≥ 10)*I(HTV)) is not significantly related to the performance proxies in any of the eight models.
Results presented in Panel B for testing BCF instead of GIM indicate that the product variables for the between- (Mean) and within-firm (Deviation) effects are not related to performance in any of the models. Overall, this change in findings indicates that the results from testing HJ's sample are sensitive to the ATP measure and that his use of GIM led significant relationships for between-firm effects and performance.
Replication and combined samples. The findings reported in Panel C indicate that tests of relationships with performance with the BCF index and HTV interactions are non-significant for both between- and within-firm effects in most models excepting models 20 and 22. In these models, the product variable Deviation_I(BCF ≥ 3)*I(HTV) is related negatively and significantly for Tobin's Q at t + 3 (model 20: β = −0.154, p = 0.047) and Tobin's Q at t + 1 for Deviation_I(BCF) * I(HTV) (model 22: β = −0.049, p = 0.045). These findings indicate that decreases in within-firm effects is associated with higher performance. However, the relative inconsistency of these findings, different Q time periods, one significant observation for four performance variables and 2 cases of 16, suggest that they should be interpreted cautiously. Indeed, the findings from testing the combined sample, reported in Panel D, indicates that none of the between- or within-firm variables is related to performance.
HJ's observed significant relationships between ATPs, HTV and performance are due to a particular type of variation in his sample—between-firm effects—which does not exist in the replicated or combined sample. The within-firm effects occur infrequently in the replicated sample only, not prominent enough to merit a theoretical implication.
Supplemental analyses
We conducted additional analyses that reflect updates in research methods to help clarify the meaning of the replication's findings. All are reported in the Appendix.
Two-stage analyses. HJ used pooled regression analysis for testing his hypotheses, reporting endogeneity tests in a subsection under the robustness section. Those tests included a single instrument variable, the average level of ATPs in the firm's home state, presumably in a first-stage Heckman Probit regression model. 10 We added another instrument variable, industry-adjusted employment numbers, based on the rationale that larger firms tend to have more ATPs (Humphery-Jenner, 2014).
The first stage model used a Probit analysis and regressed high entrenchment (a dummy coded as 1 if BCF ≥ 3 and 0 if BCF < 3) onto the instruments and controls. Table A2 in the online appendix reports the findings: the coefficients and marginal effects for both instruments are significant statistically. In addition, tests of two instruments are reported in Table A2 of the online appendix. Specifically, Table A2 Panel B reports the exogenous tests. Neither instrument is related significantly within their respective dependent variable tests (Average ATPs: β = −0.363, p = 0.156 for CAR; β = 0.004, p = 0.855 for Q + 1; β = −0.004, p = 0.862 for Q + 2; β = −0.005, p = 0.808; IA employees: β = 0.001, p = 0.224 for CAR; β = 0.000, p = 0.903 for Q + 1; β = 0.000, p = 0.597 for Q + 2; and β = −0.000, p = 0.668 for Q + 3). Table A2 Panel C reports the relevance tests. The instruments are related to the BCF variables (BCF in model 5: Average ATPs, β = 0.902, p = 0.000 for BCF; Model 6: IA emp, β = −0.002, p = 0.063 for BCF; Model 8: Average ATPs, β = 0.943, p = 0.000 for BCF(I); Model 9: IA emp, β = −0.001, p = 0.043 for BCF(I). Finally, Table A2 Panel D reports the exclusion tests. In all cases, the instruments are not correlated to residuals predicted from the second-stage models. Further, the instruments do not appear to be vulnerable to omitted variable bias. 11 Overall, the instruments mostly meet their respective conditions.
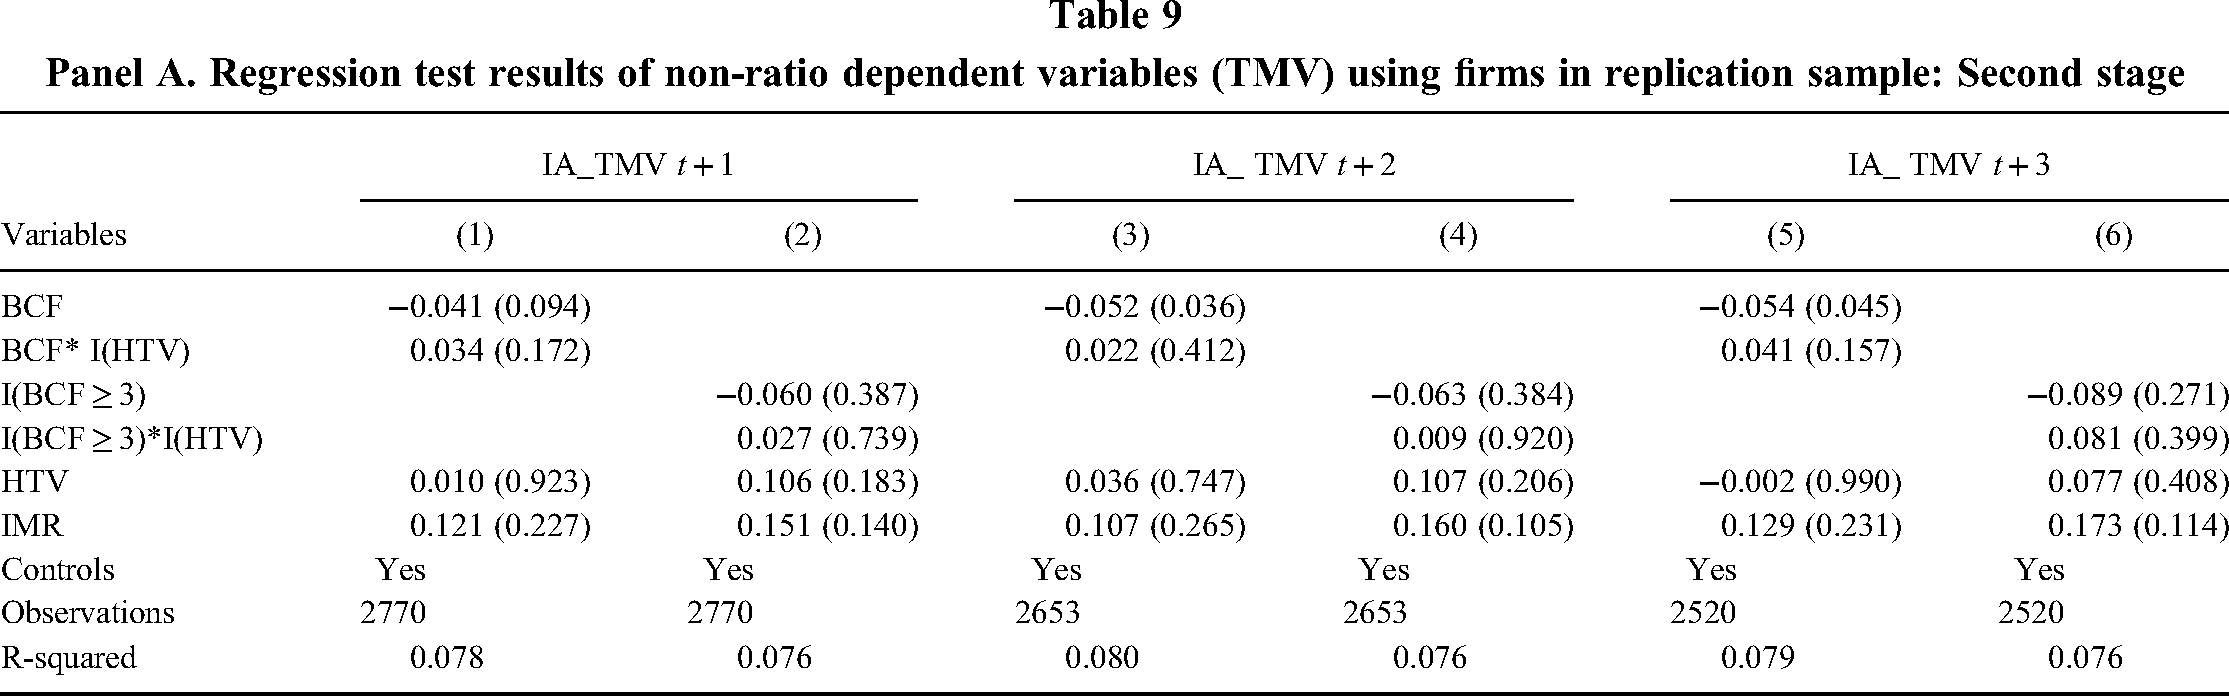
Non-ratio dependent variables. We next regressed two non-ratio dependent variables in the second stage analyses (which include the IMR term from the first stage model). Table 9 reports tests using the numerator of Q as the dependent variable, specifically the log of industry-adjusted total market value. Results under Panel A show some marginal evidence that BCF is negative and significant for year 2 and 3, but the product with HTV industries are not related significantly for any year. Similarly, Panel B reports tests of long-term investor value appropriation (LIVA) as the dependent variable and the same non-significant relationships exist for the product term. Subsample tests in both panels also reveal that high levels of entrenchment and their product with HTV industries are not related to either total market value or LIVA. These results mirror those using ratio variables. (Tables 9, 10, and 11).
Panel A. Regression test results of non-ratio dependent variables (TMV) using firms in replication sample: Second stage
Panel B. Regression test results of non-ratio dependent variables (LIVA) using firms in replication sample: Second stage
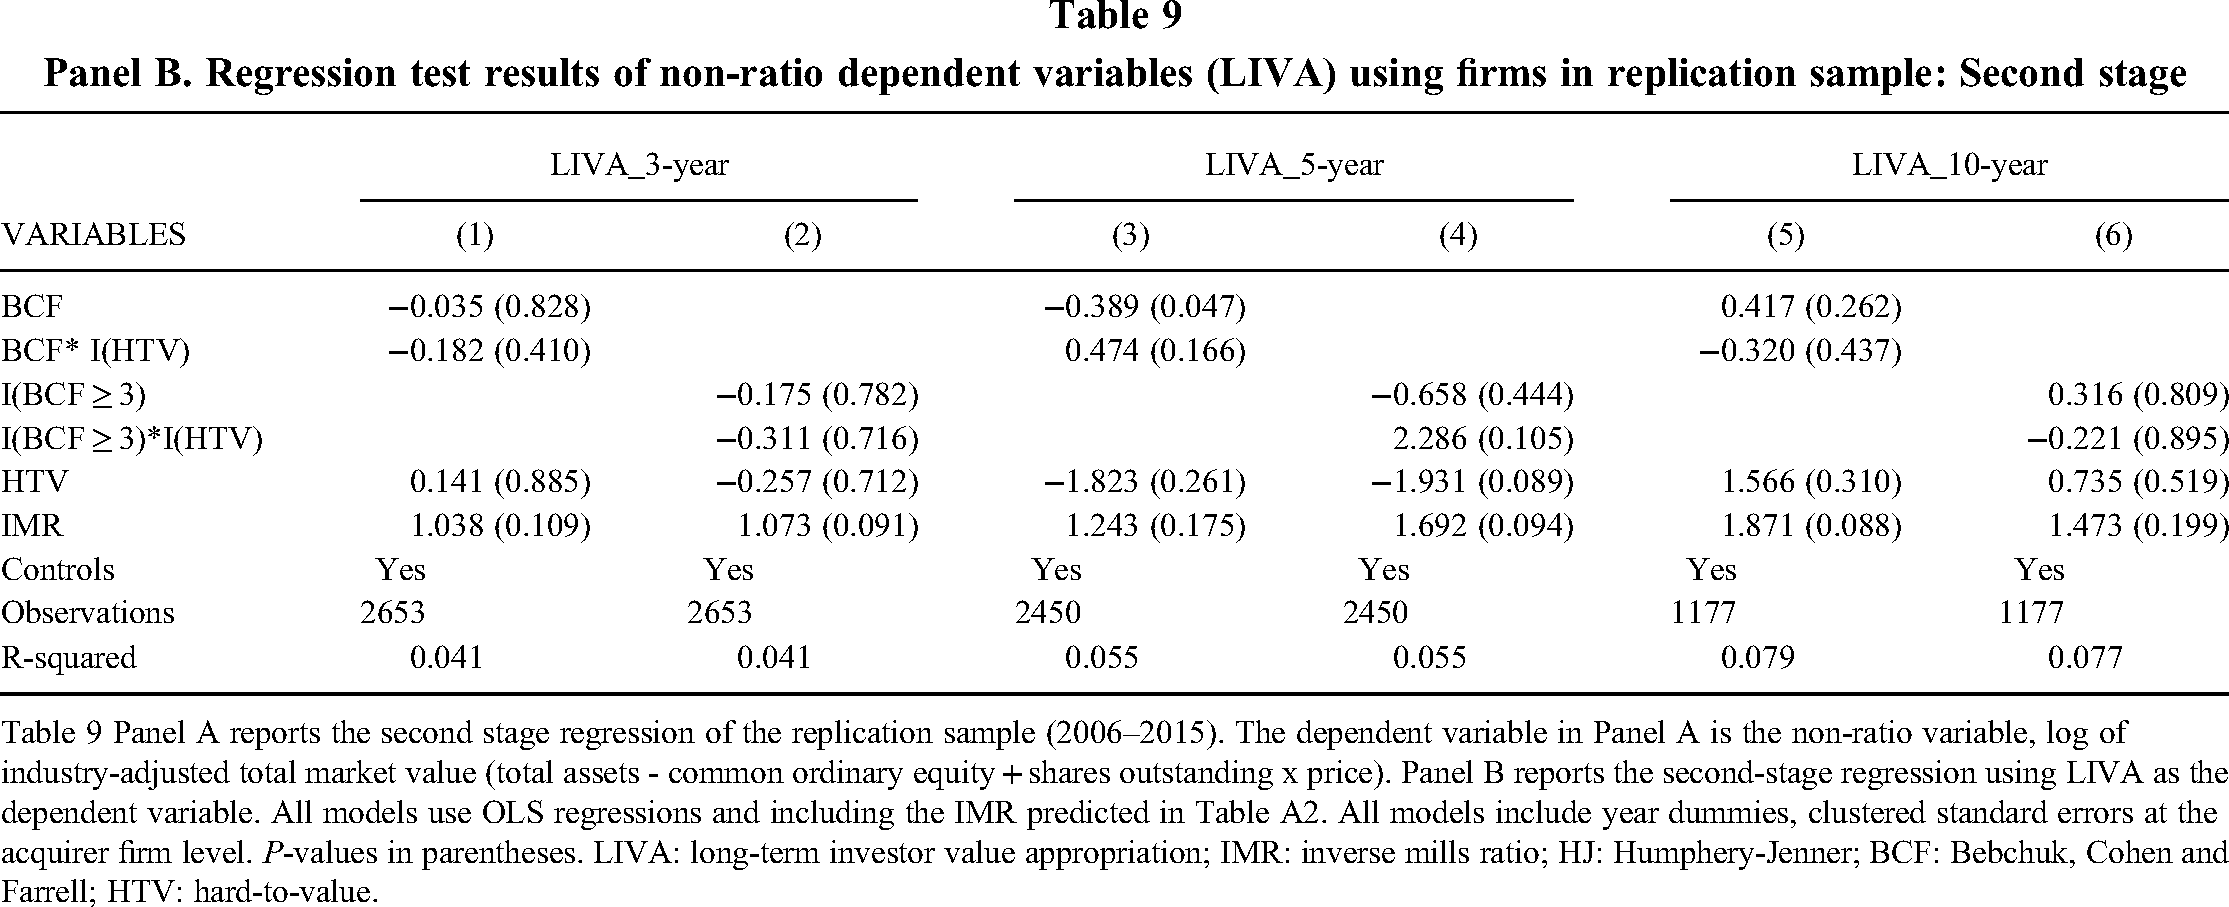
Table 9 Panel A reports the second stage regression of the replication sample (2006–2015). The dependent variable in Panel A is the non-ratio variable, log of industry-adjusted total market value (total assets - common ordinary equity + shares outstanding x price). Panel B reports the second-stage regression using LIVA as the dependent variable. All models use OLS regressions and including the IMR predicted in Table A2. All models include year dummies, clustered standard errors at the acquirer firm level. P-values in parentheses. LIVA: long-term investor value appropriation; IMR: inverse mills ratio; HJ: Humphery-Jenner; BCF: Bebchuk, Cohen and Farrell; HTV: hard-to-value.
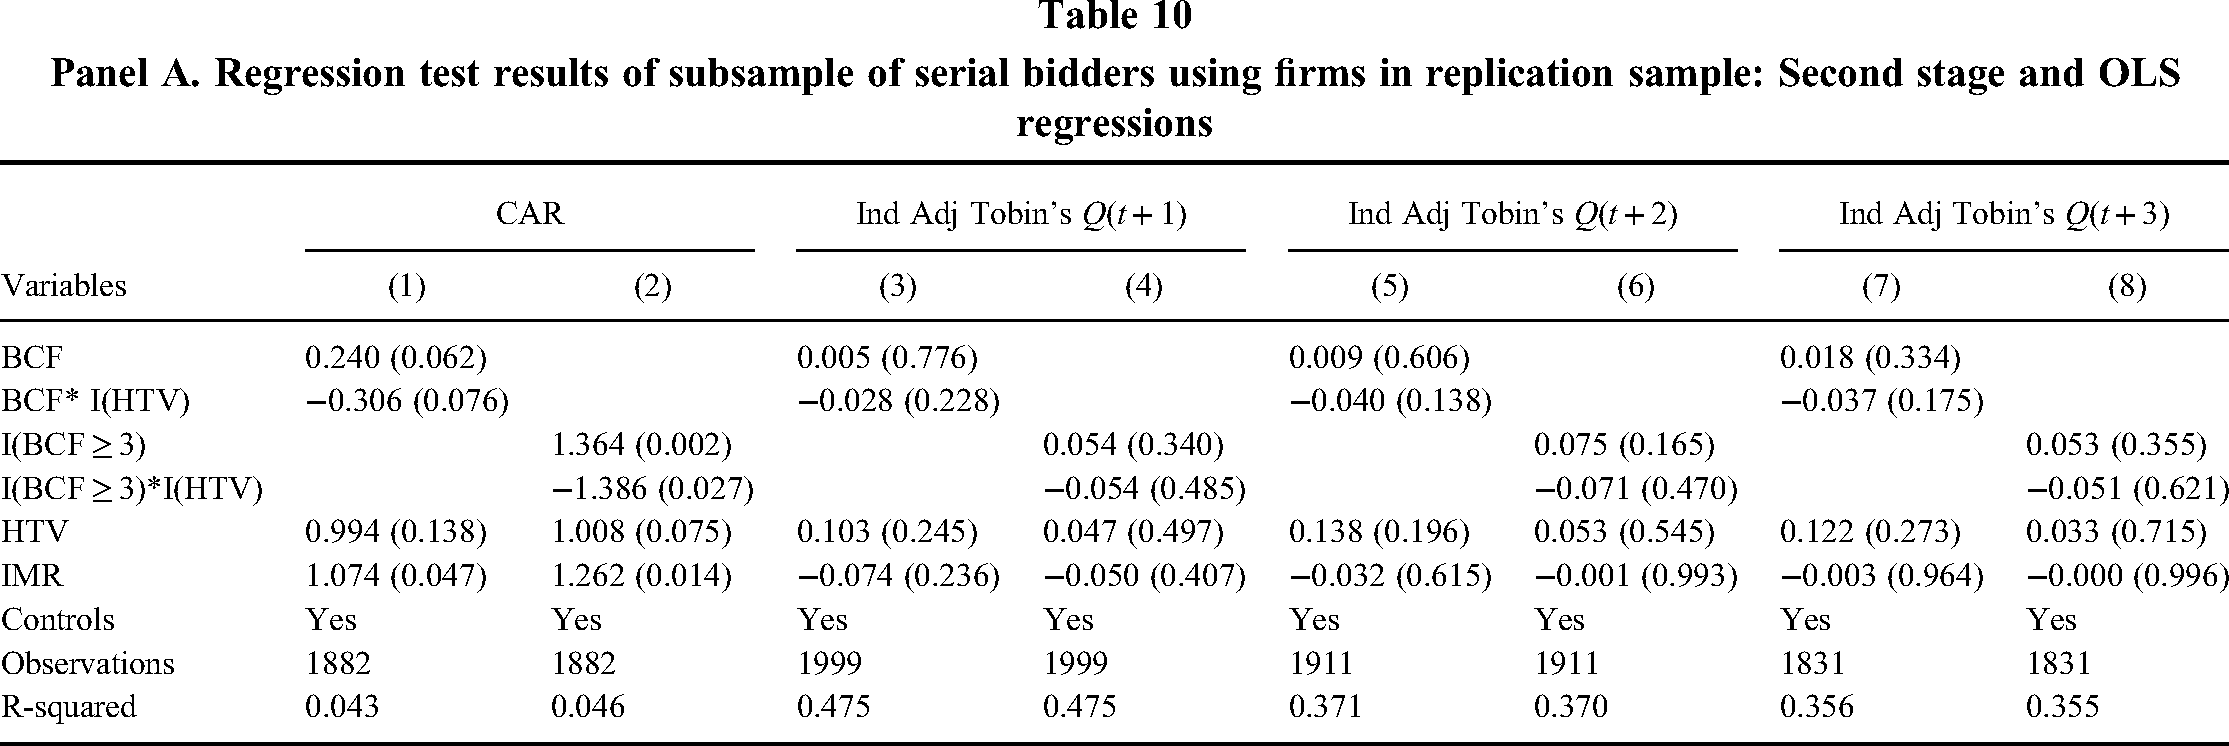
Panel A. Regression test results of subsample of serial bidders using firms in replication sample: Second stage and OLS regressions
Panel B. Regression test results of subsample of serial bidders using firms in replication sample: Second stage and firm fixed effects
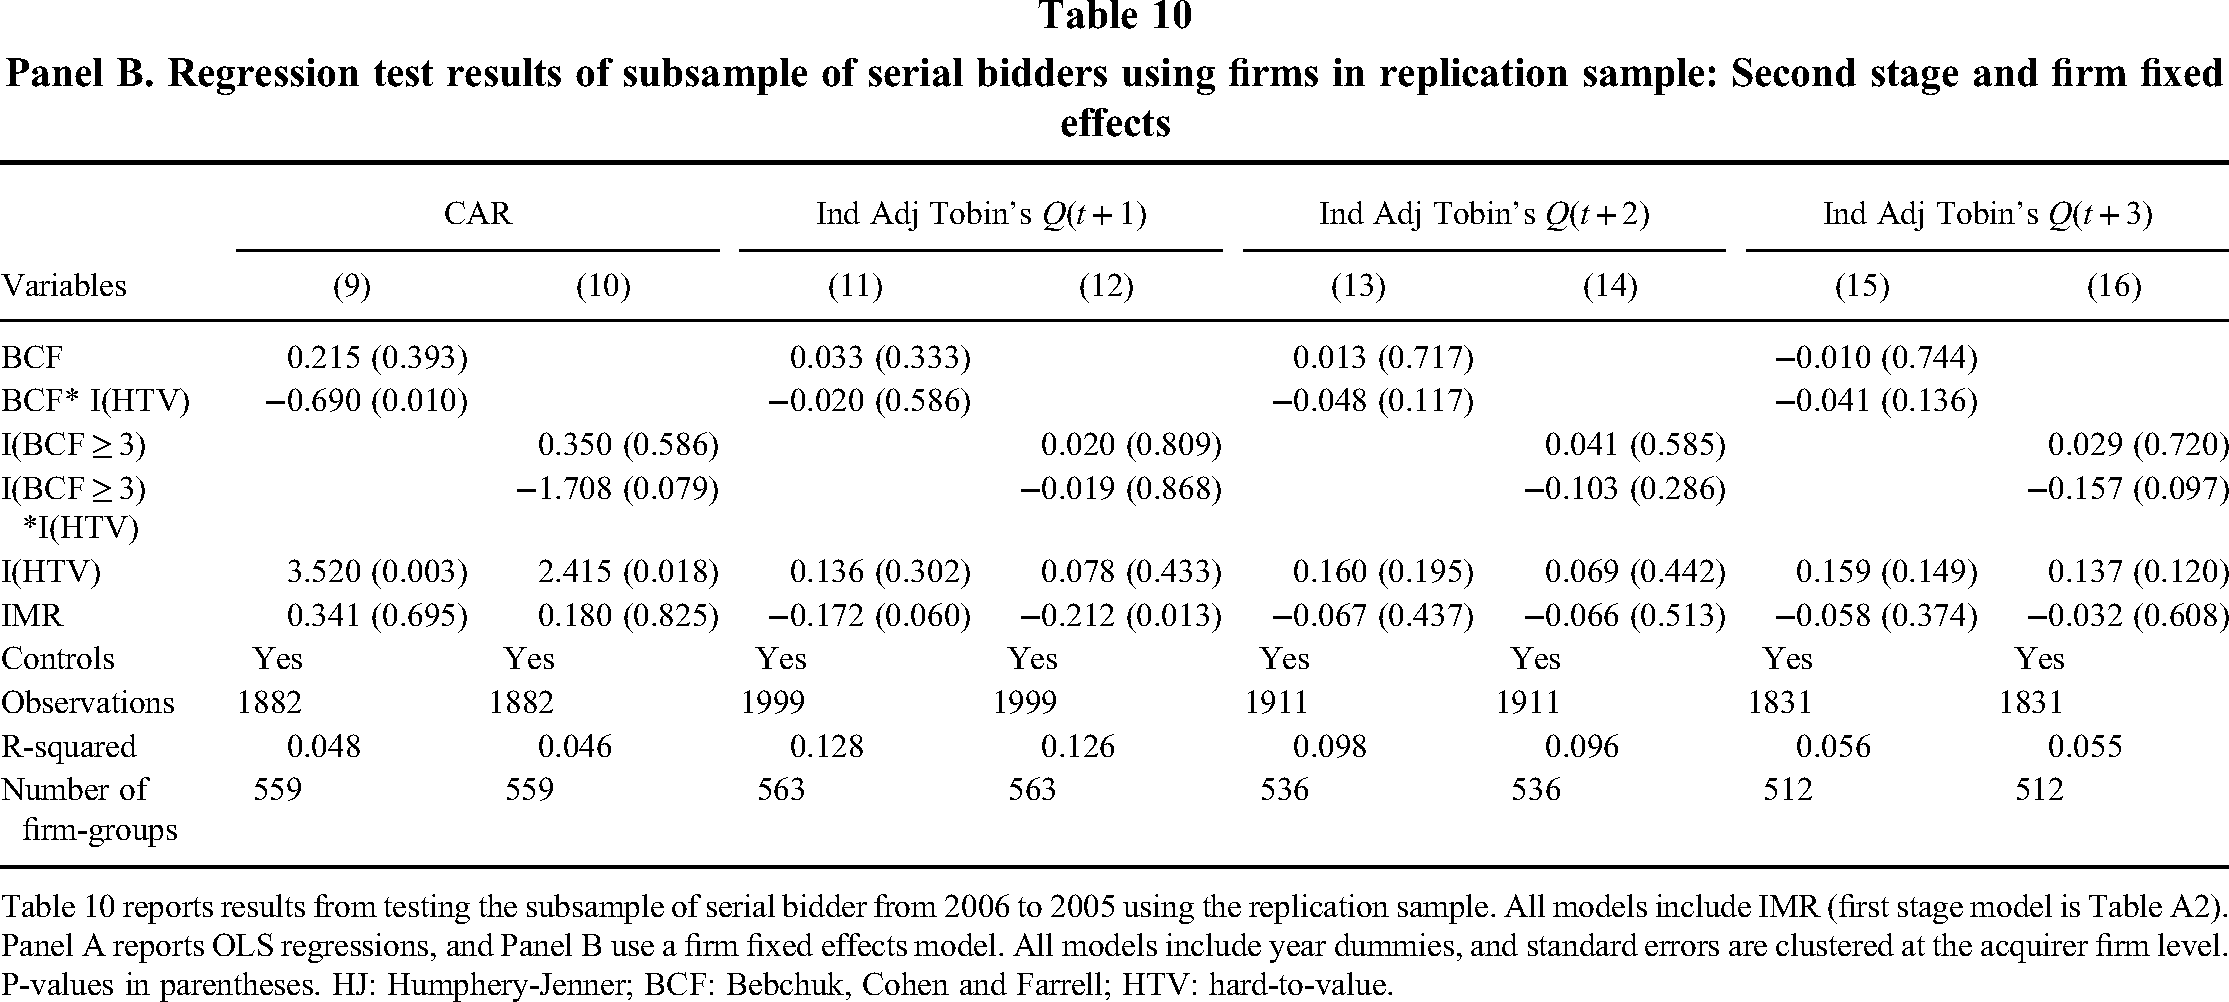
Table 10 reports results from testing the subsample of serial bidder from 2006 to 2005 using the replication sample. All models include IMR (first stage model is Table A2). Panel A reports OLS regressions, and Panel B use a firm fixed effects model. All models include year dummies, and standard errors are clustered at the acquirer firm level. P-values in parentheses. HJ: Humphery-Jenner; BCF: Bebchuk, Cohen and Farrell; HTV: hard-to-value.
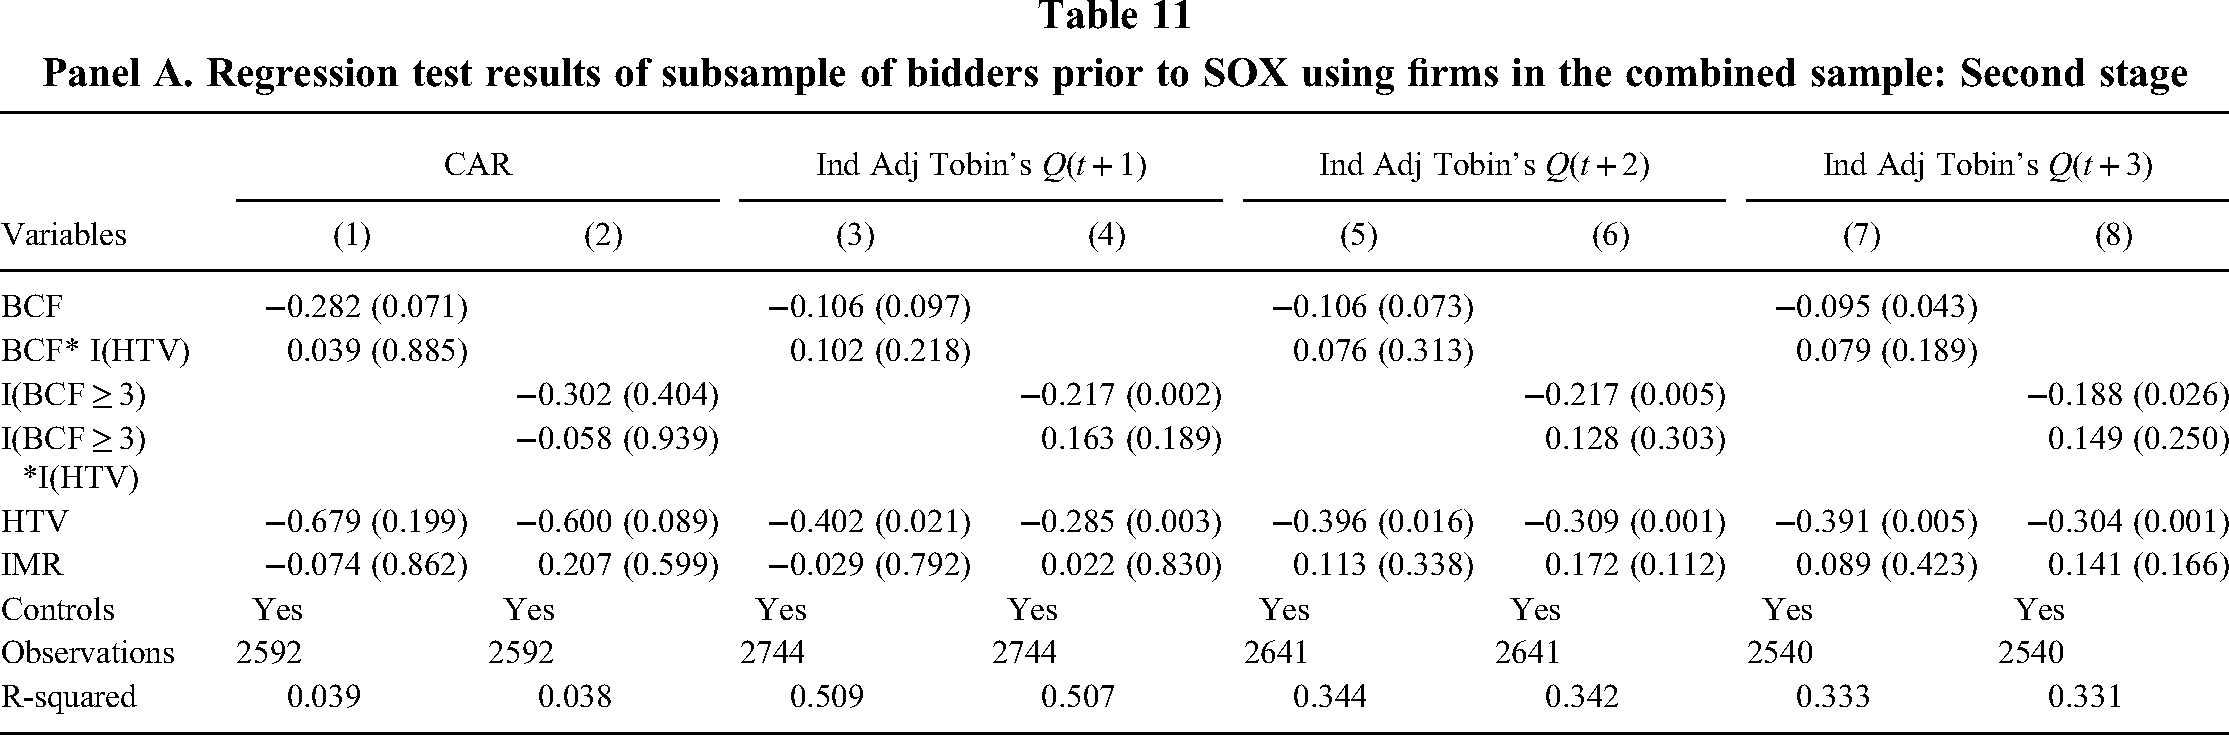
Panel A. Regression test results of subsample of bidders prior to SOX using firms in the combined sample: Second stage
Panel B. Regression test results of subsample of bidders post SOX using firms in the combined sample: Second stage
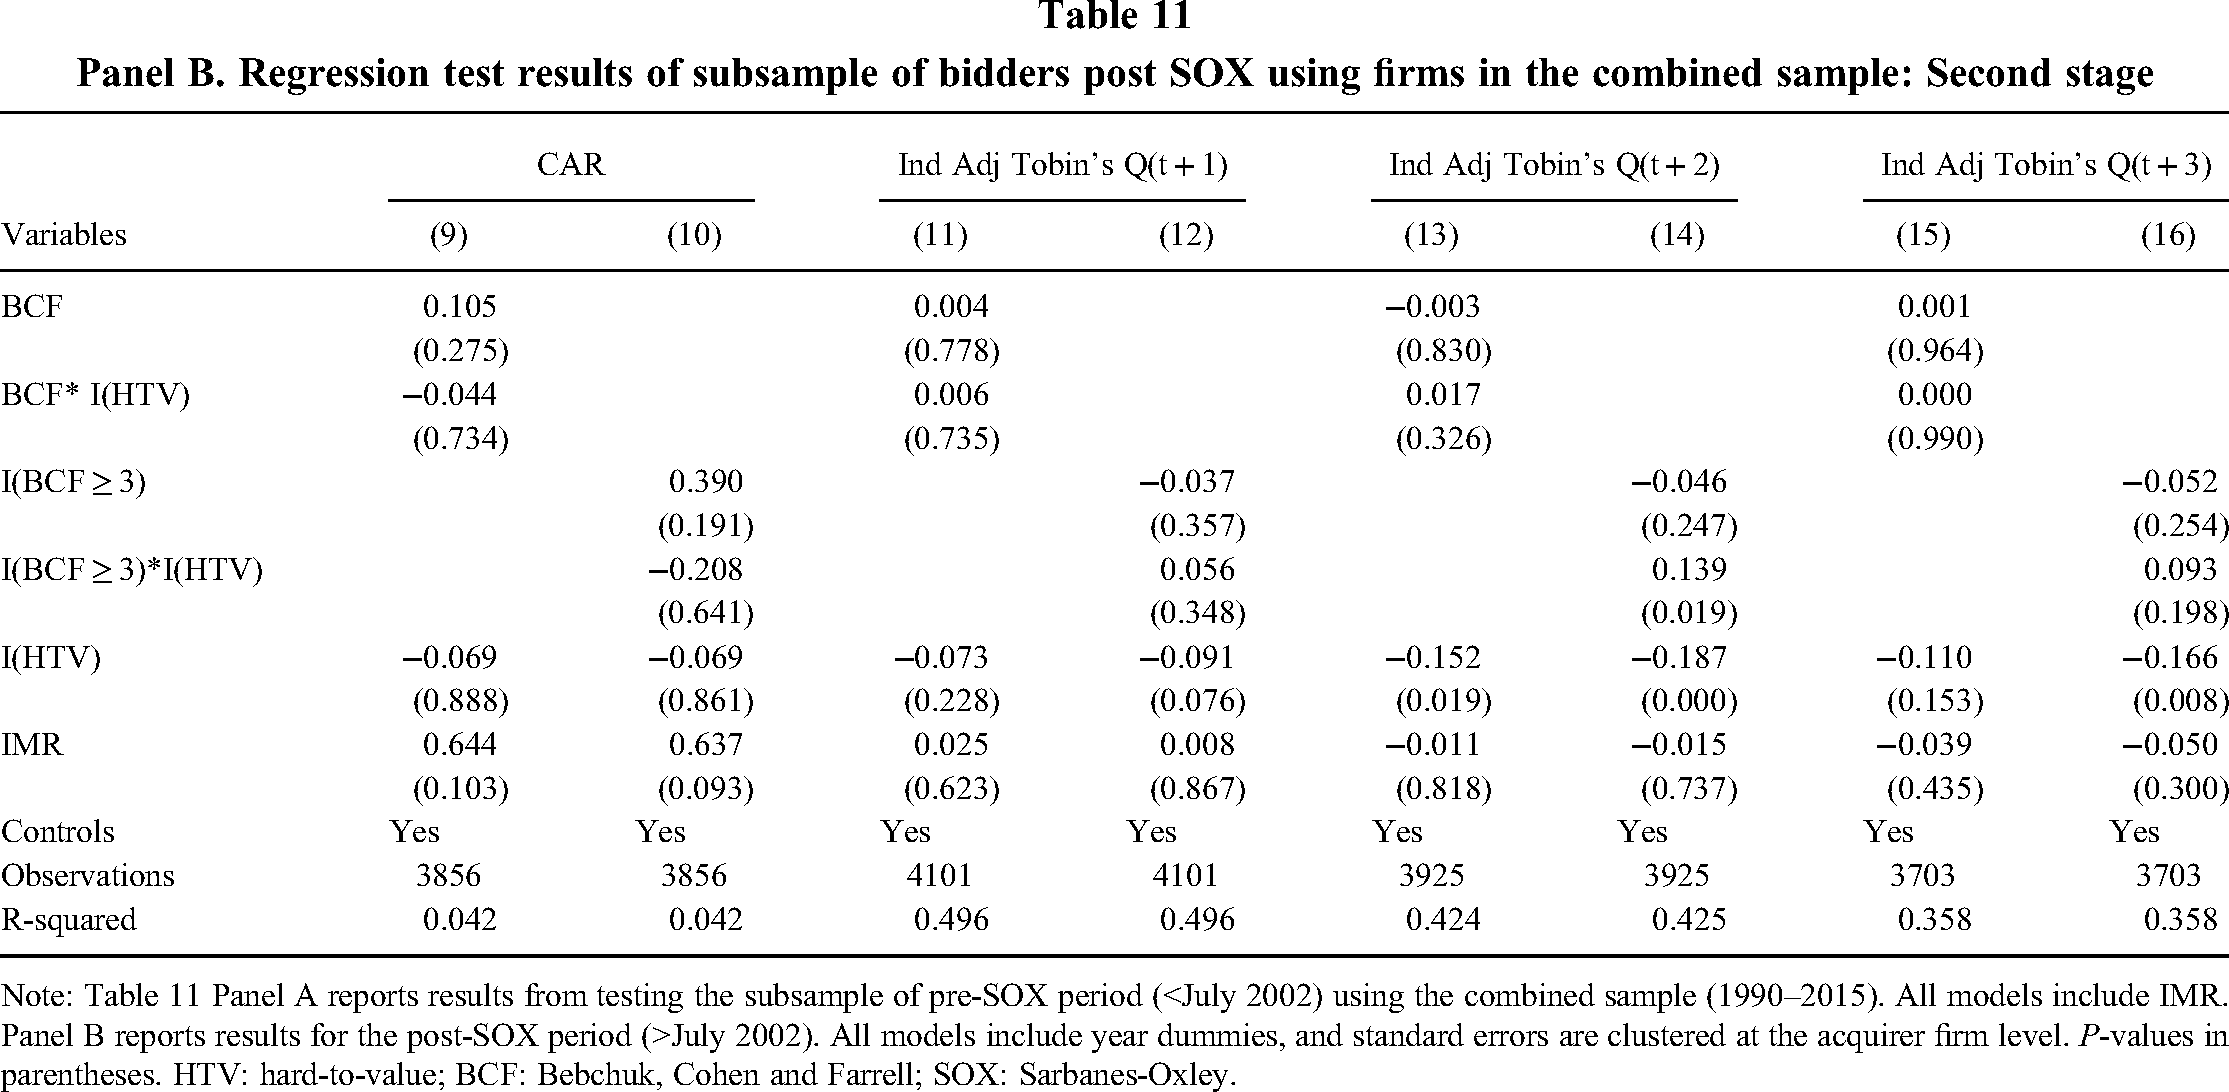
Note: Table 11 Panel A reports results from testing the subsample of pre-SOX period (<July 2002) using the combined sample (1990–2015). All models include IMR. Panel B reports results for the post-SOX period (>July 2002). All models include year dummies, and standard errors are clustered at the acquirer firm level. P-values in parentheses. HTV: hard-to-value; BCF: Bebchuk, Cohen and Farrell; SOX: Sarbanes-Oxley.
Serial bidders. Table 10 Panels A and B report results from subsamples of serial bidders, defined as firms that made 2 or more acquisitions during the study period. The results of non-significant relationships with the product variables reported in Panel A (Models 1, 3, 5, and 7) are similar to those for the entire sample (controls for firm fixed effects are not included). However, Model 2 does indicate a significant positive relationship for BCF (≥ 3) and a negative relationship (β = −1.386, p = 0.027) for the product variable of acquiring firms having high values of BCF (≥ 3) and residing in HTV industries. More entrenched firms making more acquisitions that exist in HTV industries tended to have lower performance, a result which supports the conventional agency theory argument. Only one of the product variable relationships (model 9) is significant (but negative) in models that includes firm fixed effects (Panel B).
Impact of SOX Act. We also examined whether the findings are related to the implementation of the SOX Act. We combined HJ's sample with ours and partitioned the data into two subsamples: one prior to SOX (July 2002) and one afterwards. Table 11 reports the prior-SOX Act period. The product terms are non-significant, but BCF is for Tobin's Q at year 3 (β = −0.095 p = 0.043) and for BCF (≥ 3) for year 1 (β = −0.217 p = 0.002), year 2 (β = −0.217 p = 0.005), and year 3 β = −0.188 p = 0.026). Apparently, entrenchment was related negatively to Q prior to the passage of the SOX Act. As reported under Panel B, no significant relationships exist for the product variable during the post-SOX period, except for model 14 (β = 0.139 p = 0.019). These findings indicate that a major legal and regulatory event does not seem to account for the difference in our findings with the product variable (BCF * HTV) and those reported by HJ. However, entrenchment does appear to be more apparent during the pre-SOX period with more evidence of negative and significant BCF relative to the post-SOX period. This set of findings suggest that SOX may have partly mitigated some aspects of managerial entrenchment, especially that related to major investments, including mergers and acquisitions.
Marginal analyses. We also tested the marginal effects of BCF and HTV relative to the dependent variables. The findings reported in Table A3 (Panel A) and depicted in Figure 1 for the replication sample show that average CAR values for firms in HTV industries are lower when the firm is entrenched while Tobin's Q1, Q2, and Q3 values are higher for HTV firms in those settings. Apparently, the opposite outcome of the stock market's expectations occur: The less-positive expectations for entrenched firms in HTV industries at the acquisition announcement date are not realized as post-acquisition Tobin's Q values are higher for these firms. By contrast, retesting HJ's data finds less consistent relationships (Panel B) but indicate in general that entrenched acquiring firms in HTV industries tended to have lower performance to those with low entrenchment and not residing in HTV industries.
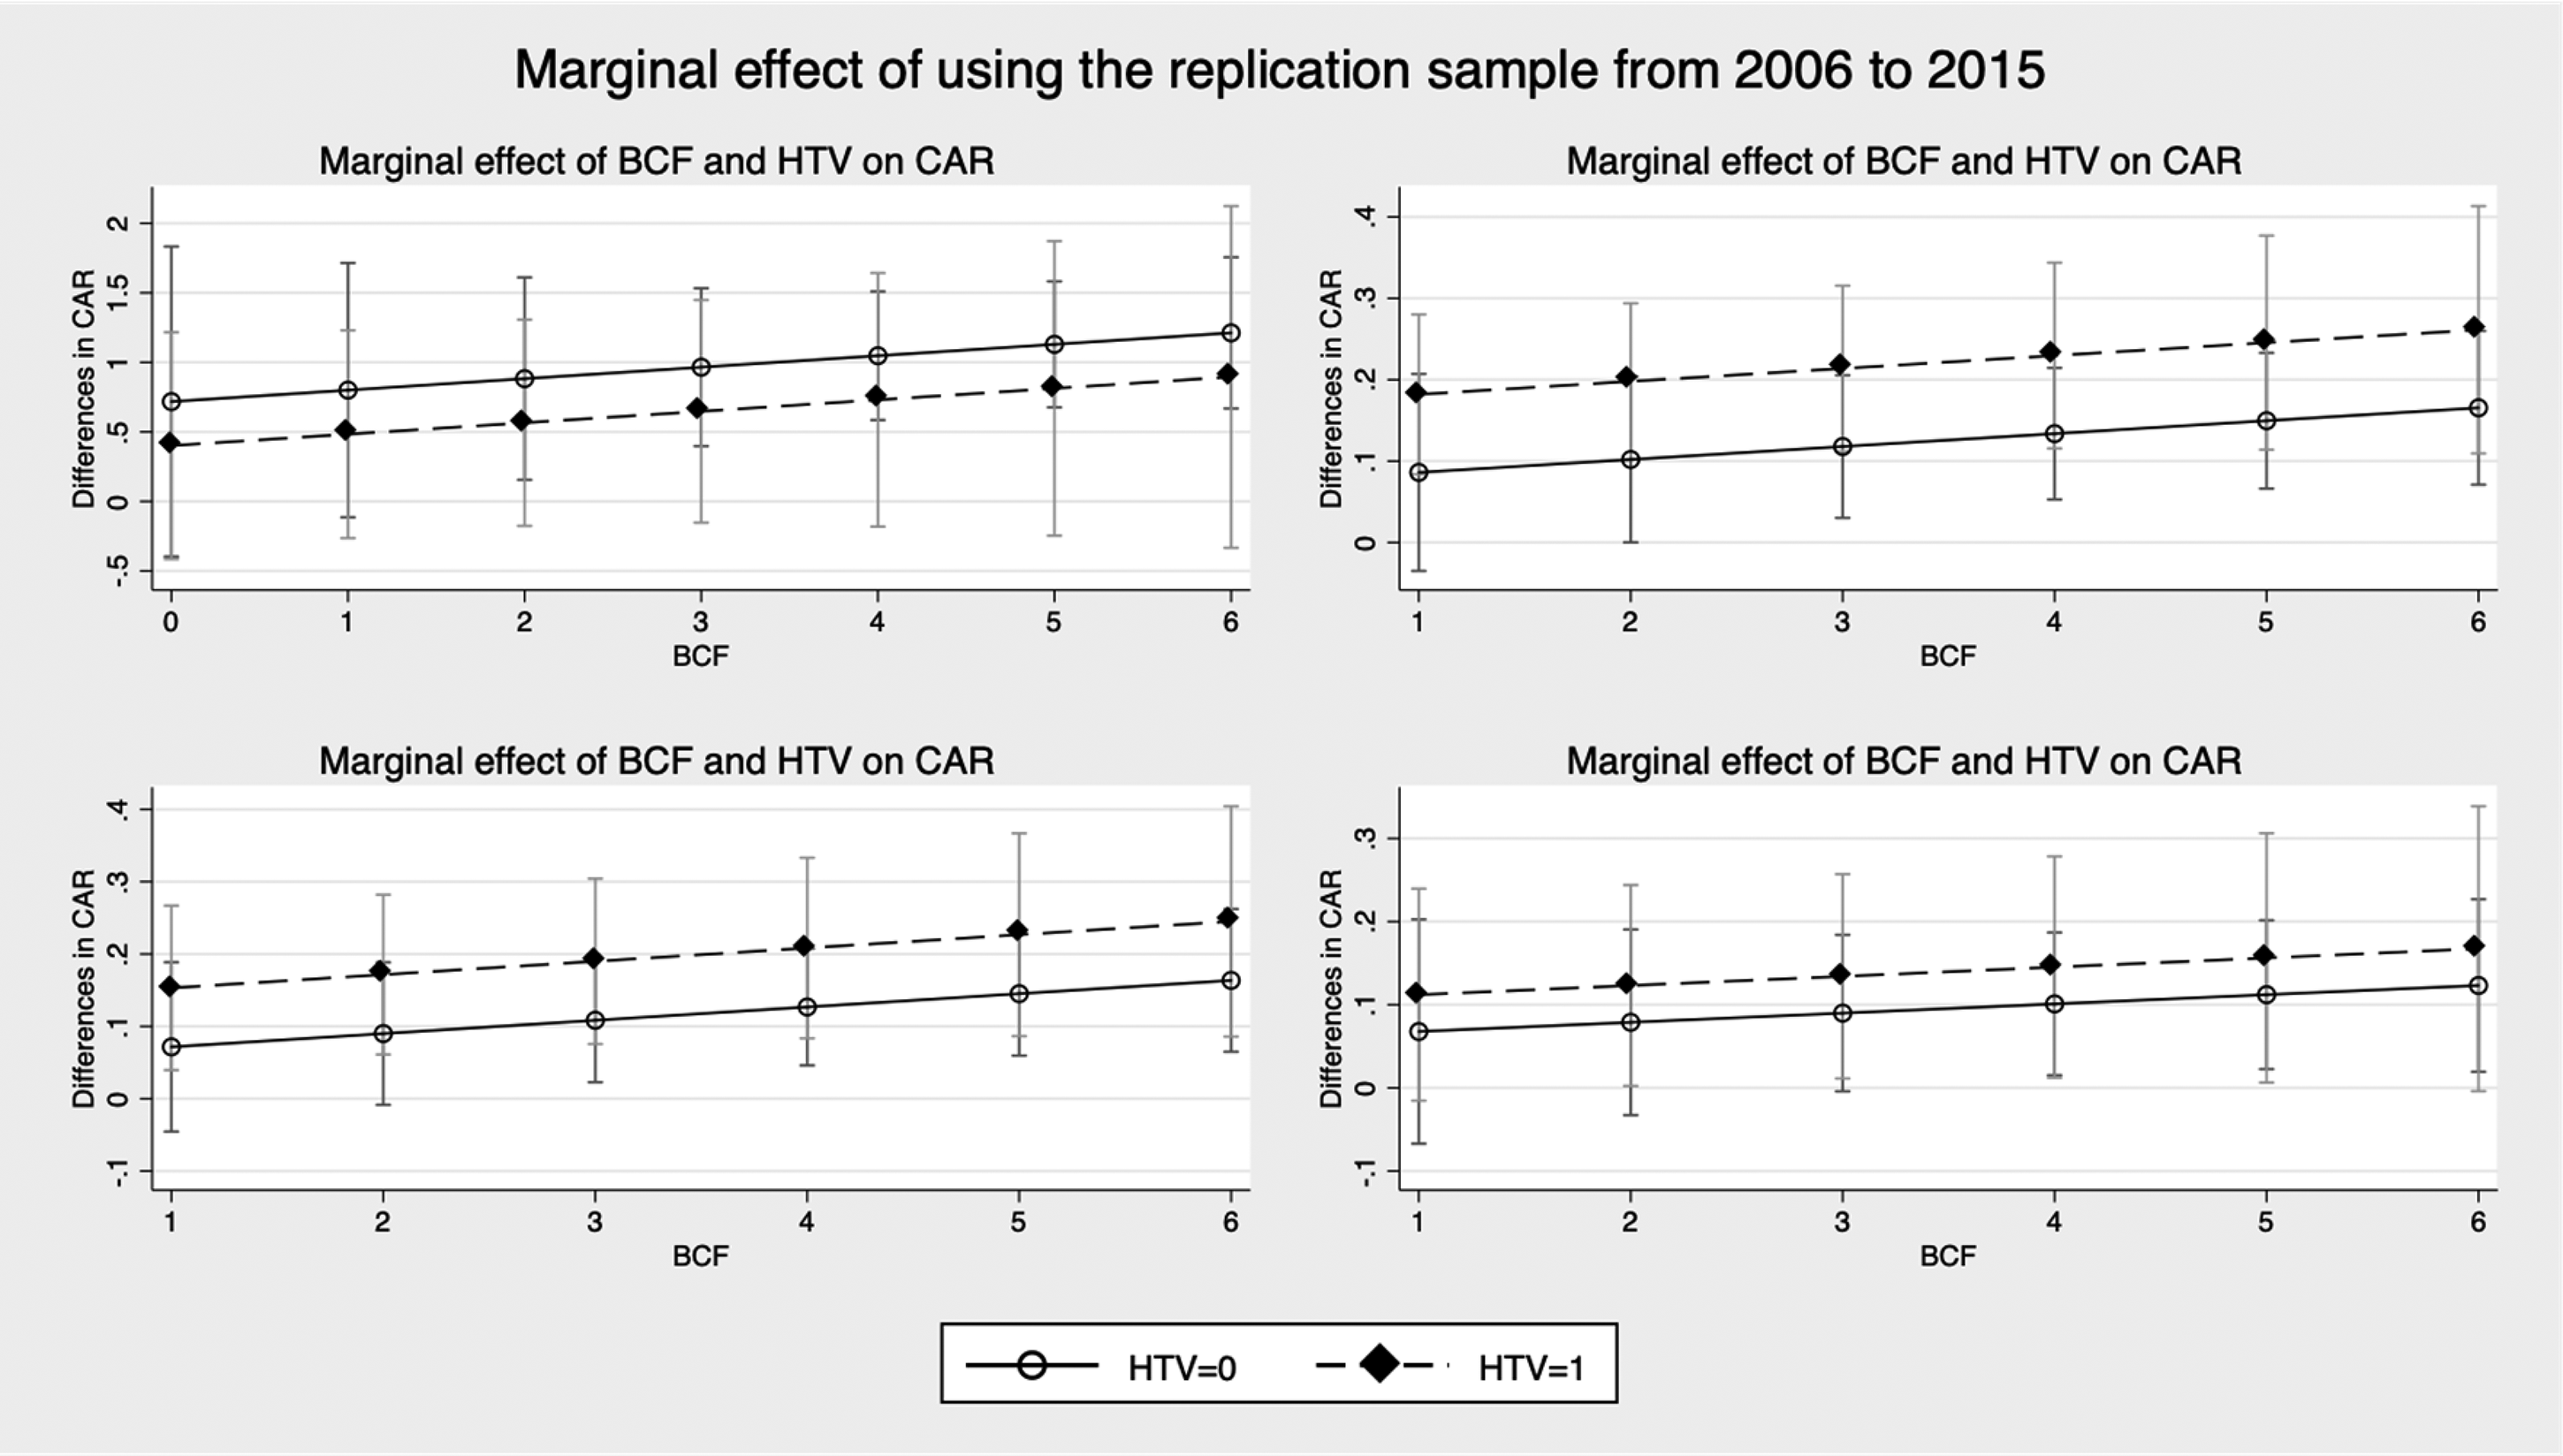
Marginal effects of BCF and HTV on dependent variables using the replication sample
Additional boundary conditions. Johnson et al. (2022) report evidence of a value-reversal for ATPs based on firm age. They show a positive relation for younger firms (less than 4 years old) and a negative relation for older firms (more than 4 years). They hypothesize that this effect exits due to ATPs providing value for younger firms and is related to the costs and benefits of takeover defenses as firms’ age. Specifically, benefits decline, and costs increase as the firms’ age, and ATPs tend to be sticky, so are not removed while costs rise. Hence, ATPs that add value when the firm is young impair value as it ages.
We follow the approach used by Johnson et al. (2022) and re-estimate our regression models for the HJ sample and the replication sample including first the interaction between ATPs (BCF or E-index) and firm age (see Table A4), and second, adding this interaction to our current regression models (see Table A5) to see if this additional control variable influences our findings. Table A4 (Panel A and B) shows that the interaction capturing older entrenched firms (BCF*age) is non-significant for both the HJ sample (Panel A) and the replication sample (Panel B). Further, adding this interaction to our regression models (Table A5, Panel A and B) does not alter our findings for either the HJ or replication samples.
Discussion
ATPs have long been theoretically associated with managerial entrenchment, self-interested behavior, and lower performance (Mahoney & Mahoney, 1993; Morck et al., 1990; Sundaramurthy, 1996). Humphery-Jenner (2014) offers an opposing view, arguing that ATPs can lead to a beneficial entrenchment for acquiring firms in HTV industries and align managerial and owner self-interests in pursuing strategic actions that maximize firm performance. HJ's challenge to a foundational and widely accepted application of agency theory motivates the need to probe the boundaries and generalizability of his reasoning to provide for a more complete understanding of the hypothesis. Our replication pursues those objectives.
In general, no empirical relationships appear to exist between ATPs, industry membership, and acquisition performance beyond HJ's study period and ATP measure. These findings suggest some revisions to HJ's beneficial entrenchment hypothesis of acquisitions and acquiring firm performance. First, his logic has theoretical boundaries: The firm fixed effects and mixed variance tests show that variance between acquiring firms’ ATPs and HTV industry membership drives his findings and that changes to ATP levels within firms over time are not related to performance. Second, his findings have limited generalizability, existing only for acquiring firms in his sampling period and ATPs measured using the GIM Index measure. More generally, managerial entrenchment has no direct impact on acquiring firm performance for the acquisitions in the replication sample time period.
Possible reasons for the non-replication outcome
The variable values of the samples provide some clarity into the reasons for the non-replication outcome. For HJ's sample, the BCF Index values were lower but had relatively higher variance than in the replication sample (Table 1: HJ mean and SD for I(BCF ≥ 3) = 0.450 and 0.498, respectively; Replication mean and SD for I(BCF ≥ 3) = 0.771 and 0.420, respectively, t = −29.85, p = 0.000). In addition, concentration ratios (not reported) of the sample's proportion of acquisitions made by the top acquiring firms were higher for HJ's sample than in the replication, indicating that fewer firms (e.g., Cisco, GE) made up more of HJ's total acquisitions, increasing the between-firm variance within his sample. Moreover, the variable (I(Serial Acquirer)) values in Table 1 show that the mean and SD for HJ's sample are far lower (t = −52.50, p = 0.000) than corresponding values in the replication sample, meaning that fewer firms made multiple acquisitions in HJ's sample but those that did, tended to make more and their impact could be disproportionate between-firms.
Another set of possible differences is variation in entrenchment levels and institutional factors. HJ reports a mean BCF E-index value of 2.270 which is lower than found in our sample (Table 1 mean = 3.483; significantly different from HJ's). With lower entrenchment levels, managers would apply higher levels of care to their acquisitions and only select the candidates that are most likely to pay off in the market's valuation or they risk being replaced. Further, institutionally speaking, the HJ study period featured a lower level of corporate disclosures and an active takeover market, creating an employment market whereby managers in valuation vulnerable firms (e.g., residing in HTV industries) were especially exposed to replacement.
Our study's time-period includes none of these backdrops: With higher levels of entrenchment through higher ATPs during our study's period, leaders were more insulated from the takeover market, had more discretion, and likely pursued higher variation in the partners and acquisition targets. With their higher levels of entrenchment, leaders would have less pressure to produce higher performance outcomes and would seem more likely to have both winning and losing acquisitions. These conditions combine to lead to no clear performance patterns among the acquisitions. Thus, differences in entrenchment levels, which reflect conditions during their respective time periods and geographic areas, would likely account at least partly for our inability to replicate HJ's findings.
Moreover, while entrenchment levels increased during our study's period, greater monitoring of managers and boards brought about by greater board independence and regulation change, including SOX in 2002, may have mitigated some of the value-reducing activities of firms, especially those related to large investment decisions. Greater board independence and regulation that stipulates better internal controls and reporting standards likely reduces agency costs and managerial entrenchment in the same way as an active takeover market. We provide some evidence that supports less value-reducing behavior by managers in the post-SOX relative to the pre-SOX periods. Evidence also exists in the Finance literature (Banerjee et al., 2015) that supports the view that SOX increased monitoring of managers by reducing value-destroying behavior by overconfident CEOs, especially in merger and acquisition deals.
Another reason for the non-replication outcome is methodological: How ATPs are measured appears to matter to findings. Although HJ reports a significant positive correlation between GIM and BCF (r = 0.71, p < 0.01), and when both are depicted as indices (r = 0.55, p < 0.01), the use of one over the other can lead to different outcomes and conclusions. In our retesting of HJ's data, we find that variability in ATP measurement produced statistically or non-statistically significant empirical relationships (see Table 3). These outcomes are likely to lead to inconsistencies in the findings of other studies and possibly encourage cherry-picking empirical models to favor significance, ultimately hurting replicability. Further, since many ATP studies used GIM, and because it is no longer available after 2006, it seems likely that empirical relationships based on GIM may no longer hold when BCF and other proxies are used as replacements in more recent studies. A meta-analytical and construct validation assessment may be needed to ascertain how much observed relationships depend on the choice of ATP measurements to synthesize discrepant results and provide a clear measurement roadmap going forward. Thus, researchers need to exercise particular care when interpreting findings and conclusions based on different ATP measures.
Further, while ATPs might limit the reach of external corporate governance as a disciplining force on management, internal governance efficiency through labor markets could serve as an alternative substituting mechanism for incentivizing and controlling wayward managers (Rediker & Seth, 1995). Additionally, the traditional agency theory argument may apply more to the types of acquisitions made in the 1960s and 1970s when the logic was formulated to explain unrelated acquisitions, diversification, and empire building, and less to those in the 1990s and onward that tend to be more industry-focused, related, and strategic (e.g., Bergh, 1997). And finally, HJ's and our study are missing measures for underlying theoretical mechanisms central to agency theory, such as ownership power and influence (e.g., ownership concentration measures and board of director representation), and may not be providing a complete test of agency theory and managerial entrenchment.
Implications for the managerial entrenchment hypothesis
The managerial entrenchment hypothesis has been a foundational argument for explaining acquisitions from the strategic management field's early days. In short, entrenched managers make self-interested acquisitions that reduce firm performance and valuation (e.g., Amihud & Lev, 1981, 1999; Harford et al., 2012; Masulis, Wang & Xie, 2007). However, some have challenged this convention, finding that the relationship does not exist (Lane et al., 1998) or is period specific (Bergh, 1997). HJ goes another interesting step by positing a more refined insight: Entrenchment is beneficial for managers leading firms in industries vulnerable to takeover. His findings were recently corroborated with a sample of German acquisitions (Drobetz & Momtaz, 2020). Nonetheless, the German context has strong institutional support through the dual board structures which could serve as a substitute for additional ATPs in the event of an external bidder, providing a possible alternative explanation for their support of the beneficial entrenchment hypothesis.
Our findings, and those of Lane and colleagues (1998), indicate that boundaries exist to the generalizability of the managerial entrenchment hypothesis of acquisitions. Some of these concerns have originated since the 1980s, as “some management theorists are now questioning the ability of agency theory to explain the full range of management behaviors, particularly when managerial interests do not directly conflict with those of shareholders” (Lane et al., 1998, p. 556). Along these lines, our sample further confirms this observation for a different conception of the managerial entrenchment hypothesis using a different combination of variables. Whereas Lane and colleagues’ proxy managerial entrenchment using ownership levels and board vigilance relative to unrelated acquisitions and diversification strategies, our integration of ATPs and HTV using a sample of acquisitions occurring after theirs provides results identical in meaning. The existence of such similar findings raises doubts about the viability of the managerial entrenchment hypothesis for explaining acquisition actions and performance.
When the acquisitions are considered in the aggregate over both HJ's and our replication samples, we find no stable relationship between ATPs, acquiring firms, and industry membership with value-creating or value-destroying acquisitions. This outcome suggests that managerial entrenchment has neither positive nor negative impact with respect to acquisition performance. Given this result, the value-added of adopting ATPs might be gained from other sources, including reducing uncertainty from potential bidding firms (Sundaramurthy et al., 1997), supplementing executive compensation contracts (Borokhovich et al., 1997), helping retain high level managers (Cabral et al., 2021), and providing them with the sense that they have support for strategic actions such as innovation spending (Chemmanur & Tian, 2018). Thus, while the findings provide no enduring support for the entrenchment view of acquisitions and performance, ATPs might offer other benefits to leading and managing a firm. Future research might provide more fruitful insights into ATPs through examining these other outcomes using different theoretical perspectives. 12
Conclusion
HJ offers a bold revision to one of the classic arguments in the corporate strategy literature, namely that the conception of entrenched managers pursuing self-interested underperforming acquisitions in the name of empire building can be set aside by a different view, whereby these managers engage in acquisitions that improve the firm's strategy and its performance. His departure from conventional orthodoxy naturally raises the need to examine his premises critically.
We offer two important implications to HJ's hypothesis, one that he might have envisioned and one that he might not. ATPs have the potential for creating beneficial entrenchment for acquiring firms in HTV industries, during a particular time-period and with a specific ATP measure. An unexpected outcome is the inability to replicate the entrenchment relationship with respect to ATPs, acquisitions, and performance. Collectively, the viability of the beneficial management entrenchment hypothesis is limited to periods of lower regulation in the pre-2000s and methodological decisions. Thus, our replication indicates that the beneficial entrenchment hypothesis is less a departure from or revision to, but a special case qualification of the conventional perspective.
Overall, our findings fail to replicate one of the strategic management field's cornerstone concepts and a revised version which reflects a beneficial outcome from protecting managers from corporate control contests. Perhaps agency theory and management entrenchment have less applicability to explaining acquisitions and their outcomes than theorists have long suggested. And while certainly no single study can disqualify any theory's validity, nonetheless, the findings from an assessment of more than 7000 acquisitions made over a 26-year period cannot be quietly dismissed. Instead, one of the most widely accepted theoretical tenets of acquisition behaviors warrants reconsideration as to its utility in strategic management research.
Supplemental Material
sj-docx-1-msr-10.1177_27550311231222555 - Supplemental material for Another look at the managerial entrenchment hypothesis of acquisitions: A replication of Humphery-Jenner (2014)
Supplemental material, sj-docx-1-msr-10.1177_27550311231222555 for Another look at the managerial entrenchment hypothesis of acquisitions: A replication of Humphery-Jenner (2014) by Donald D. Bergh, Ronan Powell and Yang Zhao in Journal of Management Scientific Reports
Footnotes
Acknowledgments
The authors are thankful to Matthew Semadeni, Michael Withers, William Schultze, and two anonymous reviewers for their helpful insights.
Declaration of conflicting interests
The authors declared no potential conflicts of interest with respect to the research, authorship, and/or publication of this article.
Funding
The authors received no financial support for the research, authorship, and/or publication of this article.
Notes
References
Supplementary Material
Please find the following supplemental material available below.
For Open Access articles published under a Creative Commons License, all supplemental material carries the same license as the article it is associated with.
For non-Open Access articles published, all supplemental material carries a non-exclusive license, and permission requests for re-use of supplemental material or any part of supplemental material shall be sent directly to the copyright owner as specified in the copyright notice associated with the article.