
Abstract
We investigate the stock market reactions to the announcements of Black CEO and top management team (TMT) appointments in light of two conflicting studies that advance competing and opposite theories. In 2021, Gligor and colleagues theorized that reactions will be negative due to racial stereotyping, and found negative mean stock price reactions for both Black CEOs and TMTs. Conversely, in 2023, Jeong and colleagues theorized that the stock market will respond positively to the appointment of Black CEOs, because these CEOs have to meet a “higher bar” to be appointed. They reported a positive mean reaction to such appointments. In our quasi-replication of these two prior studies, we find a reliably positive mean reaction for Black CEOs but an immaterial median reaction, and no marginal stock price impact to the announcement of the appointment of a Black CEO and TMT executives after controlling for explanatory factors that go outside the racial bias and higher bar theories. In light of the fragility and lack of robustness in these results, we recommend that future research in the area of Black top executives and the stock market be cautious when presenting and interpreting results.
Introduction
Top executives are a focus of corporate strategy research because strategic outcomes are closely linked to the actions of a firm's top executives (Finkelstein et al., 2008). However, beyond actions per se, firms can also be affected by perceptions that stakeholders have of their top executives (de Luque et al., 2008; Lee & James, 2007; Quigley et al., 2017). Since announcements of executive appointments can affect investor perceptions of the firm and its stock market value (Connelly et al., 2016; Dixon-Fowler et al., 2013), demographic characteristics can play a central role in how a CEO is perceived by their employees, their board, and the stock market (Lee & James, 2007; Westphal & Stern, 2007). In particular, previous research has shown that race is a salient demographic characteristic that impacts the perception of CEOs. For example, Black male CEOs who have a “babyface” are judged to be warmer than Black CEOs with mature faces, while this effect is the opposite for White male CEOs (Livingston & Pearce, 2009).
In this article, we study how the stock market reacts to the announcement of the appointment of a Black CEO or Black top management team (TMT) member of a U.S. publicly traded firm, and what can be inferred about racial bias and CEO talent from such reactions. We do so by testing two competing theories on this topic posited in recently published papers. One theory proposes market returns will be lower for firms that announce a Black CEO because market participants have a negative bias due to stereotypical thinking (Gligor et al., 2021). The competing theory proposes that market returns will be higher for firms that announce a Black CEO because market perception that this individual has had to perform at a higher bar than non-Black CEOs due to discrimination within the corporate sector (Jeong et al., 2023). We utilize a quasi-replication approach, where we aim to retain the virtues of the previous studies while also contributing improvements that allow for improved hypothesis testing and interpretation of results (Bettis et al., 2016, p. 2195).
Drawing on research about how social evaluations can be shaped by racial stereotypes, Gligor et al. (2021) propose that firms’ stock market reactions will be more negative when they announce the appointment of a Black CEO than a White CEO, and more negative when they announce the appointment of a Black TMT than a White TMT. Using a sample of CEO and TMT appointments made during 2001–2020, Gligor et al. (2021) uses standard narrow-window event study methods to estimate and compare the mean abnormal stock returns of firms that announce a Black CEO or TMT with those of similar firms that announce a White CEO or TMT. They report finding large negative mean 3-day cumulative abnormal stock returns CAR [–1, +1] of −4.3% and −3.0% for the appointment announcements of 83 Black CEOs and 291 Black TMTs, respectively, as compared to small positive CAR [–1, +1] of 0.6% and 0.5% for the appointment announcements of 83 White CEOs and 291 White TMTs. Based on their results, Gligor et al. (2021) conclude that “shareholders can develop biased performance expectations for firms, depending on the race of their newly appointed executives” and suggest that their “findings serve to raise further awareness regarding the undesirable consequences associated with racial discrimination.” (pp. 1954–1955).
In marked contrast, a replication study by Jeong et al. (2023) finds a large positive mean CAR [–1, +1] of 3.1% to the announcements of 57 Black CEO appointments over the 2001–2020 period, and a small negative mean CAR [–1, +1] of −0.9% to the announcements of a matched set of 57 White CEO appointments (the authors did not perform a replication analysis for Black TMT announcements). Jeong et al. (2023) interpret their results as evidence that any racial bias in the stock market is outweighed by the effects of the “higher bar” theory which proposes that “investors may deem [Black CEOs] especially capable for having beaten the odds to be appointed to the pinnacle of corporate leadership” (p. 5).
The results reported by these two recently published studies are notable in the strategy field because the large reported magnitudes and small associated p-values for Black CEOs and TMTs run strongly counter to each other and to the results reported by Cook and Glass (2008) who found only a small mean abnormal stock return at the appointment announcements of 70 Black executives in U.S. public companies during the period 1996–2006. The findings of Gligor et al. (2021) also have the potential to be highly influential in future research and practice given the increased dialog within the academic and corporate arenas around the causes and consequences of racial and ethnic diversity in corporate boards (Miller & del Carmen Triana, 2009), executives and employees (Roberson, 2019), and the ways in which academia has investigated these topics (Bates & Ng, 2021).
In this article, we test the competing theories about market reactions to Black CEO and TMT executive appointments. We believe that this is valuable and set within a compelling setting for such an empirical investigation because it allows us to investigate the robustness of the inferences made in two competing theories about the stock market reactions to the appointment announcements of Black CEOs and TMTs, and consequently about the validity of theories put forward in them. We approach the investigation by undertaking a quasi-replication, defined as a study which investigates if the prior results generalize to both the same data and sample as well as a different sample within the same population (Bettis et al., 2016). Specifically, our CEO sample has significant sample overlap with Jeong et al. (2023), while our TMT sample should be considered as a new sample from the same population because Gligor et al. (2021) have not made their data available for comparison. Our quasi-replication is independent, in that the original authors of both papers were not involved in the construction of our dataset, and constructive, in that we keep the strengths of the original research design yet contribute new elements that we believe provide new empirical insights (Köhler & Cortina, 2023).
Our final sample consists of 78 Black and White CEOs, and 101 Black TMTs, all appointed between 2000 and 2020. There are several key results. First, we find a positive raw mean CAR [–1, +1] for Black CEO announcements, lending support to the “higher bar” theory proposed by Jeong et al. (2023). We find no evidence of racial stereotype discrimination of the kind proposed by Gligor et al. (2021). Second, we find effectively zero mean and median CAR [–1, +1] for our sample of Black TMT appointments, which runs counter to the negative mean TMT CAR [–1, +1] reported by Gligor et al. (2021).
Third, we find that the CAR [–1, +1] for Black CEO appointment announcements are statistically indistinguishable from zero using alternative nonmean measures of central tendency. In particular, the median CAR [–1, +1] is indistinguishable from zero in our dataset as well as in the datasets of Gligor et al. (2021) and Jeong et al. (2023). This lack of robustness as to the location of the central tendency of the distribution of individual CAR [–1, +1] indicates that relying solely on the magnitude and p-value of a mean stock price reaction can lead to fragile and/or misleading conclusions about both the central tendency of the observed individual CAR [–1, +1] being studied and the validity of theories that seek to explain them. While our analysis finds that extremely positive reactions in a small number of nano-cap stocks play a key role in the magnitude and p-value of the mean CAR [–1, +1], we caution against overweighting the race of the CEO, given the various other plausible reasons why very large stock price reactions are not uncommonly seen in nano-cap stocks (White, 2016).
Lastly, we find no effects marginal for Black CEOs using multivariate regression analysis of the individual CAR [–1, +1] in our matched Black/White CEO sample, nor when we include prior year stock performance in the regression estimation (a control variable that was not used in previous papers).
Based on our results, we conclude that mean stock price reactions alone are a fragile and nonrobust source of evidence with regard to theories about the stock market reactions to Black executive appointments. These include the theoretical mechanism proposed by Gligor et al. (2021) that the stock market is racially biased against Black CEOs and TMTs, the argument by Jeong et al. (2023) that investors may believe Black CEOs exhibit exceptional talents, and the proposition that the appointment of a Black CEO is a visible, credible and positive reputational signal to the stock market that the firm is an equitable and inclusive organization that does not racially discriminate, leading to predicted superior future financial performance. Due to greater dialogue in the academic and corporate arenas about the causes and consequences of executive and employee racial and ethnic diversity, we therefore recommend that future research in the area of Black top executives be fittingly cautious when presenting and interpreting its results. One way of achieving this would be for future event studies to more broadly report not only mean measures of the central tendency of firms’ stock price reactions, but also the size and associated p-values of median reactions, thereby providing visibility into multiple measures of central tendency and their connections back to proposed theories that underlie them.
Theoretical background
Recent research on the stock market reactions to the announcements of the appointments of Black CEOs and TMTs is centered on two papers that arrive at diametrically opposite empirical results. On the one hand, Gligor et al. (2021) argue that firms that appoint a Black CEO will experience a negative abnormal stock market reaction. They argue that this negative effect is primarily due to stereotype-based racial discrimination by investors which leads to lower valuations for firms that appoint a Black CEO. Stereotypes are a set of attributes that are ascribed to a group and then imputed to a single individual solely because the individual belongs to that group (Bersoff, 1991). Stereotype-based racial discrimination predicts that a significant portion of investors hold the belief that Black executives are less capable than White executives and thus lower their perceived value of a firm that appoints a Black executive regardless of his or her demonstrated competence. Evidence of this form of racial discrimination within organizations has been found in research about the experiences of Black executives (Anderson, 2011; Cornileus, 2013; Erskine et al., 2021; Thomas & Gabarro, 1999) as well as research about discrimination in employment hiring (Quillian & Midtbøen, 2021). The stereotype-based racial discrimination argument also aligns with research on pro-White leadership bias that finds that general audiences within the United States implicitly associate leadership qualities with Whiteness more than with other racial categories (Gündemir et al., 2014; Petsko & Rosette, 2023). Gligor et al. (2021) also suggest two factors that likely strengthen the negative stock market reaction to Black CEO appointment: tokenism and the glass cliff theory. An individual is considered a token if they are a member of a demographic group that comprises a small percentage of the overall population (Kanter, 1977). Black CEOs are a good example of a token due to the fact that they make up less than 2% of the CEOs among Fortune's list of the 500 largest U.S. companies by revenue (McGlauflin, 2023). One of the consequences of tokenism, however, is that a token member is often the target of increased stereotypical perceptions due to the low representation from that demographic group in the general population. Thus, because Black CEOs are relatively rare, they can be considered tokens and subject to strong negative stereotypical perceptions. Additionally, Gligor et al. (2021) also argue that the effects outlined in the glass cliff theory may also exacerbate the negative effects of Black CEO appointments. While originally developed in the context of female promotions (Cook & Glass, 2014; Ryan & Haslam, 2005), when applied to Black CEOs the glass cliff theory proposes that Black CEOs are chiefly appointed when firms are performing poorly or are in crisis. As a result, the appointment of a Black CEO can be interpreted by the capital markets as a negative signal about the future performance of the firm, leading to the firm experiencing a negative stock price reaction when it announces that it is appointing a Black CEO. Taken together, the stereotype-based racial discrimination combined with tokenism and glass cliff theory explanations lead Gligor et al. (2021) to hypothesize two main effects:
H1: Firms’ stock market reactions will be more negative to the announcements of Black CEO appointments than to announcements of White CEO appointments. H2: Firms’ stock market reactions will be more negative to the announcements of Black TMT appointments than to announcements of White TMT appointments.
In sharp contrast, Jeong et al. (2023), in their attempt to replicate the findings of Gligor et al. (2021), propose the “higher bar” theory to argue why we might expect a positive stock market reaction to Black CEO and TMT appointments. The “higher bar” theory argues that due to the subtle form of racial discrimination, Black executives face more rigorous talent standards in their careers than do their White counterparts and will therefore on average have performed better in the past than their White counterparts. This will result in a higher abnormal stock market reaction for firms that announce the appointment of a Black CEO than a White CEO because the stock market will infer that the Black CEO will achieve a higher level of performance for the appointing firm in the future. In addition, due to the heightened evaluative rigor facing Blacks, Black senior executives who are eligible to become a CEO will be in shorter supply than will their White counterparts, making the appointment of a Black CEO a visible, positive and credible reputational signal to the stock market that the firm is an equitable and inclusive organization that does not racially discriminate, leading to predicted superior firm performance (Miller & del Carmen Triana, 2009). In summary, Jeong et al. (2023) argue that the appointment of a Black CEO beneficially signals to the stock market that either (a) the firm's new CEO is exceptionally well qualified and/or (b) the firm values diversity, equity, and inclusion which should drive higher future performance due, in part, to reputational benefits. Using these theoretical perspectives, a firm that appoints a Black CEO should then be valued more, not less, highly. We state this formally as:
H3: Firms’ stock market reactions will be more positive to the announcements of Black CEO appointments than to announcements of White CEO appointments.
Given the diverging theoretical implications and empirical findings of Gligor et al. (2021) and Jeong et al. (2023), we believe there is material value in undertaking a further independent study of the stock price reactions to Black CEO and TMT appointments in order to reassess and increase our understanding of this prominent area of corporate strategy research.
Empirical analyses
Data and sample
To construct our sample, we attempted to our best ability to reproduce similar samples to those in Gligor et al. (2021), which reported a sample of 83 Black CEOs, and Jeong et al. (2023), which reported a sample of 57 Black CEOs. Both previous papers started with a wide media search in LexisNexis and Factiva for all CEO announcements and then identified Black CEOs within that set. In our approach, we began with a self-identified set of Black executives and added to that set from additional sources. The self-identified set of Black executive appointments came from Black Enterprise Magazine's Most Powerful Executives in Corporate America lists from issues published in 1993, 2000, 2005, 2009, 2012 and 2017. Established in 1970, Black Enterprise Magazine (BEM) is the most well-known and widely circulated business personal finance magazine aimed at Black entrepreneurs, professionals, and executives. A key BEM goal is to recognize and highlight successful Black businesses and executives. In this regard, BEM's editorial team compiles annual lists of the largest Black-owned firms in the United States, called the BE Top 100 List. BEM has also published books detailing the most important Black business leaders in U.S. History (Dingle, 1999). Through this work, BEM has become a trusted resource for information about Black executive leaders, making it our main source of self-identified top Black executives. The number of executives in the BEM list grew from 40 in 1993 to 300 in 2017. From these lists, we identified 22 Black CEOs and 101 Black top management executives across the entire observation period. In alignment with previous research, we define TMT executives as individuals in one of the following positions: Chief Operating Officer, Chief Financial Officer, President, or Executive Vice-President.
We added to our initial dataset from two additional resources. The first was a list of all 130 individuals in Boardex's Black Association Network, of which 26 we identified as Black CEOs, bringing our dataset up to 48 Black CEOs. Second, we compared our data with the data published in the appendix of Jeong et al. (2023), thereby identifying an additional 30 Black CEOs. Adding in these individuals brought us to a total of 78 Black CEOs. While we also wished to include additional Black CEOs and TMTs from Gligor et al. (2021), the authors of that study have chosen not to make their data publicly available, despite repeated requests to do so.
For each Black CEO and TMT in our dataset, we created a unique executive/firm/position triad that we refer to as a feasible Black executive appointment. We then searched Factiva for the earliest announcement of each feasible Black executive appointment and if one was found, we defined the date of the announcement as event day [0], unless the time stamp on the Factiva story was on or after 4:00 p.m. EST in which case event day [0] is taken to be the next trading day. Using the hypothetical executive/firm/position triad Darryl C. Smith appointed to be CFO of Quality Enterprises, Inc. as the example, the criteria we used in our Factiva searching was of the form [Smith and “Quality Enterprises”], with the only restrictions being Date Range = 01/01/2000 to 12/31/2017 and Language = English. We found an announcement for 179 feasible Black executive appointments (for CEOs and TMT executives). Of the 179 announcements, 78 were for CEOs and 101 were for TMT executives. We coded an announcement as “clean” if it only contained information about the Black executive's appointment, and “confounded” if it contained firm-specific news beyond that of his or her appointment. We found that 92 announcements were clean and 87 were confounded.
Following the standards established in previous research with regard to assessing the stock market reaction to the announcements of the appointments of Black executives, we also collected a matched sample of White CEOs for comparison against our sample of Black CEOs. We started with the 57 matched White CEO announcements from Jeong et al. (2023). To find matched White CEOs for the remaining 21 Black CEO announcements in our dataset, we then searched Dow Jones Newswires using RavenPack. We selected news flashes (news_type = “NEWS-FLASH”) for executive appointments (category = “executive-appointment”) from U.S. companies (country_code = “US”) where the executive is identified as the CEO (position_name = “Chief Executive Officer”). We identified the CEO name and company from the event_text field and manually searched via Google and LinkedIn to identify their gender. We matched a row from this data to each of the 21 Black executive announcements as long as the White CEO announcement was not already in our sample. We first matched on gender and then on the year of the executive announcement 1 . For the Black CEO and potential matches, we collected Compustat information from the most recent fiscal year, including the fiscal year end market value of equity.
We then sorted the full set of potential matches by the absolute difference in equity market capitalization for the firm at the most recent fiscal year end prior to the announcement. We keep the observation with the smallest absolute difference in market capitalization between the Black CEO observation and the potential match as long as the match is not already in the matched data set and the data was available on Compustat and CRSP had the measured needed to calculate the variables for the regression tests. We iteratively proceeded until all Black CEOs had a corresponding matched White CEO. We also required that all CEO and TMT appointments had sufficient data to calculate abnormal announcement returns. For the observations which were missing certain financial data measures in Compustat and CRSP for the regression tests (four observations), we set those variables equal to the mean of the sample. Firm-level fiscal-year financial data was collected from Compustat, stock return data from CRSP, and risk factors from the Fama & French 3 and 5 factor plus momentum data sets. To identify executive characteristics, we searched LinkedIn and Google. Table 1 displays the descriptive statistics for the firms in our Black/White CEO matched sample (n = 156) as well as our Black TMT sample (n = 101). Full details about the Black CEOs, matched White CEOs, and Black TMT executives in our dataset, including their titles and appointment announcement dates, are provided in Appendix A.
Descriptive statistics for Black and matched White CEO and Black top management team (TMT) executives
RMSE: root mean squared error.
Variables employed
CEO race
In alignment with previously published papers on this topic, we focused our study on Black CEOs and Black top management executives. The executives listed in the Black Enterprise Magazine were all coded as Black based on their inclusion in the publication. Each individual in the Boardex listing was coded by one of the coauthors of this study as Black or Not-Black based on a careful visual assessment of a publicly available photo. We also enlisted a research assistant to find self-reported race information for individuals in our BoardEx sample and located self-reported data for 24 of the 26 Black CEOs in the BoardEx dataset.
Moderator and control variables
Following Gligor et al. (2021) and Jeong et al. (2023), in our multivariate empirical analysis, we included several control and moderator CEO-announcement variables: CEO Age measured as the age of the at the time of appointment; Female CEO coded as 1 for all female CEO appointments and zero otherwise; Industry Insider coded as 1 if the appointed CEO has previously worked in a different company in the same industry; Previous Experience as CEO an indicator variable coded as 1 if the appointed CEO had any previous experience as a CEO; Former CEO Resigned, an indicator variable coded as 1 if the previous CEO resigned; and Inside CEO, an indicator variable coded as 1 if the appointed CEO was previously employed by the same company. For economic breadth, we also included the following firm-level variables: Enterprise market-to-book, calculated as the market value of the firm's equity plus total liabilities divided by total assets from the most recent fiscal year; Firm size, calculated as the natural log value of the firm's total assets from the most recent fiscal year end; Institutional ownership percentage, calculated as the total percentage of total firm shares that are held by institutional owners; Return on sales, calculated as the net income of the firm divided by total revenues from the most recent fiscal year and winsorized at the 1st and 99th percentiles due to a few very large outliers.
Following Gligor et al. (2021) and Jeong et al. (2023), we further included the following return-related variables: The market model Beta and root mean squared error (RMSE), calculated using daily returns for the year ending one month before the executive announcement. Using the same methodology, we calculated several measures of unexpected returns: market-adjusted returns using the daily return minus the value-weighted CRSP return index, a four-factor model using the Fama-French three-factor plus momentum factors (FF 3 + mom), and a six-factor model using the Fama-French five-factor plus momentum factors (FF 5 + mom). Lastly, we created the variable Prior year annual returns, calculated as a natural log of (1 + the 12-month return of a firm's stock ending 30 days prior to the CEO announcement).
Empirical methods applied
For each firm and each 3-trading day event window centered on the executive appointment announcement date [0], we calculated the 3-day [–1, +1] cumulative abnormal stock returns CAR [–1, +1] as the sum of the daily abnormal returns where each daily abnormal return is calculated as the actual observed daily return minus the expected return from the market model or one of the alternative models. In alignment with Gligor et al. (2021) and Jeong et al. (2023), we study the market reactions of the announcement of Black CEOs, per se and as compared to the reactions to matched White CEOs, using standard univariate event study and multivariate regression analyses. In alignment with the approach in Gligor et al. (2021), for Black TMT executive appointments we only conducted a standard event study and did not undertake matched-sample or multivariate regression analyses.
Results
Market reactions to Black CEOs
Our univariate event study results begin in Table 2 panel A that reports one-sample t-tests for the mean 3-day CAR [-1, +1] for Black and White CEO appointment announcements using four separate measures of abnormal stock returns. 2 Of the 78 Black CEO announcements in the sample, 25 were contaminated while only 14 of the 78 White CEO announcements were contaminated. For Black CEOs, we find a positive mean CAR [–1, +1] of between 3.3% and 4.7% (p-values between .02 and .04) depending on the measure of abnormal returns used and whether the announcement is clean or contaminated. The sign, magnitude, and p-value of our results for Black CEOs support Hypothesis 3, and are consistent with Jeong et al. (2023), who reported a large 3.1% mean CAR [–1, +1] (p-value = .07). Our results do not support Hypothesis 1, and strongly differ from Gligor et al. (2021) who report a large −4.3% mean CAR [–1, +1] for Black CEO appointment announcements (p-value = .01). For our matched White CEOs, similar to the results found by Jeong et al. (2023) we observe small mean CAR [–1, +1] of between −0.9% and 0.4% (p-values between .24 and .59). Two-sample tests on the differences in the mean CAR [–1, +1] across our matched set of 78 Black and White CEOs per Table 2 panel B confirm that the mean CAR [–1, +1] for Black CEO appointment announcements is reliably larger than the mean CAR [–1, +1] for White CEO appointment announcements (p-values between .02 and .05).
Univariate tests of CAR [−1, +1] for matched sets Black and White chief executive officer appointment announcements
Of key importance in our paper, panel C contains the results of our analyzing two alternative measures of central tendency, the median CAR [–1, +1] and the ratio of positive to negative CAR [–1, +1]. We undertake this analysis because the magnitude and p-value of a mean stock price reaction have the potential to lead to fragile and/or misleading inferences about the central tendency of the distribution of individual CAR [–1, +1], as well as inferences that support or reject the predictions of theories that underlie the phenomena being studied (McWilliams & Siegel, 1997). We propose that for an empirical finding having to do with stock price reactions and its associated explanatory theory to be robust, it should be the case that multiple measures of the central tendency of the CAR [–1, +1] all yield the same inference, particularly for a topic that is as socially prominent and relevant to academic and management audiences as the appointments of Black CEOs. What we find, however, is that in sharp contrast to the sizes and p-values of the mean CAR [–1, +1] in panel A, the median stock price reactions to the announcements of both Black and White CEO appointments reported in panel C are close to zero in magnitude and have large p-values: 1.0% for all Black CEO announcements (p-value = .17), 1.0% for clean Black CEO announcements (p-value = .14), 0.0% for all White CEO announcements (p-value = .50), and 0.0% for clean White CEO announcements (p-value > .99). 3
In Table 3 we report the results of the two approaches we take to understanding why our mean CAR [–1, +1] results might yield different inferences from median CAR [–1, +1], namely identifying the outliers, data points that deviate significantly from other data in the sample (Aguinis et al., 2013) that might cause the different inferences between mean and median CAR [–1, +1]. Gligor et al. (2021) make no mention of the presence or effects of any outliers on their results. Jeong et al. (2023) do recognize this possibility and address the potentially distortive effects of outliers by winsorizing the four most positive CAR [–1, +1] in their sample at the level of the largest 1% of CAR [−1, +1]. Based on their reported data, Jeong et al. (2023) winsorized their four most positive CAR [–1, +1] of 69.2%, 34.1%, 28.0%, and 27.9% down to 24.0%. In this winsorized sample, Jeong et al. (2023) found a 2.0% mean CAR [–1, +1] for all announcements (p-value = .09) and a 2.7% (p-value = .01) mean CAR [–1, +1] for the winsorized sample that excluded confounding events. The extreme CAR [−1, +1] values in the Jeong et al. (2023) sample were treated as prediction outliers that might be affecting the parameter estimates of their model (Aguinis et al., 2013). However, after winsorizing highly positive outliers, it did not change their inference that the mean CAR [–1, +1] is positive.
Univariate tests for matched sets of Black and White chief executive officer appointment announcements of CAR [−1, +1] for CEOs using alternative approaches
We used two approaches to understand and manage the outliers in our CEO dataset. First, following Jeong et al. (2023) we winsorized the most extreme values at the level of 1% of CAR [−1, + 1] on either side of the distribution. The most extreme CAR [−1, +1] for Black CEOs are all positive: 69.9%, 52.2%, 33.1%, 28.2%, 26.5%, 25.4%, and 24.5%. These were windsorized to 24.5%. In contrast, the most extreme CAR [−1, + 1] for White CEOs were both negative: −42.3% and −18.9%, which we winsorized to −18.9%. Our winsorized results, shown in columns 1–3 of Table 3, align with Jeong et al. (2023) in that we find a positive CAR [−1, +1] for Black CEOs, namely 2.4% (p-value = .02) for all Black CEO appointment announcements and 3.1% (p-value = .01) for clean Black CEO appointment announcements. For White CEOs, winsorizing does not materially change the small size and high p-value of the mean CAR [−1, +1].
Our second approach to managing the outliers in our sample aligns with the argument that outliers can contain “valuable or unexpected knowledge” (Aguinis et al., 2013, p. 275). Thus, we analyzed the outliers to see if we could better determine the nature of these outliers for the purpose of developing new theoretical propositions (Gibbert et al., 2021). Upon close inspection, we discovered that all the extreme positive CAR [−1, +1] outliers for Black CEOs occurred with nano-caps, that is, firms with a market capitalization of approximately $50 million or less. This is notable because, due to a number of market factors, it is not uncommon for short-term stock returns for nano-cap firms to move in large magnitudes as compared to large-cap stocks (see discussion section for more details). As such, in our second approach, we assessed the impact of Black CEO appointment on CAR [−1, +1] of our sample with all nano-caps removed. The total number of nano-caps in the sample was 13, eight of which were Black CEOs. Thus, the sample of Black CEO announcements for this analysis was 70 total observations with 24 contaminated observations. The sample consists of 73 White CEO announcements, 14 of which were contaminated announcements. Shown in columns 4–6 of Table 3, the results of deleting nano-caps are that the mean CAR [−1, +1] for all Black CEO appointment announcements is 1.5% (p-value = .19) while the mean CAR [−1, +1] for only clean Black CEO appointment announcements is 2.5% (p-value = .01).
Taking the results in Table 3 in their totality, we arrive at two conclusions. First, neither winsorizing nor deleting nano-caps yields any evidence that the mean CAR [−1, +1] for Black CEO appointment announcements is negative (e.g., that discrimination is an explanatory mechanism for market returns for Black CEO appointment). Second, from a statistical point of view, three of the four mean CAR [−1, +1] in Table 3 are positive with small p-values. We therefore conclude that our dataset fails to provide support for Hypothesis 1, while offering partial support for Hypothesis 3. At the same time, however, we caution that the lack of consistency in the support for the higher bar theory that undergirds Hypothesis 3, seen in the small magnitude/high p-value median CAR [−1, +1] reported in Table 2 and the small magnitude/high p-value mean CAR [−1, +1] for all Black CEO appointment announcements after deleting nano-cap stocks, suggests that the higher bar theory might apply primarily to a subset of Black CEOs that are appointed at smaller market cap firms and not to all Black CEOs uniformly. In addition, the magnitudes of the extreme positive CAR [−1, +1] for Black CEOs are so large as to raise the likelihood that they are driven by factors other than those underlying the higher bar theory.
Market reactions to Black TMT executives
In Table 4 we extend our analysis beyond CEOs to measure the stock price reactions to the announcements of Black TMTs. Gligor et al. (2021) reported a large negative −3.0% mean CAR [–1, +1] for all announcements (p-value = .02). Moreover, while not reported by Gligor et al. (2021), it can be inferred from the fraction of positive to negative CAR [–1, +1] that they report that the median CAR [–1, +1] is also negative (z-statistic = –1.9, p-value = .05).
Univariate tests of CAR [−1, +1] for Black top management team (TMT) executives
Our analysis yields no evidence to support Hypothesis 2, running counter to the results presented in Gligor et al. (2021). For our set of Black TMTs (n = 101; 62 contaminated announcements), we find mean CAR [–1, +1] of just 0.3% (p-value = .47) for all announcements and 0.2% (p-value = .66) for announcements that exclude confounding events. We also find no evidence of nonzero effects for median CAR [–1, +1] in that median CAR [–1, +1] are 0.0% for all Black TMT announcements (p-value = .14) and 0.0% for clean Black TMT announcements (p-value = .87). However, we cautiously note that the effects of racial bias and/or higher bar perceptions within the market may not be detected for non-CEO TMT appointments since shareholder value is far more closely linked in sign and magnitude to the actions and decisions of a firm's CEO than any one TMT executive (Finkelstein et al., 2008).
Multivariate analyses
We conducted a multivariate analysis of the individual mean CAR [–1, +1] to evaluate the proposition that the magnitudes of the extremely positive CAR [−1, +1] found for Black CEOs are so large as to raise the possibility that they are driven by factors other than those in the higher bar theory. In particular, because the glass cliff component of the racial bias theory proposes that Black CEOs are more likely to be appointed after poor recent firm performance, we include the prior year’s annual return variable to control for this factor.
The approach we take is to first apply the multivariate structure found in Gligor et al. (2021) and Jeong et al. (2023) to our combined set of 78 matched Black and 78 White CEOs. Table 5 provides a correlation matrix of the control variables used in previous papers, CAR [–1, +1] measured in alternative ways, and the firm's prior year annual return.
Correlations and descriptive statistics for the Black and White CEO matched sample (N = 156)
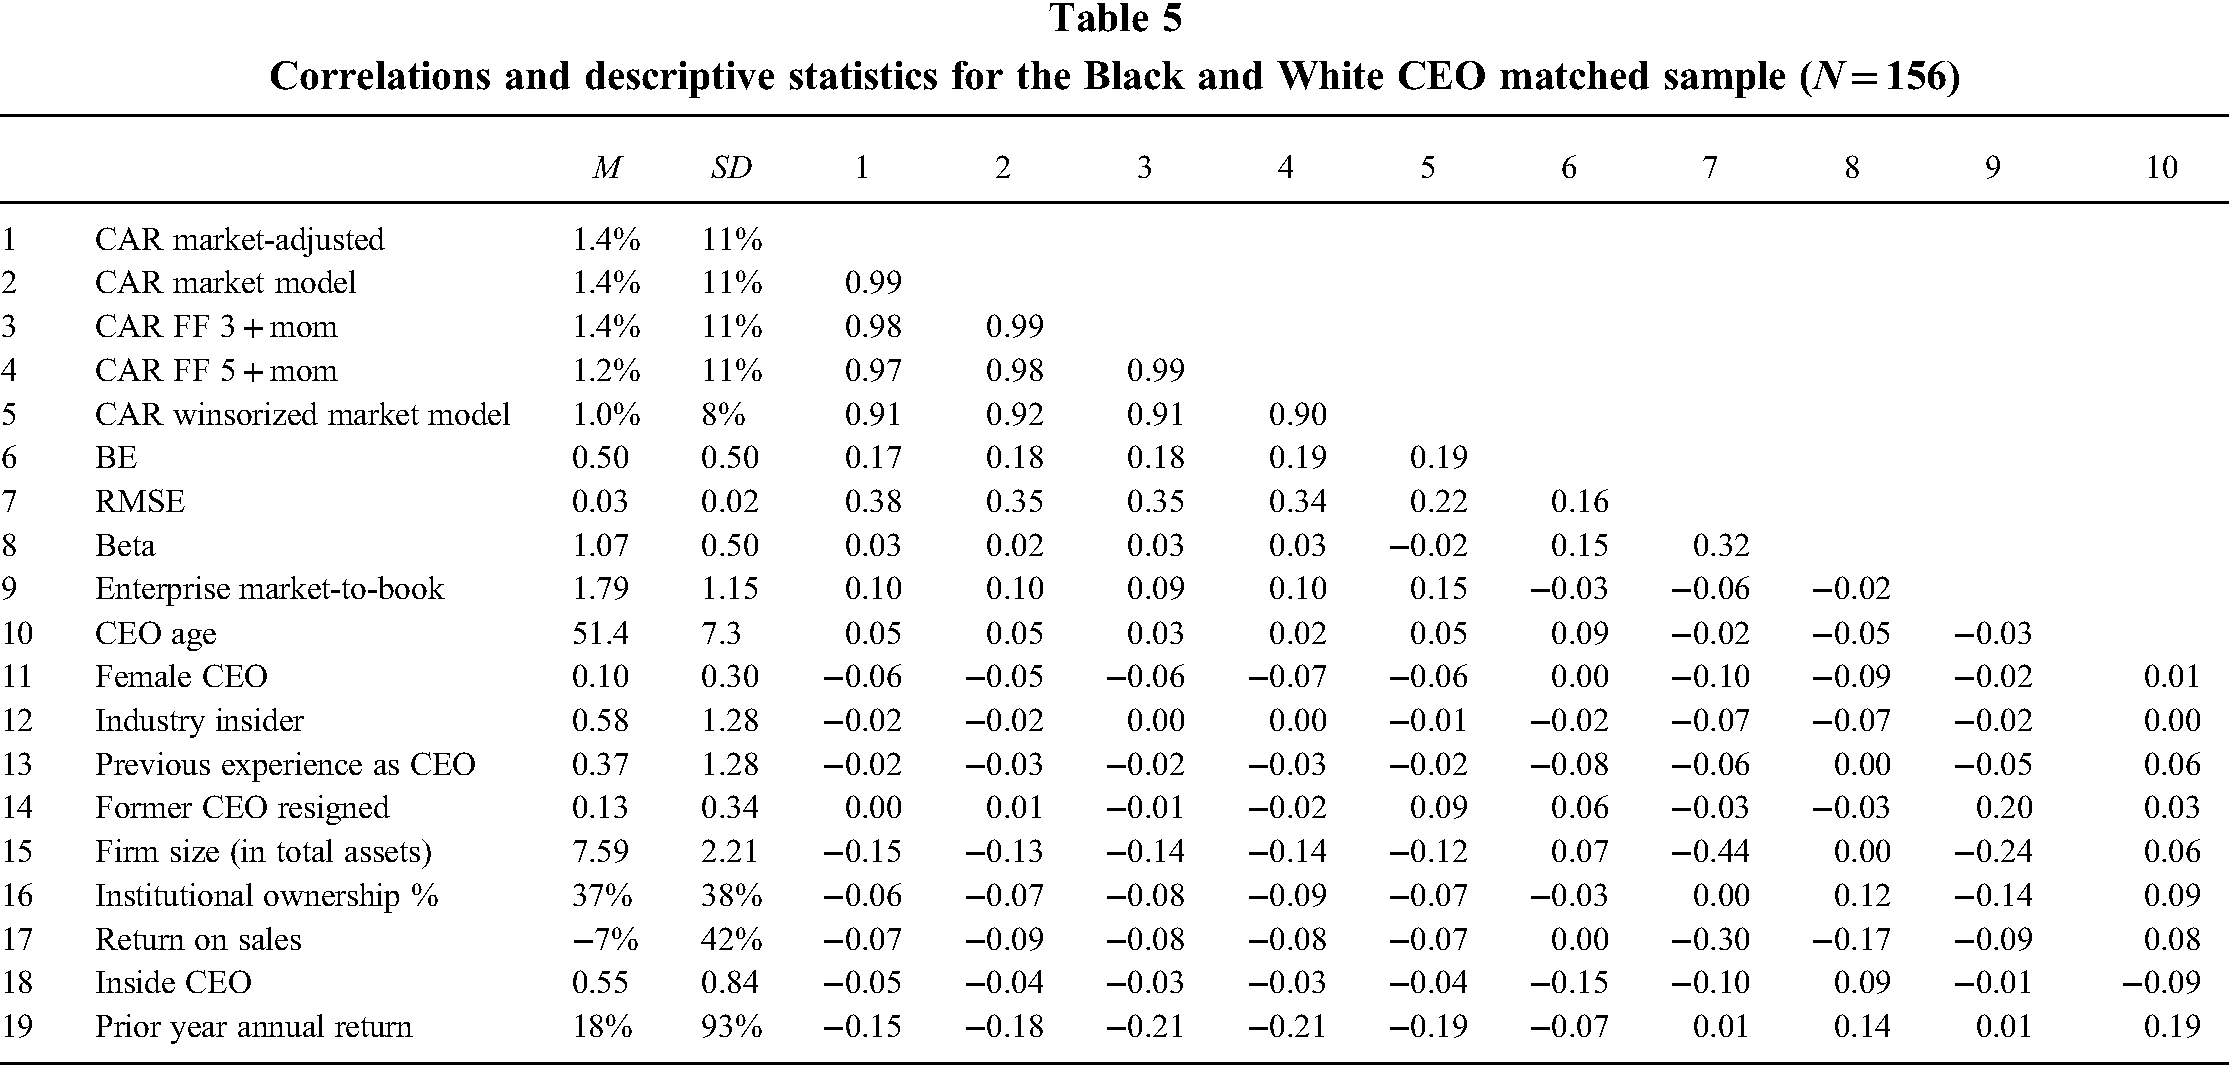
Table 5 shows that the alternative measures of CAR [–1, +1] are all highly correlated (> 0.9), and that the 1/0 binary Black CEO appointment measure, Black CEO, is positively correlated with them. Black CEO is also positively correlated with RMSE and Beta, suggesting that the firms which appoint Black CEOs in our sample differ from the firms that appoint White CEOs, consistent with the argument made by Gligor et al. (2021). Consistent with the glass cliff component of the racial bias theory, Black CEO is negatively correlated with prior year’s annual return, indicating that firms that have experienced recent poor performance are more likely to hire a Black CEO.
Table 6 presents the regression results. In Model 1, which is limited to the control variables applied in both previously published papers, RMSE is the only regression coefficient with a small p-value, indicating that firms with more volatility in their stock returns leading up to the announcement of a new CEO see a larger increase in their stock price at the announcement than do less volatile firms, likely because the stock market expects the new CEO to lower the uncertainties that are creating the higher stock return volatility. However, when we include the Black CEO indicator variable in Model 2, its estimated coefficient is 2.8% (p-value = .11), differing from the reliably negative coefficient on Black CEO found by Gligor et al. (2021). Lastly, in Model 3 we include the prior year’s annual return measure and find that its estimated coefficient is negative while the estimated coefficient on Black CEO is 2.3% (p-value = .20). Overall, the results of our multivariate analyses do not support either Hypothesis 1 (stereotype-based discrimination) or Hypothesis 3 (higher bar).
OLS regressions predicting CAR [−1, + 1] using the Black and White CEO-matched sample
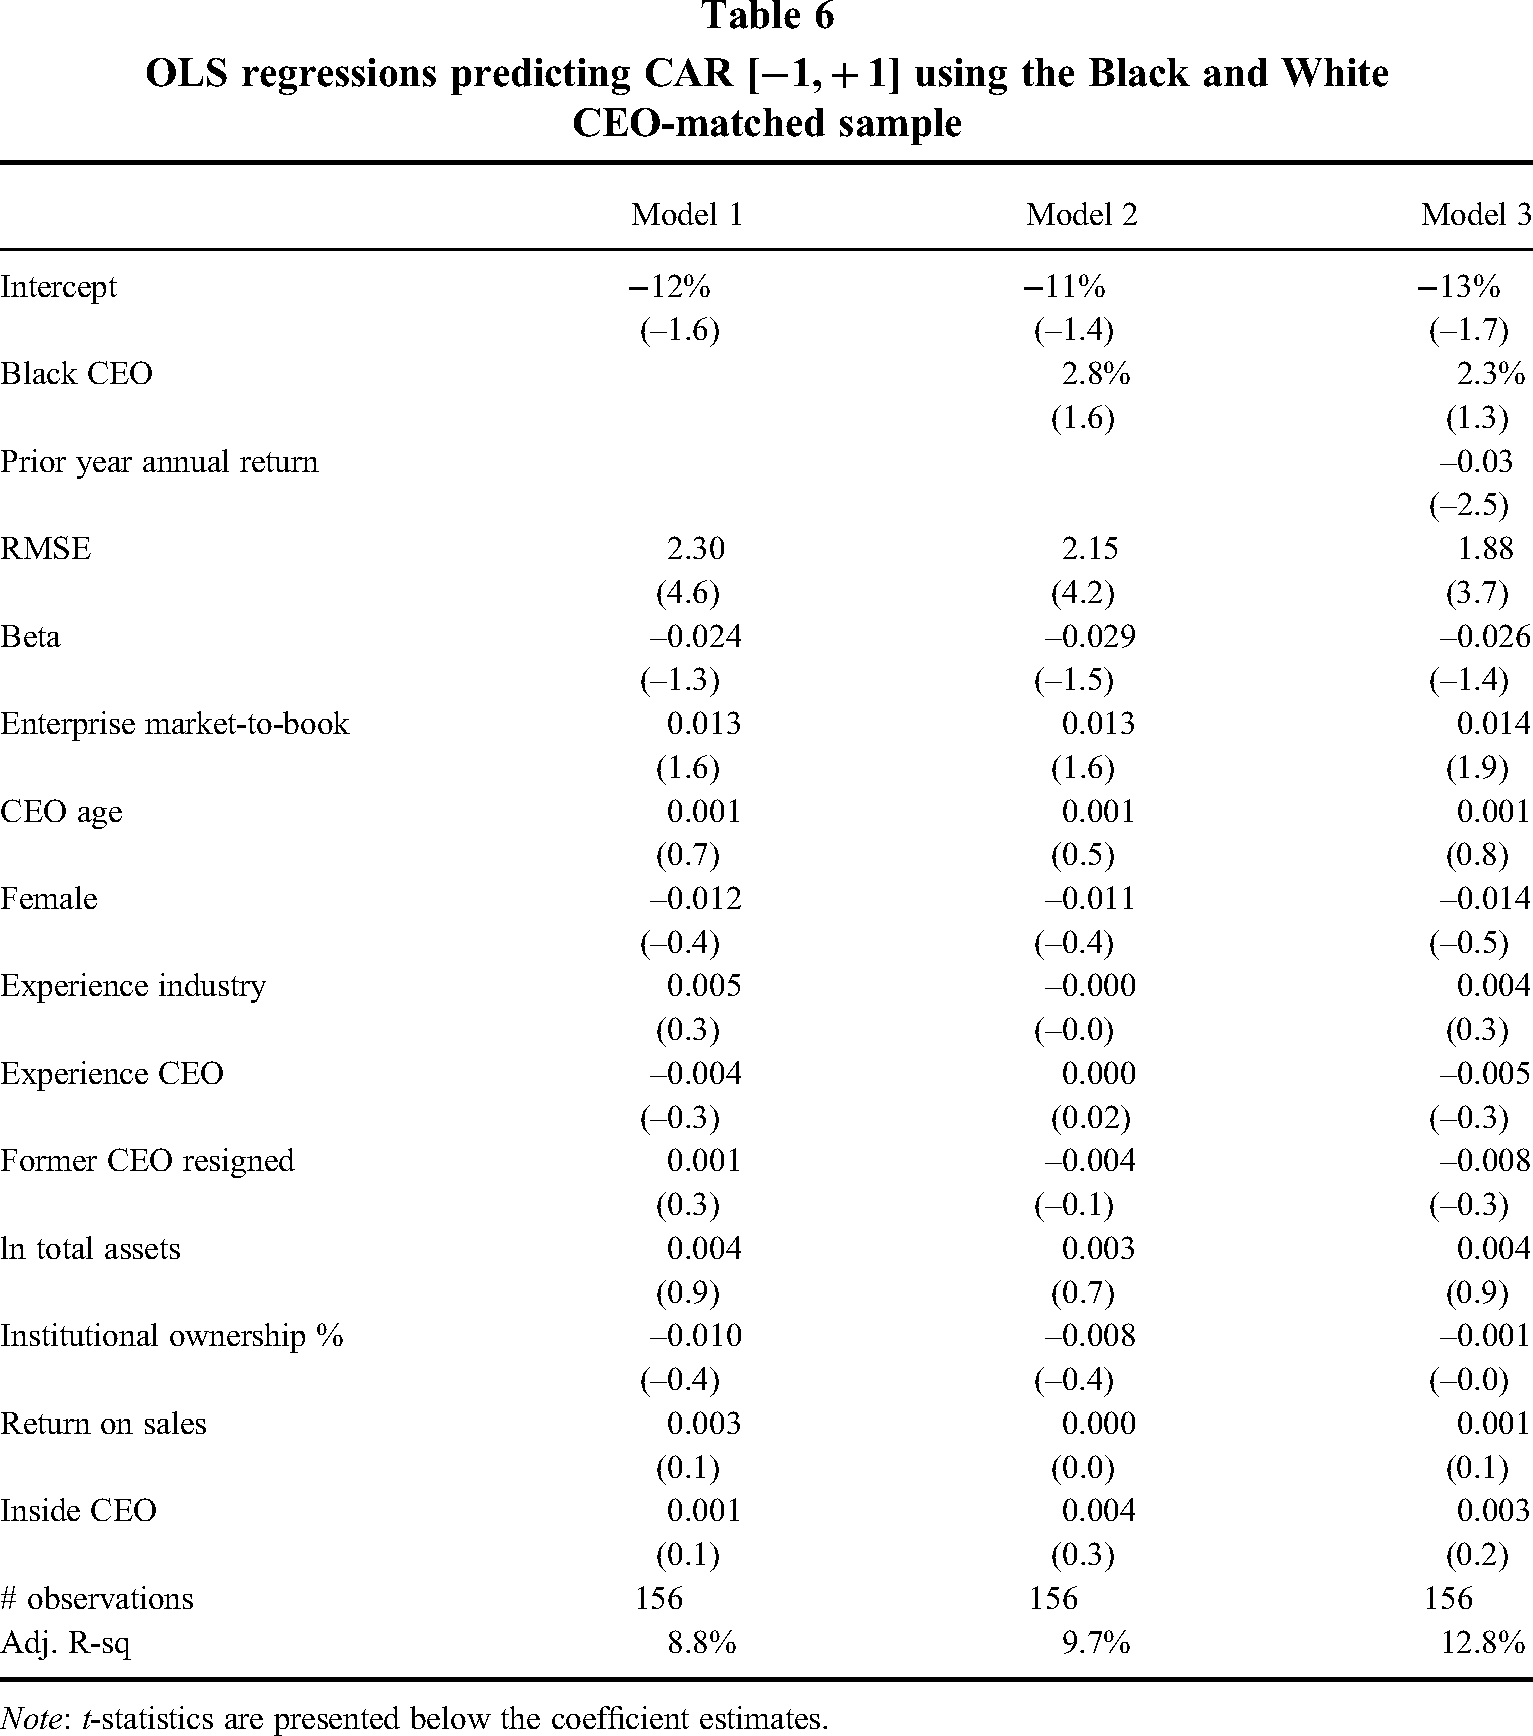
Note: t-statistics are presented below the coefficient estimates.
Addressing sample selection concerns
One potential concern in our analysis is that appointing a Black CEO is not randomly assigned in that appointments of Black CEOs may systematically differ from appointments of White CEOs. For example, Table 6 shows that poor recent firm performance is reliably negatively related to CAR [−1, +1]. We seek to address the potential for sample selection bias affecting our results by conducting an instrumental variable regression, a standard method in organizational research that aims to create unbiased regression coefficient estimates (Semadeni et al., 2014). We address the problem of using a binary endogenous variable in the first stage followed by a continuous variable in the second stage (Wooldridge, 2010) following Adams et al. (2009). Specifically, we use the three-stage approach with a probit model in the first stage that models the determinants of Black CEO including instrumental variables, a least squares linear regression in the second stage that regresses Black CEO on the fitted value from the first stage and other control variables, followed by the third stage ordinary least squares regression that regresses CAR on the fitted Black CEO from the second stage and control variables. As instruments we include variables that we propose may affect the appointment of Black versus White CEOs and not the residuals in the CAR regression (Wolfolds & Siegel, 2019). However, we caution that identifying variables that are exogenous to the system is challenging and that we may not have successfully identified valid instruments. The first instrumental variable we use is the nationality mix on the firm's Board of Directors, which was collected from BoardEx. Based on the finding that board demographics affect CEO hiring decisions (Zajac & Westphal, 1996), we expect more diverse boards to be more likely to hire a Black CEO. However, because CEOs make the day-to-day decisions for the company, we do not expect the board nationality mix to be associated with the announcement CAR. Next, we include whether the prior CEO resigned. We expect that the resignation of the prior CEO will give boards more influence over the CEO’s hiring decision. Lastly, we use the firm's industry (per one-digit Standard Industrial Classification SIC codes) because the pool of available Black CEO candidates may differ by industry (Cook & Glass, 2014).
Table 7 Panel A presents the results from the first stage probit model of the determinants of Black CEOs. The three instruments are individually statistically weak with low z-values. However, the coefficient magnitudes suggest a meaningful effect on the probability of hiring a Black CEO. For example, for an observation with median values of all other variables, going from the lowest to the highest value of nationality mix increases the probability of hiring a Black CEO from less than 1% to 54% and being in the industry code “2” increases the probability of hiring a Black CEO from less than 1% to 59%. RMSE and total assets also have a strong association with hiring a Black CEO. Panel B presents the linear regression using the fitted Black CEO value from the second step. The test for instrument strength rejects the weak instruments’ assumption (p-value < .01). We did not test for overidentification because there is only a single instrumental variable in the IV regression step, thus making the model “just-identified” and a test for overidentification is not warranted (Sargan, 1958). In Panel B, the coefficient on Black CEO is small (−0.03, p-value = .65). Thus, and in a manner consistent with the ordinary regression results in Table 6, applying an instrumental variables approach also yields results that do not support Hypothesis 1 (stereotype-based discrimination) nor Hypothesis 3 (higher bar).
Instrumental variable regression predicting CAR [−1, +1] using the Black and White CEO matched sample
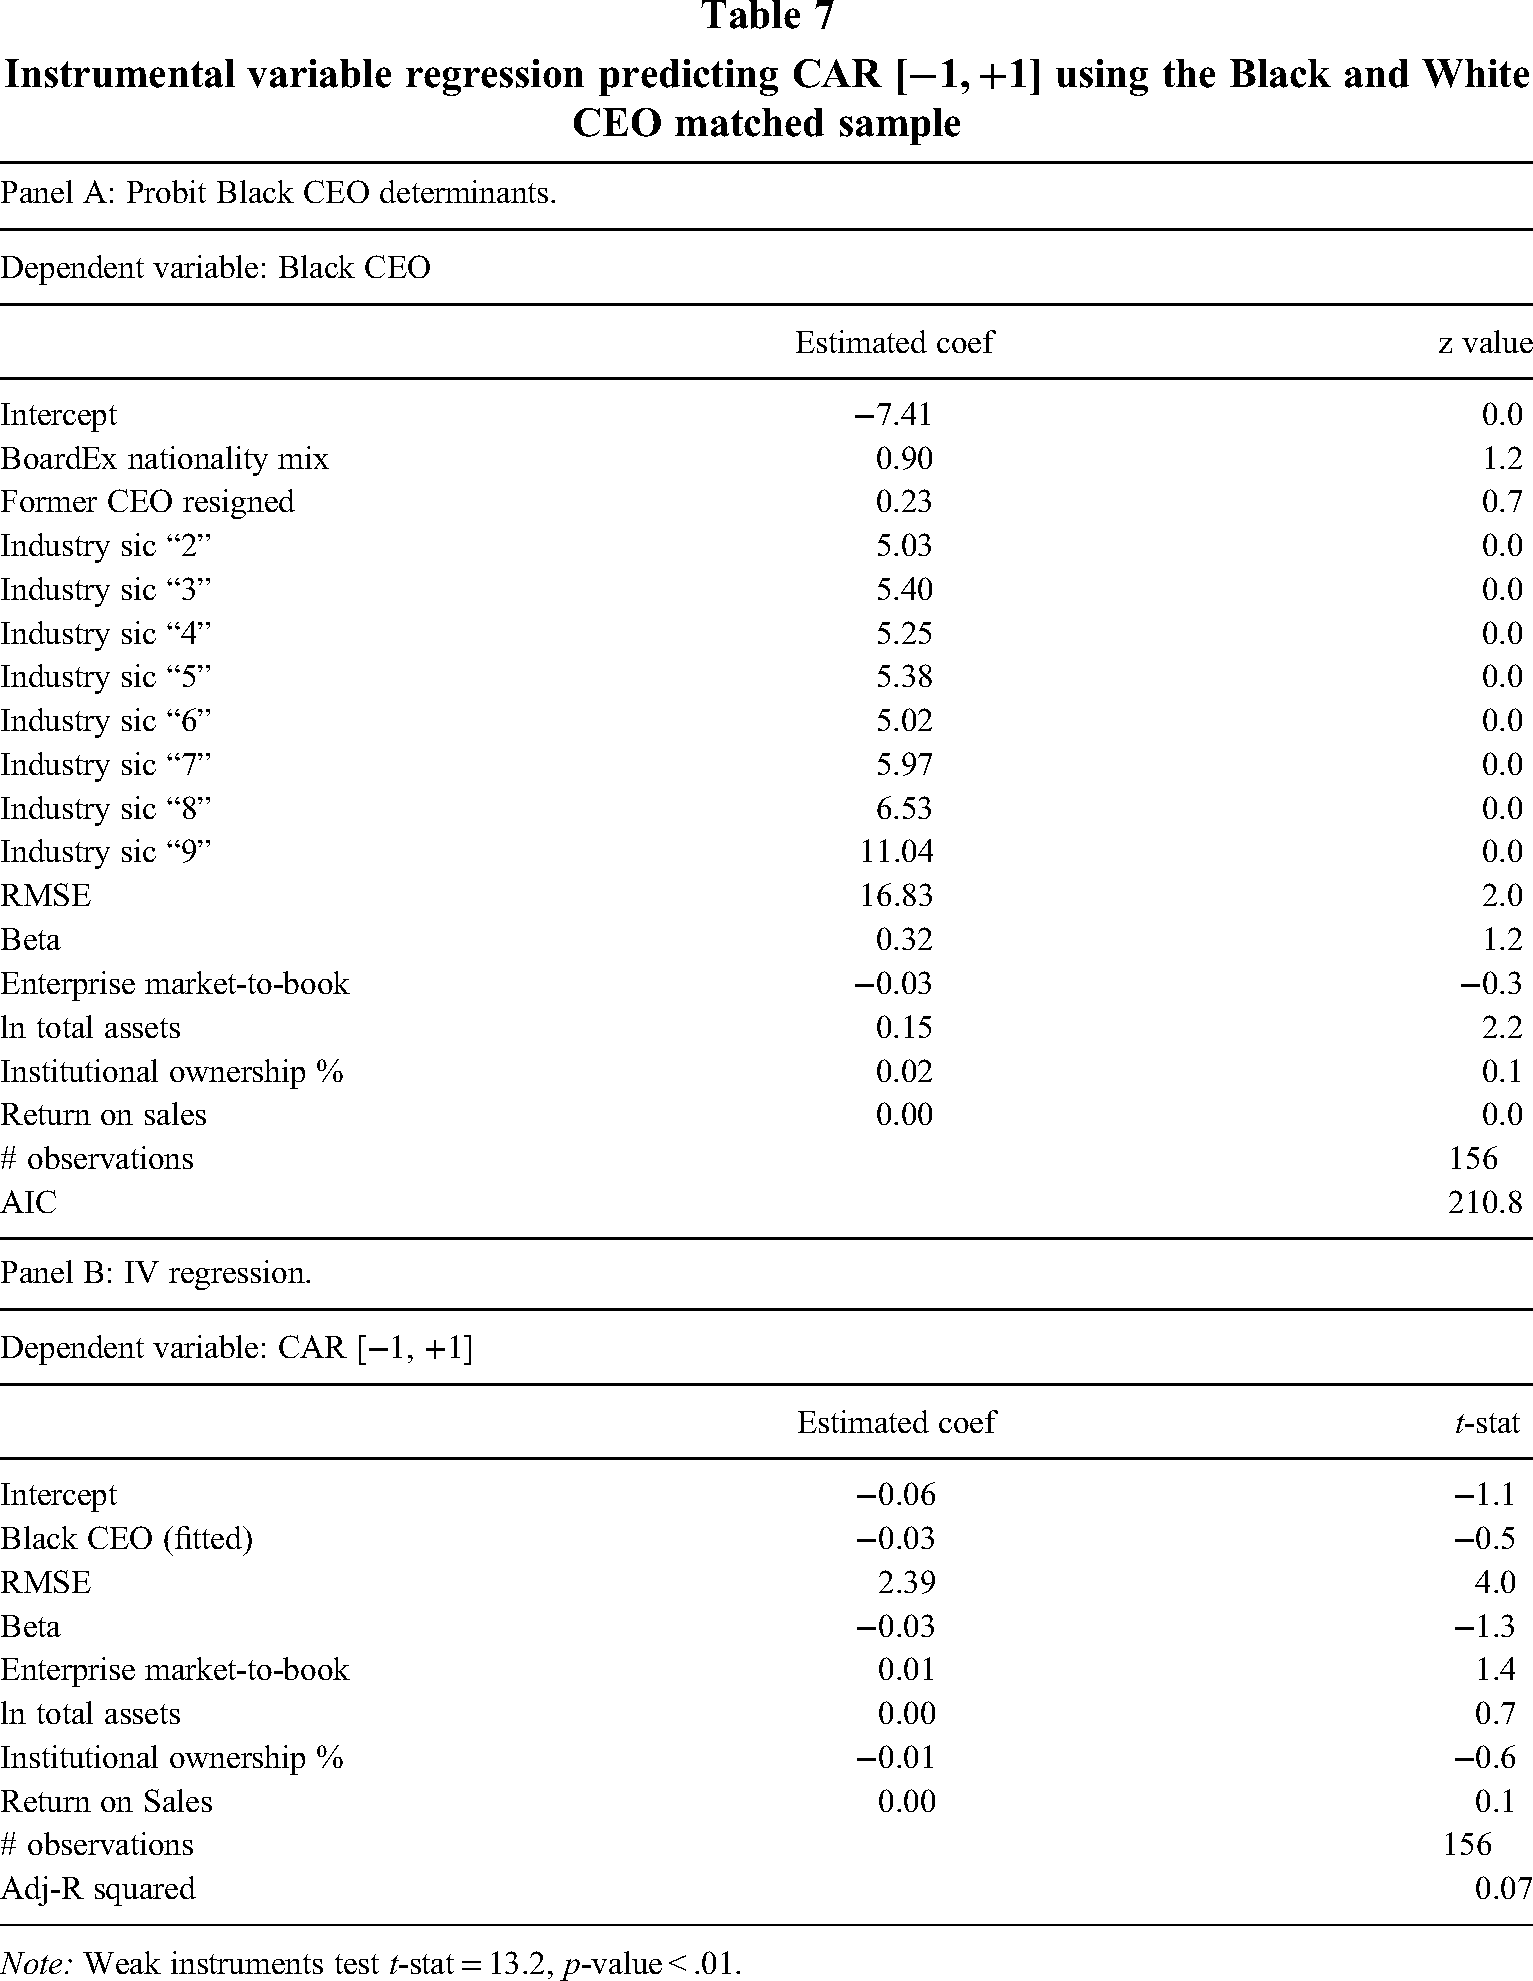
Note: Weak instruments test t-stat = 13.2, p-value < .01.
Discussion and conclusions
In this article, we have conducted a quasi-replication of two recent studies that present conflicting results about the stock market reactions to the announcements of Black CEO and TMT appointments and make sharply different inferences about the underlying causal drivers. On the one hand, Gligor et al. (2021) report large negative −4.3% and −3.0% mean 3-day CAR [–1, +1] for Black CEOs and TMTs, from which they conclude that shareholders can develop biased performance expectations for firms, depending on the race of their newly appointed executives, and that their findings serve to raise further awareness regarding the undesirable consequences associated with racial discrimination. On the other hand, Jeong et al. (2023) find a large positive 3.1% mean CAR [–1, +1] for Black CEOs, leading them to report their results as evidence that any racial bias in the stock market is outweighed by the effects of the “higher bar” theory which proposes that investors may deem Black CEOs and TMTs especially talented for having outperformed to such an extent as to be appointed to the level of CEO or TMT.
In light of the conflicting empirical results and theoretical conclusions of these two prior studies, we conducted a quasi-replication analysis on an independently collected dataset of a matched sample of 78 Black and White CEOs, and 101 Black TMTs, all appointed between 2000 and 2020. In doing so, we found a positive mean CAR [–1, +1] for Black CEO announcements, lending support to the “higher bar” theory proposed by Jeong et al. (2023). We did not find any evidence of racial stereotype discrimination of the kind proposed by Gligor et al. (2021). However, running counter to the negative mean CAR [–1, +1] reported by Gligor et al. (2021) for Black TMT appointments, we found effectively zero mean and median CAR [–1, +1] for our sample of Black TMTs.
Our analysis demonstrates a lack of robustness in the inferences made by Gligor et al. (2021) and Jeong et al. (2023) as to the central tendency of stock price reactions to the announcements of Black executive appointments. Indeed, based on data reported in their studies, the median CAR [–1, +1] for Black CEOs is also not reliably different from zero in the datasets of Gligor et al. (2021) and Jeong et al. (2023). After close inspection, we found that all of the positive outliers in the dataset were from a small number of nano-cap stocks. We believe that these nano-cap stocks play a key role in the size and p-value of the mean CAR [–1, +1]. It seems unlikely, however, that these extremely positive nano-cap stock price reactions are explained by racial discrimination or higher bar theorizing, given the general volatility of nano-cap stocks where double and triple-digit short-term returns are not uncommon (Eraker & Ready, 2015; Zaremba, 2015). Research on financial markets suggests a number of factors for this volatility. Nano-caps have a high real rate of being delisted (Macey et al., 2008), are often the target of pump-and-dump schemes (Allen & Gale, 1992), have very low trading liquidity (Jiang et al., 2016), are not as tightly regulated as larger cap stocks (Cumming & Johan, 2013), and present very high bid-ask spreads because of extreme information asymmetry between managers and investors (Luft & Levine, 2004). Any of these factors could be moderating the effect between CEO race and stock market reaction which can serve as the inspiration for new potential future directions of research in this area.
Finally, we found immaterial effects for Black CEOs using multivariate regression analysis of the individual CAR [–1, +1] in our matched Black and White CEO dataset. We also failed to find material effects for Black CEOs when we included prior year stock performance in the regression estimation (a control variable that was not used in previous papers). In this regard, our multivariate regression findings are inconsistent with both the higher talent bar and racial stereotype discrimination theories, and instead align more closely with the conclusions of the broader research into the stock market reactions to CEO succession events (Friedman & Singh, 1989)—namely that markets generally react negatively to strong performing firms that appoint a new CEO, and that this effect occurs for both White and Black CEOs.
The totality of our findings leads us to conclude that conventional mean stock price reactions on their own are not robust indicators when testing theories about how markets interpret executive leadership demographics. These theories include the idea that investors are racially biased against Black CEOs and TMTs (Gligor et al., 2021), either per se or for glass cliff reasons; the theory that investors believe Black CEOs exhibit exceptional attributes (Jeong et al., 2023); and the argument that the appointment of a Black CEO a visible, positive and credible reputational signal to the stock market that the firm is an equitable and inclusive organization that does not racially discriminate, thereby leading to predicted superior firm performance.
Stock market participants place a strong significance on the importance that a CEO has regarding the value of the firm (Quigley et al., 2017). In light of the increased dialogue in the academic and corporate arenas around the causes and consequences of executive and employee racial and ethnic diversity (Andrevski et al., 2014; Smulowitz et al., 2019), corporate boards (Westphal & Milton, 2000), and how academia has investigated these topics (Roberson, 2019), the results of our paper lead us to recommend that future research in the area of Black top executives be suitably cautious when presenting and interpreting its results. In particular, we propose that a robust empirical analysis of the stock price reactions pertaining to announcements pertaining to CEOs and their characteristics should include multiple measures of the central tendency of the CAR [–1, +1] and demonstrate that they all yield the same inference. This kind of approach would seem to be particularly appropriate for topics that are as socially prominent and relevant to academic and management audiences as the appointments of Black CEOs. Such steps seem promising avenues to pursue in the goal of achieving a greater understanding of how and why capital markets react to CEO demographic characteristics.
Footnotes
Data availability
Data are available from the sources cited in the text
Declaration of conflicting interests
The authors declared no potential conflicts of interest with respect to the research, authorship, and/or publication of this article.
Funding
The authors received no financial support for the research, authorship, and/or publication of this article.
Notes
Executive appointment announcements used in this study.
| First | Last | Company | AnnDate | gvkey | permno | ExecType | BE | Confounded | Interim | Female |
|---|---|---|---|---|---|---|---|---|---|---|
| John | Agwunobi | Herbalife Nutrition | 10/29/2019 | 14269 | 90516 | CEO | 1 | 0 | 0 | 0 |
| Victor | Alston | Ixia | 3/19/2012 | 140759 | 88750 | CEO | 1 | 0 | 0 | 0 |
| Craig | Arnold | Eaton | 8/24/2005 | 4199 | 11762 | CEO | 1 | 0 | 0 | 0 |
| James | Bell | Boeing Company | 3/7/2005 | 2285 | 19561 | CEO | 1 | 0 | 1 | 0 |
| Byron | Boston | Dynex Capital | 12/12/2013 | 14403 | 75269 | CEO | 1 | 0 | 0 | 0 |
| Ursula | Burns | Xerox | 5/21/2009 | 11636 | 27983 | CEO | 1 | 1 | 0 | 1 |
| Ursula | Burns | Veon Ltd | 12/13/2018 | 63987 | 93337 | CEO | 1 | 0 | 0 | 1 |
| Lloyd | Carney | Brocade Communications Systems | 1/14/2013 | 120774 | 86881 | CEO | 1 | 0 | 0 | 0 |
| Matthew | Carter | Inteliquent Inc | 6/6/2015 | 178767 | 92454 | CEO | 1 | 0 | 0 | 0 |
| Anthony | Coles | NPS Pharmaceuticals | 5/12/2006 | 30255 | 80560 | CEO | 1 | 1 | 0 | 0 |
| Leonard | Comma | Jack in the Box | 8/7/2013 | 13092 | 77453 | CEO | 1 | 0 | 0 | 0 |
| Nathaniel | Davis | K12, Inc | 2/13/2018 | 178976 | 92493 | CEO | 1 | 0 | 0 | 0 |
| Steven | Davis | Bob Evans Farms | 5/2/2006 | 2282 | 18570 | CEO | 1 | 0 | 0 | 0 |
| Ken | Denman | Openwave Systems | 11/6/2008 | 121257 | 86990 | CEO | 1 | 0 | 0 | 0 |
| Arnold | Donald | Carnival & plc | 6/24/2013 | 13498 | 89728 | CEO | 1 | 0 | 0 | 0 |
| Marvin | Ellison | J.C. Penney | 10/13/2014 | 8446 | 18403 | CEO | 1 | 0 | 0 | 0 |
| Marvin | Ellison | Lowe's Companies | 5/22/2018 | 6829 | 61399 | CEO | 1 | 0 | 0 | 0 |
| Michael | Fields | Kana Software | 8/26/2005 | 123998 | 87241 | CEO | 1 | 0 | 0 | 0 |
| Kenneth | Frazier | Merck | 11/30/2010 | 7257 | 22752 | CEO | 1 | 0 | 0 | 0 |
| William | Freeman | Arbinet-thexchange | 11/19/2007 | 160867 | 90469 | CEO | 1 | 0 | 0 | 0 |
| James | Gavin | MicroIslet Inc | 6/9/2006 | 141196 | 90212 | CEO | 1 | 0 | 0 | 0 |
| James | Gavin | MicroIslet Inc | 1/19/2006 | 141196 | 90212 | CEO | 1 | 0 | 1 | 0 |
| Joel | Gay | Energy Recovery | 4/24/2015 | 179738 | 92753 | CEO | 1 | 0 | 0 | 0 |
| Kim | Goodman | Worldpay | 9/28/2016 | 194956 | 13314 | CEO | 1 | 0 | 0 | 1 |
| Leslie | Hale | RLJ Lodging Trust | 4/10/2018 | 186363 | 12756 | CEO | 1 | 1 | 1 | 1 |
| Brett | Hart | United Airlines | 10/19/2015 | 10795 | 91103 | CEO | 1 | 0 | 1 | 0 |
| Richard | Holder | NN, Inc. | 5/10/2013 | 29894 | 80343 | CEO | 1 | 0 | 0 | 0 |
| Rene | Jones | M&T Bank | 12/20/2017 | 4699 | 35554 | CEO | 1 | 1 | 0 | 0 |
| Eric | Kelly | Overland Storage Inc | 1/28/2009 | 64408 | 84555 | CEO | 1 | 0 | 0 | 0 |
| Theo | Killion | Zale Corporation | 9/23/2010 | 11669 | 79672 | CEO | 1 | 0 | 0 | 0 |
| Theo | Killion | Zale Corporation | 1/13/2010 | 11669 | 79672 | CEO | 1 | 0 | 1 | 0 |
| Kase | Lawal | CAMAC Energy Inc | 4/12/2011 | 178878 | 93106 | CEO | 1 | 1 | 0 | 0 |
| Aylwin | Lewis | Kmart Holding Corp | 10/18/2004 | 6307 | 89757 | CEO | 1 | 0 | 0 | 0 |
| Aylwin | Lewis | Sears Holdings Corporation | 9/8/2005 | 6307 | 89757 | CEO | 1 | 0 | 0 | 0 |
| François | Locoh-Donou | F5 Networks | 1/31/2017 | 121077 | 86964 | CEO | 1 | 0 | 0 | 0 |
| Shaun | McAlmont | Lincoln Educational Services Corporation | 1/21/2009 | 163668 | 90735 | CEO | 1 | 1 | 0 | 0 |
| Ronald | McCray | Career Education Corporation | 2/12/2015 | 66379 | 85724 | CEO | 1 | 0 | 1 | 0 |
| Gary | McCullough | Career Education | 3/7/2007 | 66379 | 85724 | CEO | 1 | 0 | 0 | 0 |
| Stanley | O'Neal | Merrill Lynch | 7/22/2002 | 7267 | 52919 | CEO | 1 | 1 | 0 | 0 |
| William | Osborne | Federal Signal Corporation | 9/15/2008 | 4608 | 47706 | CEO | 1 | 0 | 0 | 0 |
| Clarence | Otis | Darden Restaurants | 8/12/2004 | 31846 | 81655 | CEO | 1 | 1 | 0 | 0 |
| Sam | Owusu-Akyaw | Osteotech | 11/23/2005 | 24198 | 76710 | CEO | 1 | 0 | 0 | 0 |
| Richard | Parsons | Time Warner | 12/5/2001 | 120359 | 86926 | CEO | 1 | 1 | 0 | 0 |
| Gregory | Pratt | Carpenter Technology Corporation | 11/14/2014 | 2787 | 20618 | CEO | 1 | 0 | 0 | 0 |
| Gregory | Pratt | Carpenter Technology Corporation | 10/12/2009 | 2787 | 20618 | CEO | 1 | 0 | 1 | 0 |
| Michael | Pugh | Carver Bancorp | 11/17/2014 | 30857 | 80960 | CEO | 1 | 0 | 0 | 0 |
| Derica | Rice | Eli Lilly and Co. | 5/6/2013 | 6730 | 50876 | CEO | 1 | 1 | 1 | 0 |
| James | Sweetnam | Dana Holding Corporation | 5/27/2009 | 3734 | 92570 | CEO | 1 | 0 | 0 | 0 |
| Tidjane | Thiam | Credit Suisse Group | 3/9/2015 | 28838 | 89154 | CEO | 1 | 0 | 0 | 0 |
| Donald | Thompson | McDonald's | 1/11/2010 | 7154 | 43449 | CEO | 1 | 1 | 0 | 0 |
| Lisa | Wardell | DeVry Education Group | 5/24/2016 | 3905 | 76708 | CEO | 1 | 1 | 0 | 1 |
| Gene | Warren | ACT Teleconferencing | 12/17/2003 | 62649 | 83347 | CEO | 1 | 0 | 0 | 0 |
| James | White | Jamba Juice | 11/18/2008 | 164255 | 90795 | CEO | 1 | 1 | 0 | 0 |
| Ronald | Williams | Aetna | 1/4/2006 | 1177 | 88845 | CEO | 1 | 1 | 0 | 0 |
| Mary | Winston | Bed Bath & Beyond | 5/13/2019 | 25338 | 77659 | CEO | 1 | 0 | 1 | 1 |
| RL | Wood | Crompton | 1/12/2004 | 3607 | 38420 | CEO | 1 | 0 | 0 | 0 |
| Jide | Zeitlin | Tapestry Inc | 9/4/2019 | 140541 | 88661 | CEO | 1 | 1 | 0 | 0 |
| Keith | Alessi | Westmoreland Coal Company | 5/2/2007 | 11440 | 59467 | CEO | 0 | 1 | 1 | 0 |
| Keith | Alessi | Westmoreland Coal Company | 1/27/2009 | 11440 | 59467 | CEO | 0 | 0 | 0 | 0 |
| Bradbury | Anderson | Best Buy | 2/25/2002 | 2184 | 85914 | CEO | 0 | 0 | 0 | 0 |
| Sherry | Bahrambeygui | PriceSmart | 1/31/2019 | 65343 | 85394 | CEO | 0 | 1 | 0 | 1 |
| Michael | Barry | Quaker Chemical Corporpation | 5/7/2008 | 8850 | 64929 | CEO | 0 | 1 | 0 | 0 |
| Todd | Becker | Green Plains Renewable Energy | 12/22/2008 | 166576 | 91161 | CEO | 0 | 0 | 0 | 0 |
| Friedhelm | Blobel | Sciclone Pharmaceuticals | 4/24/2006 | 25047 | 77413 | CEO | 0 | 0 | 0 | 0 |
| Mark | Capone | Myriad Genetics | 2/3/2015 | 61399 | 82508 | CEO | 0 | 0 | 0 | 0 |
| Greg | Carmichael | Fifth Third Bancorp | 7/8/2015 | 4640 | 34746 | CEO | 0 | 0 | 0 | 0 |
| Steven | Cosse | Murphy Oil Corporation | 6/20/2012 | 7620 | 28345 | CEO | 0 | 0 | 0 | 0 |
| Patrick | Coyne | Delaware Investments Dividend and Income Fund | 8/1/2006 | 27963 | 79036 | CEO | 0 | 0 | 0 | 0 |
| Alec | Cunningham | Wellcare Health Plans | 12/21/2009 | 260778 | 90272 | CEO | 0 | 0 | 0 | 0 |
| Joseph | Darling | Anika Therapeutics | 3/5/2018 | 28209 | 79150 | CEO | 0 | 0 | 0 | 0 |
| David | Dickson | Mcdermott International | 10/17/2013 | 7152 | 64629 | CEO | 0 | 1 | 0 | 0 |
| Brian | Driscoll | Snyder's-Lance | 4/17/2017 | 6574 | 48531 | CEO | 0 | 1 | 1 | 0 |
| Thomas | Edman | TTM Technologies | 10/30/2013 | 139804 | 88648 | CEO | 0 | 0 | 0 | 0 |
| Michael | Eskew | United Parcel Service | 8/16/2001 | 10920 | 87447 | CEO | 0 | 0 | 0 | 0 |
| Donald | Felsinger | Sempra Energy | 12/7/2005 | 8272 | 86136 | CEO | 0 | 0 | 0 | 0 |
| Olivier | Filliol | Mettler-Toledo International | 11/1/2007 | 65772 | 85621 | CEO | 0 | 0 | 0 | 0 |
| Larry | Franklin | Harte-Hanks,Inc | 12/15/2008 | 12545 | 79903 | CEO | 0 | 0 | 1 | 0 |
| Scott | Freidheim | CDI Corporation | 8/13/2014 | 2538 | 45655 | CEO | 0 | 0 | 0 | 0 |
| Andrew | Gatto | Russ Berrie and Co. | 4/12/2004 | 9289 | 66050 | CEO | 0 | 1 | 0 | 0 |
| John | Gibson | ONEOK, Inc. | 11/16/2006 | 8151 | 25232 | CEO | 0 | 1 | 0 | 0 |
| Shira | Goodman | Staples, Inc. | 9/26/2016 | 15521 | 75489 | CEO | 0 | 0 | 0 | 1 |
| Jeffrey | Harmening | General Mills | 5/3/2017 | 5071 | 17144 | CEO | 0 | 0 | 0 | 0 |
| Lawrence | Hebert | Riggs National Corporation | 3/9/2005 | 9142 | 66967 | CEO | 0 | 0 | 0 | 0 |
| Bradley | Jacobs | XPO Logistics | 9/2/2011 | 144998 | 90175 | CEO | 0 | 1 | 0 | 0 |
| Nicholas | Konidaris | Electro Scientific Industries | 1/7/2004 | 4274 | 32054 | CEO | 0 | 0 | 0 | 0 |
| Michael | Lamach | Ingersoll-Rand PLC | 2/4/2010 | 5959 | 12431 | CEO | 0 | 0 | 0 | 0 |
| Michael | Macdonald | Medifast, Inc. | 2/2/2012 | 29517 | 80054 | CEO | 0 | 0 | 0 | 0 |
| Christopher | Martin | Provident Financial Services | 2/27/2009 | 150279 | 89653 | CEO | 0 | 0 | 0 | 0 |
| Joseph | McGrath | Unisys Corporation | 10/22/2004 | 2504 | 10890 | CEO | 0 | 0 | 0 | 0 |
| C. Douglas | McMillon | Wal-Mart Stores | 11/25/2013 | 11259 | 55976 | CEO | 0 | 0 | 0 | 0 |
| Norman | Miller | Conn's, Inc. | 9/9/2015 | 156614 | 89908 | CEO | 0 | 1 | 0 | 0 |
| Max | Mitchell | Crane Co. | 4/22/2013 | 3580 | 20204 | CEO | 0 | 0 | 0 | 0 |
| Gregg | Mollins | Reliance Steel & Aluminum Co. | 3/2/2015 | 30671 | 80864 | CEO | 0 | 1 | 0 | 0 |
| William | Morrow | Clearwire Corporation | 3/9/2009 | 174579 | 91892 | CEO | 0 | 0 | 0 | 0 |
| Daniel | O'Day | Gilead Sciences | 12/9/2018 | 24856 | 77274 | CEO | 0 | 0 | 0 | 0 |
| Kelly | Ortberg | Rockwell Collins | 4/19/2013 | 144066 | 89014 | CEO | 0 | 0 | 0 | 1 |
| Andrea | Owen | Herman Miller | 8/15/2018 | 7401 | 54114 | CEO | 0 | 0 | 0 | 1 |
| Gerald | Perkel | Planar Systems, Inc. | 9/26/2005 | 29435 | 80012 | CEO | 0 | 0 | 0 | 0 |
| Michael | Plisinski | Rudolph Technologies | 11/9/2015 | 126423 | 87415 | CEO | 0 | 0 | 0 | 0 |
| Patrick | Ramsey | Multimedia Games | 3/15/2010 | 62107 | 83529 | CEO | 0 | 0 | 1 | 0 |
| Patrick | Ramsey | Multimedia Games | 9/20/2010 | 62107 | 83529 | CEO | 0 | 0 | 0 | 0 |
| Darren | Rebelez | Casey's General Stores | 6/5/2019 | 2807 | 21742 | CEO | 0 | 0 | 0 | 0 |
| Jeffrey | Sanfilippo | John B. Sanfilippo & Son | 5/11/2006 | 24755 | 77165 | CEO | 0 | 0 | 0 | 0 |
| Alan | Schnitzer | The Travelers Companies | 8/4/2015 | 62689 | 59459 | CEO | 0 | 0 | 0 | 0 |
| C. Randall | Sims | Home BancShares | 7/17/2009 | 164633 | 91356 | CEO | 0 | 0 | 0 | 0 |
| Michael | Strianese | L-3 Communications Holdings | 6/9/2006 | 13440 | 85991 | CEO | 0 | 1 | 1 | 0 |
| William | Stromberg | T. Rowe Price Group | 5/6/2015 | 12138 | 10138 | CEO | 0 | 1 | 0 | 0 |
| Joseph | Sullivan | Legg Mason | 2/8/2013 | 6653 | 65330 | CEO | 0 | 0 | 0 | 0 |
| Nigel | Travis | Papa John's International | 1/31/2005 | 28397 | 79299 | CEO | 0 | 0 | 0 | 0 |
| Brian | Vance | Heritage Financial Corporation | 9/22/2006 | CEO | 0 | 0 | 0 | 0 | ||
| Kenneth | Vecchione | Encore Capital Group | 4/8/2013 | 121815 | 87077 | CEO | 0 | 0 | 0 | 0 |
| Emma | Walmsley | GlaxoSmithKline | 9/20/2016 | 5180 | 75064 | CEO | 0 | 0 | 0 | 1 |
| Cynthia | Warner | Renewable Energy Group | 12/6/2018 | 187692 | 13201 | CEO | 0 | 0 | 0 | 1 |
| Kevin | Wilson | Heska Corporpation | 3/27/2014 | 65011 | 85187 | CEO | 0 | 0 | 0 | 0 |
| John | Hall | Independence Federal Savings Bank | 6/2/2007 | 16888 | 88891 | CEO | 1 | 1 | 0 | 0 |
| Lonnel | Coats | Lexicon Pharmaceuticals Inc | 7/8/2014 | 133868 | 88173 | CEO | 1 | 0 | 0 | 0 |
| David | Rawlinson | Qurate Retail Inc | 7/13/2021 | 174147 | 91278 | CEO | 1 | 1 | 0 | 0 |
| Lloyd | Yates | NiSource | 1/28/2022 | 7974 | 38762 | CEO | 1 | 1 | 0 | 0 |
| Stephen | Beard | Adtalem Global Education | 8/4/2021 | 3905 | 76708 | CEO | 1 | 0 | 0 | 0 |
| Marvin | Riley | EnPro Industries Inc | 3/12/2019 | 148950 | 89406 | CEO | 1 | 1 | 0 | 0 |
| Sam | Solomon | EveryWare Global Inc | 6/9/2014 | 170327 | 13378 | CEO | 1 | 0 | 0 | 0 |
| Michael | Dinkins | Access Worldwide Communications Inc | 7/30/1999 | 66454 | 85807 | CEO | 1 | 1 | 0 | 0 |
| Christopher | Womack | Georgia Power | 5/26/2021 | 9850 | 18411 | CEO | 1 | 0 | 0 | 0 |
| Clinton | Lewis | AgroFresh Solutions Inc | 4/12/2021 | 19525 | 14590 | CEO | 1 | 1 | 0 | 0 |
| Rahsan-Rahsan | Lindsay | MediaCo Holding Inc | 6/11/2021 | 35583 | 19129 | CEO | 1 | 0 | 0 | 0 |
| Dwight | Gibson | BlueLinx Holdings Inc | 4/22/2021 | 161813 | 90496 | CEO | 1 | 0 | 0 | 0 |
| Clifford | Alexander | Dun & Bradstreet | 10/26/1999 | 4094 | 48506 | CEO | 1 | 1 | 1 | 0 |
| Barry | Rand | Avis Rent A Car | 11/9/1999 | 65056 | 85331 | CEO | 1 | 0 | 0 | 0 |
| Anthony | Coles | Onyx Pharmaceuticals Inc | 2/26/2008 | 62826 | 83541 | CEO | 1 | 0 | 0 | 0 |
| Priscilla | Sims Brown | Amalgamated Financial Corp | 5/11/2021 | 33625 | 18043 | CEO | 1 | 0 | 0 | 1 |
| Hansel | Tookes | Raytheon | 9/8/1999 | 8972 | 24942 | CEO | 1 | 1 | 0 | 0 |
| Lloyd | Ward | Maytag | 5/13/1999 | 7139 | 13119 | CEO | 1 | 1 | 0 | 0 |
| John | Thompson | Symantec | 4/14/1999 | 15855 | 75607 | CEO | 1 | 0 | 0 | 0 |
| Rosalind | Brewer | Walgreens | 1/26/2021 | 11264 | 19502 | CEO | 1 | 0 | 0 | 1 |
| Kenneth | Chenault | American Express | 4/27/1999 | 1447 | 59176 | CEO | 1 | 1 | 0 | 0 |
| Steven | Hanson | Inplay Technologies | 7/2/2007 | 66275 | 87138 | CEO | 0 | 0 | 0 | 0 |
| Chris | Homeister | Tile Shop Holdings | 10/28/2014 | 13861 | 13563 | CEO | 0 | 0 | 0 | 0 |
| John | Weinberg | Evercore | 10/27/2021 | 174744 | 91413 | CEO | 0 | 0 | 0 | 0 |
| Devin | McGranahan | Western Union | 11/15/2021 | 175263 | 91461 | CEO | 0 | 0 | 0 | 0 |
| James | Mullen | Editas Medicine | 2/8/2021 | 26874 | 15937 | CEO | 0 | 0 | 0 | 0 |
| William | Higgins | Albany International Corp | 1/21/2020 | 14084 | 11731 | CEO | 0 | 0 | 0 | 0 |
| William | Petroplus | First West Virginia Bancorp, Inc | 3/27/2015 | 31593 | 81298 | CEO | 0 | 0 | 0 | 0 |
| Robert | Thomas | Charles & Colvard | 7/17/2000 | 65850 | 85539 | CEO | 0 | 0 | 0 | 0 |
| Dean | Klisura | Marsh & McLennan | 11/18/2021 | 7065 | 45751 | CEO | 0 | 0 | 0 | 0 |
| Daniel | Thoren | Graham Corporation | 8/10/2021 | 5254 | 60468 | CEO | 0 | 0 | 0 | 0 |
| Thomas | Burnell | Interpace Biosciences | 11/25/2020 | 110728 | 86083 | CEO | 0 | 0 | 0 | 0 |
| Mark | Filanowski | Pangaea Logistics Solns | 12/14/2021 | 21904 | 14353 | CEO | 0 | 0 | 0 | 0 |
| Bruce | Nelson | Office Depot | 7/18/2000 | 14624 | 75573 | CEO | 0 | 0 | 0 | 0 |
| Philip | Hadley | Factset Research Systems | 9/5/2000 | 63172 | 83597 | CEO | 0 | 0 | 0 | 0 |
| Timothy | Frank | Conns | 6/3/2008 | 156614 | 89908 | CEO | 0 | 1 | 0 | 0 |
| Laura | Francis | Si-BONE | 1/7/2021 | 34193 | 18212 | CEO | 0 | 0 | 0 | 1 |
| Jozef | Straus | Jds Uniphase | 5/18/2000 | 29241 | 79879 | CEO | 0 | 0 | 0 | 0 |
| Francis | Scricco | Arrow Electronics | 5/10/2000 | 1773 | 29209 | CEO | 0 | 0 | 0 | 0 |
| David | Kyle | Oneok Inc | 8/29/2000 | 8151 | 25232 | CEO | 0 | 0 | 0 | 0 |
| Sheila | Harrington | Urban Outfitters | 10/14/2020 | 29150 | 79881 | CEO | 0 | 1 | 0 | 1 |
| Roger | King | Cbs | 1/19/2000 | 13714 | 75104 | CEO | 0 | 0 | 0 | 0 |
| Brian | Anderson | OfficeMax | 11/11/2004 | 2290 | 42024 | TMT | 1 | 0 | 0 | |
| Craig | Arnold | Eaton | 1/28/2009 | 4199 | 11762 | TMT | 1 | 1 | 0 | |
| Wendel | Barr | Covance | 12/19/2007 | 64162 | 84364 | TMT | 1 | 1 | 0 | |
| James | Bell | Boeing | 1/6/2004 | 2285 | 19561 | TMT | 1 | 0 | 0 | |
| Marc | Belton | General Mills | 5/3/2005 | 5071 | 17144 | TMT | 1 | 1 | 0 | |
| Marc | Belton | General Mills | 5/4/2006 | 5071 | 17144 | TMT | 1 | 1 | 0 | |
| Alicia | Boler Davis | General Motors | 6/9/2016 | 5073 | 12369 | TMT | 1 | 1 | 1 | |
| Audrey | Boone Tillman | Aflac | 5/5/2014 | 1449 | 57904 | TMT | 1 | 1 | 1 | |
| Donald | Brown | NiSource | 3/24/2015 | 7974 | 38762 | TMT | 1 | 1 | 0 | |
| Marcus | Brown | Entergy | 1/31/2012 | 7366 | 24010 | TMT | 1 | 1 | 0 | |
| Harvey | Brownlee | Bob Evans Farms | 1/21/2009 | 2282 | 18570 | TMT | 1 | 1 | 0 | |
| Glynis | Bryan | Insight Enterprises | 11/19/2007 | 31453 | 81220 | TMT | 1 | 0 | 1 | |
| Ursula | Burns | Xerox | 4/3/2007 | 11636 | 27983 | TMT | 1 | 0 | 1 | |
| Eric | Butler | Union Pacific | 11/17/2016 | 10867 | 48725 | TMT | 1 | 1 | 0 | |
| Eric | Butler | Union Pacific | 3/15/2012 | 10867 | 48725 | TMT | 1 | 1 | 0 | |
| Ann-Marie | Campbell | Home Depot | 1/19/2016 | 5680 | 66181 | TMT | 1 | 0 | 1 | |
| Angelique | Carbo | Selective Insurance Group | 3/3/2016 | 17115 | 68292 | TMT | 1 | 1 | 1 | |
| Edward | Chaplin | MBIA | 5/30/2006 | 13561 | 75175 | TMT | 1 | 1 | 0 | |
| Frank | Clark | Exelon | 10/2/2001 | 8539 | 21776 | TMT | 1 | 1 | 0 | |
| Alexander | Cummings | Coca-Cola | 7/17/2008 | 3144 | 11308 | TMT | 1 | 1 | 0 | |
| Jeffrey | Davis | J.C. Penney | 7/25/2017 | 8446 | 18403 | TMT | 1 | 0 | 0 | |
| Martin | Davis | Wachovia | 2/10/2003 | 4739 | 36469 | TMT | 1 | 0 | 0 | |
| Willie | Deese | Merck | 5/25/2005 | 7257 | 22752 | TMT | 1 | 0 | 0 | |
| Jerri | DeVard | Office Depot | 9/14/2017 | 14624 | 75573 | TMT | 1 | 0 | 1 | |
| Verona | Dorch | Peabody Energy | 8/4/2015 | 142460 | 88991 | TMT | 1 | 0 | 1 | |
| Troy | Ellis | Domino's Pizza | 6/30/2015 | 160211 | 90248 | TMT | 1 | 1 | 0 | |
| Marvin | Ellison | Home Depot | 8/25/2008 | 5680 | 66181 | TMT | 1 | 1 | 0 | |
| Forest | Farmer | Chrysler | 8/30/1988 | 3022 | 11260 | TMT | 1 | 1 | 0 | |
| Rhonda | Ferguson | Union Pacific | 6/7/2016 | 10867 | 48725 | TMT | 1 | 0 | 1 | |
| Darrell | Ford | Xerox | 11/2/2015 | 11636 | 27983 | TMT | 1 | 0 | 0 | |
| Kenneth | Frazier | Merck | 7/27/2007 | 7257 | 22752 | TMT | 1 | 1 | 0 | |
| Linda | Gooden | Lockheed Martin | 12/7/2006 | 6774 | 21178 | TMT | 1 | 1 | 1 | |
| Kim | Goodman | American Express | 7/12/2007 | 1447 | 59176 | TMT | 1 | 0 | 1 | |
| Mirian | Graddick | AT&T | 2/12/1999 | 9899 | 66093 | TMT | 1 | 1 | 1 | |
| Sylvester | Green | Chubb & Son | 9/16/1998 | 3024 | 59192 | TMT | 1 | 0 | 0 | |
| Kimberley | Harris | Comcast | 7/16/2013 | 3226 | 89565 | TMT | 1 | 1 | 1 | |
| Paul | Harris | KeyCorp | 2/3/2003 | 9783 | 64995 | TMT | 1 | 1 | 0 | |
| Rejji | Hayes | CMS Energy | 5/1/2017 | 3439 | 23229 | TMT | 1 | 1 | 0 | |
| Bridgette | Heller | Merck | 2/16/2010 | 7257 | 22752 | TMT | 1 | 1 | 1 | |
| Dennis | Hightower | Walt Disney | 9/24/1990 | 3980 | 26403 | TMT | 1 | 1 | 0 | |
| Yvette | Hollingsworth Clark | Wells Fargo | 5/14/2012 | 8007 | 38703 | TMT | 1 | 0 | 1 | |
| Phillip | Holloman | Cintas | 1/19/2008 | 3062 | 23660 | TMT | 1 | 0 | 0 | |
| Duane | Holloway | Ascena Retail Group | 1/18/2016 | 4072 | 30737 | TMT | 1 | 0 | 0 | |
| Jamere | Jackson | Nielsen Holdings plc | 2/24/2014 | 100873 | 12542 | TMT | 1 | 1 | 0 | |
| John | Jacob | Anheuser-Busch | 6/6/1994 | 1663 | 59184 | TMT | 1 | 0 | 0 | |
| Lisa | Jeffries Caldwell | Reynolds American | 5/21/2008 | 120877 | 86946 | TMT | 1 | 1 | 1 | |
| Joia | Johnson | Hanesbrands | 1/11/2007 | 175319 | 91416 | TMT | 1 | 0 | 1 | |
| Nicole | Jones | Cigna | 5/25/2010 | 2547 | 64186 | TMT | 1 | 0 | 1 | |
| Michelle | Lee | Wells Fargo | 10/16/2014 | 8007 | 38703 | TMT | 1 | 1 | 1 | |
| Clinton | Lewis | Zoetis | 5/7/2015 | 13721 | 13788 | TMT | 1 | 1 | 0 | |
| Freda | Lewis-Hall | Pfizer | 5/4/2009 | 8530 | 21936 | TMT | 1 | 0 | 1 | |
| Mark | Mason | Citigroup | 9/7/2006 | 3243 | 70519 | TMT | 1 | 1 | 0 | |
| George | Mayes | Diebold | 4/27/2006 | 3946 | 40440 | TMT | 1 | 1 | 0 | |
| Antoinette | McCorvey | Eastman Kodak | 10/12/2010 | 4194 | 11754 | TMT | 1 | 1 | 1 | |
| Lawrence | McRae | Corning | 10/7/2010 | 3532 | 22293 | TMT | 1 | 1 | 0 | |
| Raymond | Mines | McDonald's | 9/28/1998 | 7154 | 43449 | TMT | 1 | 0 | 0 | |
| Harold | Morrison | Chubb | 6/19/2008 | 3024 | 59192 | TMT | 1 | 1 | 0 | |
| Harold | Morrison | Chubb | 10/21/2010 | 3024 | 59192 | TMT | 1 | 1 | 0 | |
| Vanessa | Morrison | 20th Century Fox | 10/30/2017 | 12886 | 90441 | TMT | 1 | 0 | 1 | |
| Richard | Nanula | Walt Disney | 8/29/1991 | 3980 | 26403 | TMT | 1 | 1 | 0 | |
| George | Neale | Selective Insurance Group | 5/12/2015 | 17115 | 68292 | TMT | 1 | 1 | 0 | |
| Momar | Nguer | Total S.A. | 3/18/2016 | 24625 | 77078 | TMT | 1 | 1 | 0 | |
| Stanley | O'Neal | Merrill Lynch | 2/4/1998 | 7267 | 52919 | TMT | 1 | 1 | 0 | |
| Vicki | Palmer | Coca-Cola | 1/13/2004 | 3144 | 11308 | TMT | 1 | 1 | 1 | |
| Herbert | Parker | Harman International | 5/7/2008 | 12788 | 75224 | TMT | 1 | 1 | 0 | |
| Herbert | Parker | Harman International | 5/6/2008 | 12788 | 75224 | TMT | 1 | 1 | 0 | |
| Richard | Parsons | Time Warner | 10/31/1994 | 10576 | 40483 | TMT | 1 | 0 | 0 | |
| Angelia | Pelham | Cinemark Holdings | 1/15/2016 | 177108 | 91915 | TMT | 1 | 0 | 1 | |
| Charles | Phillips | Oracle | 1/13/2004 | 12142 | 10104 | TMT | 1 | 1 | 0 | |
| William | Plummer | United Rentals | 11/24/2008 | 66065 | 85663 | TMT | 1 | 1 | 0 | |
| Barry | Rand | Xerox | 2/4/1992 | 11636 | 27983 | TMT | 1 | 1 | 0 | |
| Derica | Rice | Eli Lilly | 12/18/2009 | 6730 | 50876 | TMT | 1 | 0 | 0 | |
| Derica | Rice | Eli Lilly | 2/23/2006 | 6730 | 50876 | TMT | 1 | 1 | 0 | |
| Michael | Smith | Huntington Ingalls Industries | 10/30/2015 | 186310 | 12623 | TMT | 1 | 1 | 0 | |
| Susan | Somersille Johnson | SunTrust Banks | 8/5/2014 | 10187 | 68144 | TMT | 1 | 0 | 1 | |
| Denis | Suggs | Belden | 6/14/2007 | 28940 | 79668 | TMT | 1 | 0 | 0 | |
| Scott | Taylor | Symantec | 8/1/2008 | 15855 | 75607 | TMT | 1 | 1 | 0 | |
| Shundrawn | Thomas | Northern Trust | 5/28/2014 | 7982 | 58246 | TMT | 1 | 1 | 0 | |
| Michael | Todman | Whirlpool | 3/25/2001 | 11465 | 25419 | TMT | 1 | 0 | 0 | |
| Tracey | Travis | Estee Lauder | 7/18/2012 | 61567 | 82642 | TMT | 1 | 0 | 1 | |
| Tracey | Travis | Polo Ralph Lauren | 11/20/2004 | 64891 | 85072 | TMT | 1 | 1 | 1 | |
| Tracey | Travis | Estee Lauder | 7/18/2012 | 61567 | 82642 | TMT | 1 | 0 | 1 | |
| Michael | Triplett | Cigna | 2/23/2017 | 2547 | 64186 | TMT | 1 | 1 | 0 | |
| Michael | Tucker | Avis Budget Group | 4/22/2010 | 3278 | 25487 | TMT | 1 | 0 | 0 | |
| Reed | Tuckson | UnitedHealth Group | 9/16/2000 | 10903 | 92655 | TMT | 1 | 0 | 0 | |
| Kellye | Walker | Huntington Ingalls Industries | 12/17/2014 | 186310 | 12623 | TMT | 1 | 1 | 1 | |
| Kathy | Waller | Coca-Cola | 2/20/2014 | 3144 | 11308 | TMT | 1 | 1 | 1 | |
| Laysha | Ward | Target | 12/17/2014 | 3813 | 49154 | TMT | 1 | 1 | 1 | |
| Kevin | Warren | Xerox | 12/7/2016 | 11636 | 27983 | TMT | 1 | 1 | 0 | |
| Robin | Washington | Gilead Sciences | 4/21/2008 | 24856 | 77274 | TMT | 1 | 0 | 1 | |
| Jeffrey | Weaver | KeyCorp | 7/5/2005 | 9783 | 64995 | TMT | 1 | 0 | 0 | |
| Mary Beth | West | Kraft Foods | 10/29/2007 | 142953 | 89006 | TMT | 1 | 0 | 1 | |
| Roderick | West | Entergy | 6/7/2010 | 7366 | 24010 | TMT | 1 | 1 | 0 | |
| Teresa | White | Aflac | 9/29/2014 | 1449 | 57904 | TMT | 1 | 1 | 1 | |
| Anré | Williams | American Express | 11/4/2011 | 1447 | 59176 | TMT | 1 | 1 | 0 | |
| Felicia | Williams | Macy's | 1/15/2016 | 4611 | 77462 | TMT | 1 | 1 | 1 | |
| Xavier | Williams | AT&T | 10/12/2017 | 9899 | 66093 | TMT | 1 | 0 | 0 | |
| Kathleen | Wilson-Thompson | Walgreens Boots Alliance | 11/23/2009 | 11264 | 19502 | TMT | 1 | 1 | 1 | |
| Mary Beth | Winston | Family Dollar Stores | 4/10/2012 | 4560 | 53866 | TMT | 1 | 1 | 1 | |
| Christopher | Womack | Southern Company | 12/22/2008 | 9850 | 18411 | TMT | 1 | 0 | 0 | |
| Teresa | Wynn Roseborough | Home Depot | 10/7/2011 | 5680 | 66181 | TMT | 1 | 0 | 1 |