
Abstract
The Three-North Shelterbelt Forest Program (TNSFP) is a key ecological initiative in China's arid and semi-arid regions, vital for wind prevention, sand fixation, and ecological restoration. However, long-term drought, extreme climate events, and human disturbances have threatened forest ecosystem stability. A systematic understanding of these disturbance and degradation patterns is lacking, hindering effective restoration strategies. This study aims to identify forest disturbances in the TNSFP from 1991 to 2021 and reveal their spatiotemporal patterns under varying climatic aridity gradients. Using annual Landsat imagery, four indices—NDVI, NBR, SWIR1, and SWIR2—were constructed. The LandTrendr algorithm was applied to extract multi-parameter degradation features, integrated with Hansen Forest Loss Data and the Random Forest model for disturbance classification (OA = 0.96, Kappa = 0.94). Results show that forest degradation peaked in the 1990s, with a decline in degraded areas over time. The high-density degradation zones were mainly in the Greater Khingan Mountains, Changbai Mountains, Loess Plateau, and Altay Mountains. Degradation characteristics such as duration, NDVI decline, and rate varied regionally. Northeastern areas of TNSFP showed slow degradation, while the Loess Plateau and northern Changbai Mountains experienced rapid degradation. Arid regions showed long-duration degradation but weak intensity, while humid regions showed high degradation rates. The findings provide technical support for understanding forest disturbance dynamics and degradation patterns.
Introduction
Ecological disturbance refers to changes in the structure and function of ecosystems caused by natural events or human activities, including vegetation destruction, soil degradation, and biodiversity loss. It serves as a primary driving force behind the dynamic evolution of forest ecosystems (Sousa, 1984). Under the combined influence of global climate change and intensified human activities, forest disturbances have become increasingly prominent (Seidl et al., 2017; Senf and Seidl, 2021). In recent decades, the mechanisms of forest disturbance have shifted globally, with both the frequency and severity of events increasing and their driving factors varying substantially across regions (Seidl and Senf, 2024). Major disturbance drivers include wildfires (Davis et al., 2024; Kharuk et al., 2021), droughts (Hartmann et al., 2022; Van Der Woude et al., 2023), and pest outbreaks (Pirtskhalava-Karpova et al., 2024), all of which exert strong impacts on forest ecosystems. As one of the world’s major forest resource countries, China has undergone remarkable changes in forest coverage over the past few decades. Since the late 20th century, a series of large-scale ecological restoration projects have been implemented, making China the fastest-growing country in terms of forest resources. Among these projects, the Three-North Shelterbelt Forest Program (TNSFP)—the world’s largest afforestation and ecological engineering effort—has played a central role in combating desertification and improving regional ecological resilience (Zhu and Zheng, 2019). However, forest disturbances and degradation have posed new challenges for evaluating the long-term ecological effectiveness of the project, highlighting the need for systematic analyses of their spatiotemporal dynamics.
The identification and monitoring of forest disturbances have thus become key research topics in the field of remote sensing. Long-term satellite remote sensing time series provide crucial support for monitoring forest dynamics (Ling et al., 2024). Medium-resolution imagery, such as 30-meter Landsat data, has been widely used for detecting forest disturbance and recovery processes due to its strong spatial–temporal continuity and long-term data record. Over the past decades, various forest disturbance detection methods have been developed, among which time series analysis techniques—such as Landsat-based Detection of Trends in Disturbance and Recovery (LandTrendr; LT), Composite2Change (C2C), Tracking Intra- and Inter-year Change (TIIC), and Continuous Change Detection and Classification (CCDC)—have shown remarkable advantages (Pelletier et al., 2024; White et al., 2022; Xiao et al., 2023). The LandTrendr algorithm, in particular, effectively captures key parameters of spectral index variation through segmented regression modeling (Cohen et al., 2018; Kennedy et al., 2010), accurately identifying the occurrence, duration, and recovery of forest disturbances. When combined with CCDC, LandTrendr complements its limitations to achieve more reliable detection. The improved mLandTrendr algorithm further enhances detection accuracy, and its integration with Random Forest classification increases the reliability of identifying truly disturbed pixels, making LandTrendr and its variants widely applied in large-scale and long-term forest disturbance monitoring (Liu et al., 2023b; Pasquarella et al., 2022; Qiu et al., 2023; Zhai et al., 2025).
Since the implementation of the TNSFP, regional vegetation coverage has generally shown a continuous upward trend. Both Fractional Vegetation Cover (FVC) and the Normalized Difference Vegetation Index (NDVI) have increased significantly over the past decades. Liu et al. (2024) reported that forest coverage in the TNSFP region has steadily increased since 2010. However, the drivers of vegetation dynamics are complex, with climate exerting dominant control. Li et al. (2020) found that under the warming and drying climate trend, the risk of tree decline and mortality has intensified, particularly in semi-arid areas sensitive to precipitation fluctuations. Wang et al. (2024a) further showed that rising CO2 concentration and annual precipitation have jointly contributed to vegetation improvement. Nevertheless, recent studies have revealed localized forest degradation within the TNSFP. Guo et al. (2024) found that in Urad Zhongqi, severe degradation was mainly caused by drought and the natural senescence of dominant poplar species. Lu et al. (2023) reported that climatic mismatches between the introduced and native ranges of Pinus sylvestris var. mongolica, along with pest outbreaks and carbon starvation, exacerbated forest decline. Similarly, Qi et al. (2023) demonstrated that persistent vegetation degradation in sandy lands has been driven by mismatched species selection, intensified human activities, and ongoing climate stress.
Despite these advances, several knowledge gaps remain. Most existing studies have focused on identifying disturbance events or analyzing recovery patterns, but few have examined the multi-parameter characteristics of disturbance processes. Although LandTrendr has been widely applied, integrated analyses of its extracted parameters—such as disturbance duration, magnitude, and rate—remain limited. Furthermore, for the TNSFP, a representative artificial forest region located in arid and semi-arid zones, there is still a lack of long-term, pixel-scale analyses that capture the complex spatiotemporal evolution of disturbance processes. Quantitative assessments of forest degradation across different climatic zones within the Three-North region are also scarce, and the variation of disturbance intensity along aridity gradients remains poorly understood. As the world’s largest artificial forest region, the TNSFP continues to face persistent ecological pressures such as drought and desertification. Given that many introduced tree species exhibit limited adaptability to local environments, employing remote sensing combined with high-sensitivity time series analysis to accurately detect degradation timing, location, and intensity is essential. Therefore, this study aims to (1) identify the disturbance years and degradation trends of TNSFP forests using remote sensing methods; (2) reveal the spatiotemporal characteristics and patterns of forest degradation over the past 30 years; and (3) analyze the differences in forest degradation processes along climatic aridity gradients.
Study area and methods
Study area
The TNSFP is planned in eight phases and covers 725 counties of 13 provinces of in China. According to the planning results of the Fifth Phase (2011~2020), our study area ranges from 73°26′E to 135°05′E and 33°30′N to 53°30′N, covering a total area of 4.358 million km2, accounting for 45% of China’ s total land area (Figure 1), representing a transition zone between the inland ecologically fragile regions of Central Asia and the East Asian monsoon zone. It is one of the world’s largest mid-latitude artificial forest regions. Artificial afforestation accounts for about 80% of the total afforested area in the first five phases, followed by aerial seeding and enclosure-based reforestation. The terrain generally declines from west to east, with diverse landform types. The region is dominated by temperate monsoon and temperate continental climates, with an annual mean temperature of 2~8 °C and precipitation decreasing from east to west. By the end of the Fifth Phase (2020), the cumulative afforested area of the Three-North Shelterbelt reached 31.74 million hm2, increasing the forest coverage rate to 13.84%.
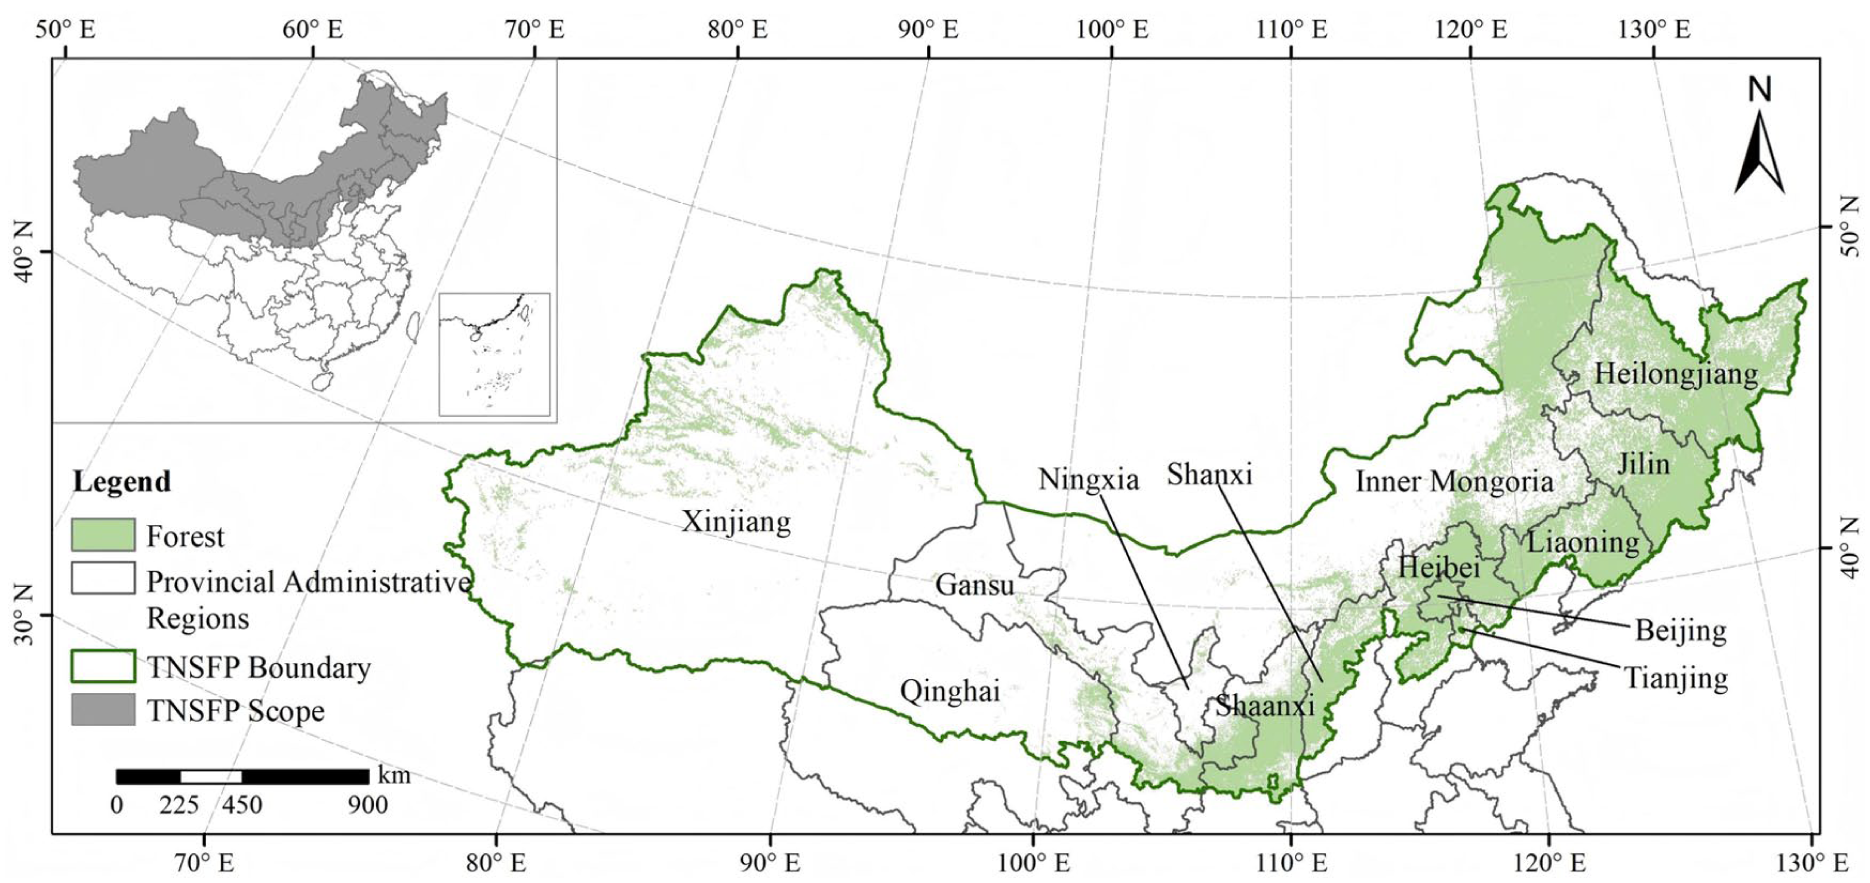
The study area.
Data source and pre-processing
All available Landsat-5, Landsat-7, and Landsat-8 Tier 1 imagery from 1990 to 2024 with less than 20% cloud cover and 30 m spatial resolution were acquired from the Google Earth Engine cloud platform (GEE, https://earthengine.google.com). To address spectral inconsistencies among different Landsat sensors, linear transformations with corresponding coefficients were applied to adjust spectral values. Clouds, cloud shadows, snow, and water were masked out using the Fmask algorithm. Four spectral indices were then calculated for forest pixels — Normalized Difference Vegetation Index (NDVI), Normalized Burn Ratio (NBR), Shortwave Infrared 1 (SWIR1), and Shortwave Infrared 2 (SWIR2).
The study area corresponds to the forest regions within the TNSFP. The boundary data of the project were derived from the vector dataset of the Fifth Phase of the TNSFP (Shao et al., 2022). The forest mask data were obtained from the China Forest Age 30 m Map dataset developed by Xiao et al. (2023) (https://doi.org/10.6084/m9.figshare.21627023.v7). The forest degradation validation data were sourced from the Hansen Global Forest Change v1.11 dataset (2000~2023) (https://glad.earthengine.app/view/global-forest-change). The aridity index (AI) data were obtained from the global 0.5° resolution dataset produced by Yao et al. (2024).
Methods
LandTrendr algorithm
This study employed the LandTrendr (LT) algorithm to detect disturbance and recovery (Kennedy et al., 2010, 2018). The core of LT lies in decomposing annual spectral trajectories from Landsat observations into linear segments at the pixel level, allowing for the extraction of multiple disturbance-related parameters. The LT function includes nine parameters (Table 1).
LandTrendr parameters.
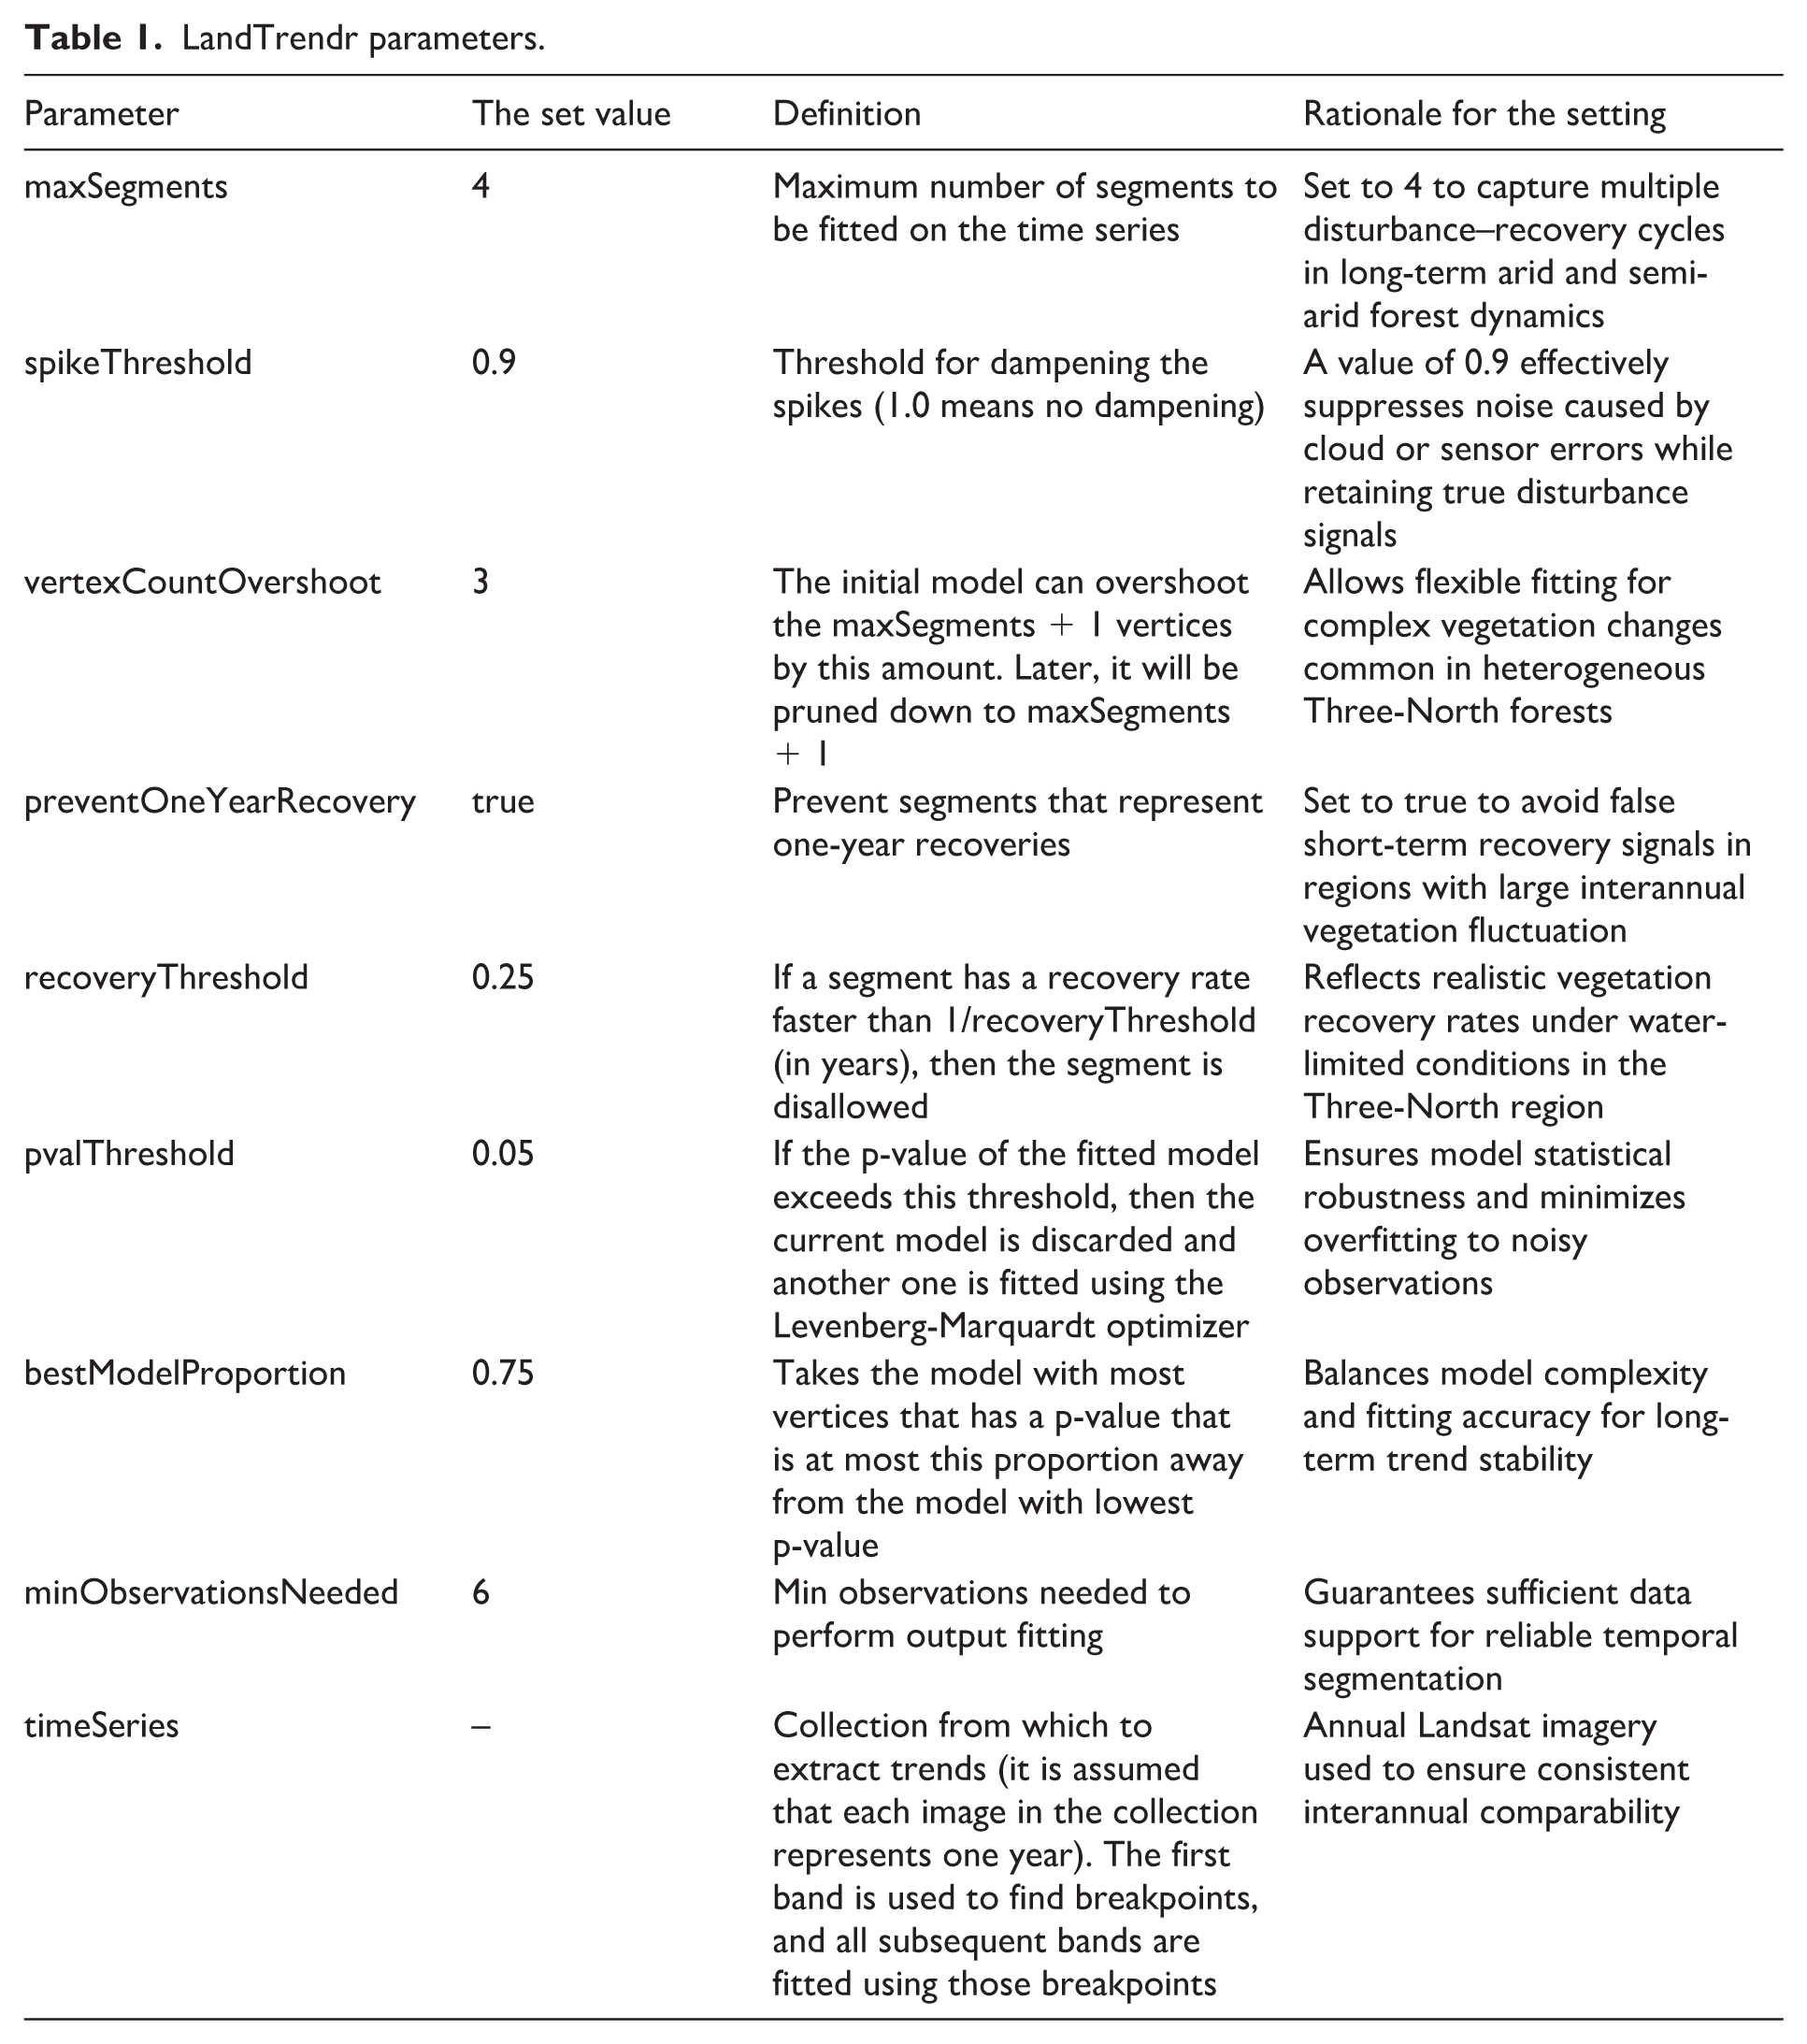
Four spectral indices (NDVI, NBR, SWIR1, SWIR2) were added to the annual Landsat time series on the GEE platform, and the LT algorithm was applied to extract disturbance parameters at the pixel level. These include the pre-disturbance spectral value (preval), magnitude of change (mag), duration (dur), rate of change (rate), and signal-to-noise ratio (dsnr). The year of disturbance (yod) was determined from the onset of spectral change, resulting in six parameters for each index. Pixels were identified as degraded when the duration exceeded three years and the magnitude was greater than one-tenth of the maximum pixel value. To improve model accuracy, the top three disturbance segments with the largest magnitude were retained for each degraded pixel, generating parameter layers for subsequent random forest classification.
Random Forest model for disturbance classification
The median of the yod parameters from the four spectral indices (NDVI_yod, NBR_yod, SWIR1_yod, and SWIR2_yod) was used to determine the disturbance year. These identified pixels were matched with the “lossyear” band of the Hansen Global Forest Change v1.11 (2000–2023) dataset based on year and location, yielding 5,322 degraded sample points. To avoid excessive spatial clustering of non-degraded samples — which could introduce bias into subsequent classification — we uniformly sampled non-degraded points across the entire Three-North Shelterbelt region at a 10km resolution from the unmatched pixels. This resulted in 7,314 total samples. Each sample was assigned its geographic coordinates and linked with 20 disturbance parameters (NDVI_preval, NDVI_mag, NDVI_dur, NDVI_rate, NDVI_dsnr, NBR_preval, NBR_mag, NBR_dur, NBR_rate, NBR_dsnr, SWIR1_preval, SWIR1_mag, SWIR1_dur, SWIR1_rate, SWIR1_dsnr, SWIR2_preval, SWIR2_mag, SWIR2_dur, SWIR2_rate, SWIR2_dsnr) for training the Random Forest classification model.
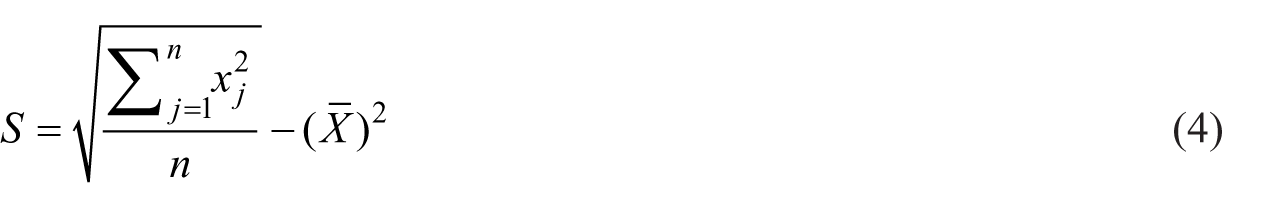
The Random Forest (RF) was used to categorize each pixel as degraded or non-degraded (Breiman, 2001). For a classification problem with

where mode denotes the most frequent class.
The dataset consisted of degraded and non-degraded samples along with 20 disturbance-related parameters derived from LT. It was divided into 70% training data and 30% testing data. The RF model was trained using the training subset and then applied annually based on the disturbance year (yod) and its corresponding 20 parameters to identify degraded forest pixels across the Three-North Shelterbelt from 1991 to 2021. Classification accuracy and reliability were evaluated using the confusion matrix and Kappa coefficient to ensure robustness.
Spatial hotspots analysis
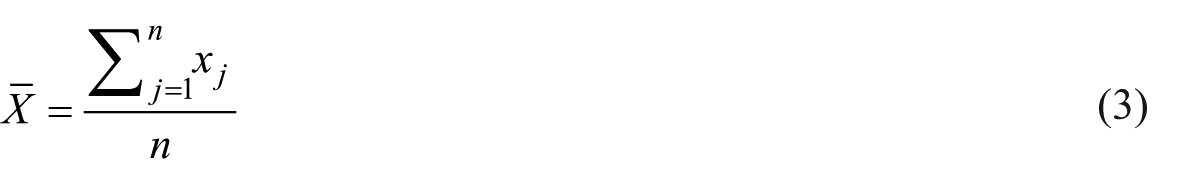
For local spatial analysis, Hotspot Analysis (Getis-Ord Gi*) was conducted to identify high- and low-value clusters. A positive Z-score indicates clustering of high values (hotspots), while a negative Z-score indicates clustering of low values (cold spots) (Peeters et al., 2015).
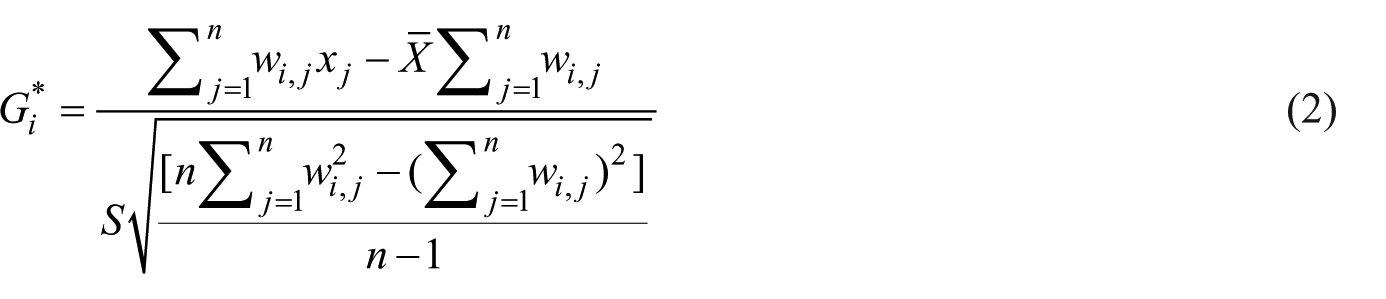
The
Aridity gradient classification
To investigate the influence of aridity gradients on forest degradation characteristics in the Three-North Shelterbelt, this study classified climatic zones based on the Aridity Index (AI) and analyzed differences in degradation features across various climate types. The AI ranges and corresponding climate classifications are shown in Table 2.
Aridity Index and climate classifications.
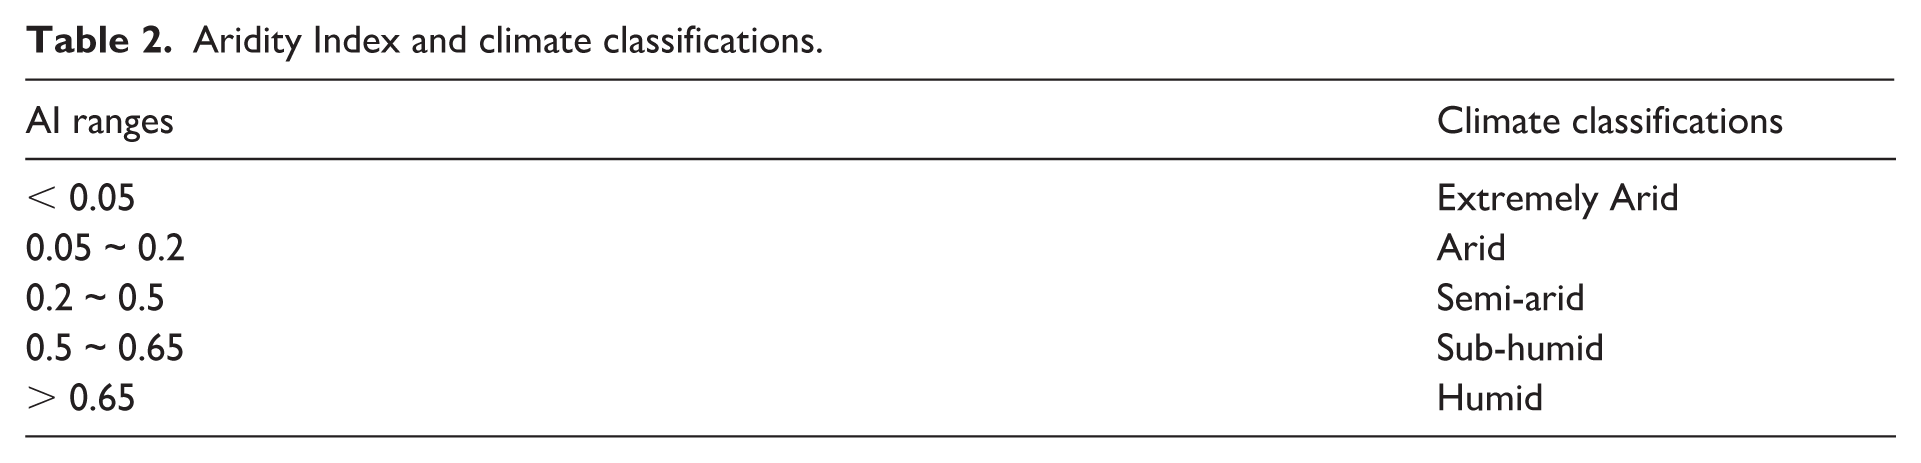
Based on these climatic divisions, the study calculated the average degradation duration, average NDVI degradation magnitude, and average NDVI degradation rate for forests in five climatic zones: extremely arid, arid, semi-arid, sub-humid, and humid regions.
Results
Validation of the disturbance classification
Overall Accuracy (OA) and the Kappa coefficient were used to evaluate the performance of the Random Forest (RF) classification model in detecting forest disturbances within the Three-North Shelterbelt. Results show that the model achieved an OA of 0.98 and a Kappa coefficient of 0.95 on the training dataset, indicating excellent model fitting. On the testing dataset, the OA was 0.96 and the Kappa coefficient was 0.94, demonstrating strong generalization ability and classification stability.
Using the Gini Impurity Decrease method, the importance of 20 classification variables was calculated (Figure 2). Results show that NDVI_preval had the highest Gini decrease value (49.061). The NDVI and SWIR indices performed best overall, with average Gini decreases of 33.30 (NDVI), 31.09 (SWIR1), and 29.45 (SWIR2), all higher than that of NBR (26.04), suggesting that NDVI- and SWIR-derived features play more critical roles in classification. The second and third most important variables, NBR_dur and NDVI_dur, highlight the significance of disturbance duration in identifying forest degradation, emphasizing that both the magnitude and temporal dimension of change should be considered. Other variables such as SWIR1_dsnr, SWIR1_dur, and SWIR2_dsnr also demonstrated high importance, reinforcing the effectiveness of shortwave infrared information in disturbance detection.
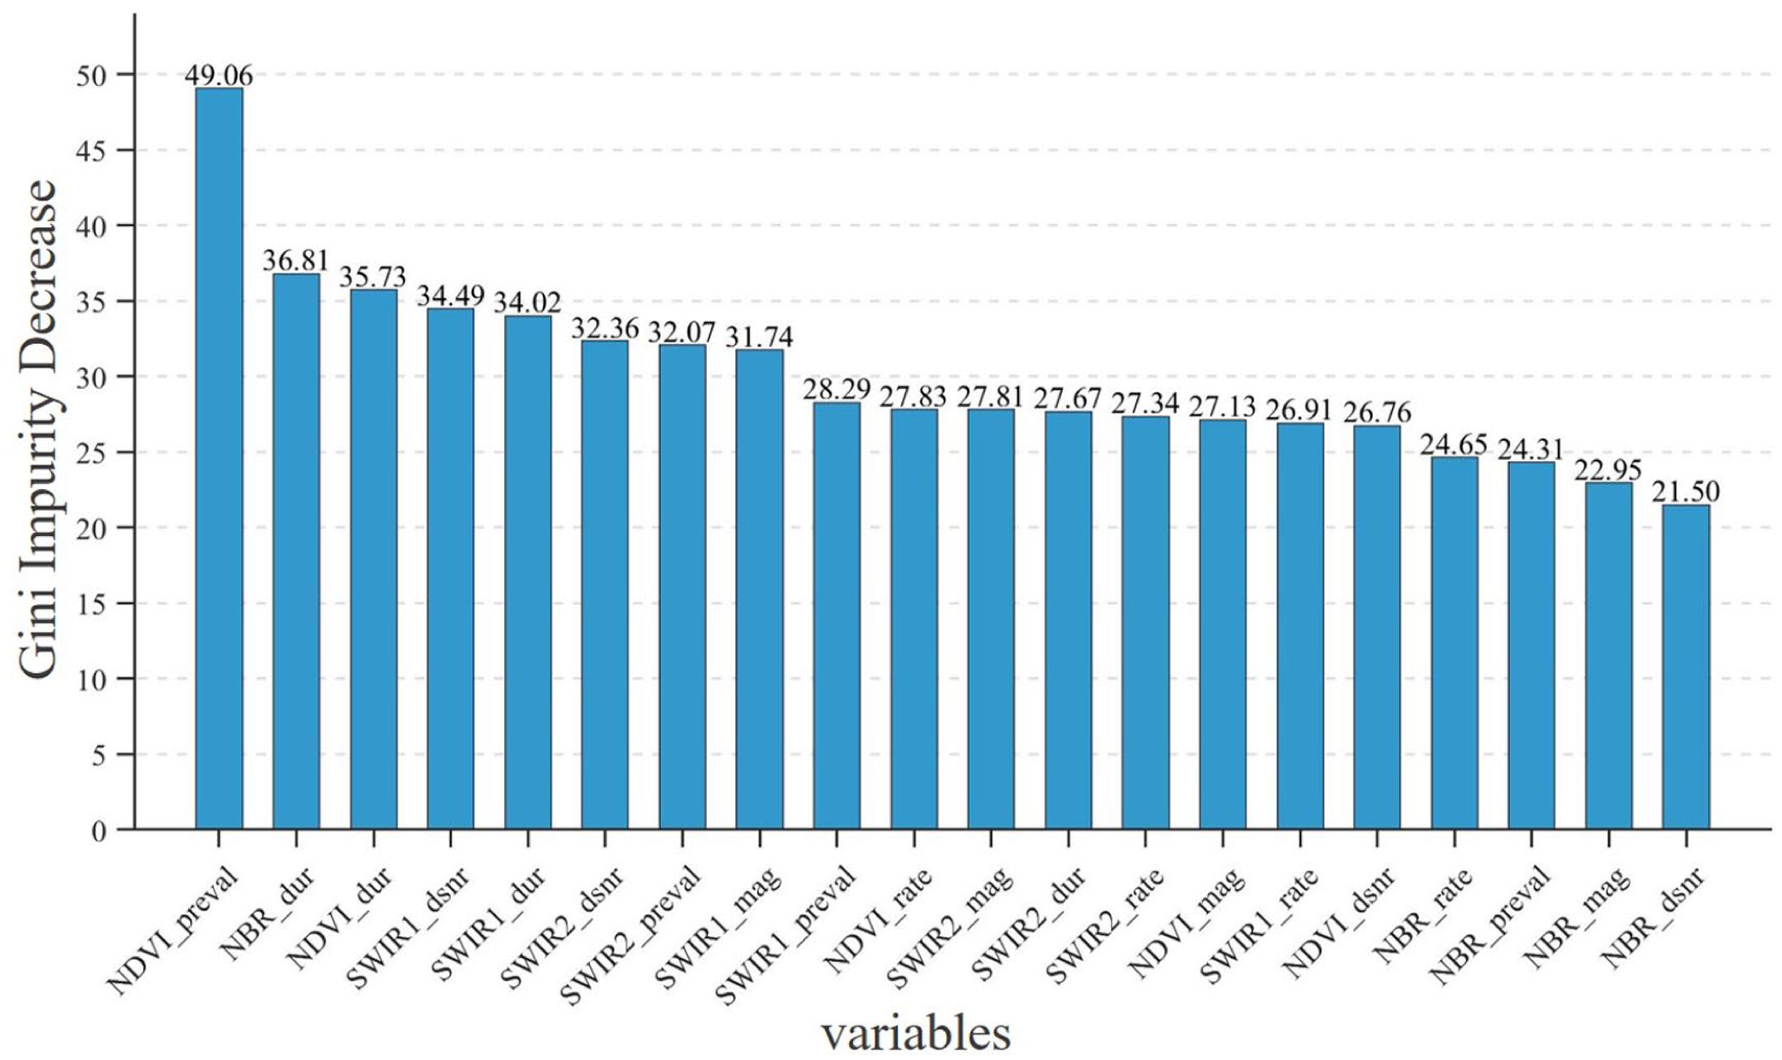
Relative importance of different variables in detecting forest disturbances in RF model.
Spatiotemporal patterns of forest disturbance
Forest degradation caused by disturbances occurred widely across the Three-North Shelterbelt from 1991 to 2021 (Figure 3). Degradation areas were mainly concentrated in the Greater Khingan Mountains, Changbai Mountains, the mountainous and gully regions of the Loess Plateau, and the Altay Mountains, showing significant spatial heterogeneity.
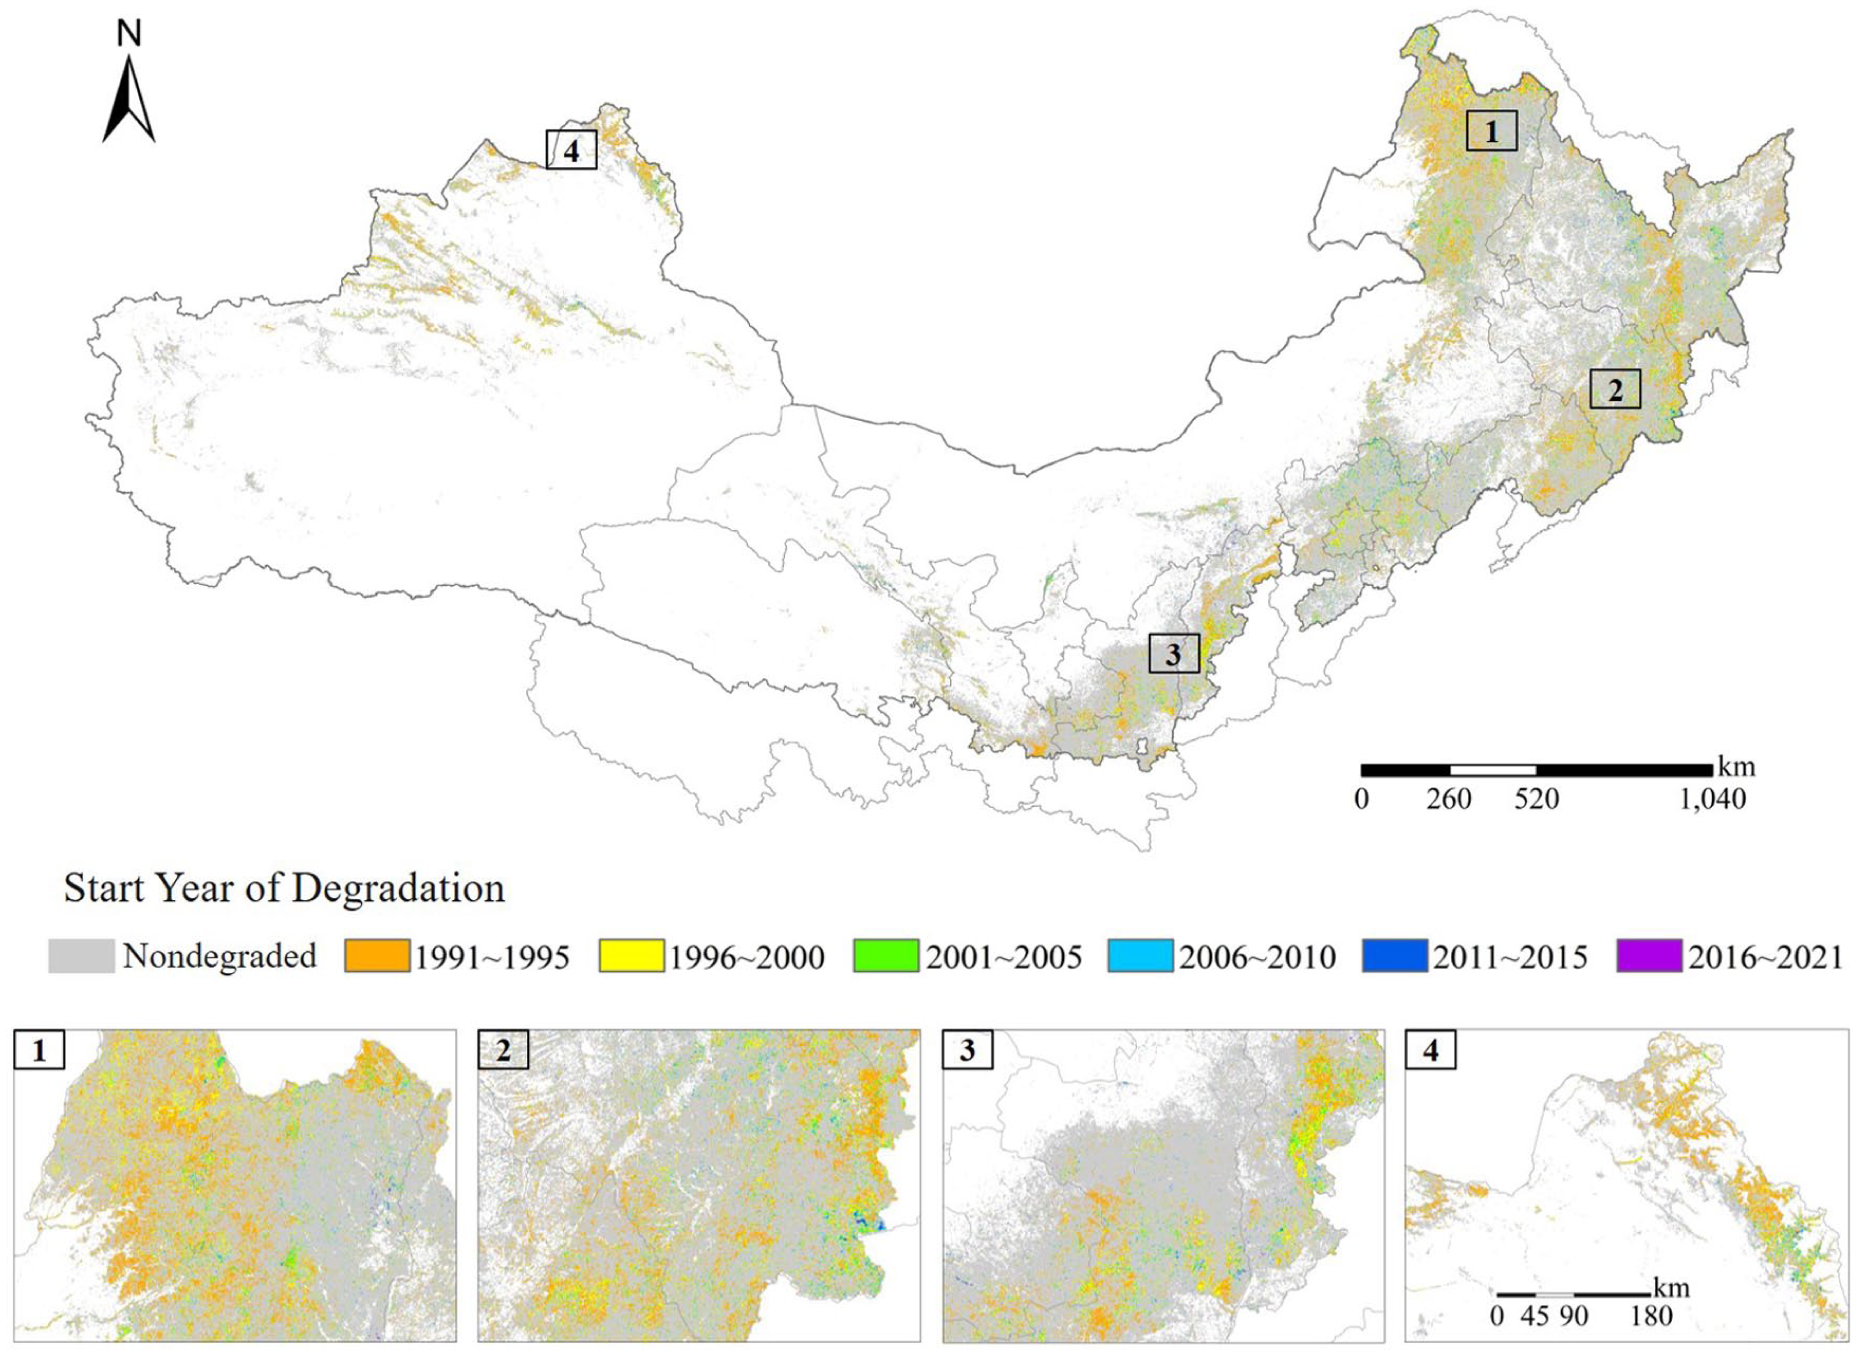
Spatial distribution map of forest degradation in the TNSF (1991–2021).
From 1991 to 2021, the total degraded forest area reached 3.10 × 10⁵ km2, accounting for 17.84% of the total forested area. The spatial distribution of degradation onset years also varied notably. Early degradation during 1991–2000 accounted for 13.65% of the total forested area, mainly concentrated in the central and northern parts of the Greater Khingan Mountains, Changbai Mountains, and Altay Mountains. Regions such as the transitional zone between the Changbai Mountain foothills and the Sanjiang Plain, the southern Northeast China Plain–Yanshan–northern North China Plain, and the hilly and gully areas of the Loess Plateau mainly experienced degradation onset during 2001–2010, representing 3.76% of the total forested area. In contrast, areas where degradation began in the last decade (2011–2021) were relatively limited, accounting for only 0.43% of the total forested area, mainly distributed along the boundary between the Inner Mongolia Plateau and the Loess Plateau, as well as the transition zone between the Lesser Khingan Mountains and the Songnen Plain. Additionally, several small but densely degraded subregions with concentrated onset years were identified, such as the northern slopes of the Tianshan Mountains and the northwestern part of the Qinling Mountains.
The peak period of forest degradation in the Three-North Shelterbelt occurred between 1991 and 1995. Among these, the largest annual increase in degraded area occurred in 1992, reaching 4.06 × 10⁴ km2, followed by 1993 with 3.69 × 10⁴ km2 (Figure 4). The average annual increase in degraded area accounted for 0.58% of the total forest area, lower than the national average disturbed forest proportion (1.16 ± 0.41%) (Liu et al., 2023b). The annual newly degraded area has declined steadily since 1992, and after 2015, the newly degraded forest pixels approached 7 km2. This trend indicates that with the continuous advancement of the TNSFP, ecological protection and restoration efforts have achieved significant results, effectively curbing forest degradation. Overall, the emergence of new degraded areas shows an exponentially decreasing dynamic trend (R2 = 0.9941, p < 0.0001).
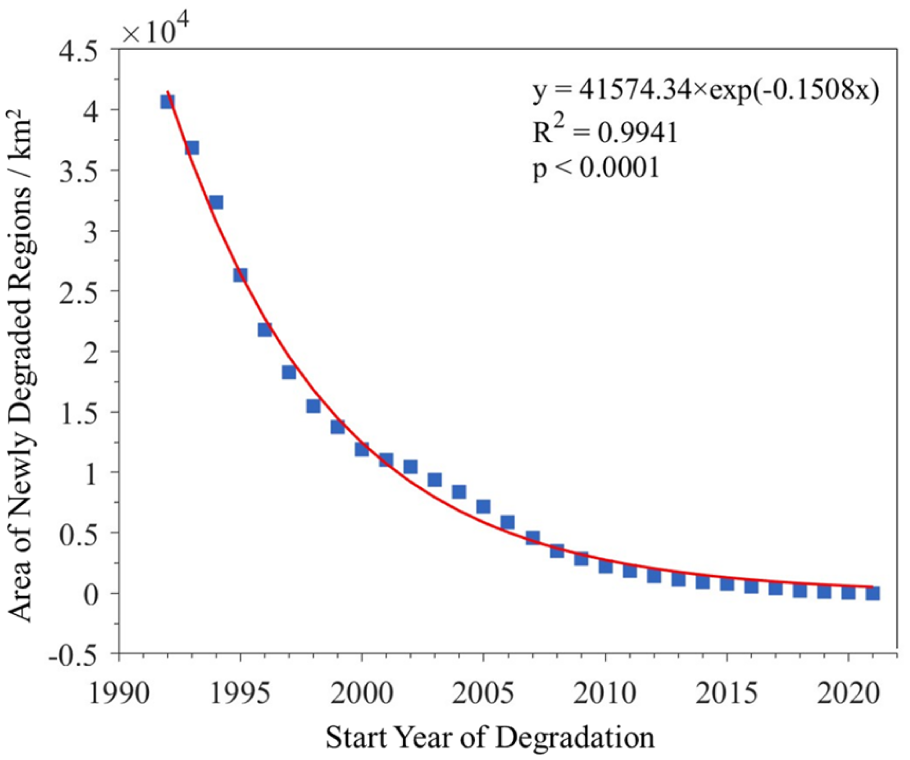
Area of newly degraded forest regions (1991–2021).
Spatiotemporal characteristics of forest degradation
Based on the parameters related to degradation obtained from the LT algorithm, Degradation Duration, NDVI Degradation Magnitude, and NDVI Degradation Rate of the forest degradation process were identified in the Three-North Shelterbelt from 1991 to 2021 (Figure 5).
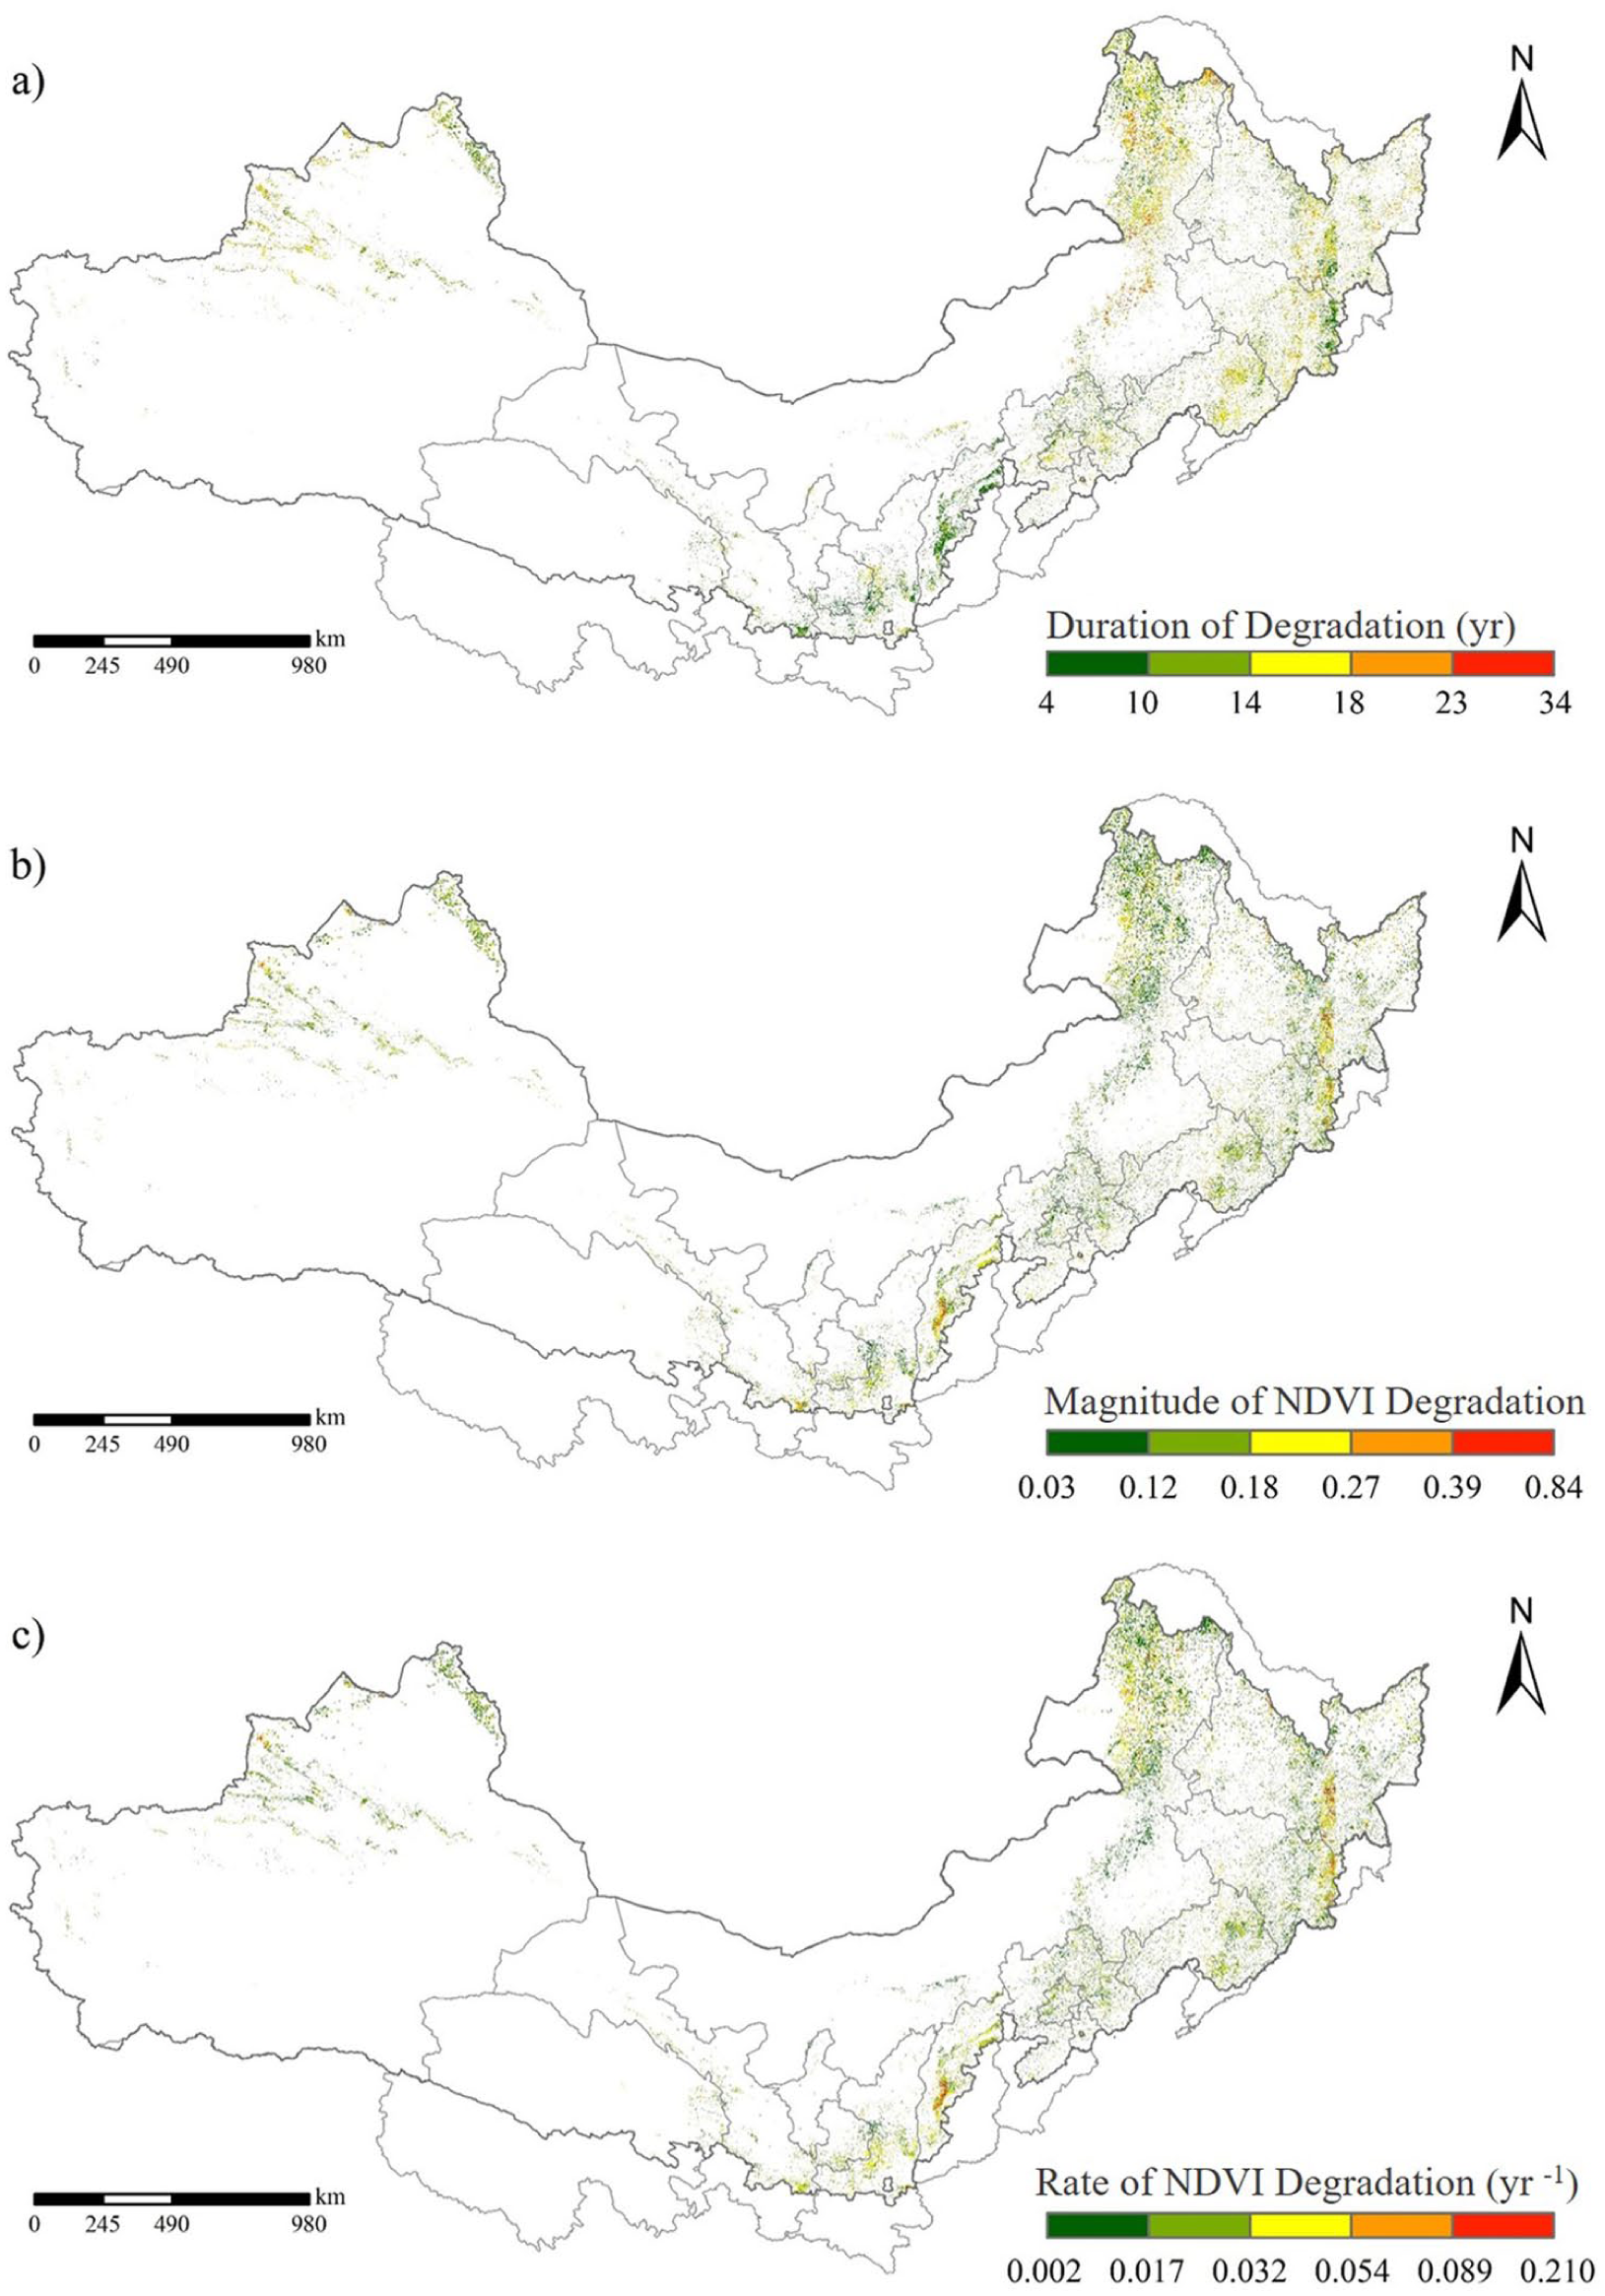
Spatial distribution characteristics of forest degradation. (a) Duration of degradation. (b) Magnitude of NDVI degradation. (c) Rate of NDVI degradation.
The degradation duration exhibits strong spatial heterogeneity across the TNSFP region (Figure 5a). The average degradation duration is 13 years, indicating that most forests have experienced relatively long-term disturbance processes. Areas with durations ⩾18 years cover approximately 5.70×10⁴ km2 (accounting for 18.37% of the total degraded area), while regions with durations ⩾23 years cover 1.52×10⁴ km2 (4.89%). These long-duration areas are mainly distributed in northeastern Inner Mongolia, the eastern Northeast China Plain, the southern Changbai Mountains, and the Tianshan Mountains in Xinjiang. Prolonged degradation in these regions suggests sustained natural stressors—such as persistent droughts and repeated disturbances—with relatively weak vegetation recovery capacity. In contrast, shorter degradation durations occur in the hilly and gully areas of the Loess Plateau and along the northern edge of the Changbai Mountains, reflecting relatively fast recovery following less intense or more transient disturbances.
The NDVI degradation magnitude also shows clear spatial variation (Figure 5b). The average magnitude is 0.16, with a maximum of 0.84, indicating substantial vegetation cover loss in some areas. Regions with magnitude ⩾ 0.27 account for 7.48% of the total degraded area (2.32×10⁴ km2), while those with magnitude ⩾0.39 represent 1.82% (0.56×10⁴ km2). Large-magnitude degradation mainly occurs in the hilly and gully areas of the Loess Plateau, the northern edge of Changbai Mountain and northeastern Inner Mongolia, where intensive human activity, drought stress, and land-use changes have likely accelerated vegetation loss. Moderate-to-low magnitudes are found in the eastern Inner Mongolia and Sanjiang Plain, where climatic conditions are relatively cold and humid, limiting rapid NDVI declines but extending the degradation process over time. These spatial differences suggest that degradation intensity is closely related to climatic gradients and land-use pressures.
The degradation rate, which represents the speed of vegetation loss per unit time, has an average of 0.025yr–1 and a maximum of 0.210 yr–1 (Figure 5c). Regions with rates ⩾0.054 yr–1 cover 2.41×10⁴ km2 (7.78%) and those with rates ⩾0.089 yr–1 cover 0.52×10⁴ km2 (1.68%). The northwestern margin of the Tianshan Mountains and the western Greater Khingan Mountains show high rates, where disturbances are abrupt and intense—such as high-temperature droughts or large-scale wildfires—causing rapid vegetation loss but occasionally allowing faster recovery afterward. In contrast, areas with lower degradation rates are concentrated in the northeastern and eastern TNSFP regions, where degradation progresses slowly, reflecting gradual ecological decline under long-term climatic constraints.
Overall, there are differences in degradation mechanisms and manifestations across different regions of the TNSFP. The northeastern regions are mainly characterized by long durations, moderate magnitudes, and slow rates of degradation, presenting a slow-evolving degradation pattern. The Loess Plateau and the northern edge of the Changbai Mountains are characterized by large magnitudes and fast rates of degradation, exhibiting a rapid and intense degradation pattern. The northwest arid region, although having relatively low degradation rates and magnitudes, shows weak ecological recovery ability, presenting characteristics of ecological vulnerability. The spatial differences in these characteristics can provide a scientific basis for targeted governance and restoration strategies in subsequent ecological protection efforts.
Hotspots of forest degradation magnitude
The results of the hotspot analysis are shown in Figure 6. The NDVI degradation magnitude of the degraded areas in the Three-North Shelterbelt exhibits three types of spatial relationships: high–high clustering (hotspots), low–low clustering (cold spots), and high–low clustering (non-significant areas).
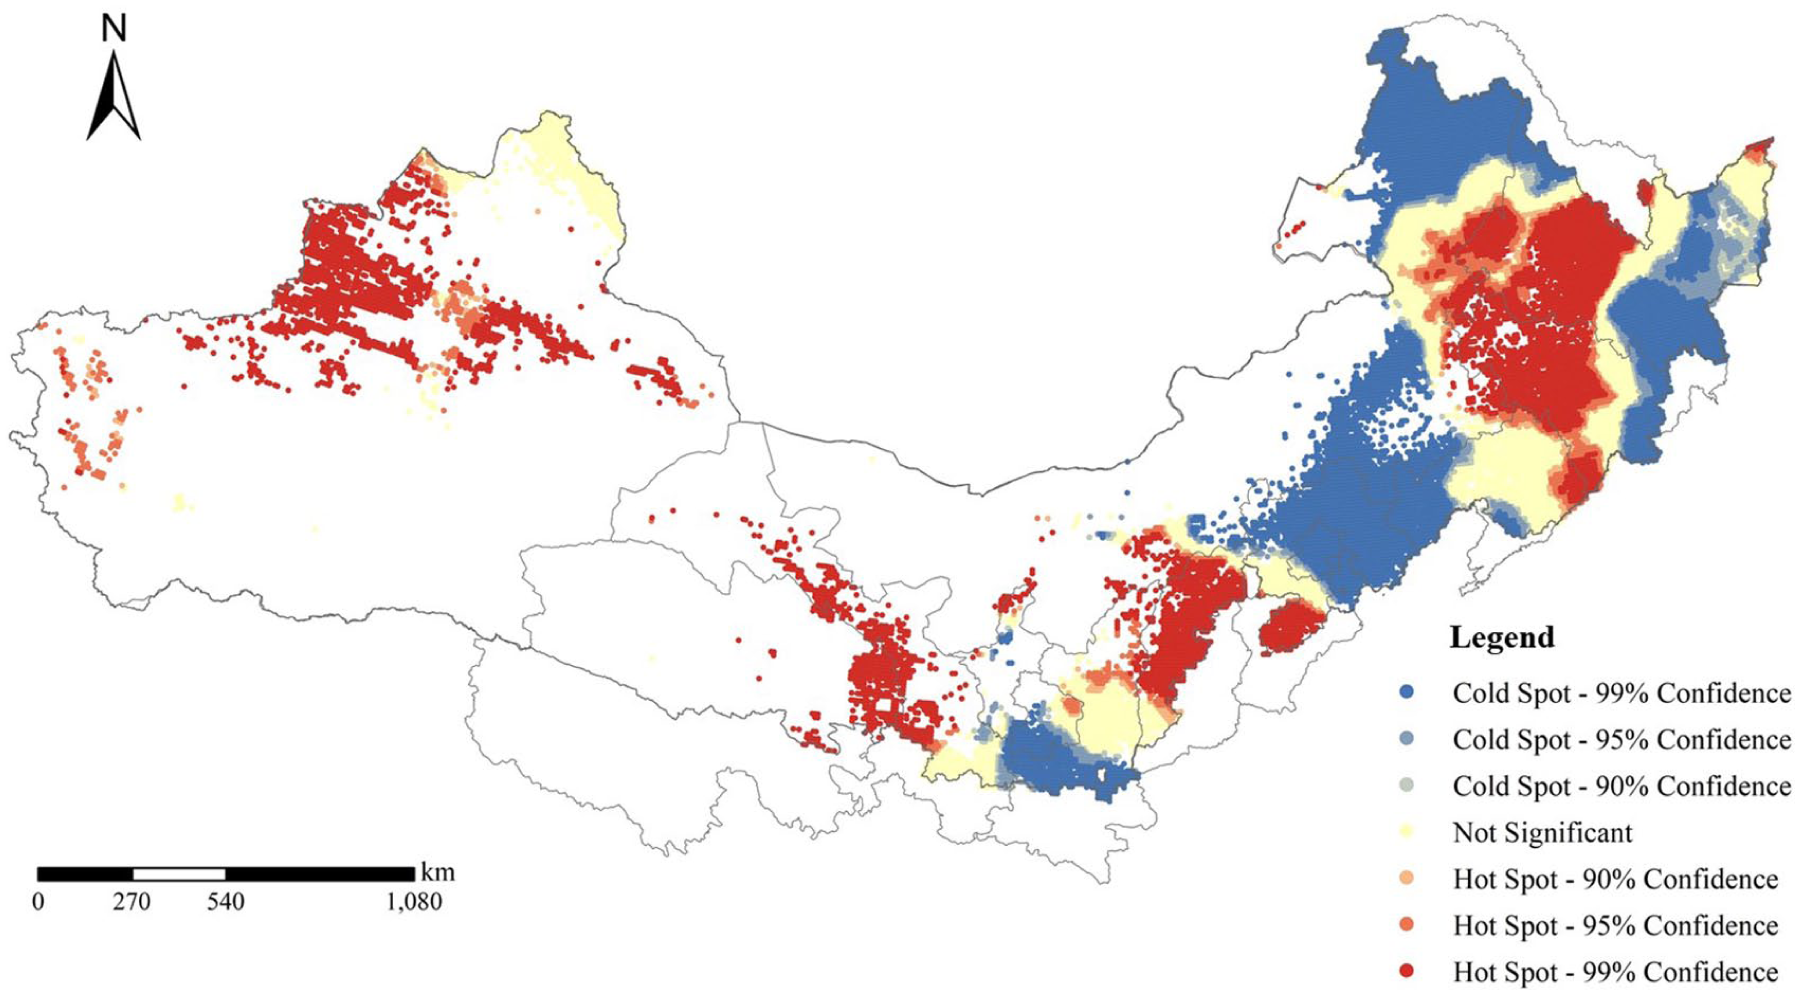
NDVI degradation magnitude hot spot and cold spot distribution.
The hotspot areas of forest degradation cover approximately 1.12×10⁵ km2, accounting for 36.26% of the total degraded forest area, are mainly concentrated in the central Northeast China Plain, central Hebei, western and northern Shanxi, the border region between Gansu and Qinghai, and northwestern Xinjiang. The cold spot areas occupy about 1.23×10⁵ km2, representing 39.79% of the total degraded forest area, are primarily distributed in northeastern Inner Mongolia, the eastern Changbai Mountains, the northern Beijing–Tianjin–Hebei region, and central Shaanxi. The remaining non-significant areas cover roughly 0.74×10⁵ km2, accounting for 23.94%. The results of the local spatial analysis reveal the spatial heterogeneity of the degradation magnitude. The spatial clustering of hotspots provides important references for the identification of key areas for ecological restoration. Moreover, the distribution patterns of hot and cold spots indirectly reflect regional differences in ecological vulnerability, offering valuable insights for targeted and differentiated management strategies.
Differences in forest degradation under aridity gradients
To investigate the influence of aridity gradients on forest degradation characteristics within the Three-North Shelterbelt, the degraded forests were categorized into five climatic types: extremely arid, arid, semi-arid, sub-humid, and humid (Figure 7).
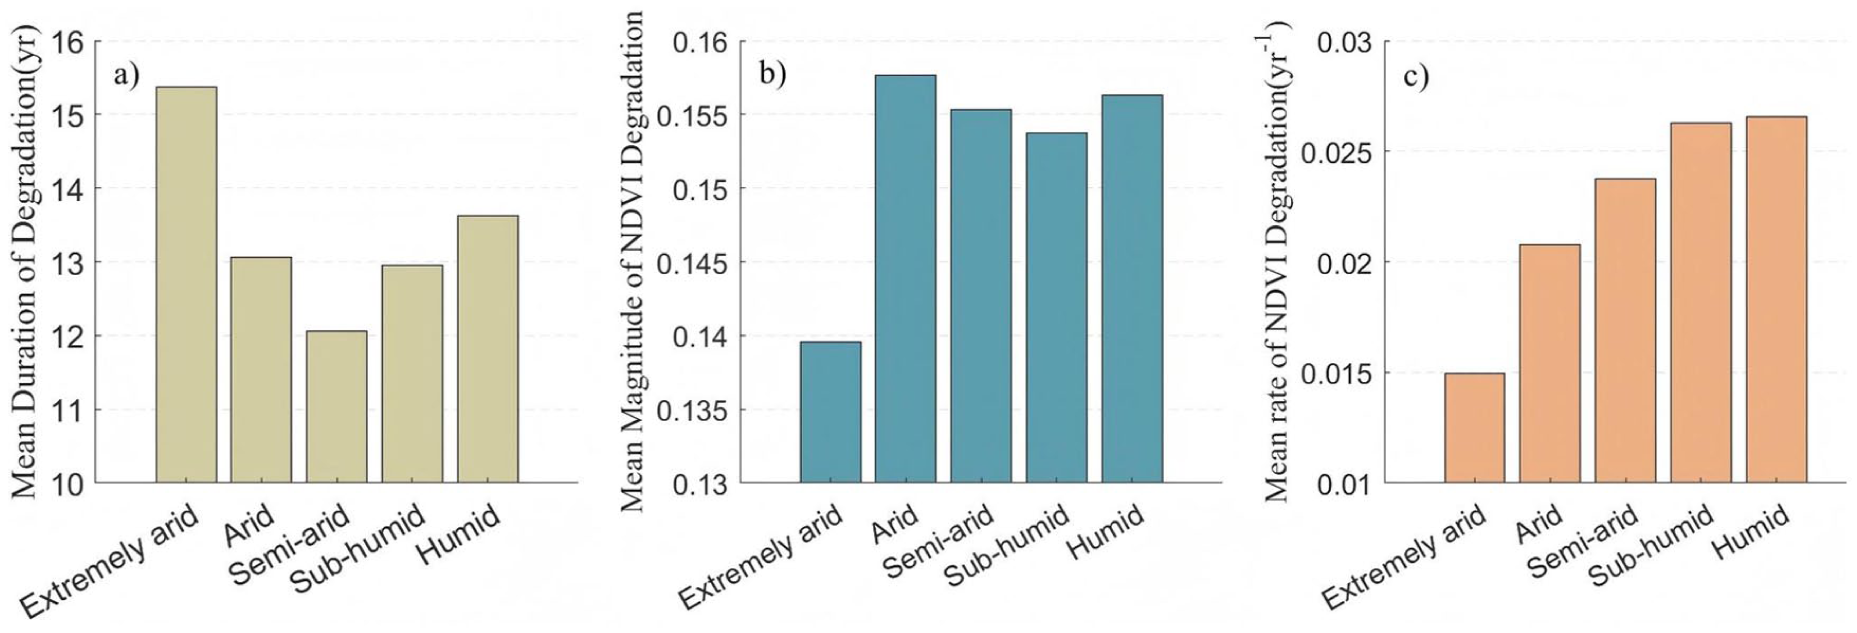
Forest degradation characteristics across drought gradients in the TNSF. (a) Average degradation duration. (b) Average NDVI degradation magnitude. (c) Average NDVI degradation rate.
Figure 7(a) shows that the average degradation duration is the longest in the extremely arid zone, exceeding 15 years, which is significantly higher than in other climatic regions. In contrast, the semi-arid and sub-humid zones exhibit shorter durations, approximately 12~13 years. As shown in Figure 7(b), the extremely arid zone has the lowest NDVI degradation magnitude, while the arid zone shows the highest. The degradation magnitudes in the semi-arid, sub-humid, and humid zones are relatively similar, with only minor differences. Figure 7(c) indicates that the NDVI degradation rate gradually increases from extremely arid to humid regions. The extremely arid zone shows the lowest rate, whereas the humid zone exhibits the highest degradation rate, exceeding 0.025 per year.
Forest degradation characteristics varied significantly across different aridity zones. In the extremely arid regions, degradation lasted the longest, but both the NDVI degradation magnitude and rate were the lowest, indicating a slow and limited degradation process. In contrast, the arid regions exhibited shorter degradation durations but higher magnitudes, while the humid and sub-humid regions showed the fastest degradation rates, likely reflecting the effects of strong human disturbances or abrupt high-temperature and drought events on ecosystems. These findings suggest that aridity gradients not only influence the vulnerability of forest ecosystems but also strongly affect the patterns and responses of the degradation process.
Discussion
Remote sensing for forest degradation detection
Using Landsat time-series imagery, this study applied the LandTrendr algorithm combined with the Random Forest model to identify forest degradation events across the Three-North Shelterbelt from 1991 to 2021.To ensure the scientific validity and credibility of the results, a comprehensive assessment was conducted focusing on the method’s applicability and comparison with existing research findings. As a segmented fitting algorithm designed for time-series change detection, LT effectively captures both abrupt and gradual vegetation disturbances. Previous studies have demonstrated its strong performance not only in detecting small- to medium-scale land cover changes but also in identifying large-scale forest disturbances such as fires, pest outbreaks, and logging (Mugiraneza et al., 2020). Accuracy assessments of LT indicate an overall accuracy of up to 93% for distinguishing disturbed and stable pixels, and 89% accuracy in detecting the year of disturbance (Yin et al., 2020). Therefore, applying LT to identify forest disturbances in the Three-North Shelterbelt is highly reliable.
Moreover, this study integrated multiple spectral indices for time-series analysis, overcoming the limitations of traditional single-index approaches in capturing complex disturbance processes. The use of multi-index integration provides a more comprehensive characterization of disturbance dynamics, thereby improving both accuracy and stability of the results. This approach is also broadly applicable to land cover change detection across different ecological zones (Cohen et al., 2017; Mugiraneza et al., 2020).
The results of this study show that most forest degradation in the Three-North Shelterbelt began between 1991 and 1995, during which newly degraded areas were extensive and widely distributed, followed by a secondary peak from 1996 to 2000. Over time, the extent of new degradation gradually decreased, and disturbance areas became more spatially concentrated. Most tree species planted in the TNSFP have a vigorous growth period of approximately 5–10 years. Since the program began in 1979, these forests have gradually transitioned from vigorous growth to mature and overmatured stages, during which physiological aging—manifested as growth stagnation, branch atrophy, and even mortality—led to evident degradation in the 1990s (Ma, 2016). In addition, early shelterbelt stands were often of low quality, with extensive management, limited tending and maintenance, and a lack of site–species suitability principles. The large-scale introduction of non-native species poorly adapted to local environments further contributed to severe degradation (Song et al., 2022; Zheng et al., 2012; Zhu and Zheng, 2019). With the continuous advancement of the Three-North Shelterbelt Project, these issues have gradually improved. Previous studies indicate that land degradation intensity across the project area has generally declined over time, and degradation in most regions has alleviated (Huang et al., 2012), consistent with the findings of this study. During the second construction phase (2001–2020), forest area increased and ecosystem quality improved. However, due to the reduction of high-quality afforestation sites and limitations in natural conditions, the difficulty of afforestation is increasing. Additionally, the influence of climate disturbances and other environmental factors led to new localized degradation in some regions (Ji et al., 2022). Overall, the use of remote sensing technology can be effective to accurately reflect the dynamic changes in forest conditions within the Three-North Shelterbelt.
To further confirm the reliability of the research results, two representative sites were selected for visual ground verification — one located in the Greater Khingan region and the other on the edge of the Northeast Plain. Based on the degradation results derived from the integration of multispectral indices (NDVI, NBR, SWIR1, SWIR2) with the LandTrendr algorithm and Random Forest classification, Landsat images from 1991 (Figure 8(a)) and 1995 (Figure 8(b)) were selected for the Greater Khingan site, and images from 1996 (Figure 8(c)) and 2000 (Figure 8(d)) were selected for the Northeast Plain site. The ground verification results indicate that significant forest degradation occurred in the Greater Khingan site between 1991 and 1995, while noticeable vegetation degradation took place in the Northeast Plain site between 1996 and 2000. These findings are consistent with the degradation years identified in this study, thereby confirming the reliability of the results.
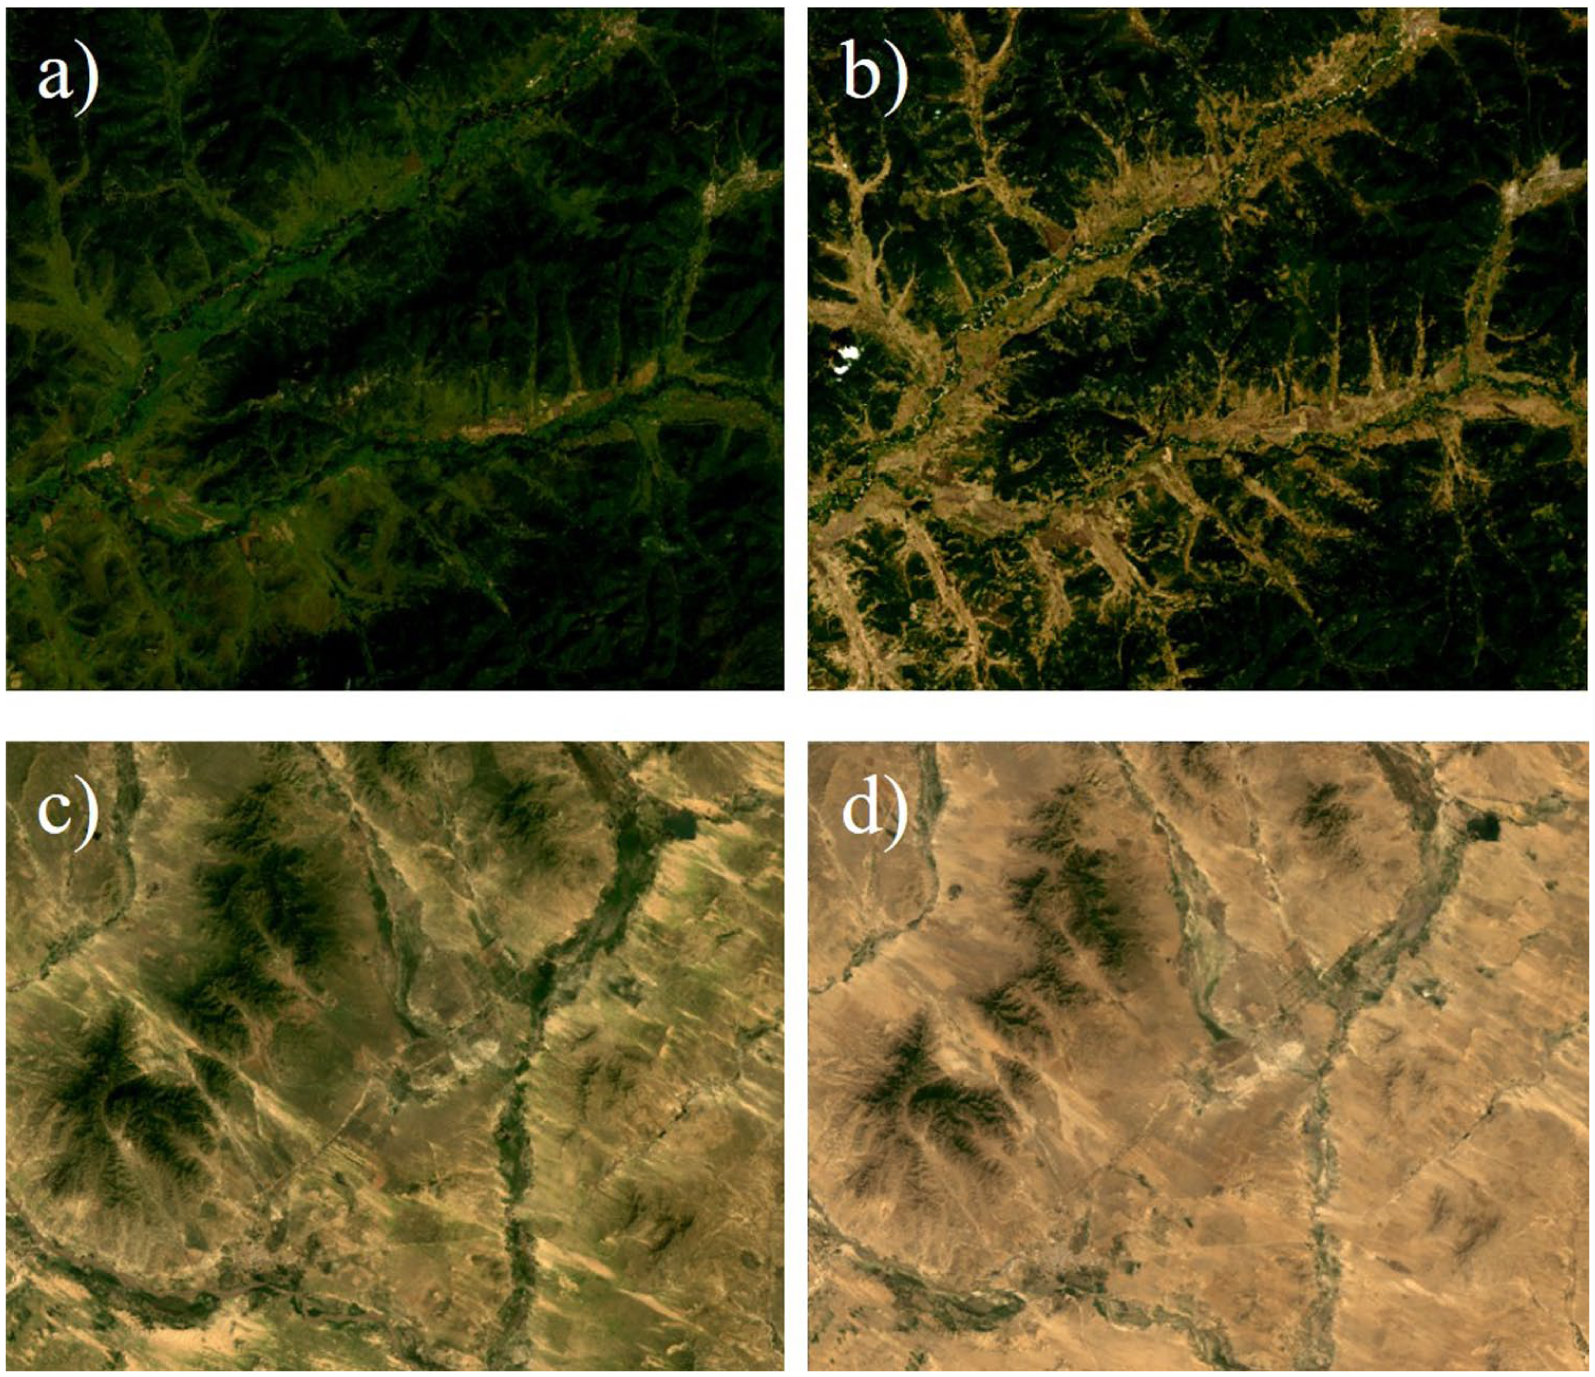
The degradation between (a) 1991 and (b) 1995 in the sample site located in the Greater Khingan region, and between (c) 1996 and (d) 2000 in the sample site located on the edge of the Northeast Plain.
Implications of degradation differences across climate zones
The TNSFP spans a vast area encompassing a wide range of climatic conditions, from extremely arid to humid zones. Significant differences in precipitation, temperature, evapotranspiration, and vegetation types across these regions directly affect the stability and recovery capacity of forest ecosystems, leading to distinct degradation characteristics under different climatic conditions. This study indicates that the arid regions exhibited the highest average degradation magnitude, while the extremely arid regions generally experienced longer degradation durations but with lower magnitudes and rates. In contrast, the humid regions showed both higher degradation magnitudes and faster degradation rates. These differences reflect not only the regulating effect of natural environmental conditions on the degradation process but also reveal the coupling relationship between disturbance intensity and ecosystem vulnerability.
The Three-North Shelterbelt lies primarily within arid and semi-arid regions, where most areas receive less than 400 mm of annual precipitation, and trees remain in a prolonged state of sub-healthy drought stress. Since the 1980s, drought conditions have intensified, with the increasing frequency of extreme heat and drought events leading to higher rates of forest degradation and mortality (Allen et al., 2010), while the extent of arid zones has also expanded (Li et al., 2021). Consequently, forests in arid regions are more prone to severe degradation, and the lack of management and maintenance practices further amplifies the impacts of disturbance events (Cui et al., 2025). In the extremely arid regions, forest distribution is scarce, and degradation primarily occurs along the southeastern margin of the Tianshan Mountains. Harsh climatic conditions and fragile ecosystems limit self-recovery capacity, making it difficult for degradation processes to reverse over short timescales, resulting in prolonged degradation durations. However, since vegetation coverage in extremely arid areas is inherently low, even noticeable degradation produces only a modest decline in NDVI. More importantly, vegetation in these regions has evolved strong resilience to cope with persistent drought stress (Wang et al., 2024c). Such long-term adaptation is likely reflected in changes to vegetation density and certain genetic traits, enabling plants to maintain relatively stable growth and slowing the rate of degradation (Gleason et al., 2017; López et al., 2013). In contrast, vegetation in humid regions, having rarely experienced prolonged droughts, exhibits weaker drought resistance. Moreover, as vegetation coverage increases, plant communities become more sensitive to short-term droughts. Compared with arid, semi-arid, and extremely arid zones, the humid regions are more affected by short-term drought variability (Liu et al., 2023a). Forest ecosystems in humid and sub-humid areas generally have stable structures and high vegetation cover, yet when exposed to sudden drought events, their NDVI values can drop sharply within a short period, resulting in high degradation rates. In the Three-North region, humid zones are predominantly covered by broad-leaved forests, whereas arid areas are mainly dominated by coniferous species. After afforestation in the Three-North area, soil moisture depletion under broad-leaved forests was found to be significantly greater than that under coniferous forests (Wang et al., 2024b). In the humid eastern part of the Three-North Shelterbelt, broad-leaved species tend to recover better after droughts due to their deep and complex root systems, which enable them to access deeper soil water sources compared to conifers. Coniferous trees, on the other hand, exhibit stronger drought resistance, with xylem highly resistant to embolism and the ability to close stomata to prevent dehydration and hydraulic failure (Au et al., 2022; Jin et al., 2023; Li et al., 2024). Therefore, following drought and other disturbances, differences in baseline environmental conditions and tree species composition lead to distinct degradation patterns across different climatic zones.
Forests in the TNSFP region are predominantly plantations, distributed across arid and semi-arid ecological fragile zones in northern China that are severely affected by wind erosion and desertification, where natural vegetation is generally sparse. In the semi-arid sandy areas of Northeast China, contrasting patterns are observed between natural and plantation coniferous forests. Compared with the native species Pinus tabuliformis, the introduced Pinus sylvestris var. mongolica exhibits higher water consumption and poorer control of transpiration under drought conditions, making it more prone to withering during extreme drought years (Song et al., 2022). Similarly, in the sandy regions of Northeast China, plantations dominated by the introduced species Populus beijingensis show a more pronounced decline in both tree-ring width index (RWI) and Normalized Difference Vegetation Index (NDVI) under extreme drought, compared with natural forests dominated by native species such as Acer mono Maxim. and Quercus mongolica (Shi et al., 2024). Native species, having developed water-defense mechanisms highly adapted to local environments through long-term natural evolution, demonstrate greater stability under extreme drought conditions (Sun et al., 2024). Compared with natural forests, plantations are typically monocultures with shallow root systems, low biodiversity, and simple stand structures, resulting in weaker drought resistance and recovery capacity. Consequently, they are more prone to mortality and degradation under prolonged drought stress (Ma et al., 2025). The Three-North region is characterized by low precipitation and intense evapotranspiration, leading to a water imbalance, while plantations have higher water demands. At the same time, climate warming has intensified the frequency of extreme drought events, further increasing the risk of plantation degradation. The combined effects of drought, high temperatures, pests, and other compound disturbances can easily trigger large-scale degradation or vegetation type conversion in plantation forests. Overall, drought-related stress is a major driving force behind forest degradation in the Three-North Shelterbelt, and artificial forests are particularly vulnerable to such impacts. Under a clear understanding of regional water carrying capacity, tree species composition should be further optimized according to local habitat characteristics. During afforestation, the proportion of native species should be increased, as their physiological mechanisms are better adapted to regional hydrothermal conditions and they generally exhibit greater stability than introduced species under extreme drought environments (Pang et al., 2025). Future research should place greater emphasis on understanding and mitigating the effects of drought events.
Limitation and perspectives
The study introduced aridity gradient zoning to systematically analyze the spatial heterogeneity and driving mechanisms of degradation across different climatic regions, offering a new perspective for understanding ecosystem degradation patterns in arid and semi-arid environments. An LT-based degradation detection method was developed using multiple spectral indices (NDVI, NBR, SWIR1, and SWIR2). By extracting pixel-level multi-dimensional parameters such as degradation magnitude and duration, the method enhanced the precision and detail of forest disturbance identification. By integrating the Hansen Global Forest Loss dataset, a degradation sample library was constructed to train an RF model, enabling the first long-term pixel-level detection of forest degradation across the Three-North Shelterbelt. Multiple degradation features were extracted, filling the gap in regional-scale degradation monitoring.
Despite the achievements of this study, several limitations remain, which provide directions for future improvement. Firstly, the classification of disturbance types in this study remains relatively coarse. Future research could incorporate additional datasets (e.g., fire records, pest outbreaks, and specific drought events) to explore the driving factors behind disturbance occurrences in greater depth. Secondly, the training dataset exhibited a class imbalance between degraded and non-degraded samples (5,322: 1,992). Such imbalance may potentially bias the Random Forest model toward the majority class, reducing sensitivity to non-degraded samples. To mitigate this effect, a balanced sampling strategy can be applied to adjust the model’s class-weight parameter during training to enhance classification fairness and achieve more stable classification performance across classes in the future work. Finally, building on this framework, future research could integrate ecological function assessments to develop a forest disturbance risk index, providing scientific support for precision management and prioritization of ecological restoration zones in the Three-North Shelterbelt.
Conclusion
Based on annual Landsat imagery, this study combined the LandTrendr algorithm and Random Forest classification model to identify the annual forest disturbance map (1991–2021) of the Three-North Shelterbelt. The study revealed the spatiotemporal evolution of forest disturbances in the Three-North Shelterbelt over the past 30 years. Most degradation events occurred in the 1990s, with the peak disturbance period from 1991 to 1995. The total degraded area exhibited an exponential decline over time, indicating that the TNSFP has gradually achieved positive ecological restoration outcomes. The degradation patterns indicate that different subregions of the Three-North Shelterbelt exhibit distinct degradation types: the northeastern part of the TNSFP—mainly covering the Greater Khingan Mountains, the eastern Inner Mongolia Plateau, and the eastern Northeast Plain—is characterized by slow-evolving degradation; the Loess Plateau and northern Changbai Mountains show rapid and intense degradation; and the arid northwestern areas experience ecologically fragile and long-lasting degradation, which should be prioritized for ecological restoration. Hotspot areas — mainly located in the central Northeast China Plain, central Hebei, western Shanxi, and northwestern Xinjiang — exhibited strong degradation intensity and severe disturbances. Cold spots were concentrated in northeastern Inner Mongolia and the northern Beijing–Tianjin–Hebei region, where ecological stability was relatively high. Under the aridity gradient, degradation characteristics varied significantly. These findings provide an important scientific basis for ecological restoration and zonal management within the Three-North Shelterbelt.
Footnotes
Funding
The authors disclosed receipt of the following financial support for the research, authorship, and/or publication of this article: This research was supported by the National Natural Science Foundation of China (No. W2412142), Ordos Science & Technology Plan (YF20250267), the Fundamental Research Funds for the Central Universities of China, and the Ordos Desertification Control and Sustainable Development Academician Expert Workstation.
Declaration of conflicting interests
The authors declared no potential conflicts of interest with respect to the research, authorship, and/or publication of this article.