
Abstract
Rapid urbanization in the Guangdong-Hong Kong-Macao Greater Bay Area has intensified ecological degradation, underscoring the urgent need for integrated spatial planning informed by ecosystem services (ES) assessment. This study developed a dynamic assessment framework to quantify and map five key ES—water conservation, soil retention, stormwater regulation, grain production, and carbon sequestration—from 2000 to 2015. Using the Getis-Ord Gi* spatial statistic, we identified ES hotspots and coldspots and delineated functional zones based on service importance. The results reveal a notable spatial mismatch between ES supply and administrative boundaries, with high-value clusters concentrated in the northern and peripheral regions, while the central urban basin functions as an area of low ES values. Multi-service co-protection zones were identified, particularly in Zhaoqing and eastern Huizhou, which should be prioritized in ecological protection redline delineation. This study demonstrates that ES-based spatial zoning can effectively bridge ecological science and spatial governance, offering a replicable decision-support tool for cross-jurisdictional coordination and sustainable planning in complex urban agglomerations.
Keywords
Introduction
Ecosystem services (ES) refer to the various benefits that humans derive from nature, encompassing both tangible material resources and intangible services (Costanza et al., 1997). They are commonly categorized into four primary types: provisioning, regulating, cultural, and supporting services (MEA, 2005). Among these concepts, ES supply specifically denotes the capacity of an ecosystem to deliver ecological goods and services for human use within a defined spatiotemporal scale, measurable in terms of monetary value or physical quantity (Costanza et al., 2017). Quantifying and spatially mapping this supply capacity constitutes a critical link between ecological research and spatial management decisions (Ouyang et al., 2016), serving the fundamental purpose of informing scientifically sound conservation strategies and promoting regional sustainable development (Xu and Peng, 2022; Zhou et al., 2023).
Traditional approaches to delineating conservation priorities have predominantly relied on species and biodiversity indicators. However, these methods are subject to limitations concerning data availability, methodological standardization, and monitoring verification (Xu and Peng, 2022). Consequently, identifying key areas from the perspective of ES has emerged as a vital pathway for optimizing conservation frameworks and enhancing protection efficiency (Cai et al., 2017; Hernandez-Blanco et al., 2022). This is particularly pertinent in urban and city-cluster contexts, where intensive human activity and highly heterogeneous land use create pressing challenges such as habitat fragmentation and ES degradation (Han et al., 2022; Soni et al., 2024). Applying the geographical concepts of hotspots and coldspots to ES mapping offers a powerful tool for rapidly identifying areas of robust or feeble service supply within these complex landscapes (Liu et al., 2019; Orsi et al., 2020; Ozgo et al., 2021; Schroter et al., 2017). Hotspots are generally defined as areas with a high proportion of ES and significant management value, whereas coldspots correspond to areas with relatively weak supply capacity (Schroter et al., 2017). Although methodological approaches, including direct classification and spatial statistical analysis, continue to develop (Balasubramanian and Sangha, 2021; Orsi et al., 2020), their application has largely focused on natural ecosystems or large-scale landscape assessments. A knowledge gap persists: there is a lack of a comprehensive technical framework for large city-clusters that can systematically integrate the assessment of multiple key ES while accounting for their spatiotemporal dynamics under intense anthropogenic pressure. This gap hinders the effective translation of ES science into actionable decision support for guiding precise ecological spatial management and redline delineation within city-clusters.
The Guangdong-Hong Kong-Macao Greater Bay Area (GBA) represents one of China's most urbanized city-clusters (Wang et al., 2020; Zhang et al., 2023). Decades of rapid urbanization have led to severe habitat fragmentation and the degradation of ES functions, posing substantial challenges to the region's sustainable development (Peng et al., 2020; Zhang et al., 2021). While existing research has underscored the importance of ES conservation in the GBA (Peng et al., 2020; Wu et al., 2022; Zhang et al., 2021), most studies have focused on static assessments or descriptive analyses of single services. They have yet to establish an operational and replicable technical system for the dynamic, integrated assessment and spatial zoning of multiple ES, specifically tailored to address the practical needs of constructing a holistic ecological security pattern for the city-cluster.
To address this research gap, this study takes the GBA as a case study. The objectives are threefold: (1) to construct a statistically robust quantitative method for identifying ES hotspots and coldspots; (2) to systematically develop a technical workflow for ES functional zoning; and (3) to provide decision-making support for ecological protection redline delineation and ES importance zoning in the GBA. To achieve these objectives, this research focuses on the period from 2000 to 2015, characterized by the most rapid urbanization and prominent ecological issues. By constructing a spatiotemporal database and employing integrated methods—including GIS spatial analysis, model simulation, and expert consultation—this study quantitatively assesses and maps the supply of key ES, subsequently identifying their hotspots and coldspots and performing functional zoning.
This work therefore advances the application of ES mapping in complex urbanizing regions by developing an integrated approach that combines multi-service assessment with spatiotemporal analysis for functional zoning. By applying this approach to the GBA, the study contributes to the broader goal of translating ES research into practical spatial planning tools, thereby supporting more targeted ecological management strategies in city-clusters facing similar developmental pressures.
Methodology
Study area
The Guangdong-Hong Kong-Macao Greater Bay Area is located in the Pearl River Delta region (21°25' N—24°30' N, 111°12' E—115°35' E) and is the world's fourth largest bay area after New York Bay Area, San Francisco Bay Area and Tokyo Bay Area (Cai, 2022). The Guangdong-Hong Kong-Macao Greater Bay Area is the region with the largest plain area in China's southeast coastal area, including nine cities (Guangzhou, Foshan, Zhaoqing, etc.) and the two special administrative regions of Hong Kong and Macao (‘9+2’ pattern). Covering a total area of 65,010.5 km2, it is surrounded by hills and mountains in the west, north and east, forming a natural barrier (Figure 1) . The coastline in the south is 1,059 km long with numerous islands. Located south of the Tropic of Cancer, the Greater Bay Area has a subtropical monsoon climate as the main climate, with an average annual precipitation of 1,300–2,500 mm and an average annual temperature of 22.3 °C. Influenced by the monsoon, it is hot and rainy in summer and warm and dry in winter, with abundant light, heat and water resources. The vegetation types are diverse, mainly dominated by subtropical evergreen broad-leaved forests. The terrain is high in the north and low in the south. The mountains are mainly distributed in the northeast and northwest, while the plains are dominant in the central and other coastal areas.
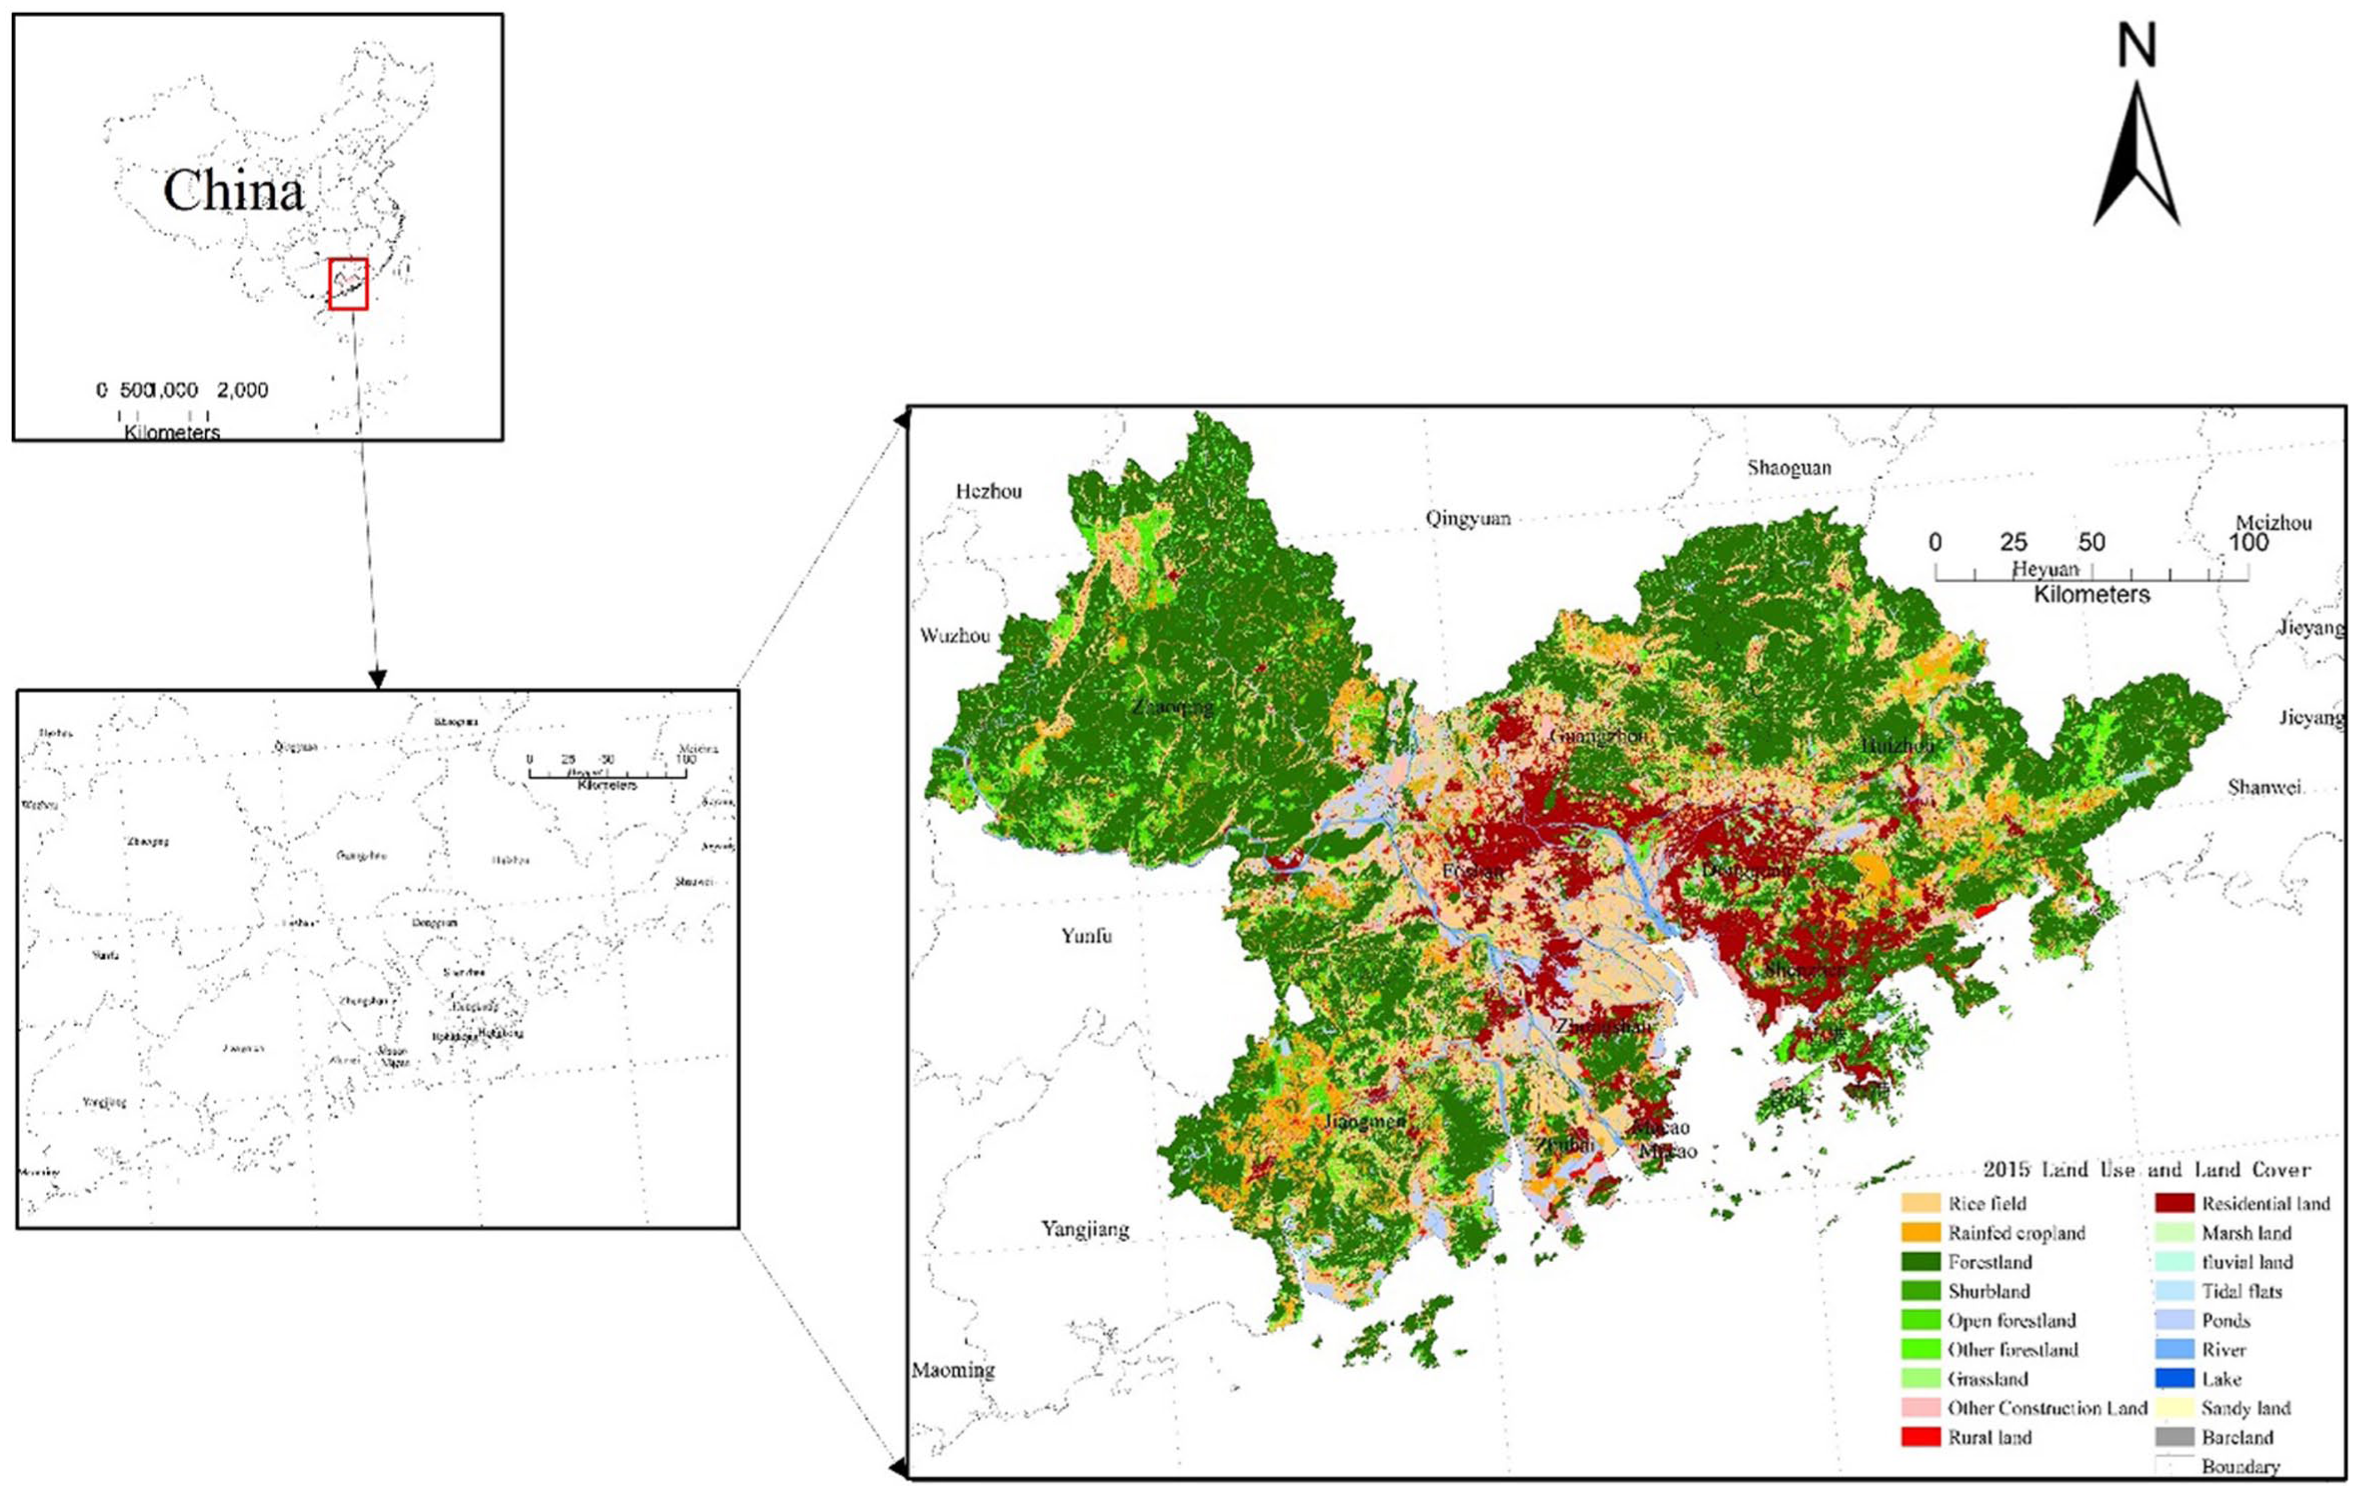
Study area.
Currently, despite the Greater Bay Area adopting various protection measures to protect natural ecological spaces and establishing many nature reserves, it still faces problems such as decreasing and fragmented natural spaces, habitat degradation, biodiversity loss, and species invasion. How to meet the needs of land and population in a sustainable manner while protecting and promoting the quality of regional natural environment is one of the major challenges facing the Guangdong-Hong Kong-Macao Greater Bay Area.
Data collection
For ecosystem type classification, land use and land cover (LULC) data from 2000 and 2015, with a spatial resolution of 30 m, was collected by the Resources and Environmental Scientific Data Center (RESDC) of the Chinese Academy of Sciences (CAS) (https://www.resdc.cn/) accessed on 15 May 2020. There are six main ecosystems corresponding to LULC in the Greater Bay Area: cropland (rice fields, rainfed cropland), urban (urban land, rural land, residential land, other construction land), forest (forestland, shrubland, open forestland, other forestland), grassland, wetland (marshland, fluvial land, tidal land, ponds, river, lake) and other (sandy land, bare land). Spatial–temporal ecological data and social statistics data of the GBA were collected for ES assessment (Table 1):
Data sources for ecosystem service assessment.
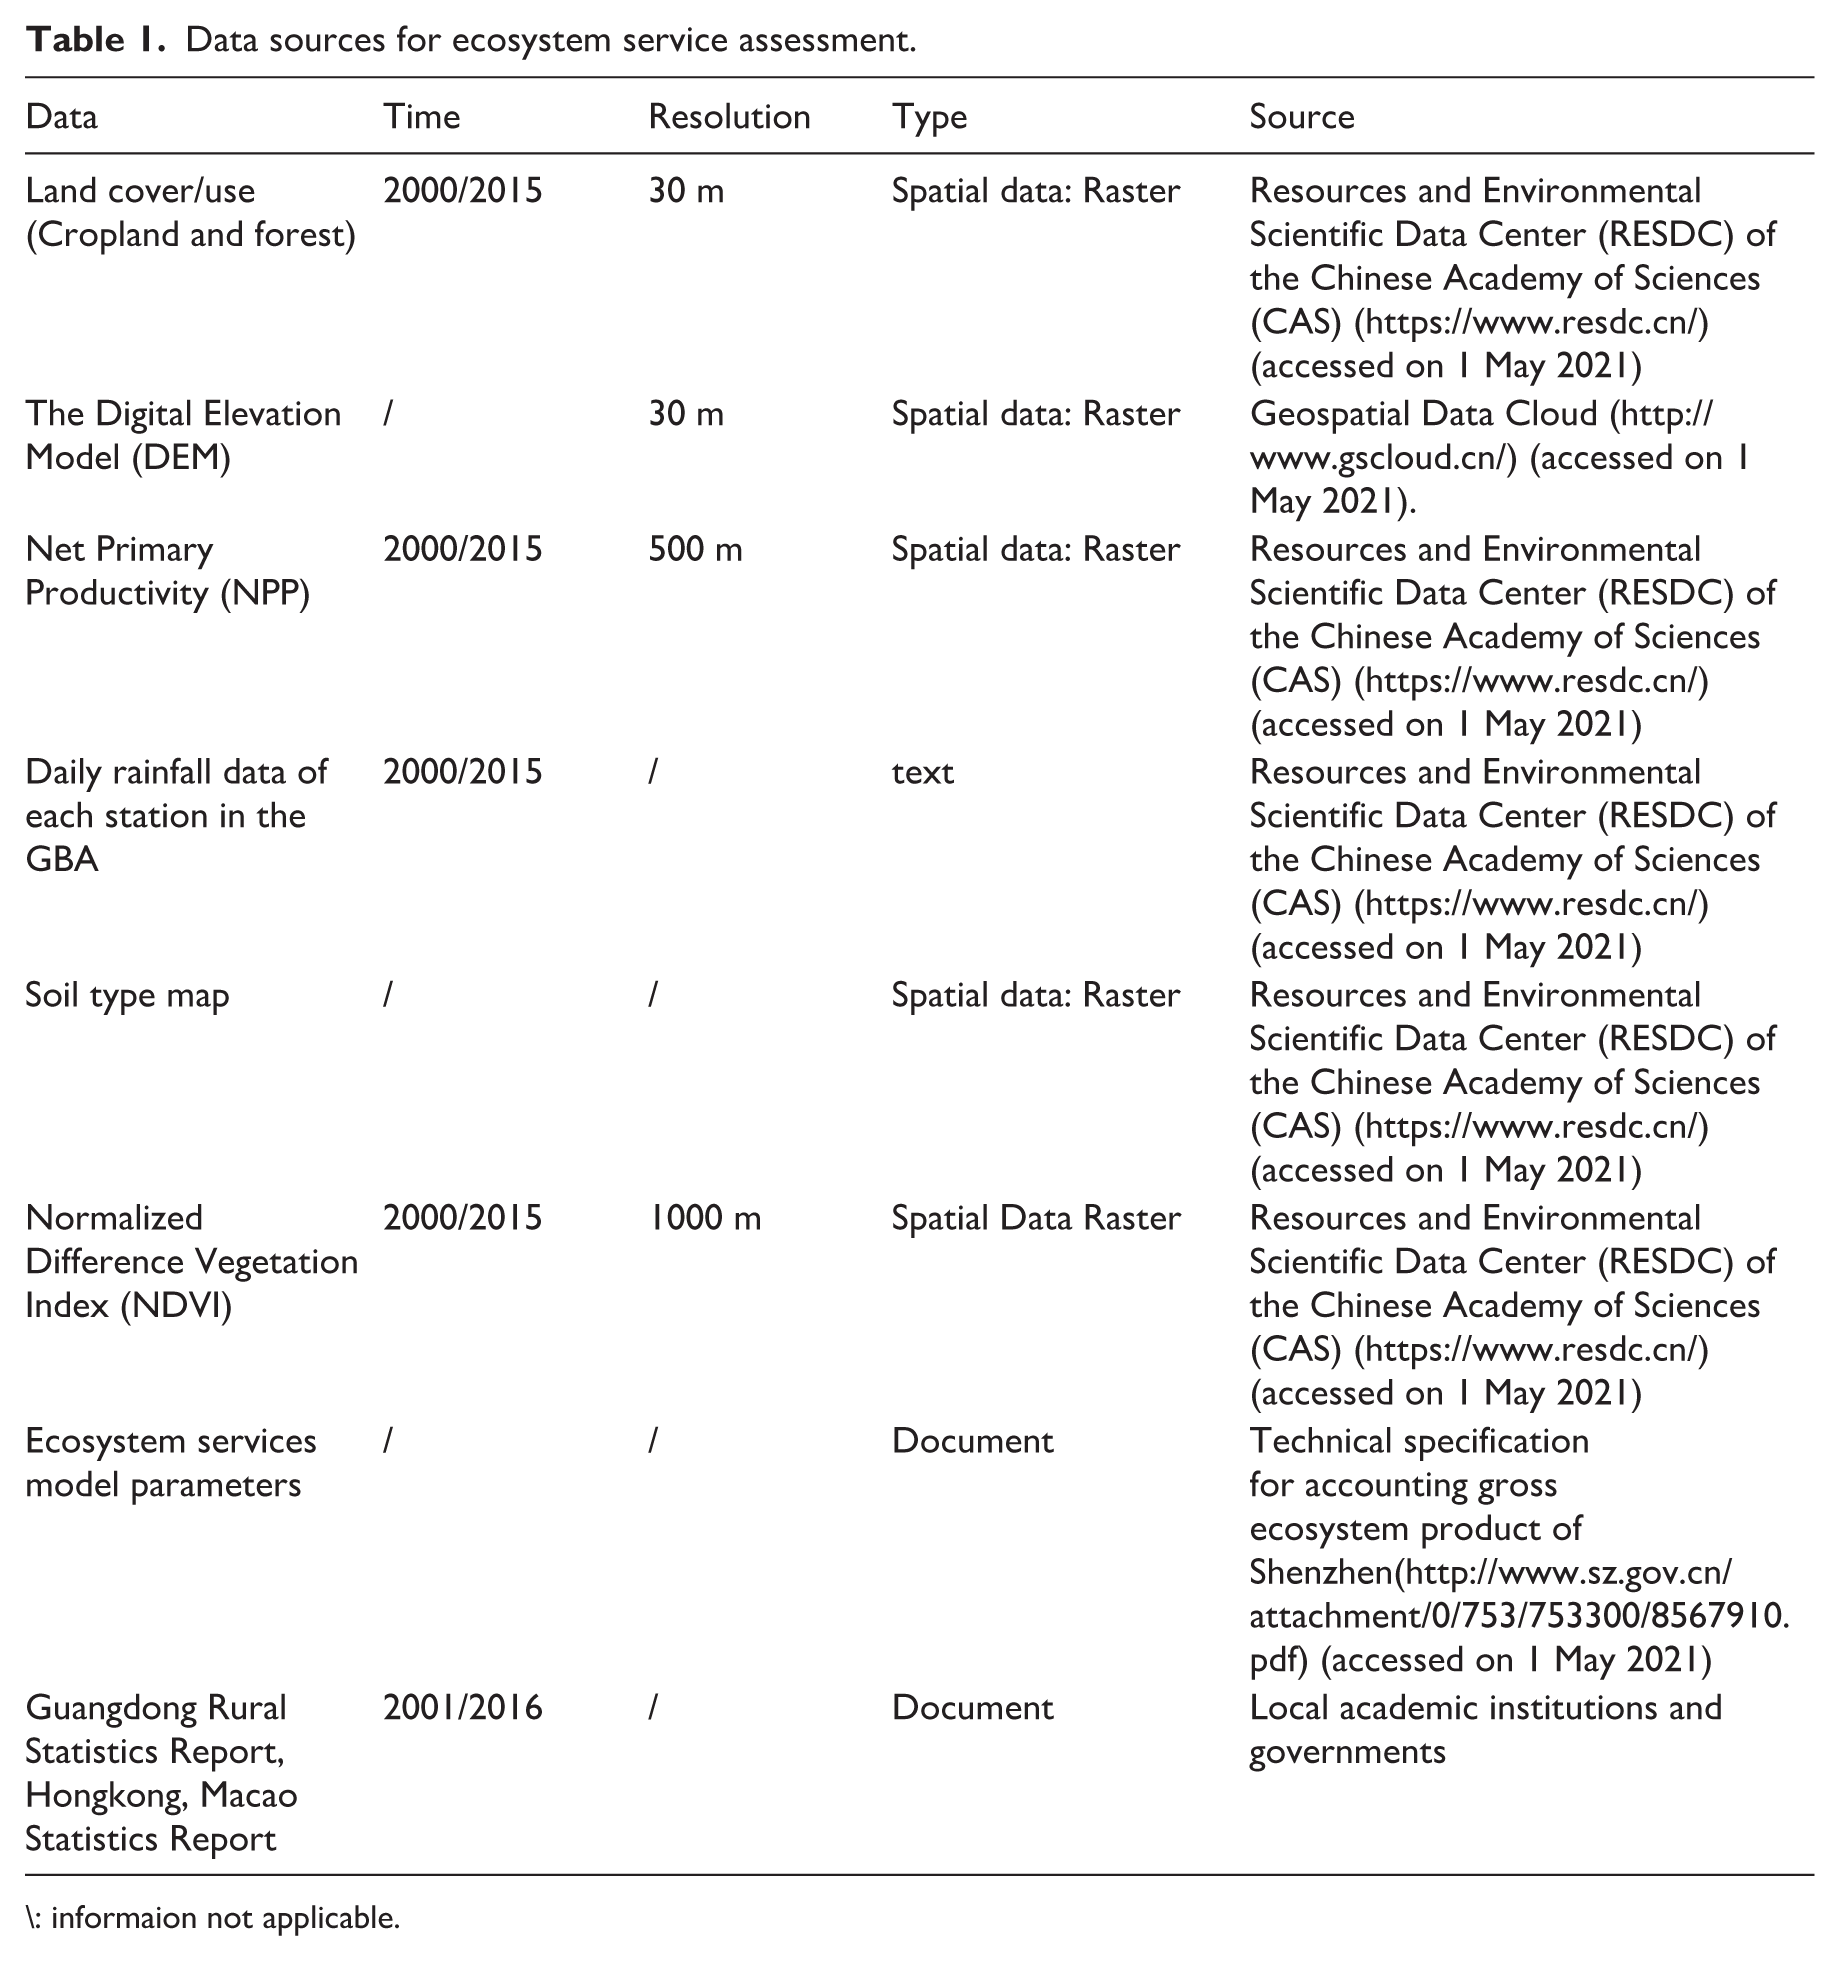
\: informaion not applicable.
Framework
On the basis of referencing relevant research (Burkhard and Maes, 2017; Cai et al., 2017, 2021), and combining regional characteristics, a framework for identifying hotspots and coldspots of ES and functional zoning is formed (see Figure 2).
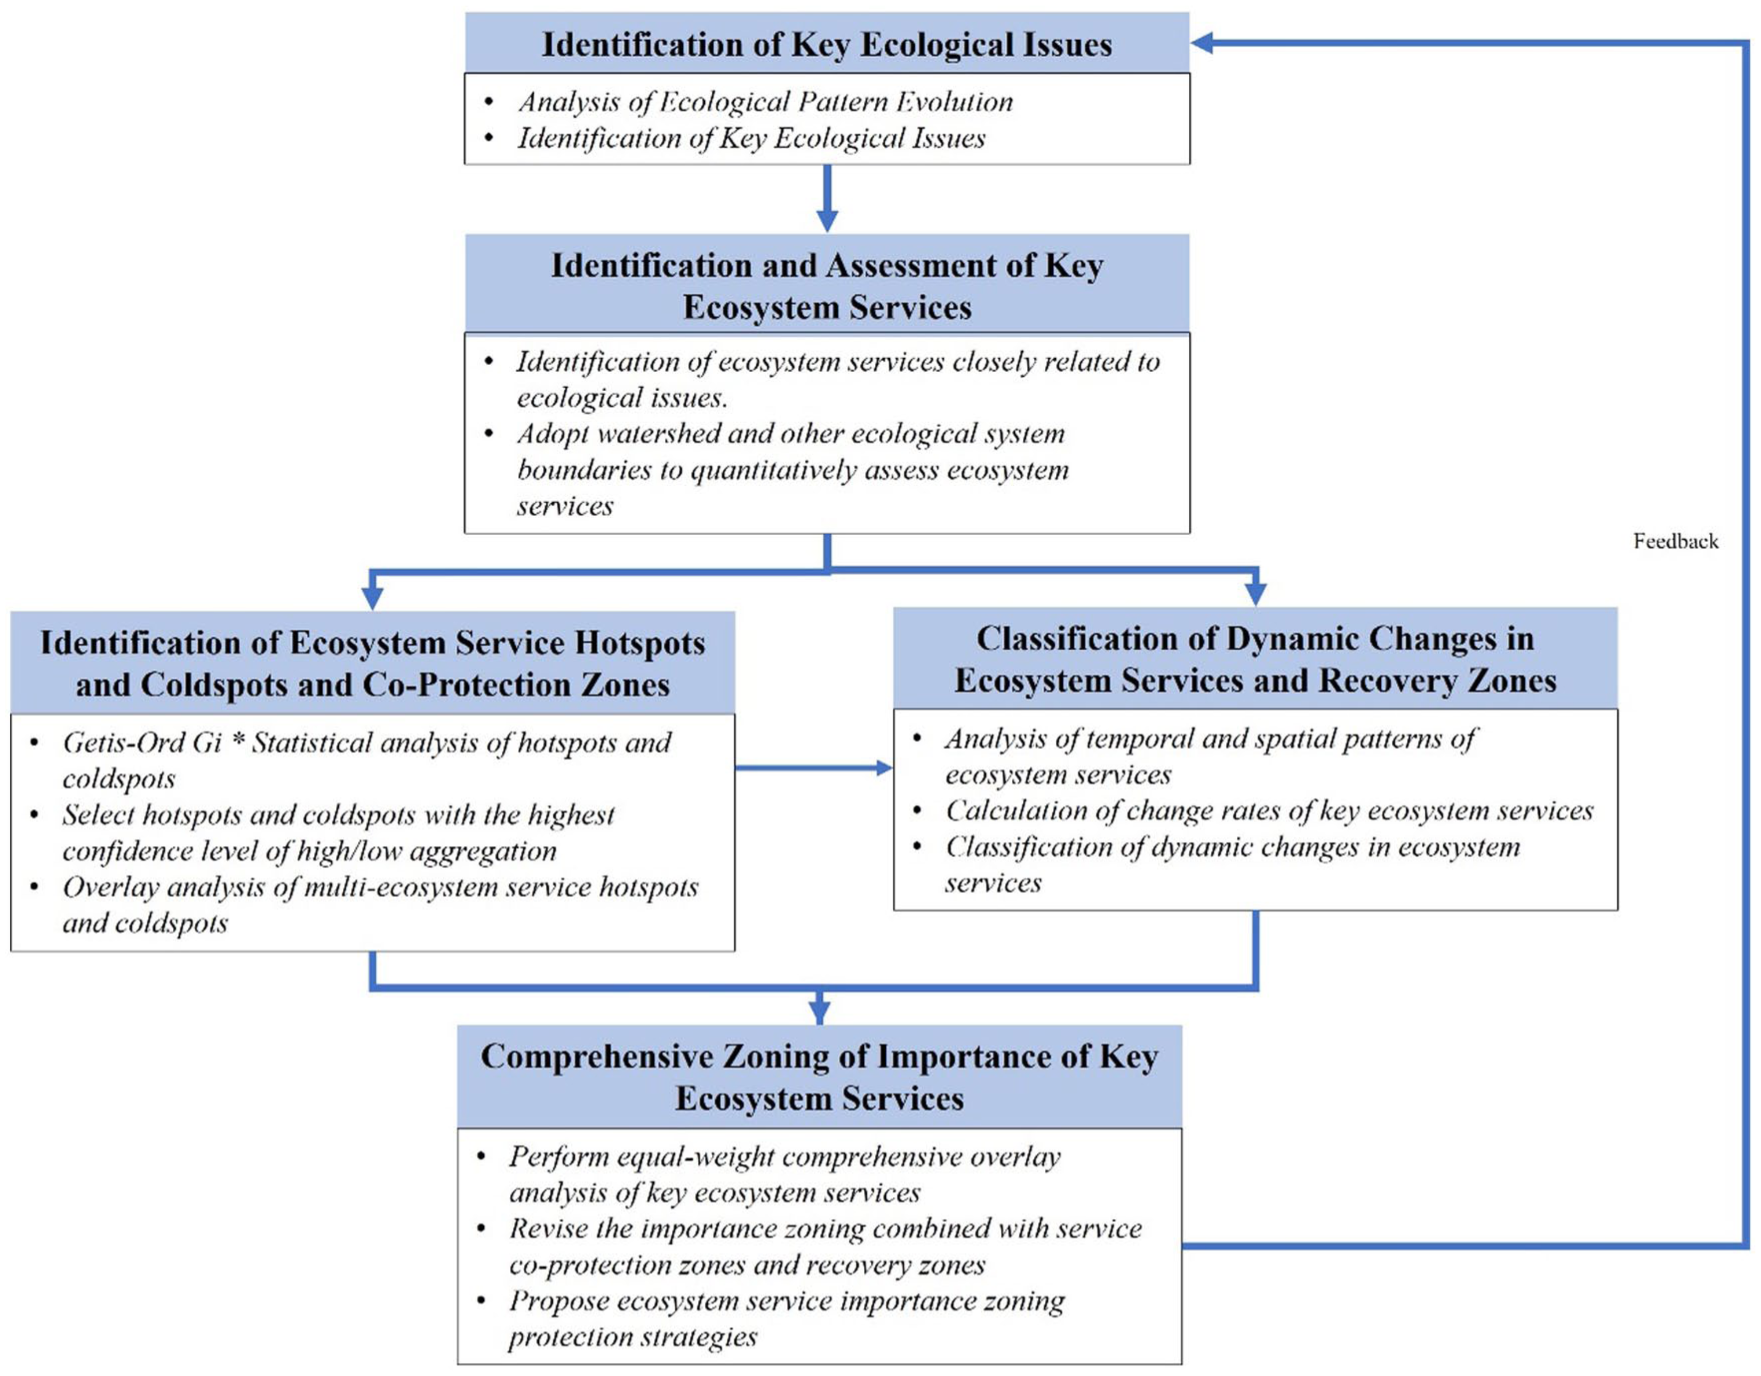
Framework.
Identification of key ecological issues
The aim is to analyze regional ecological environment data at different spatial and temporal scales, such as ecological assessment reports and the evolution of ecological patterns. Combined with field surveys and local expert consultations, key regional ecological problems are identified.
Identification and assessment of key ecosystem services
The objective is to associate the identified ecological problems with the functional types of key ES. Based on widely used ES assessment methods or models, key ES are quantitatively assessed. Combined with watersheds and other ecological system boundaries, the quantitative assessment results are allocated to the corresponding assessment units.
Identification of ecosystem service hotspots and coldspots and co-protection zones
Using GIS (Getis-Ord Gi*) spatial analysis methods, the hotspot and coldspot areas of a single ES are identified. Then, through overlay analysis, the hotspots and coldspots of four types of ES and integrated ES are determined. On the basis of overlay analysis of hotspots and coldspots of various service types, ES co-protection areas are delineated.
Classification of dynamic changes in ecosystem services and recovery zones
The temporal dynamics of ES reveal critical landscape transformations. By analyzing the rate of change in ES over time, we categorized areas into five classes based on the magnitude of change: those experiencing rapid decline (change rate < −30%), moderate decline (−30% to 0%), relative stability (approximately 0%), moderate increase (0% to 30%), and rapid increase (>30%). Areas classified as undergoing rapid decline (< −30%) or moderate decline (−30% to 0%) were identified as priority zones for ES restoration.
Comprehensive zoning of key ecosystem services
The zoning of ES functions should be based upon the overlay analysis of various types of ecological systems and considering the functions of key ES, land use types as well as physiographical features. The characteristics, predominant ecological issues, related ecological systems and key services of each ecological function zone should be analyzed. The social driving forces associated with urbanization and management strategies should also be examined.
Methods
Ecosystem services quantification methods
In this study, the quantitative assessment of ES was predicated on extensively utilized ES assessment methods or models according to Ouyang et al. (2016).
(1) Stormwater runoff regulating service:
Employing the simulated runoff coefficient method and the SCS-CN model, the stormwater runoff regulation service at the city scale was computed. The formula and parameters of this ES were according to Cai (2022):
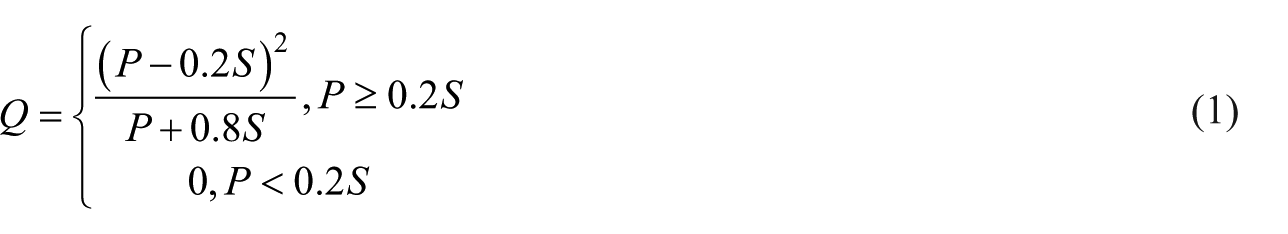
where Q is the daily runoff (runoff depth, mm); P is the daily rainfall (mm); R is the runoff coefficient (dimensionless); S is the potential maximum storage load of the soil (mm); and CN is the number of runoff curves (dimensionless), among which the main reference factors of CN value include soil hydrological grouping (K), pre-soil moisture classification (AMC), and feature cover type (LC).
(2) Soil conservation service:
The modified General Soil Erosion Equation (RUSLE) was utilized to estimate the potential soil erosion and the actual soil erosion in the region, and the disparity between the two constitutes the soil conservation service of the ecosystem in the region, which can be deemed as the supply of soil conservation services in the region. The reference for calculating the quantity of soil conservation services is according to Wischmeier and Smith (1978):

where Qsr is the amount of soil conservation (t/ha); R is the rainfall erosion force factor (MJ·mm·hm−2·h−1·a−1), expressed in terms of the multi-year average annual rainfall erosion index, the specific accounting method is shown in formula (3); K is the soil corrosibility factor (t·hm2·h·hm−2·MJ−1·mm−1), expressed as soil erosion per unit of rainfall erosion force on the standard sample; L is the slope length factor (dimensionless); S is the slope factor (dimensionless); C is the vegetation cover factor (dimensionless); and P is the soil and water conservation measure factor (dimensionless). The actual amount of soil erosion refers to the actual amount of soil erosion produced by the population agglomeration area under the current vegetation cover conditions and soil and water conservation engineering factors, and the potential soil erosion amount is the amount of soil erosion that may be generated by the ecosystem of the population agglomeration area without vegetation cover and soil and water conservation engineering factors; generally, the latter is higher than the former.
(3) Water conservation service:
The formula and parameters of water conservation (retention) service according to Wang et al. (2021a) were:
where Qwr—Water conservation (m3/a); Pi—Rainfall (mm/a); Ri—Surface runoff (mm/a); ETi—Evapotranspiration (mm/a); Area of A i-i ecosystems (m2); i—Type i ecosystems (dimensionless); n—Total number of ecosystem types (dimensionless). Note: The data of rainfall, surface runoff, and evapotranspiration in the accounting area are obtained from the relevant literature of the meteorological department or the accounting area.
(4) Grain production service:
Cropland is the primary ecosystem type for crop production, and the Normalized Difference Vegetation Index (NDVI) value can effectively reflect crop production capacity (Li et al., 2022). For calculating this ES, the formula used was according to Li et al. (2022):

where CY i,k is the crop yield of cropland pixel i in district/county k (kg/km2); CYk is the average crop yield of croplands in district/county k (kg/km2), which can be derived from the Guangdong Province Statistics Yearbook and the Hong Kong and Macao Statistics Book; NDVI i,k is the NDVI value of cropland pixel i in district/county k; and NDVImean,k is the mean cropland NDVI value in district/county k . According to Zhao et al. (2018), crop yields in each district/county are distributed on cropland cells based on cropland NDVI values. The average crop yield (kg/km2) of cropland in each district/county can be obtained in the Guangdong Rural Statistical Yearbook and the statistical yearbooks of local cities and the Hong Kong and Macao Special Administrative Regions.
(5) Carbon sequestration services:
Net ecosystem productivity (NEP) is a pivotal scientific indicator for quantitative analysis of ecosystem carbon sources/sinks, and ecosystem carbon sequestration can be gauged by the NEP method (Wang et al., 2021a, 2021b). For calculating this ES, the formula and parameter was according to Ouyang et al. (2016):

where QtCO2 is carbon sequestration in terrestrial ecosystems (t·CO2/a) and NEP is net ecosystem productivity (tC/A).
NEP is extensively utilized in carbon cycle studies. NEP can be obtained from net primary productivity (NPP) minus the consumption of vegetation respiration or converted according to the correlation conversion coefficient of NPP and NEP, and then the mass of fixed carbon dioxide in terrestrial ecosystems is measured.
Based on the identification of critical ecological problems and the assessment of ES in the preceding paragraph, this case study employed a grid with a spatial granularity of 1 km × 1 km to spatially sample five ES in the years 2000 and 2015 as pre-preparation for Ecosystem Service Bundles (ESB) analysis and trade-off/synergy in the GBA.
Ecosystem service hotspot and coldspot identification methods
The Getis-Ord Gi* statistic for each feature in the dataset can be calculated using the ArcGIS 10.6 hotspot analysis tool. Through the obtained z-scores and p-values, the locations where high or low value features are spatially clustered can be identified. The Gi* statistic returned for each feature in the dataset is the z-score. For statistically significant positive z-scores, the higher the z-score, the tighter the clustering of high values (hotspots). For statistically significant negative z-scores, the lower the z-score, the tighter the clustering of low values (coldspots).
The hot spot analysis (Getis-Ord Gi*) results show the distribution and aggregation of high and low values of various services. Red represents hotspots, that is, high-value hotspots of services, and blue represents coldspots, that is, low-value coldspots of services. The higher the confidence level, the more the phenomenon of high service values and aggregation or low service values and aggregation exists. In this study, high-value hotspots of services can be regarded as potential ecological service protection areas, and low-value coldspots of services can be regarded as areas with potential ecological restoration needs.
Watershed (catchment area) division
Compared with the city or county level, the watershed scale is more suitable for ecosystem management because the biophysical properties within the same watershed are similar. In order to maintain the homogeneity of the biophysical properties of each assessment unit, we used the ArcGIS 10.6 (ESRI, Inc.) hydrological analysis tool to divide the Pearl River Delta region into small watersheds or catchments based on DEM data. When calculating grids, a threshold of 100,000 was entered, considering that the divided catchments could reflect the heterogeneity between different catchment intervals and maintain consistency within the watershed. Then, catchments smaller than 5 km2 were merged with adjacent catchments, resulting in 369 catchments. The size of the watersheds ranged from 10.20 to 654.69 km2, with an average of 142.83 km2 and a standard deviation of 101.49 km2.
The ArcHydro tool in ArcGIS was used to identify the flow of services related to the watershed, such as flood control, erosion control and water purification. Based on the digital elevation model (DEM), the distribution map of sub-watersheds in the study area was drawn in the ArcHydro module of ArcGIS 10.6. According to the simulated river level terrain, the river flow direction was analyzed. Among the selected services, the flow direction of three water-related services is dominated by natural water networks and artificial water networks affected by terrain (slope). In order of river sequence, the three main rivers in the southwest hilly mountainous area, Dongjiang River, Beijiang River and Xijiang River, converge into the Pearl River Estuary after passing through the Pearl River Delta Plain.
Results
Spatial patterns of ecosystem services
In 2015, the spatial patterns of five key ecosystem services in the Greater Bay Area exhibited pronounced geographical differentiation (Figure 3). High-value areas for water conservation were concentrated in the northwestern and northern regions, encompassing Zhaoqing, central and northern Guangzhou, northern Jiangmen, and northern Huizhou, with values ranging from 1,367 to 2,646 mm/m2 and peaking at 1,713–2,646 mm/m2. Low water conservation values (0–405 mm/m2) predominated in the central basin, including Foshan, southern Guangzhou, central and northern Zhongshan, Dongguan, and most of Shenzhen. Soil conservation showed a similar peripheral pattern, with high values (3,235–19,626 t/ha, maximum 5,236–19,626 t/ha) observed in Zhaoqing, northern Guangzhou, northern and eastern Huizhou, Hong Kong, and western Jiangmen, while the central basin recorded markedly lower values (2–694 t/ha).
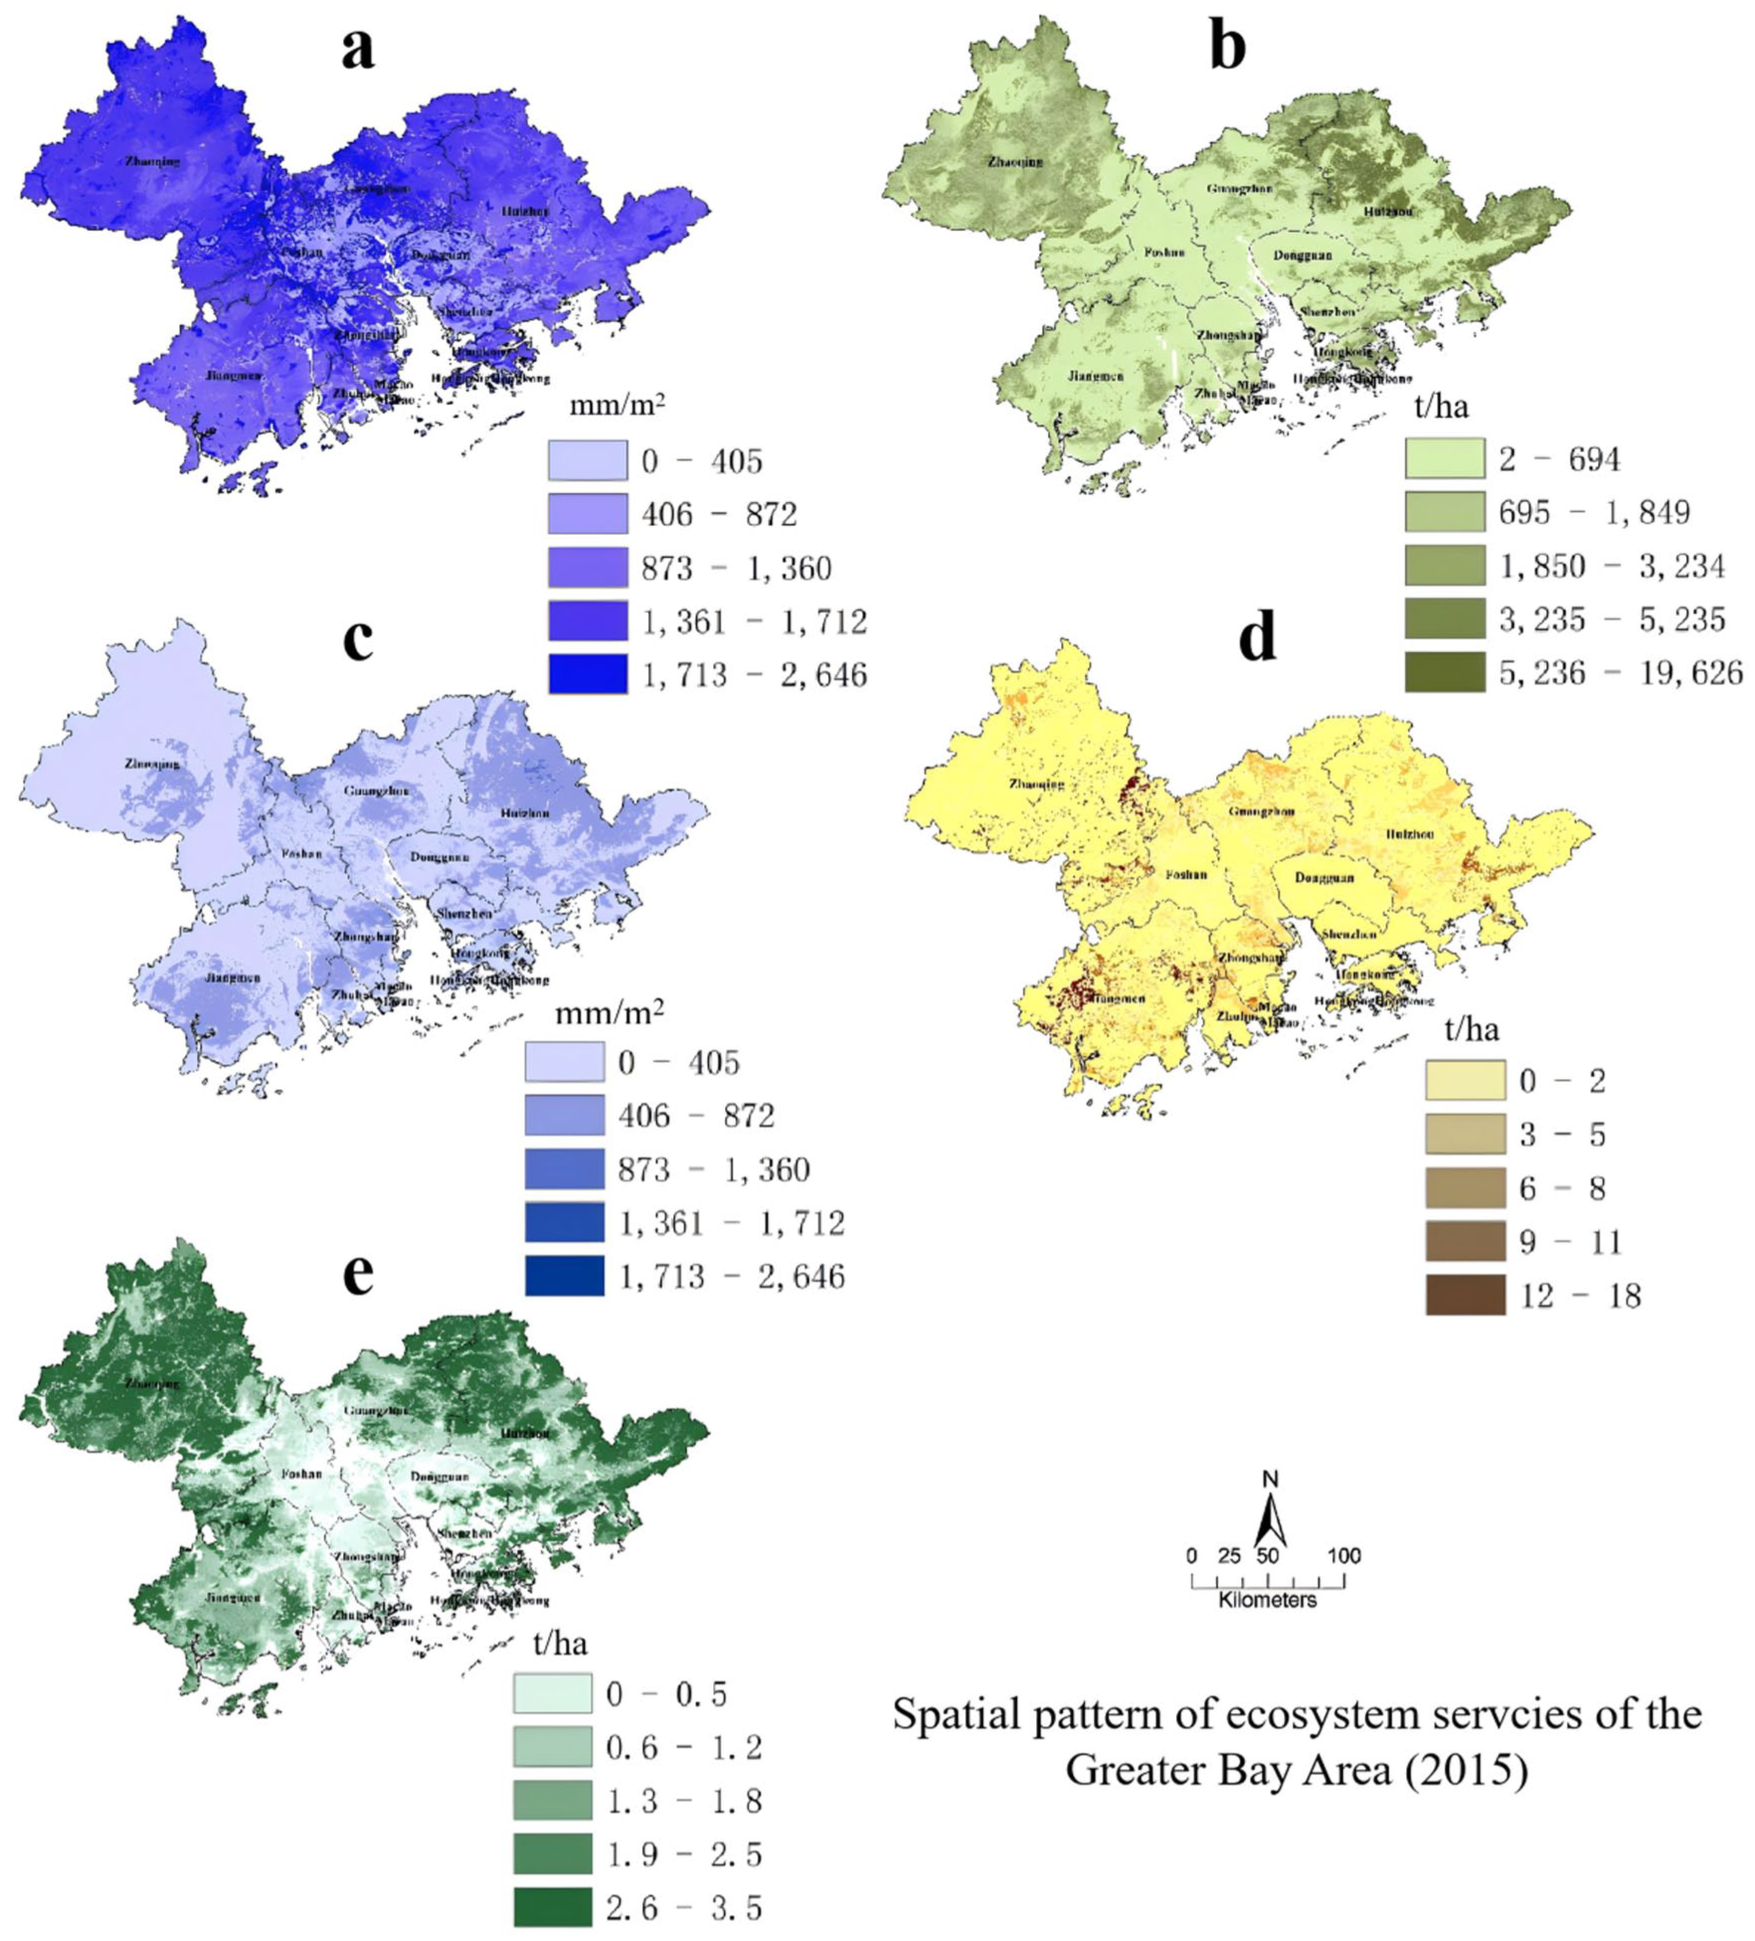
Spatial pattern of water conservation service (a), soil conservation service (b), stormwater regulation service (c), grain production service (d), carbon sequestration service (e) of the Greater Bay Area (2015).
Stormwater runoff regulation capacity was elevated in the northeast, north, south, and southwest—notably in Huizhou, central and northern Guangzhou, central and western Zhaoqing, southern Jiangmen, Zhuhai, and Zhongshan—where values reached 1,361–2,646 mm/m2 (highest 1,713–2,646 mm/m2). Low-regulation areas (0–405 mm/m2) were widespread in the western and central portions of the region. Grain production displayed a bipolar spatial structure, with high-yield clusters (9–18 t/ha, highest 12–18 t/ha) centered in the eastern and western parts of the bay area, particularly in central and southern Zhaoqing, central Jiangmen, and eastern Huizhou. In contrast, most of the region exhibited low grain yields (0–2 t/ha). Carbon sequestration followed a distinct north–south gradient, with high values (1.9–2.5 t/ha, peaking at 2.6–3.5 t/ha) concentrated along the northern periphery, including Zhaoqing, Huizhou, most of Jiangmen, and Hong Kong. A continuous belt of low carbon sequestration (0–5 t/ha) extended across the central basin, covering Foshan, southern Guangzhou, Dongguan, Zhongshan, and adjacent areas. This spatial configuration underscores a systematic contrast between the ecologically functional periphery and the urbanized central core of the Greater Bay Area.
Changes in the spatial pattern of ecosystem services
From 2000 to 2015, the change rates of five key ecosystem services (ES) in the Greater Bay Area were categorized into five levels: high degradation (< −30%), moderate degradation (−30% to 0%), basically unchanged (0%), moderate growth (0% to 30%), and high growth (> 30%). Spatially, the ES changes displayed notable north–south and east–west differentiation (Figure 4). Water conservation increased in the northern regions, particularly in Zhaoqing, while remaining stable or declining in central and southern areas such as Foshan and Dongguan. Soil conservation improved significantly in the central and northern zones, including Zhaoqing and Huizhou, whereas the southwestern parts, especially southern Zhuhai, experienced decline. Stormwater regulation decreased in the southern bay area but increased in northern watersheds, with notable growth along the Zhaoqing–Guangzhou border. Grain production decreased in central Foshan, Guangzhou, and Dongguan, but increased markedly in western Zhaoqing and eastern Huizhou, with sharp declines observed in southern Shenzhen and northern Hong Kong. Carbon sequestration showed patchy patterns, with growth in western areas and stability or moderate decline in central Foshan and Dongguan. The integrated ES change (Figure 5), derived from equal-weight overlay, revealed degradation in the south and east and high growth in the north and west. High-degradation areas were concentrated in eastern Dongguan, southern Huizhou, northern Shenzhen, and southern Zhuhai, which represent priority zones for functional recovery. In contrast, high-growth areas were continuously distributed across Zhaoqing, northern Guangzhou, and western Jiangmen, indicating positive ecological trends and the effectiveness of prior restoration efforts. Overall, ES functions in the Greater Bay Area generally improved during this period, yet the central region still requires enhanced ecological protection and restoration. Key ES hotspots, located mainly in the northwest, north, and east, should be prioritized in regional ecological red-line delineation and spatial planning, with cross-administrative coordination strengthened for integrated ecological management.
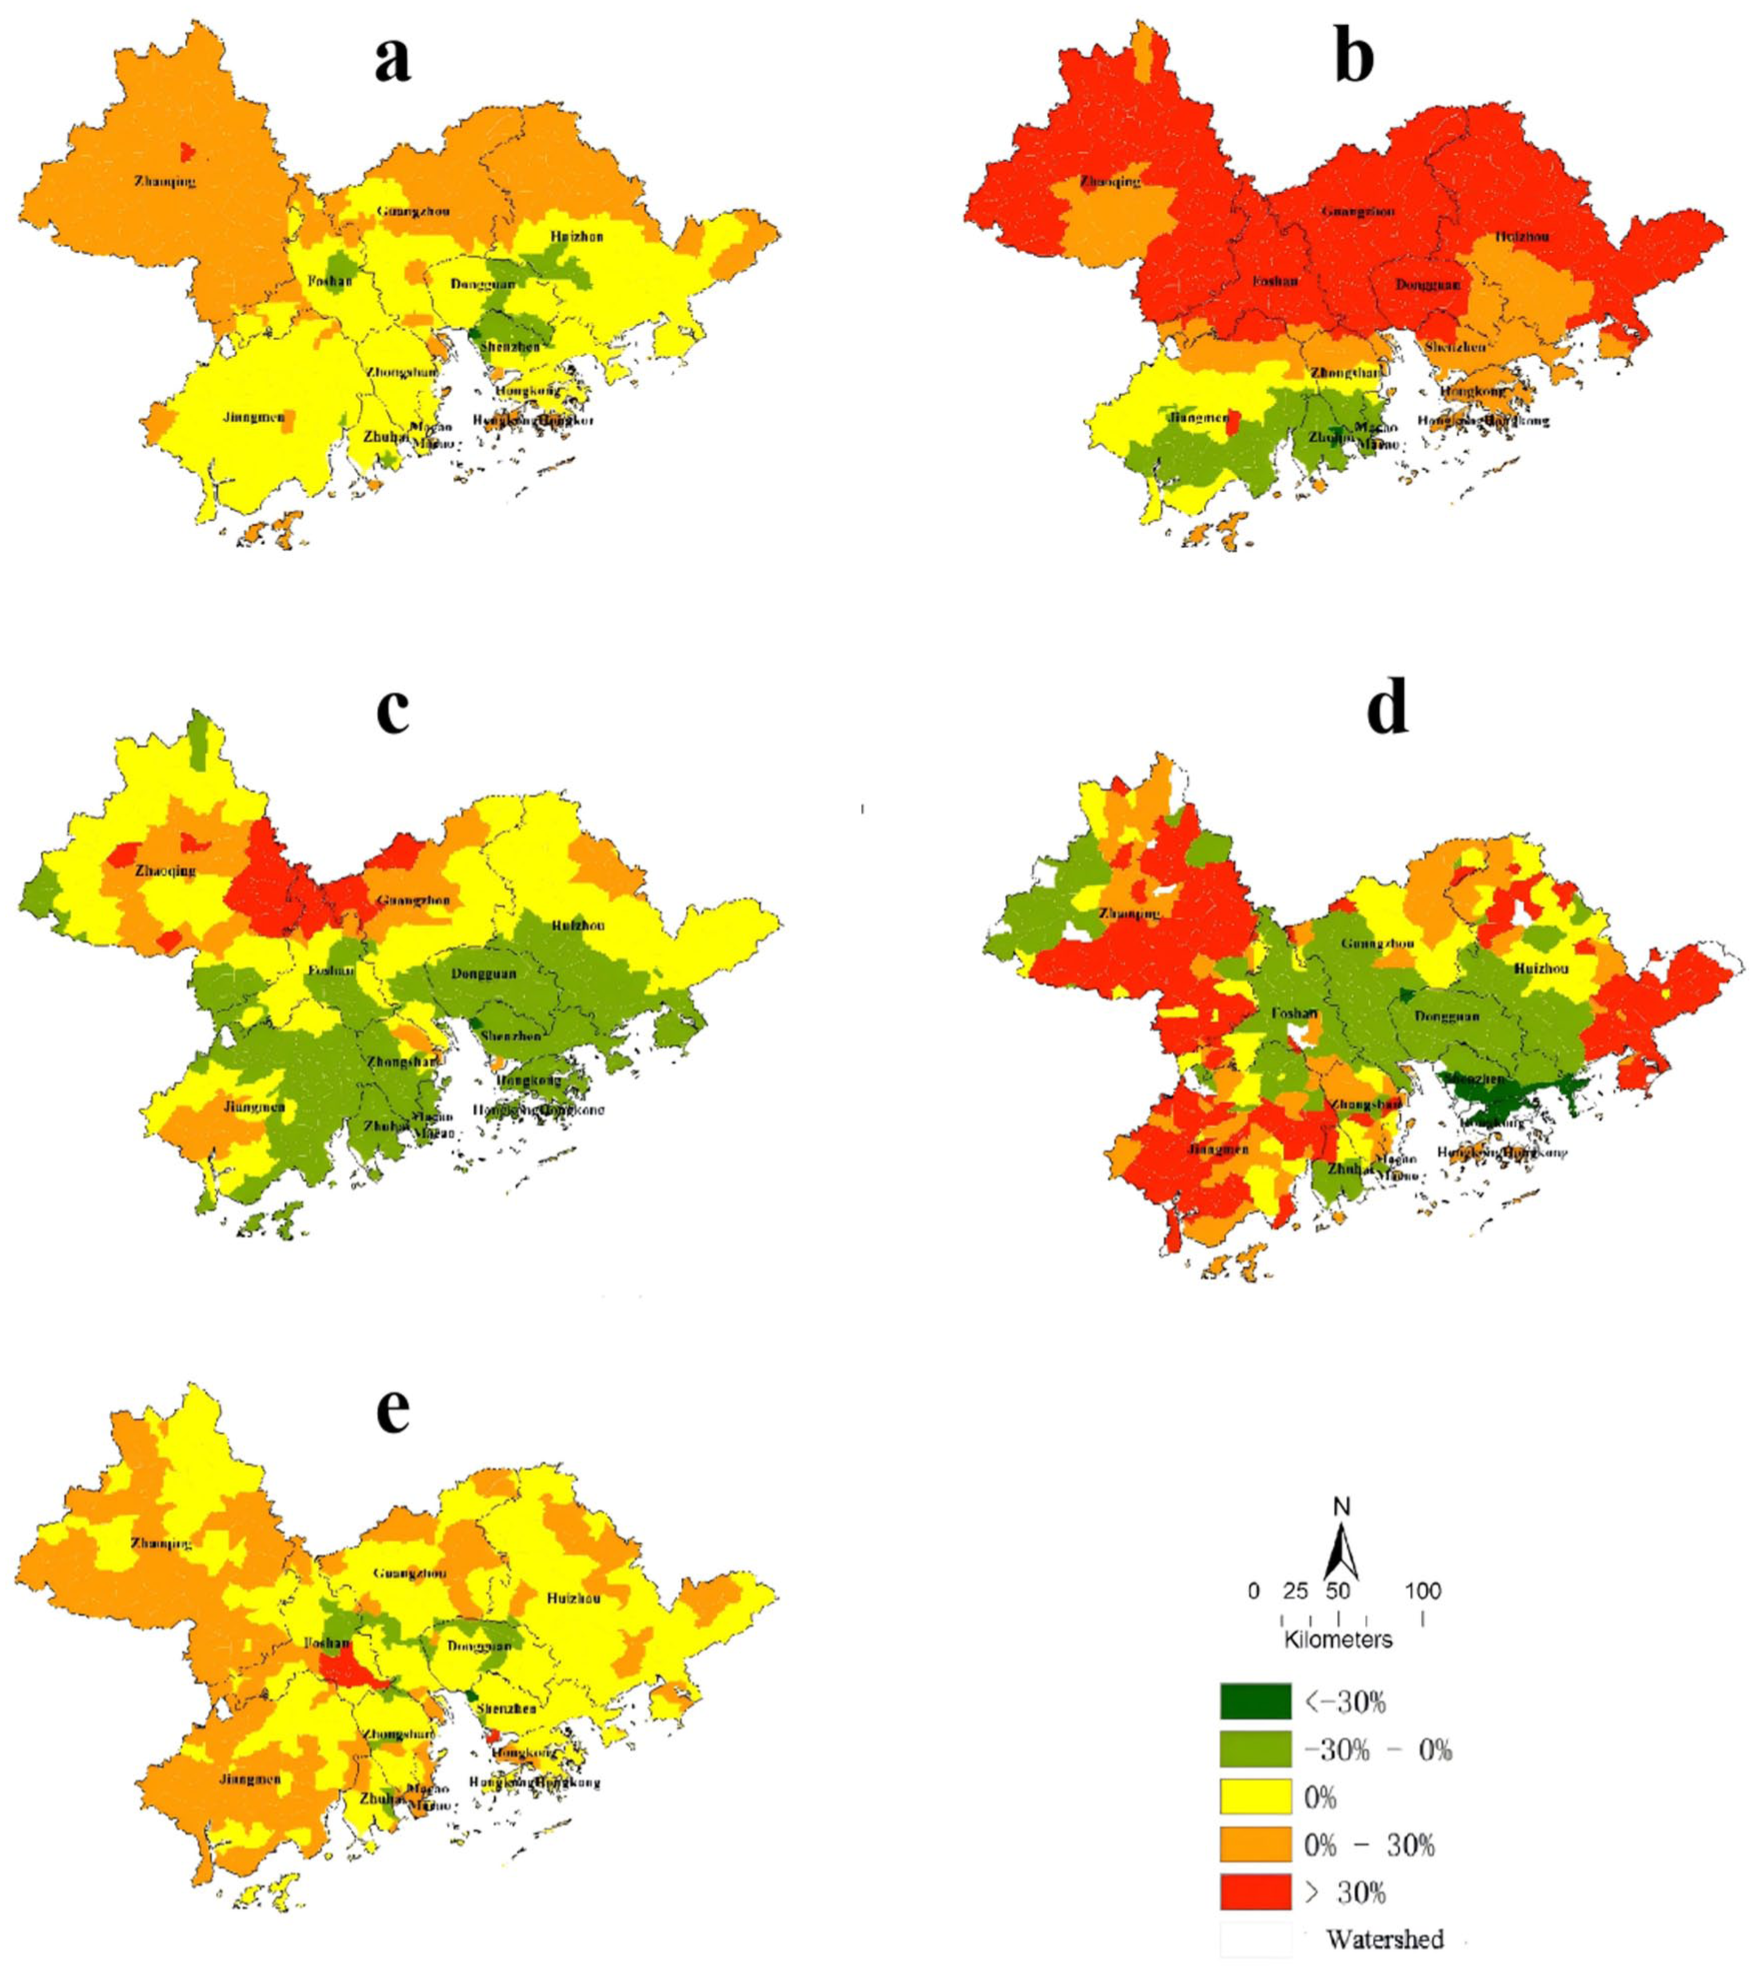
Spatial pattern of water conservation service (a), soil conservation service (b), stormwater regulation service (c), grain production service (d), carbon sequestration service (e) of the Greater Bay Area (2000–2015).
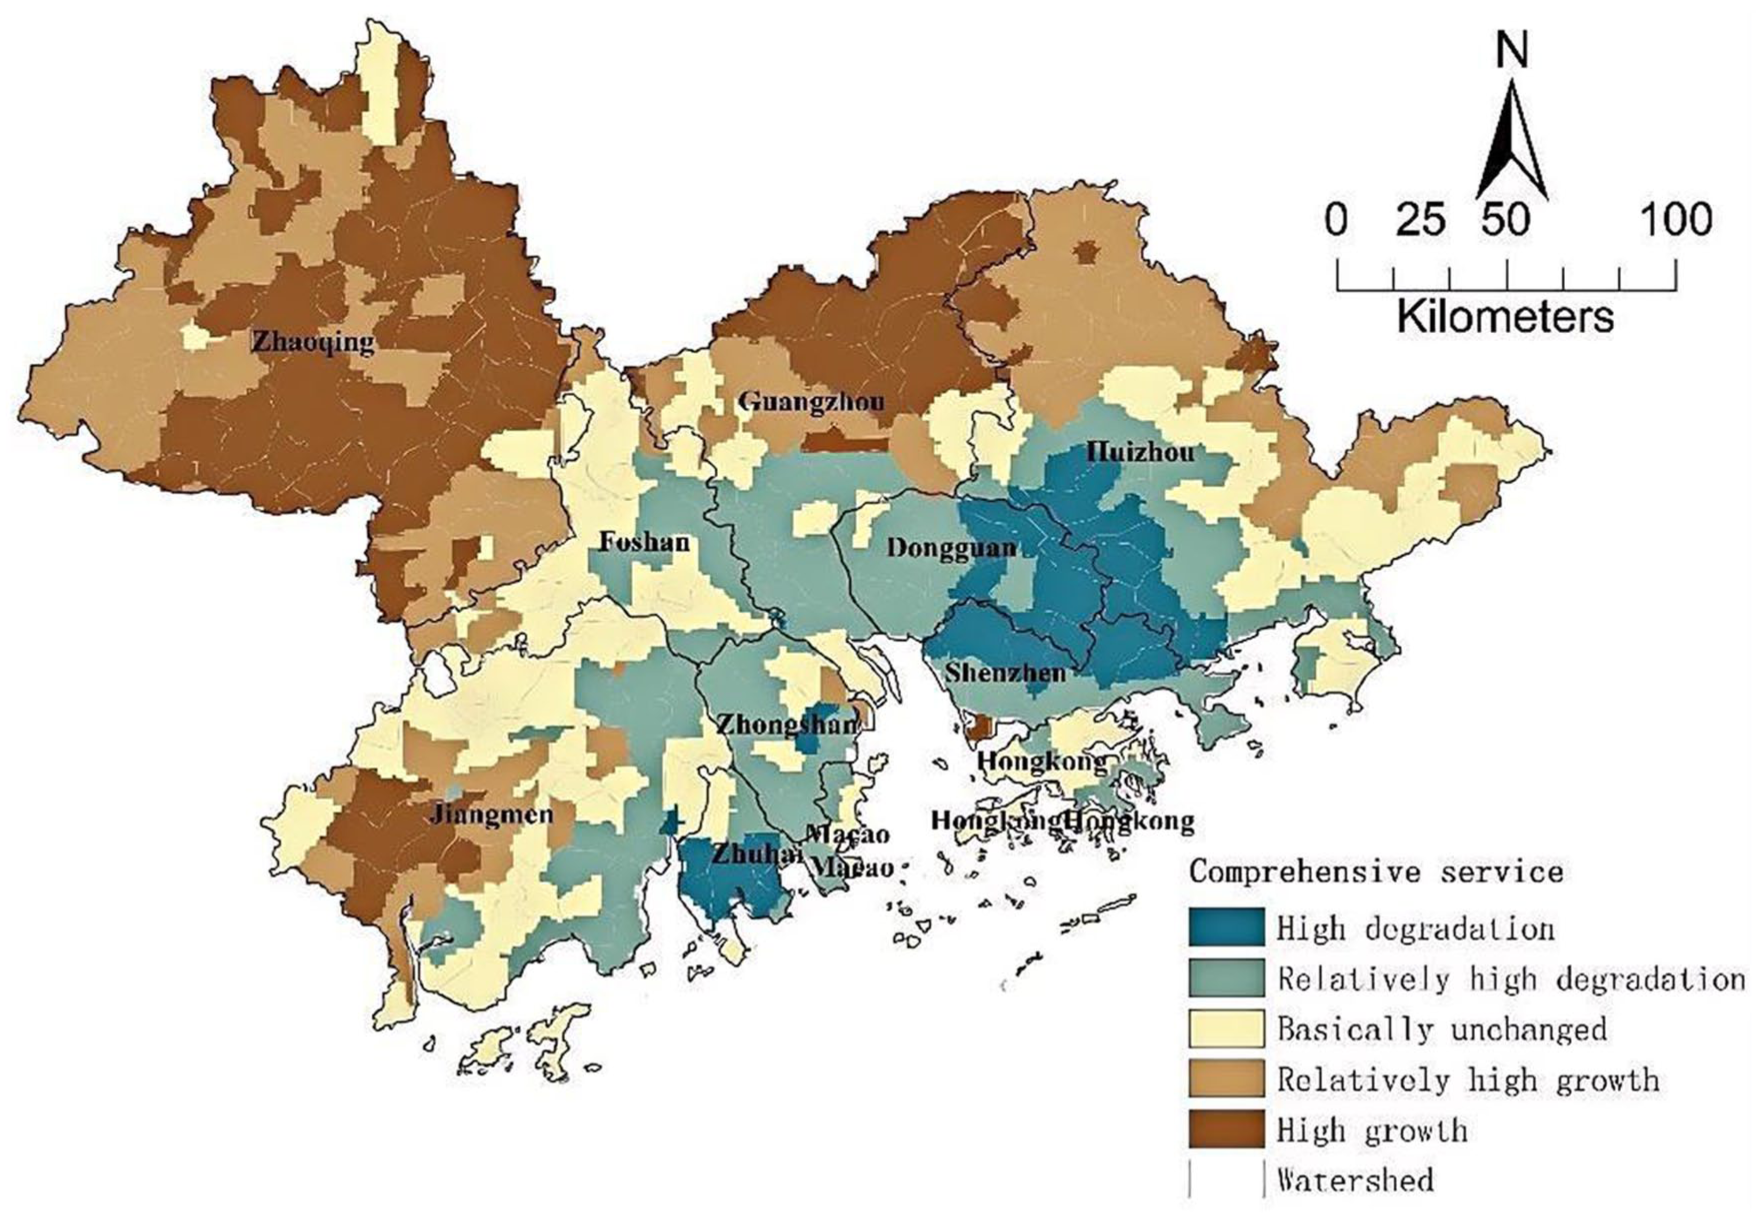
Grading of dynamic date of comprehensive service of the Greater Bay Area (2000–2015).
Ecosystem service hotspots and coldspots service co-protection areas
Based on the Getis-Ord Gi* hotspot analysis, Figure 6 presents the integrated spatial pattern of key ecosystem service functional zones in the Guangdong-Hong Kong-Macao Greater Bay Area. For water conservation services, hotspots were predominantly identified in the northwestern part of the region, covering most watersheds in Zhaoqing, as well as northwestern Foshan, central and northern Guangzhou, and northern Jiangmen. Coldspots were mainly concentrated in the central and eastern bay area, including central Foshan, Dongguan, Shenzhen, southern Huizhou, the southern Hong Kong Special Administrative Region, the Macao Special Administrative Region, central and southern Zhuhai, and western Jiangmen. Regarding soil conservation, hotspots were largely distributed in the northern and eastern regions, particularly in northeastern Zhaoqing, northern Guangzhou, eastern Huizhou, and the western parts of Shenzhen and Hong Kong. Coldspots for this service were primarily found in the central and southern bay area, encompassing Foshan, southern Guangzhou, central and western Dongguan, northern Zhongshan, central Jiangmen, and Zhuhai.
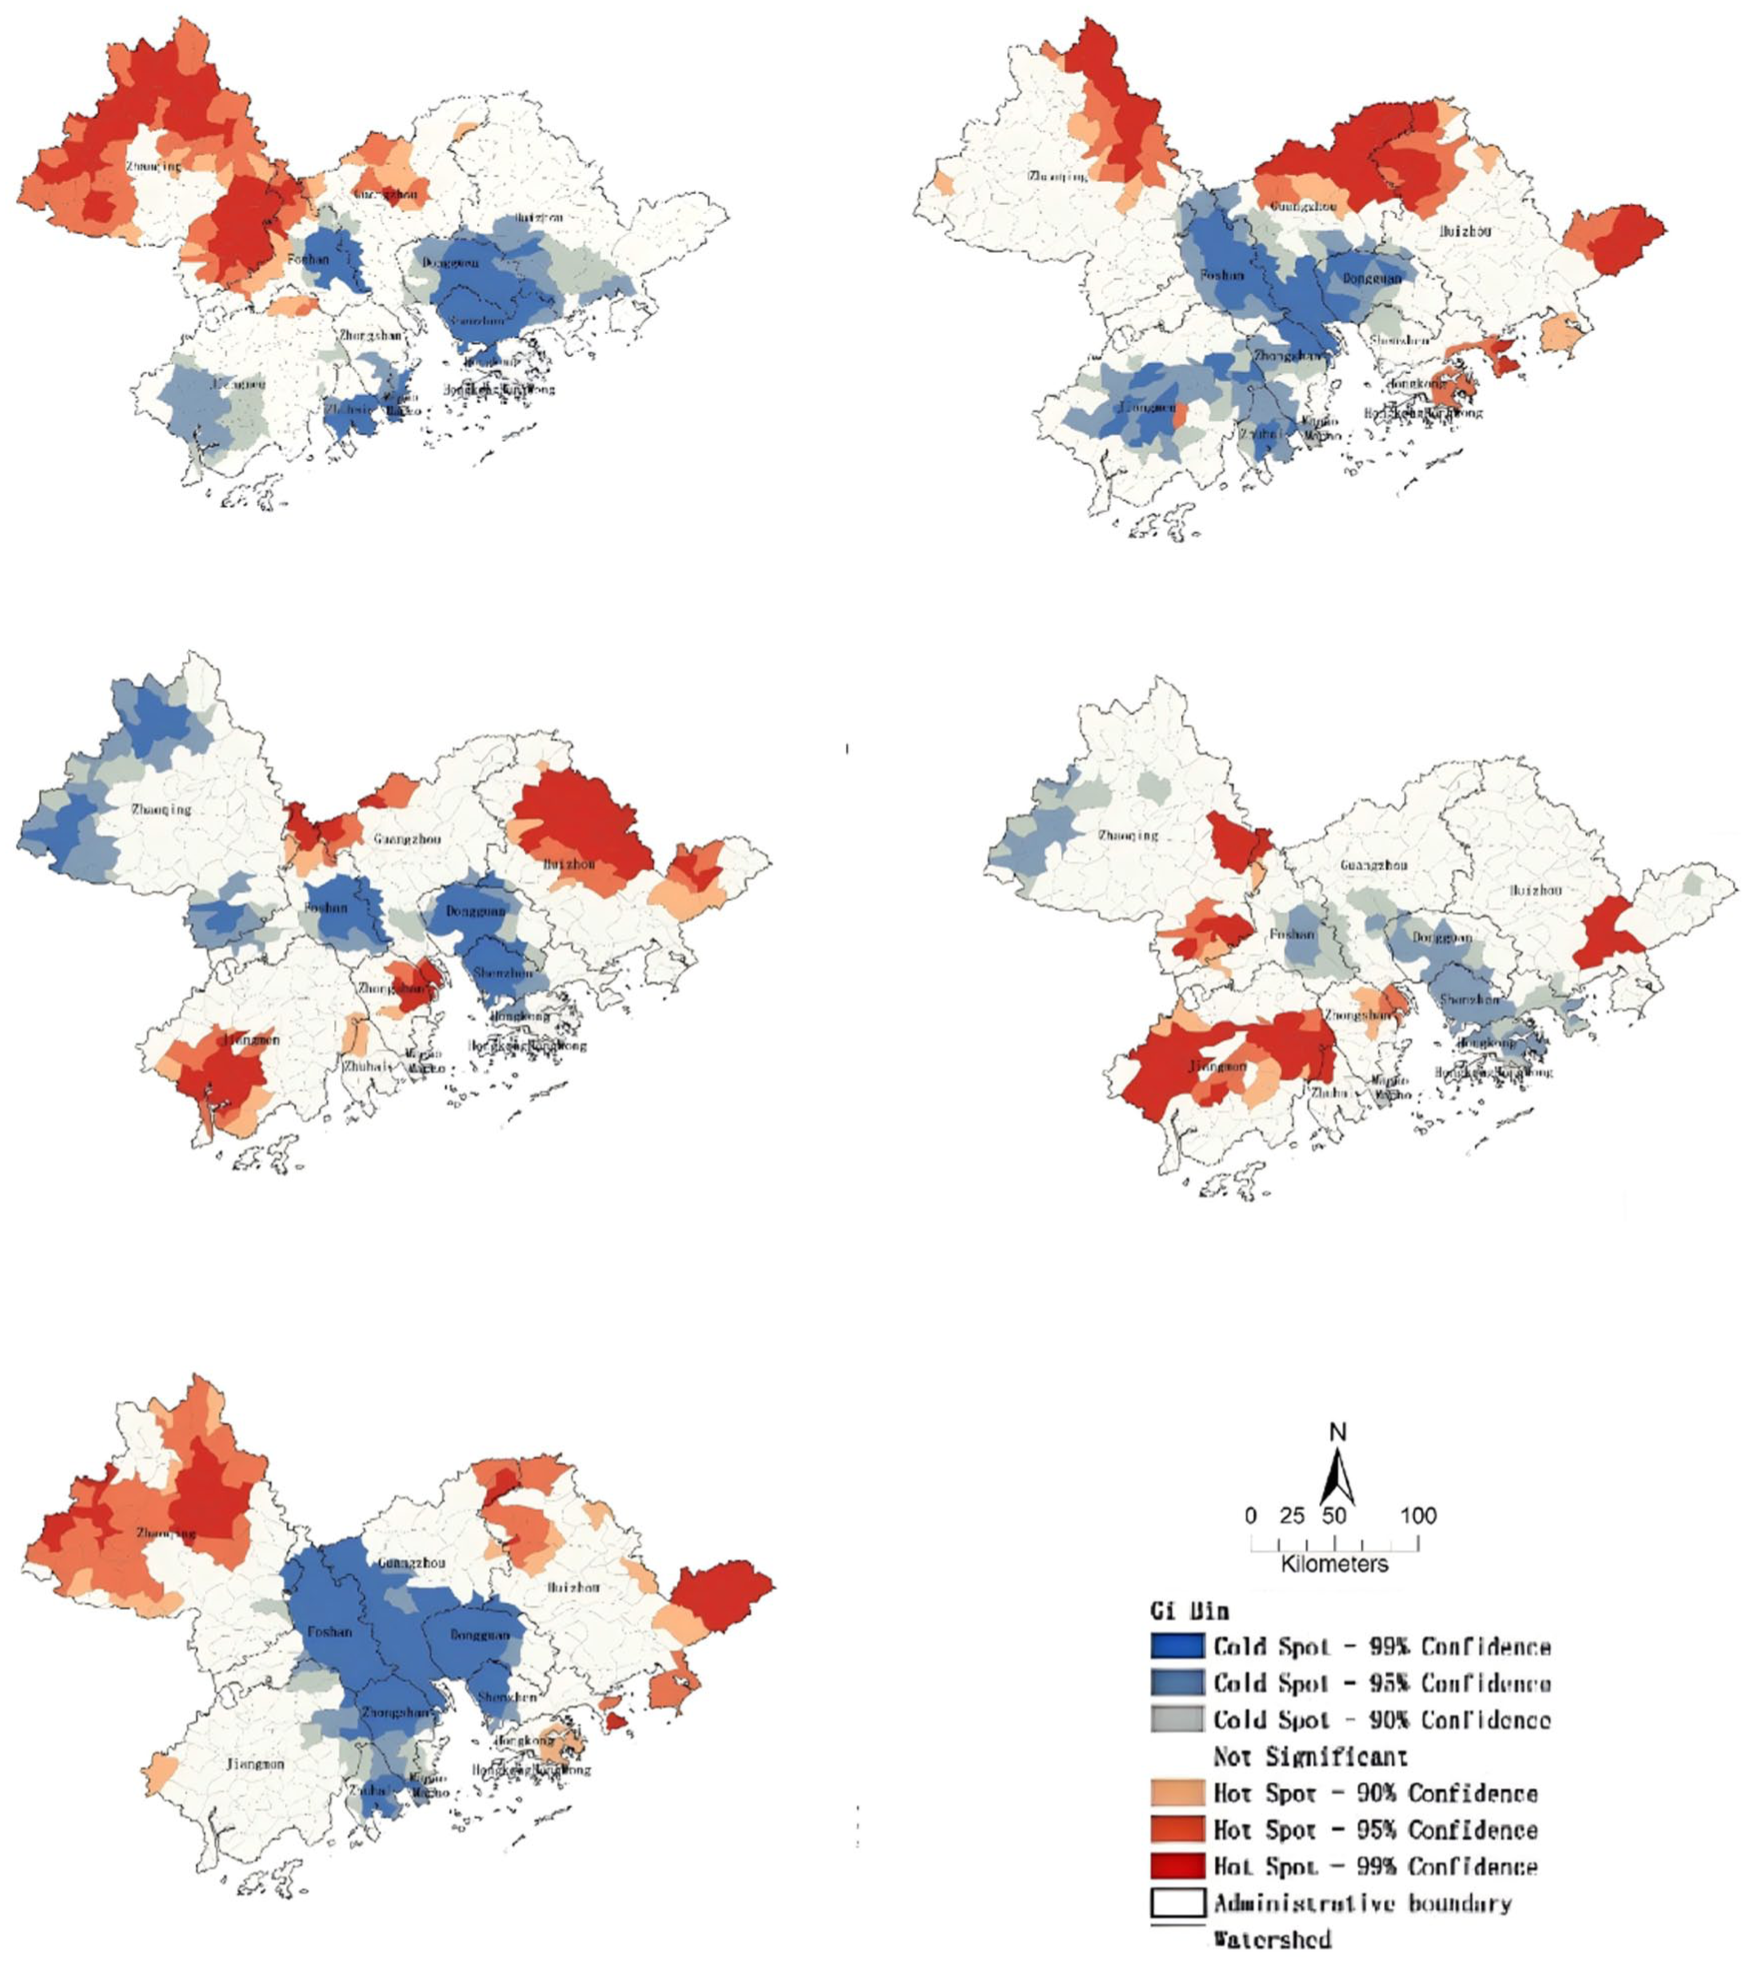
Getis-Ord Gi* hotspot of water conservation service (a), soil conservation service (b), stormwater regulation service (c), grain production service (d), carbon sequestration service (e) of the Greater Bay Area (2000–2015).
Hotspots for stormwater runoff regulation were mainly located in the northeastern and southwestern parts of the bay area, with notable concentrations in Huizhou and southwestern Jiangmen, along with smaller clusters in northwestern Guangzhou, northern Foshan, and northeastern Zhongshan. Coldspots for this service were distributed across the central and northwestern regions, covering watersheds in Foshan, Dongguan, Shenzhen, and the northern, western, and southern parts of Zhaoqing. For grain production services, hotspots were observed in the southwestern and eastern bay area, especially in central Jiangmen, southeastern Zhaoqing, and eastern Huizhou, while coldspots were identified in the central and northwestern regions, including Foshan, Dongguan, Shenzhen, Hong Kong, and western Zhaoqing. In terms of carbon sequestration, hotspots were mainly situated in the northwestern, northern, and eastern bay area, particularly in central and western Zhaoqing, northern and eastern Huizhou, and southern Shenzhen. Coldspots for carbon sequestration formed a continuous spatial cluster in the central bay area, spanning watersheds in Foshan, Guangzhou, Dongguan, northern Zhongshan, and western Shenzhen.
Watersheds characterized by both high service values and spatial aggregation at a 99% confidence level were delineated as key ecological service protection areas. One type of co-protection area integrating three key services—carbon sequestration, water conservation, and soil conservation—was identified in the eastern watersheds of Zhaoqing in the northwestern bay area (Figure 7). Six categories of dual-service co-protection areas were mapped (Figure 7): carbon sequestration and water conservation co-protection areas in northern and western Zhaoqing; carbon sequestration and soil conservation co-protection areas concentrated in eastern Huizhou, with minor distributions in northeastern Guangzhou, eastern Zhaoqing, and southeastern Shenzhen; water conservation and soil conservation co-protection areas in northern Zhaoqing; water conservation and stormwater runoff regulation co-protection areas in eastern Zhaoqing; grain production and water conservation co-protection areas in southeastern Zhaoqing; and soil conservation and stormwater runoff regulation co-protection areas in northern Guangzhou and northwestern Huizhou.
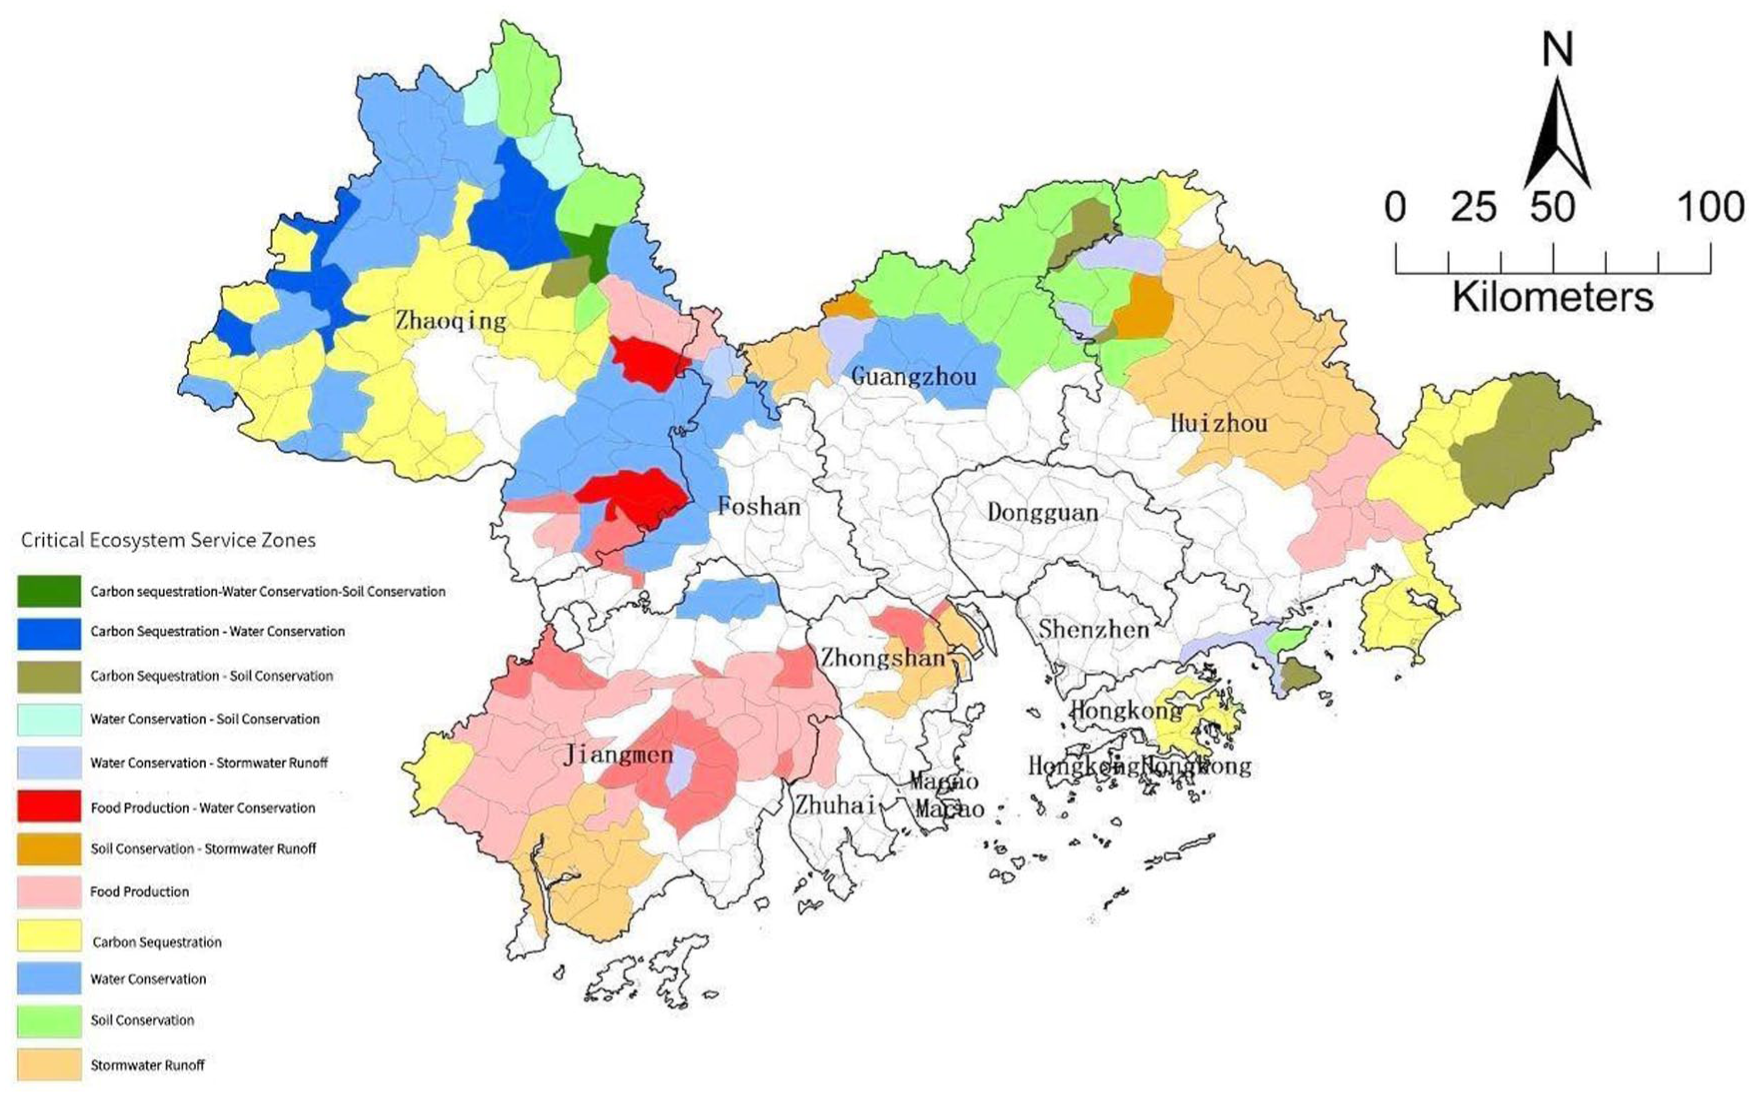
Key ecosystem service zones of the Greater Bay Area.
Five types of single-service protection areas were also delineated (Figure 7). Grain production protection areas were primarily located in Jiangmen, with additional distributions in southeastern Zhaoqing and southern Huizhou. Carbon sequestration protection areas were mainly found in central and western Zhaoqing and eastern Huizhou. Water conservation protection areas were concentrated in northern and southwestern Zhaoqing, extending into central Guangzhou. Soil conservation protection areas were distributed across northeastern Zhaoqing, northern Guangzhou, and northwestern Huizhou, with minor occurrences in eastern Shenzhen. Stormwater runoff regulation protection areas were continuously clustered in northern Huizhou, with limited presence in eastern Zhongshan and southern Jiangmen. The spatial distribution of these protection areas reflects two administrative scenarios. First, some protection zones fall entirely within a single administrative region, such as the carbon sequestration and water conservation co-protection area in Zhaoqing. Second, other zones span adjacent administrative boundaries, exemplified by the soil conservation protection area extending across northern Guangzhou and northwestern Huizhou. For the latter, given that the ecosystems providing these services are spatially contiguous and transcend administrative divisions, it is both appropriate and necessary to implement cross-jurisdictional ecological coordination and establish integrated management mechanisms between neighboring administrative regions.
Regional comprehensive zoning and management
Based on the spatial patterns of ecosystem services (ES), the Guangdong-Hong Kong-Macao Greater Bay Area was classified into three functional zones of high, medium, and low importance (Figure 8). The ES importance exhibited a clear core-periphery gradient, increasing from the central basin towards the outer regions. Low and relatively low importance areas were concentrated in the urbanized central basin, surrounded by a ring of medium importance zones. High importance areas formed contiguous clusters predominantly in the northern, northeastern, and northwestern parts of the bay area.
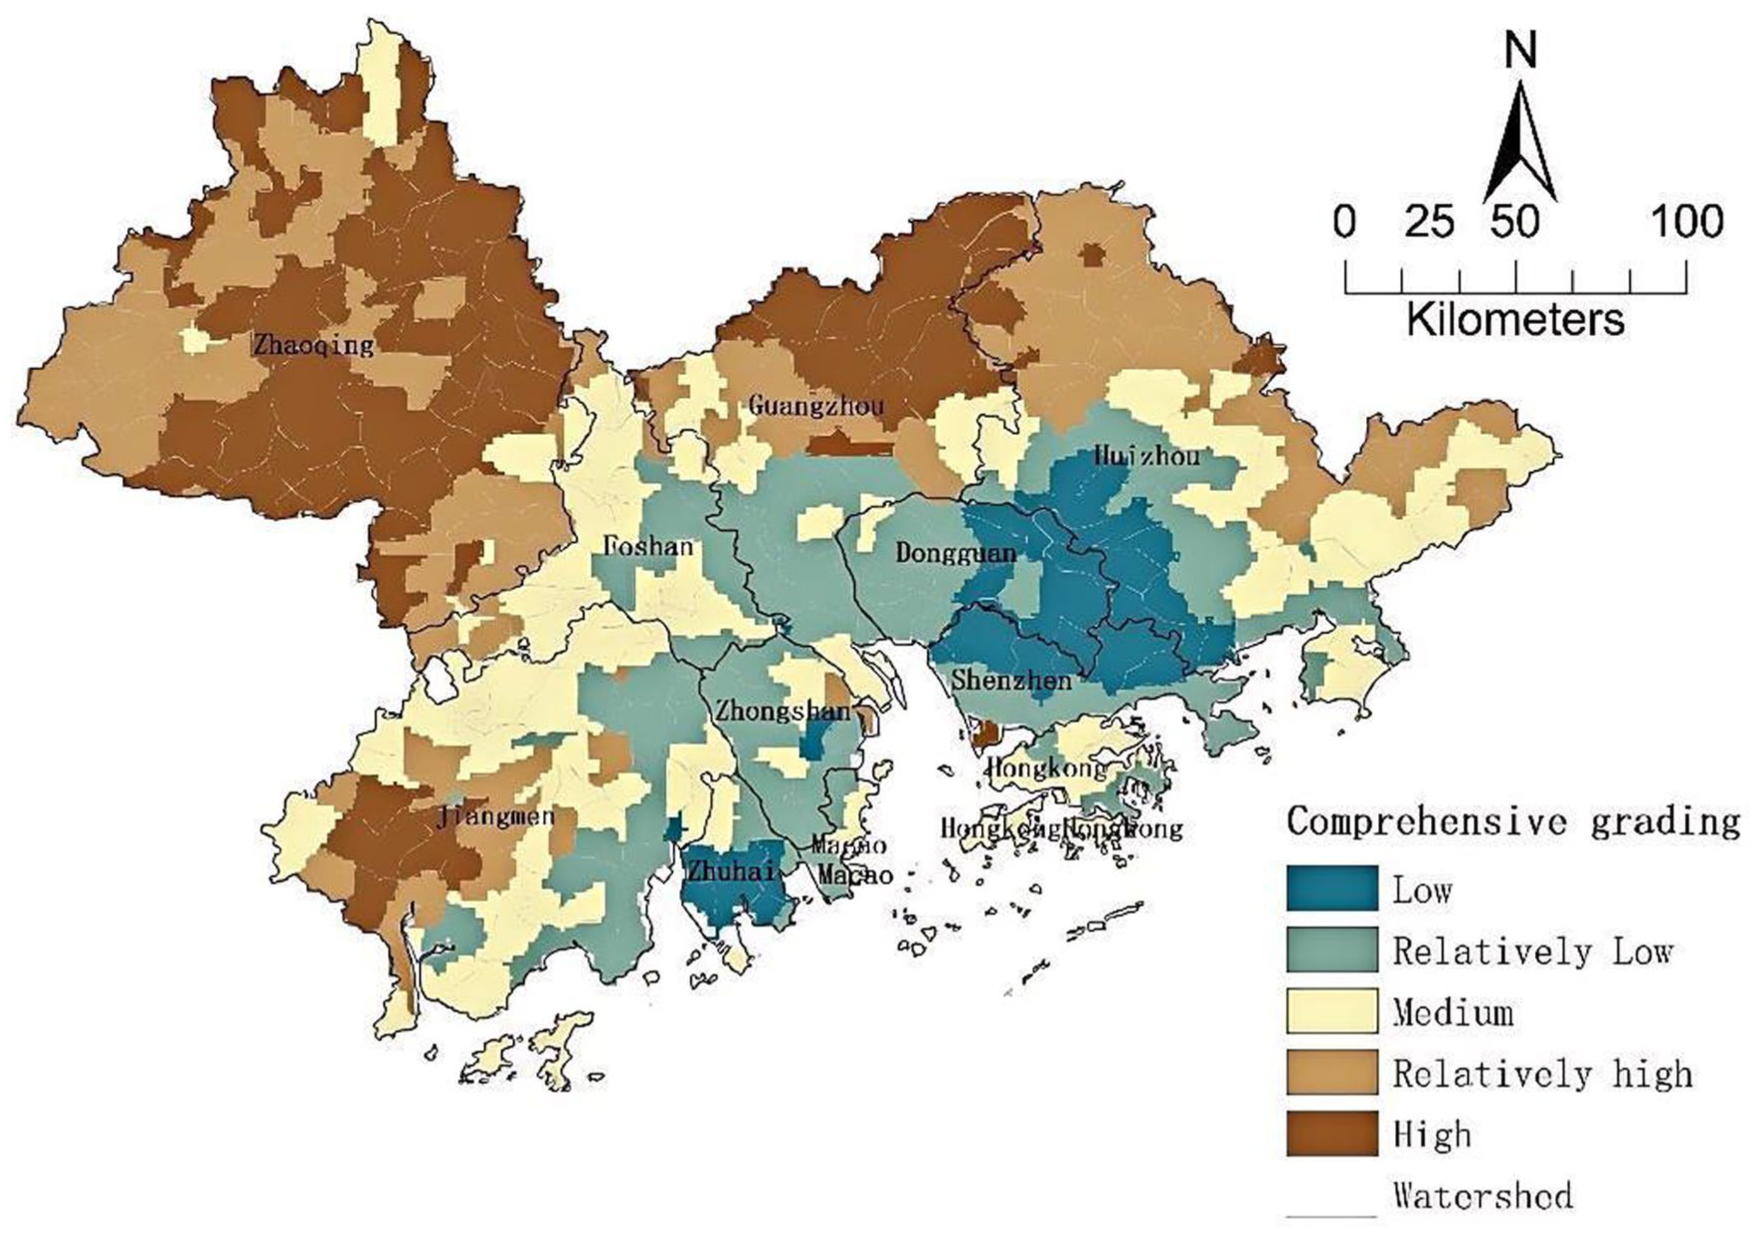
Comprehensive grading of ecosystem service functions.
The high importance zone encompasses diverse ecosystems, including southwestern mountain forests, and concentrates the majority of identified ES hotspots. Hotspot analysis revealed one co-protection area integrating three key services, six dual-service co-protection areas, and five single-service protection areas within this zone. Except for grain production, hotspots for water conservation, soil conservation, stormwater regulation, and carbon sequestration are all aggregated here. This spatial convergence underscores its critical role in the regional ecological security pattern. Effective management requires transcending administrative boundaries to implement unified forest conservation and watershed-based governance. Establishing inter-regional ecological compensation mechanisms is particularly vital for cross-jurisdictional co-protection areas, with compensation standards informed by precise ES quantification and flow simulation. Future efforts should focus on delineating ecological redlines with greater spatial precision, guided by in-depth hotspot analysis, and on constructing a connected ES network through sub-basin zoning and ecological corridor restoration.
The medium importance zone, characterized by moderate levels across multiple services, possesses significant potential for ES enhancement due to its complex ecological setting. It should be prioritized for future ecological restoration and functional improvement initiatives within the bay area.
In contrast, the low and relatively low importance zone, corresponding to ES coldspot aggregations, faces acute ecological risks including flooding, soil erosion, and severe habitat fragmentation driven by urban expansion. Primary management objectives should center on coastal wetland protection, restoration of degraded wetland ecosystems, and stringent containment of further urban sprawl. Coordinating urban development with ecological preservation is essential to alleviate pressure on natural systems. Transforming this zone requires integrating ecological considerations into urban planning through strategies such as green infrastructure development, sponge city construction, and the promotion of compact, ecologically sensitive urban forms to meet the region's sustainable development imperatives.
Discussion
Addressing methodological gaps: A dynamic framework for city-cluster ES assessment
This study directly addresses the knowledge gap identified in the Introduction: the lack of a comprehensive technical framework for systematically assessing multiple ES and their spatiotemporal dynamics within a highly urbanized city-cluster. Traditional conservation planning, often reliant on static or single-service assessments, is poorly suited to the rapid land-use transformations characteristic of regions like the Guangdong-Hong Kong-Macao Greater Bay Area (GBA). By integrating GIS spatial analysis, model simulation, and statistical hotspot detection (Getis-Ord Gi*) across a 15-year period (2000–2015), we developed an operational workflow that moves beyond descriptive mapping. This framework explicitly captures the dynamic interplay between land-use change—specifically, the rapid urban expansion and concurrent loss of cropland and forest—and the evolving spatial patterns of key ES, including water conservation, soil retention, and carbon sequestration. The temporal analysis revealed a critical shift: early-stage urbanization drove broad ES declines, while later-stage dynamics were dominated by cropland loss impacting specific provisioning services. This finding underscores the necessity of phase-adaptive management strategies, a nuance missed by static assessments. Our integrated, multi-service approach thus provides a replicable model for translating ES science into a dynamic decision-support tool tailored to the complexities of major urban agglomerations.
From assessment to action: Informing ecological planning and cross-jurisdictional governance
The second objective of this study was to develop a technical workflow for ES functional zoning that provides actionable support for spatial planning. The resultant zoning scheme—delineating high, medium, and low ES importance areas—offers a functionally-grounded basis for evaluating and refining existing ecological planning instruments. The high spatial correspondence between our identified high-importance zones (particularly multi-service co-protection areas) and current Ecological Protection Redlines (EPRs) validates the functional logic of existing conservation boundaries. However, the analysis also reveals critical misalignments that hinder effective management. Most notably, key ecological zones, such as the soil conservation area spanning the Guangzhou-Huizhou border, are fragmented by administrative boundaries, creating governance gaps. Furthermore, medium-importance zones with high restoration potential often coincide with urban development corridors in statutory plans, highlighting a fundamental land-use conflict.
To bridge these gaps, the zoning results necessitate a tiered governance response:
For High-Importance Co-protection Zones: Management must be organized around ecological rather than administrative units. We advocate for formalizing cross-jurisdictional co-protection areas into unified ecological management districts, supported by inter-regional compensation mechanisms informed by our ES quantification.
For Medium-Importance Potential Zones: Spatial plans must legally recognize these areas as ES recovery zones, promoting low-impact development and prioritizing them for ecological restoration to enhance landscape connectivity.
For Low-Importance Urban Zones: Policy must pivot towards active ecological regeneration, integrating ES objectives into urban infrastructure projects through Nature-based Solutions (NbS) to mitigate risks like urban flooding.
Contributions, limitations, and future pathways
This study contributes to the field by operationalizing a dynamic, multi-ecosystem service framework for conservation prioritization within a complex city-cluster. This work directly addresses calls for more applicable ES science in urban planning. The integration of spatiotemporal analysis with statistically robust hotspot detection offers a transparent and replicable methodology for identifying spatially synergistic conservation priorities, thereby advancing beyond traditional approaches centered solely on biodiversity or individual services.
Several limitations of this work indicate productive avenues for future research. First, while ecosystem services serve as effective proxies for ecological function, their precise correspondence with biodiversity metrics requires further empirical validation. Subsequent research could strengthen these frameworks by integrating species distribution data. Second, our zoning analysis is based primarily on ES supply. Incorporating spatially explicit data on societal demand would illuminate critical supply-demand mismatches and allow for more precise policy targeting. Finally, implementing the proposed management strategies necessitates navigating complex governance landscapes. Future efforts should focus on institutional design for cross-jurisdictional coordination bodies, developing equitable compensation schemes, and formally integrating ES zoning outputs into the legal and regulatory frameworks governing land-use planning. Addressing these challenges is essential for translating ES mapping from a primarily analytical exercise into a robust driver of sustainable spatial governance.
A pertinent consideration is the study's temporal scope, covering 2000–2015. While this period precedes the most recent years, it strategically captures the most intensive phase of urbanization and land-use transformation in the GBA, establishing a critical ecological baseline. The methodological framework itself retains its validity, and the core spatial patterns of ES identified—such as the stable ecological core in the northern periphery—exhibit persistence. Crucially, the co-protection zones identified retain high policy relevance. They highlight areas of enduring ecological value or persistent pressure, revealing ecological security structures and conflicts that remain aligned with contemporary conservation priorities. These findings, including their consonance with concepts like the Ecological Conservation Belt in recent GBA outlines, continue to offer direct scientific support for current efforts in ecological spatial management and optimization.
Conclusions
This study developed and applied an integrated framework for the dynamic assessment and zoning of multiple ES in the Guangdong-Hong Kong-Macao Greater Bay Area (GBA) from 2000 to 2015. The findings confirm a pronounced spatial differentiation of ES across the region, with high-value supply areas predominantly clustered in the northern, northwestern, and eastern peripheries, while the central urbanized basin functions as a core area of ES depletion.
A statistically robust analysis of ES hotspots and coldspots provided a functional basis for delineating key conservation priorities. The results identified spatially synergistic co-protection areas, primarily located in Zhaoqing and eastern Huizhou, which integrate multiple high-value services and represent critical nodes for the regional ecological security pattern. Additionally, single-service protection zones were mapped, highlighting areas of outstanding provision for services such as grain production and carbon sequestration.
Temporal analysis revealed an overall improvement in ES functions over the 15-year period, yet this trend was spatially heterogeneous. Significant gains were recorded in soil conservation and grain production, whereas regulating services like stormwater runoff regulation exhibited a contrasting north-south trajectory of change. These dynamic patterns underscore the evolving pressure points within the urbanizing landscape.
The spatial zoning derived from this analysis offers direct input for optimizing ecological planning. High-importance zones should be formally integrated into ecological protection redlines and managed as coherent ecological units, necessitating cross-jurisdictional coordination mechanisms for areas spanning administrative boundaries. This work demonstrates that a dynamic, multi-ES assessment framework can effectively translate ecological science into a spatially explicit decision-support system, providing a replicable model for guiding sustainable spatial governance in complex city-clusters.
Footnotes
Funding
The author disclosed receipt of the following financial support for the research, authorship, and/or publication of this article: This research was funded by National Natural Science Foundation of China (Grant No. 72104232), A Soft Science Research Project by Shanghai Science and Technology Commission (Grant No. 23692117800):Synergistic ES and Optimization of Multifunctional Land Regulation in Shanghai and Its Surrounding Areas, National Natural Science Foundation of China (Grant No.42130510).
Declaration of conflicting interests
The author declared no potential conflicts of interest with respect to the research, authorship, and/or publication of this article.