
Abstract
Rapid urban expansion has contributed to the depletion of urban ecological resources, resulting in challenges to achieving sustainable urban development. This encompasses disputes between stakeholders of ecological resources and conflicts between quality and quantity. This study aims to address the conflicting issues surrounding ecological resources by developing a comprehensive framework and evaluation methodology. The proposed system integrates a 20-item urban ecological indicator system, incorporating perspectives from scientists, governments, and urban residents, formed integration perspectives urban ecological indicator (IPUEI). The framework was applied to an urban ecological assessment of subdistrict units in the main urban area. The study comprehensively applied the improved coupling coordination degree model, the location quotient to analyze the coordination relationship among ecological, production, and living spaces, as well as among indicator types of quantity, quality and accessibility. We also quantified the differences in the distribution of ecological resources across diverse age population groups. The results show that: (1) The value of IPUEI was high in the urban core area, and the proportion of subdistricts where resource efficiency becomes the dominant indicator reaches 57%. (2) Over 60% of the subdistricts demonstrated good coordination in the degree of coupling coordination for ecological resource distribution. (3) The spatial distribution of IPUEI scores and location quotient was inversely related, and the most significant disparity was observed among the elderly population residing in the urban core area. (4) We need to alleviate approximately 37% of the population in the central city to achieve a balance between supply and demand. The study reveals an imbalance in the distribution of urban ecological resources using fine-grained data, and it discusses the regulation of distribution of population and ecological resources to achieve ecological and social synergy and sustainable development.
Keywords
Introduction
Urbanization has driven swift economic expansion but presents substantial obstacles, including environmental pollution, an aging population, and traffic congestion. There is an urgent need to transform built urban areas, strengthen urban planning and management, and ensure coordination and alignment between population needs and services (Hepburn et al., 2021). China is in a ‘new normal’ transition period marked by profound social, economic, and ecological changes (Liu et al., 2018b; Meng et al., 2020). The urban construction of China is transitioning from an incremental to a stock development model, particularly in developed regions. This shift underscores the pressing need to improve urban ecology and meet the growing demand of urban residents.
The construction of ecological indicators implies a process of selection, integration and aggregation, and the choice of indicators relates to the direction of urban ecological construction (Turnhout et al., 2007). For instance, species richness is merely one of the indicators that can be listed to represent the ecological quality of a certain natural area. Recent studies on ecological civilization have primarily focused on its indicators and evaluation methods (Meng et al., 2021). Large-scale ecological evaluation is usually represented by remote sensing inversion, such as urban environmental quality indicator (Musse et al., 2018), a remote sensing-based ecological indicator (Hu and Xu, 2018). The ecological livability index was compiled from five aspects: greenness, temperature, dryness, water-wetness, and atmospheric turbidity (Yu et al., 2024). It is more convenient to use remote sensing data to measure and monitor the urban ecological environment, especially in developing countries, which can provide essential data on urban development and environmental conditions that may not be accessible through other means (Miller and Small, 2003).
However, many evaluation systems, such as urban ecological risk assessment (Li et al., 2020), ecological quality assessment (Hang et al., 2020) and landscape preference evaluation (Williams and Cary, 2002), have focused on specific aspects of urban ecology. Different scholars have attempted to define the concept of urban ecology from their own disciplinary fields (Wu, 2014), including urban sociology proposed by sociologists (Kubicki, 2022), the relationship between urbanization spatial pattern and ecological process understood by landscape ecologists (Bogaert et al., 2014; Luck and Wu, 2002). But taken together, the biased perspective from which the city is viewed somewhat limits the objective assessment of the city. For example, the focus on urban ecology will be different between governments and long-term urban residents, and there are greater difficulties in integrating indicators (D’Amico et al., 2020). To comprehensively characterize urban ecosystems, this study integrates multidisciplinary perspectives from scientists, governments and urban residents, while establishing an analytical framework to examine the interplay between ecological processes and social dynamics. Urban ecosystems and functions have been reconfigured in the spatial structure, resulting in profound changes in the environmental and ecological processes of cities, which has led to a growing interest in sustainable urban development (Pincetl, 2012). Ecological, production and living spaces are the locations for all human activities, and urban development has brought about contradictions between nature and society, which are spatially manifested in the spatial game among these three spaces (Wang et al., 2020). This means that sustainable urban development needs to reconcile the concerns of various stakeholders and promote synergistic development of nature and society, in addition to the need to harmonize the concerns of all stakeholders (Wang et al., 2021; Weng et al., 2022; Xu and Hu, 2020). The impact of population growth on the consumption of urban ecological resources should not be overlooked. Furthermore, limited land resources are inadequate to sustain the increasing population, underscoring the importance of addressing the relationship between population and ecological resources for sustainable development (Shen et al., 2020). The coupling coordination degree (CCD) model and location quotient are the main methods used to study the coordination between nature and society. The CCD model has been widely used in studying the simultaneous development of economy, environment and society (Cheng et al., 2019), characterizing the coordinated relationship between urbanization and environment (Li et al., 2012), aspects of the relationship between socio-economic activities and regional ecology and environment (Cai et al., 2021), multidimensional evaluation of ecological well-being performance (Li, 2022), and the relationship between carbon emissions and the ecological environment, meaning it has a wide range of applications (Chen et al., 2020). While the location quotient model was mostly used in regional economics in the early days, studies have begun to use it on urban ecological research in recent years and achieved better results (Billings and Johnson, 2012; Norcliffe, 1983).
Therefore, it is necessary to use evaluation indicators integrating the perspectives of various parties to analyze the coupled and coordinated relationship between different spaces, as well as to explore the supply and demand characteristics of different age groups based on fine-grained data. The main objectives of this study include: (1) The establishment of integration perspectives urban ecological indicators (IPUEI) connotations and assessment methods through the integration of multiple stakeholder. (2) Analyzing the coupling and coordination characteristics among ecological, production, and living spaces, as well as among indicator types of quantity, quality and accessibility. (3) Evaluating the primary distributional and typological characteristics of the IPUEI, as well as the supply and demand for different age groups.
Data and methods
The construction and evaluation of IPUEI was divided into three main steps (Figure 1). First, we based it on the needs of urban stock development, a new urban ecological indicator, that is integration perspectives urban ecological indicators (IPUEI) was constructed by integrating the perspectives of scientists, governments and residents, aiming to balance the needs of different interest groups. Second, based on the CCD model, we explored the coupling coordination relationship among ecological, production, and living spaces in the study area, and the coupling coordination among the three different types of indicators: quantity, quality and accessibility, aiming to achieve spatial balance. Finally, we applied the location quotient model to study the supply-demand relationship between different age population groups and ecological resources from the urban center to the urban fringe, aiming to achieve a balance between population and resources.
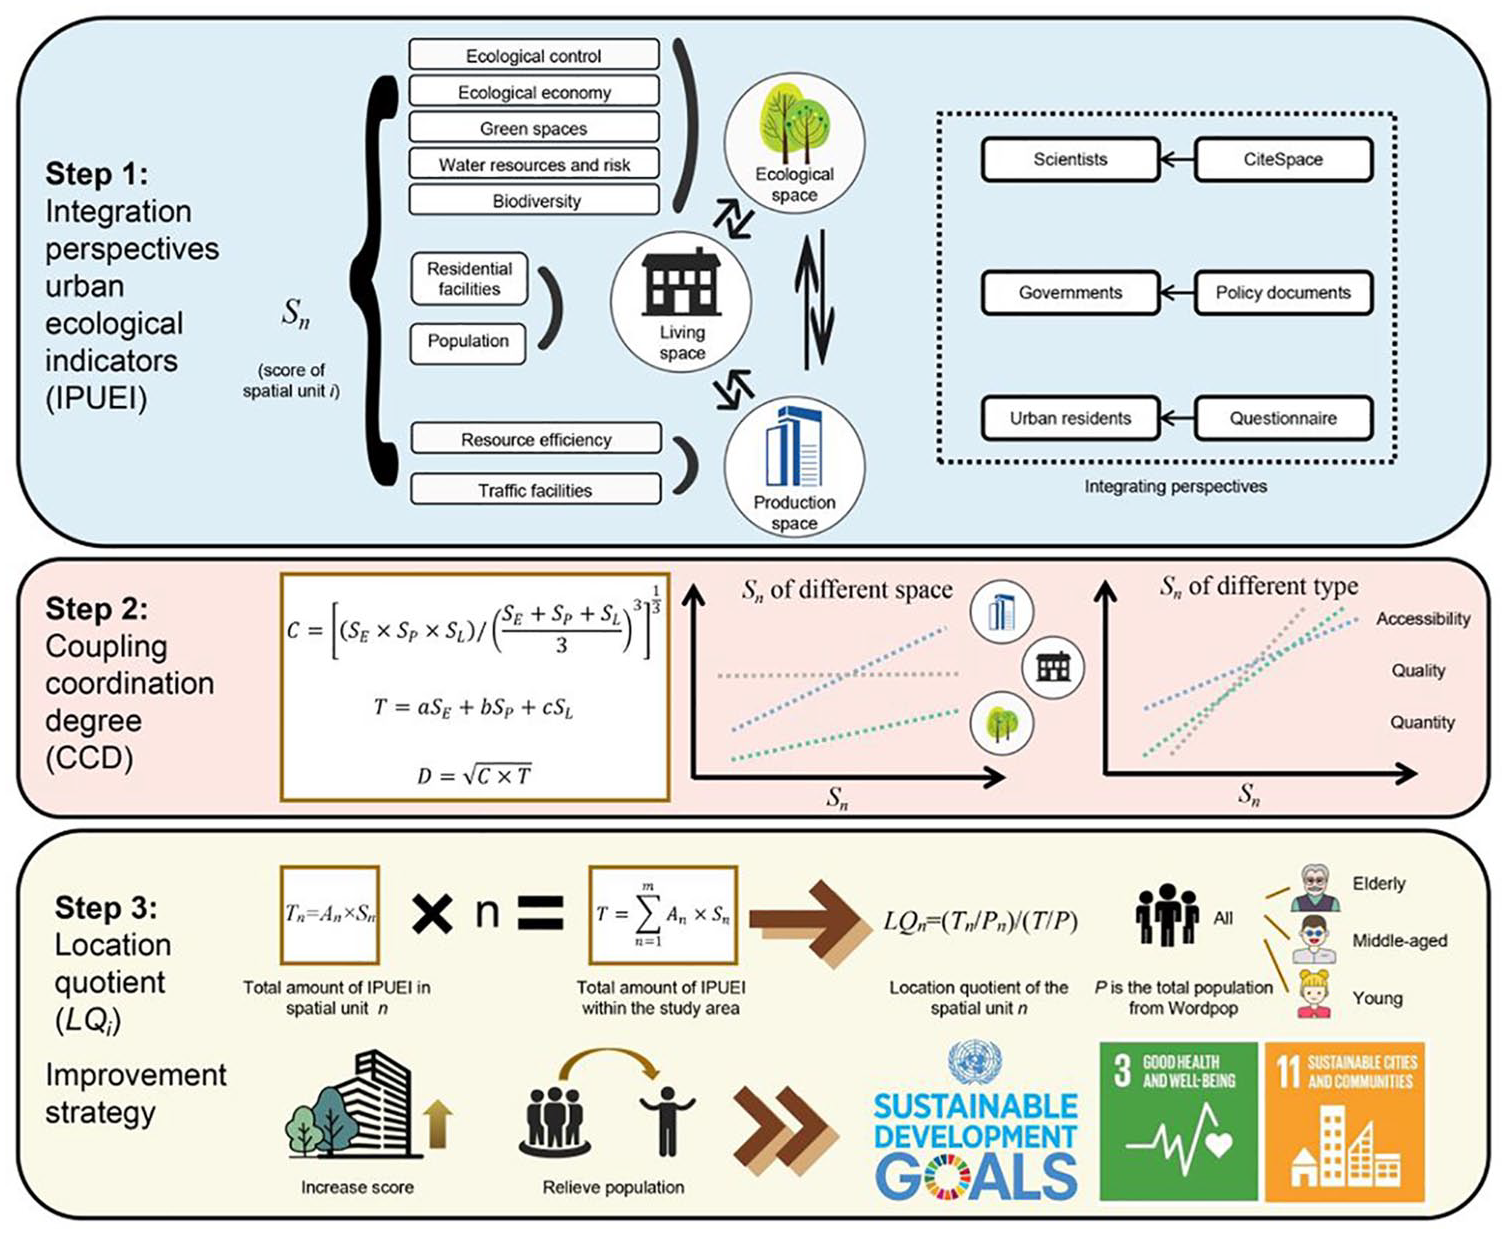
Research framework.
Study area
Beijing is the capital of China and located in the northern part of the North China Plain, the climate is warm temperate semi-humid semi-arid monsoon (People’s Government of Beijing Municipality, 2023). In 2017, the Beijing issued the Urban Master Plan (2016-2035). The plan lists Dongcheng, Xicheng, Chaoyang, Haidian, Fengtai, and Shijingshan District as the central city (A), with a total area of 1378 km2 (Beijing Planning and Land Resources Management Committee, 2017). This research area is the central city (A), which is the main area political, cultural, international communication, and scientific and technological innovation center in China (Figure 2). The central city (A) resident population reached 11 million in 2021, accounting for 50.1% of the total population in Beijing (Beijing Statistical Yearbook Committee, 2022). China is currently at a critical stage in its economic growth, transitioning from high-speed to high-quality development. As a priority city for transformation, Beijing has actively promoted ecological environment construction and high-quality development (Pan et al., 2021). Therefore, establishing reasonable urban ecological indicators and conducting their assessment are in line with the current requirements for high-quality development. Meanwhile, as a megacity, Beijing, after experiencing significant urban expansion, has typical characteristics in terms of the huge pressure endured by its ecological resources (Wang et al., 2022).
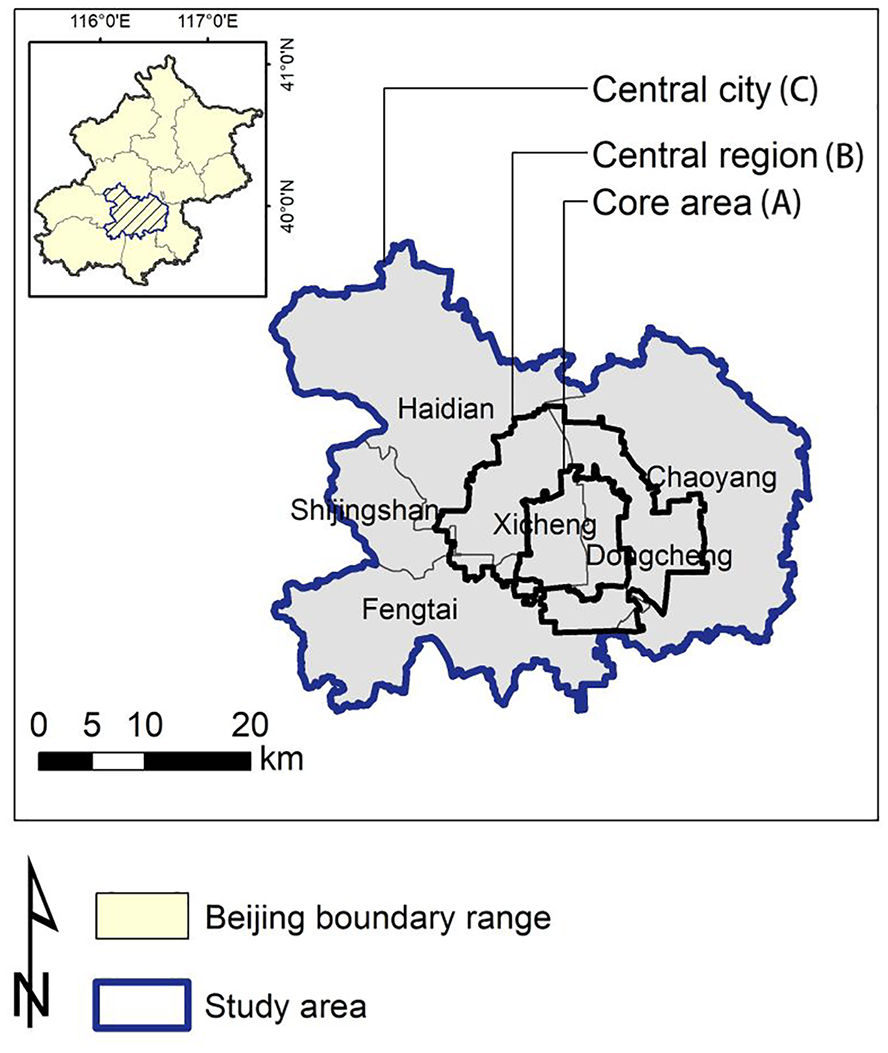
Study area.
Indicator system and data sources
This study integrated scientists, governments and urban residents’ perspectives, and covers what is required for ecological, production, and living spaces (Yan et al., 2023). The scientists’ perspective was based on CiteSpace 6.1.R2, and was searched for via two major databases, CNKI and web of science. In this study, the node type keywords were selected and the mediational centrality of the analyzed keywords was extracted for comparative analysis. From government documents we collected relevant policy guidelines from national ministries and academic groups, and generalized and organized the indicators therein, collecting a total of eight major policy documents. The questionnaire was distributed nationwide using the Power CX research platform. A total of 4169 valid questionnaires were obtained (see Online Supplementary Material Table S1 and S2 for full details). We have summarized 10 objectives based on the elements of the indicators (Table 1). The metric framework was developed through statistical weighting derived from the proportional contributions assigned to each constituent element by three key stakeholder groups: scientific experts, governmental authorities, and urban residents. This methodological approach ensures the integration of multidimensional perspectives from diverse societal actors.
The integrated perspectives urban ecological indicators (IPUEI).
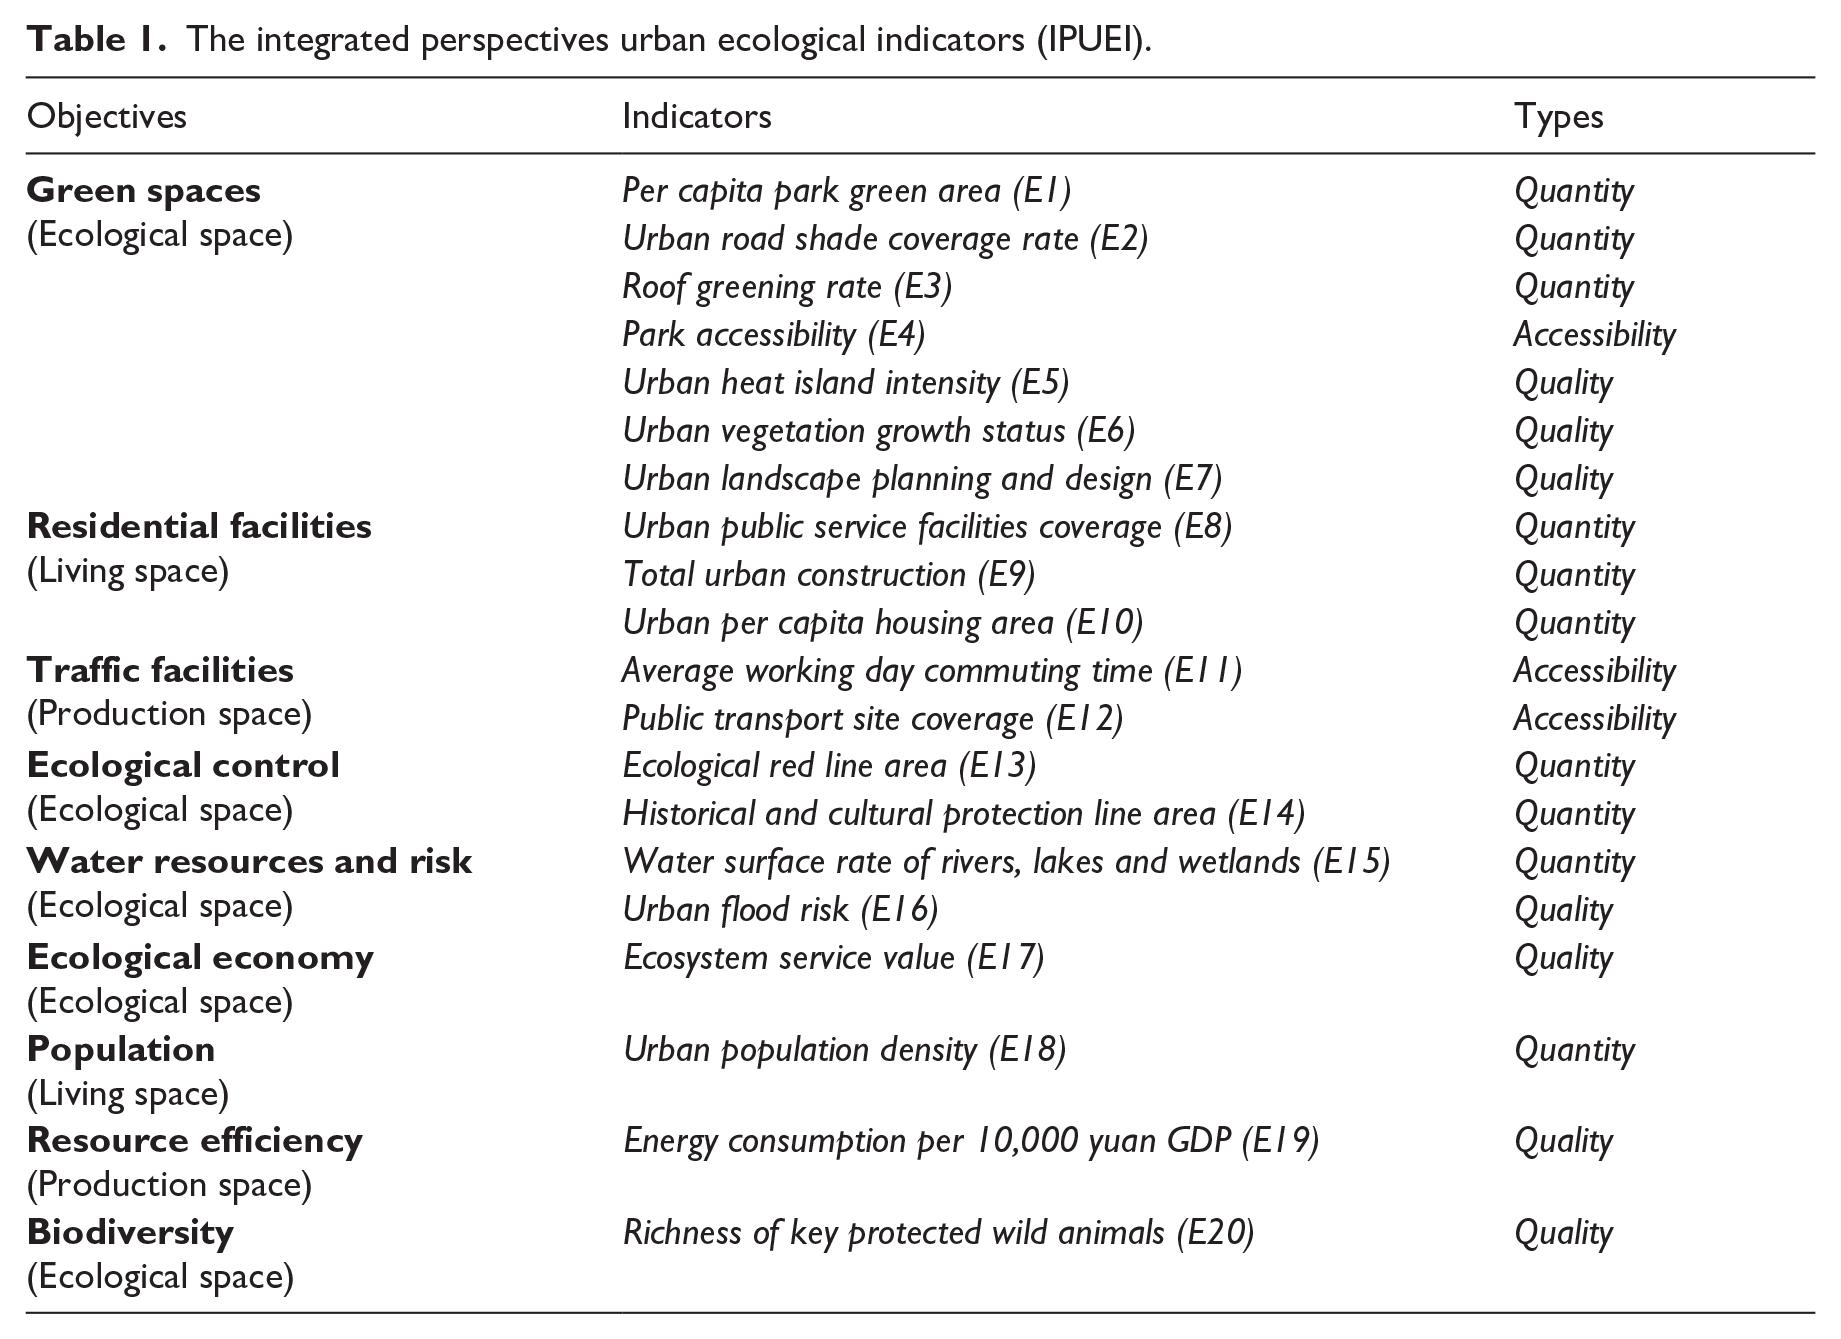
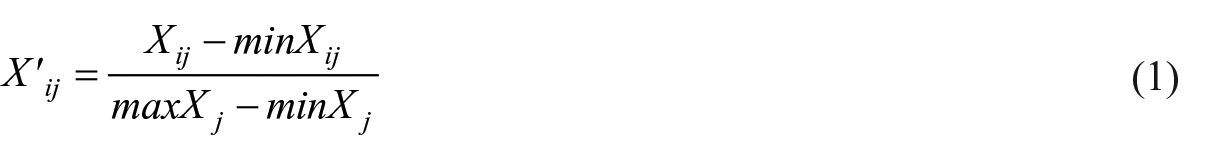
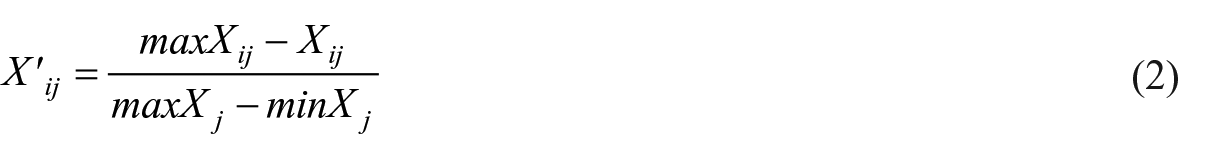
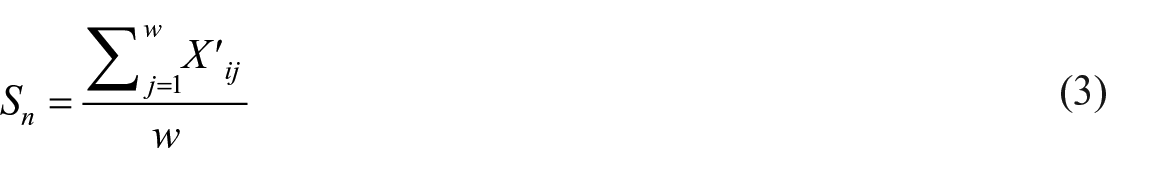
The comprehensive score of IPUEI was calculated by the mean value of the normalized indicator, and X’ij was the standardized result of the first data. Xij is the i-th data in the j-th indicator, and maxXj and minXj are the maximum and minimum values of all data in the j-th indicator. The indicators were divided into positive indicators (1) and negative indicators (2). In this study, urban heat island intensity (E5), average working day commuting time (E11), urban population density (E18), urban flood risk (E16), and energy consumption per 10,000 yuan GDP (E19) were negative indicators, and the rest were positive indicators. The interval of each indicator is 0-1, of which 1 represents the best IPUEI score, and 0 represents the worst. We used the subdistrict as the basic assessment unit (the smallest administrative divisions unit in China). Sn denotes the score of the n-th spatial unit, w indicates the total number of indicators. At the same time, we analyzed the impact of the ecological, living, and production space scores on the total score (Sn).
The data source in the framework of IPUEI evaluation mainly included five aspects: remote sensing data, government website, public scientific data, questionnaire survey data, and network data (for the detailed calculation method see Online Supplementary Material):
1) Remote sensing data. This mainly included urban green space and remote sensing inversion data. The data of urban green space were derived from the remote sensing image of GF-2 satellite clear and cloudless weather in May 2021, using Easy Interpretation software (Beijing Revenue Technology, Beijing, China) interpreted and manually calibrated. The calculation of land surface temperature (LST) was based on Google Earth Engine (GEE), and the surface temperature was inverted by Ermida et al. (2020). This method was based on Landsat 4/5/7/8 satellite inversion of surface temperature, and we used the Statistical Mono-Window (SMW) algorithm to solve the surface temperature.
2) Government official website data. The data on urban park areas, biodiversity protection lists, historical and cultural protection line areas, urban flood risk, and so on were from the official website of the government. Including the official website of Beijing Municipal Forestry and Parks Bureau, Beijing Municipal Cultural Heritage Bureau, Beijing Water Authority public data.
3) Public scientific data. This mainly included species distribution data and ecosystem service value data. Urban species distribution data was based on global biodiversity information facility (GBIF) (GBIF.org, 2023). The ecosystem service value data were derived from the value assessment results of 11 ecosystem services (Xu, 2018).
4) Questionnaire survey. We conducted a questionnaire survey on the maximum acceptable distance to the park for urban residents in Beijing, the mode and time of transportation to the park, and the one-way commuting time on weekdays.
5) The network data. This mainly included population distribution data and point of interest (POI) data. The population data was based on the mobile phone signaling data of three major operators (China Mobile, China Unicom and China Telecom), and the results were calibrated according to the seventh census data. The POI data were obtained through the AMAP Inside (https://lbs.amap.com/). The river and lake wetlands and residential area data were derived from the Baidu map (https://map.baidu.com), and road data was derived from open street map.
Coupling coordination degree model
The coupling coordination degree (CCD) model was used to analyze the relationship between the three ecological, production, and living spaces, and the three different types of indicators: quantity, quality and accessibility. The coupling degree model quantitatively characterizes the interactive relationships among the three elements. The coordination degree model further elucidates their systemic synergy and coordinated interaction, providing a comprehensive assessment framework for evaluating the system’s holistic performance and dynamic equilibrium. The formula is as follows:
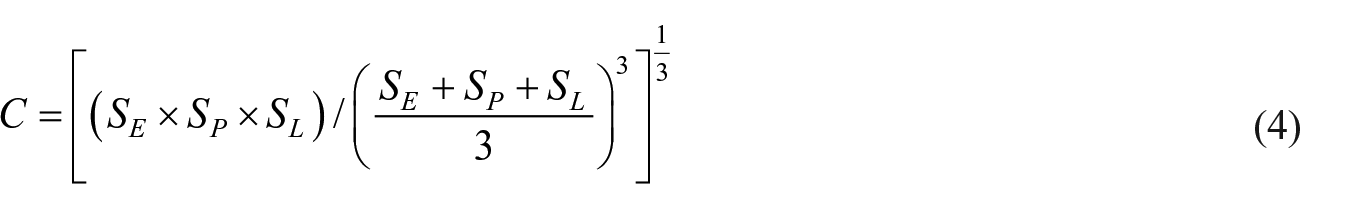

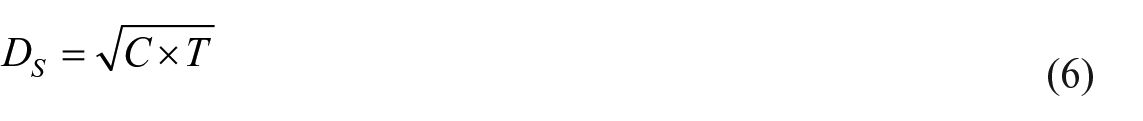
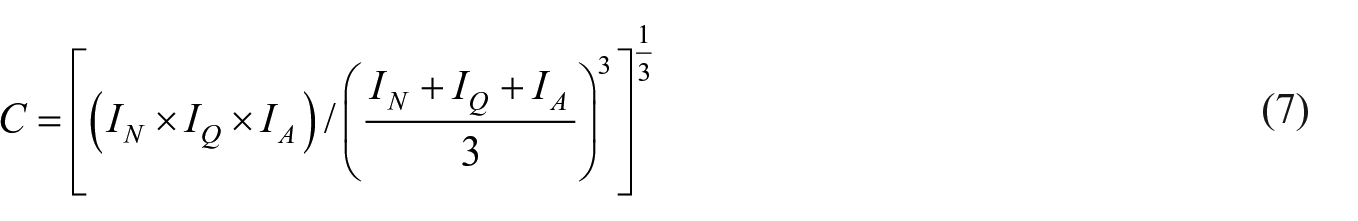


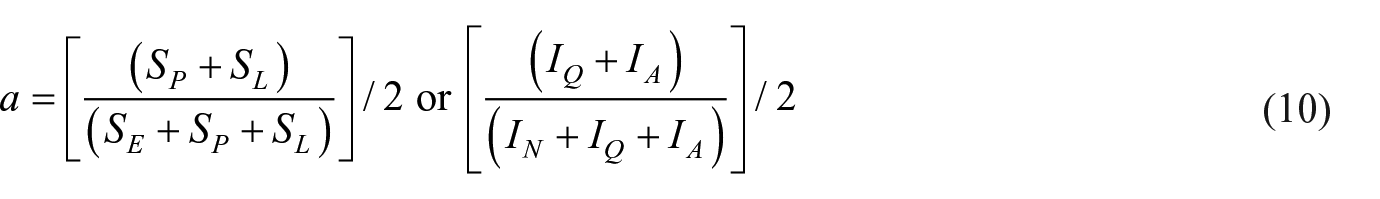
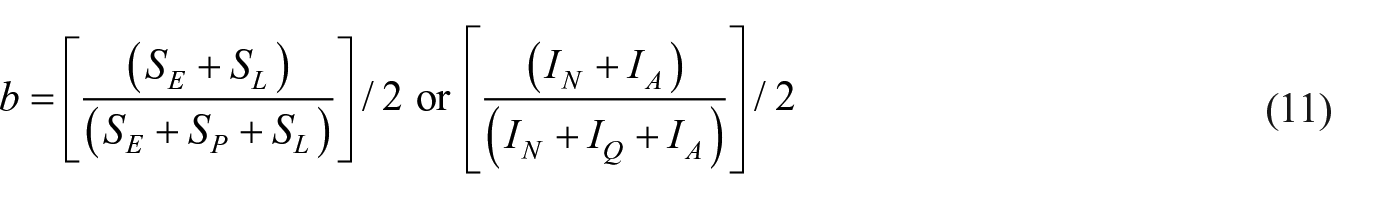
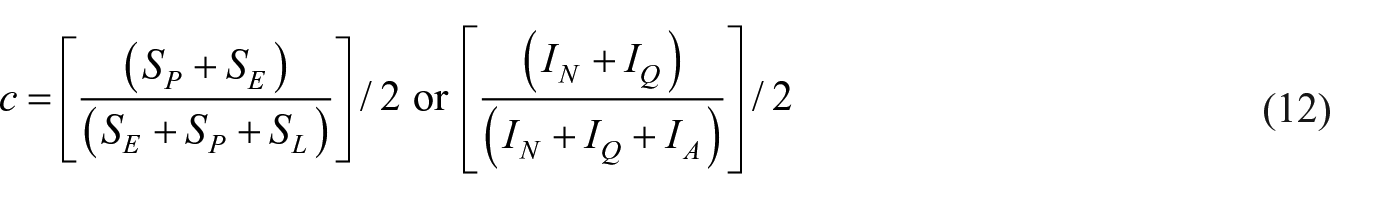
Where C stands for coupling degree; T represents the overall ecological quality; DS and DT indicate CCD of different spaces and indicator types, with a value range between 0 and 1. SE, SP and SL represent the indices of ecological, production and living space respectively. IN, IQ and IA represent the indices of quantity, quality and accessibility respectively. a, b, and c represent the contribution ratio of the three spaces (a + b + c = 1). In general, the ratio of a, b, and c parameters is subjective, and here we use synergy theory to correctly describe the contribution size (Cai et al., 2021; Shen et al., 2018). The calculation formula is as follows:
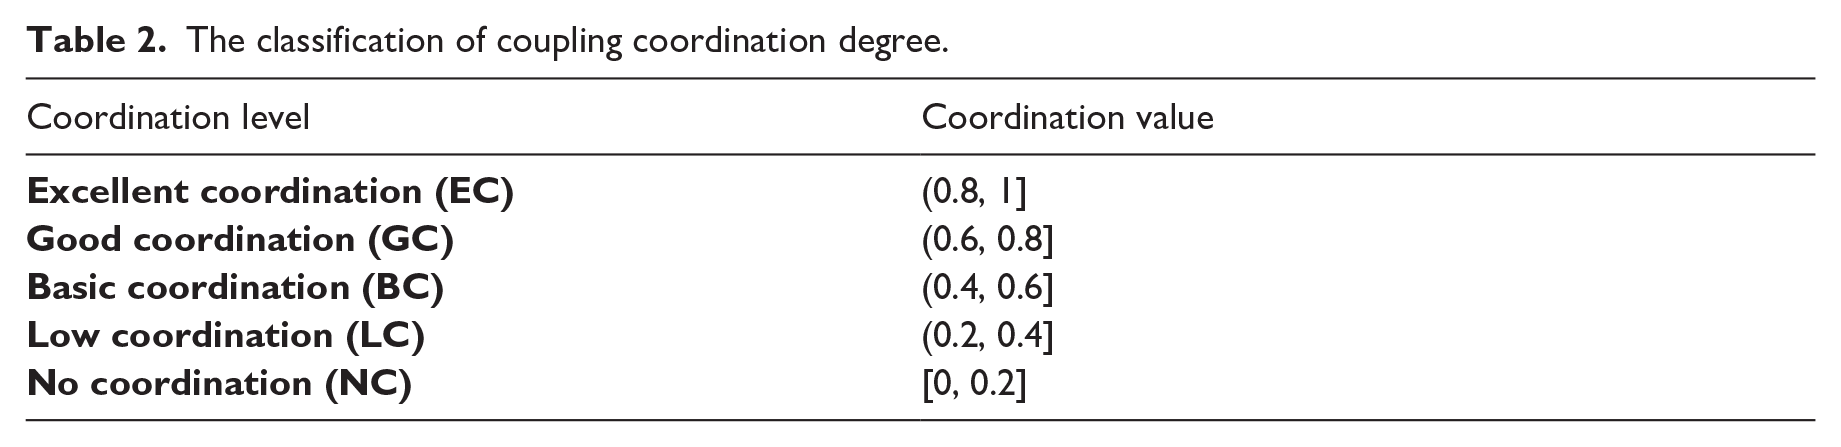
Refer to previous research results (Gan et al., 2020; Li, 2022). The criteria for determining the degree of coupling coordination were shown in Table 2.
The classification of coupling coordination degree.
Location quotient model
We used location quotient to measure the supply and demand of IPUEI. Location quotient is an indicator to study the spatial distribution of regional elements. It has been widely used in the study of green space layout, the fairness evaluation of green view rate, and the balance between green park space and population distribution (Feng et al., 2019; Liu et al., 2023; Xing et al., 2020). Based on the improved location quotient model, the location quotient of IPUEI was the ratio of IPUEI resources per capita in the n-th spatial unit to the total amount of IPUEI resources per capita.

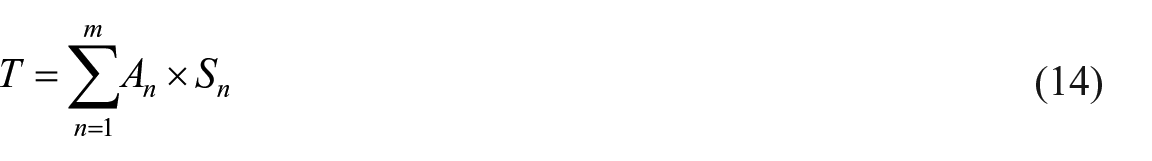

In the formula: Tn is the total amount of IPUEI in spatial unit n, An represents the area of spatial unit n, Sn represents the IPUEI evaluation score of spatial unit n; T is the total amount of IPUEI, m denotes the total number of space units; LQn represents the location quotient of the spatial unit n, Pn represents the population number in the spatial unit n, and P is the total population number. For different age groups, Pn represents the population number of that age group in spatial unit n, and P is the total population number of the age groups. When the location quotient is less than 1, IPUEI supply and demand level of the unit is lower than average IPUEI supply and demand level of the study area. The smaller the value, the lower the supply and demand level. When the location quotient exceeds 1, IPUEI supply and demand level of the unit is higher than average IPUEI supply and demand level of the study area. The larger the value, the higher the supply and demand level.
The population data with age information was from China 100 m Age structures (2022) in Wordpop global population data, estimates of the total number of people per grid square were broken down by gender and age groups (including 0-1 and by 5-year up to 80+), and country totals were adjusted to match the corresponding official United Nations population estimates that have been prepared by the Population Division of the Department of Economic and Social Affairs of the United Nations Secretariat (2019 Revision of World Population Prospects) (Bondarenko et al., 2020). The study divided the population age into three sections, 60 years old and above for elderly individuals, 20-59 years old for the middle-aged and young adult individuals (hereinafter, the middle-aged and young adult individuals are referred to as "middle-aged individuals" for ease), and 0-19 years for young individuals. Based on the results of location entropy acquisition, we propose relative urban ecological enhancement criteria and relieve population strategies for different types of areas.
Results
Spatial distribution characteristics and dominant objects of IPUEI
There were obvious differences in spatial distribution characteristics of IPUEI (Figure 3). The IPUEI was mainly higher in the middle and northwest, and lower in the southwest and south. Among them, the proportion of IV-level and V-level subdistricts gradually increased from the core area (C) to the central city (A). Remote sensing imagery features show a roughly equal share of housing and green space in I-level, an over-concentration of building density in II-level and III-level, and a preponderance of factories and unopened land in V-level.
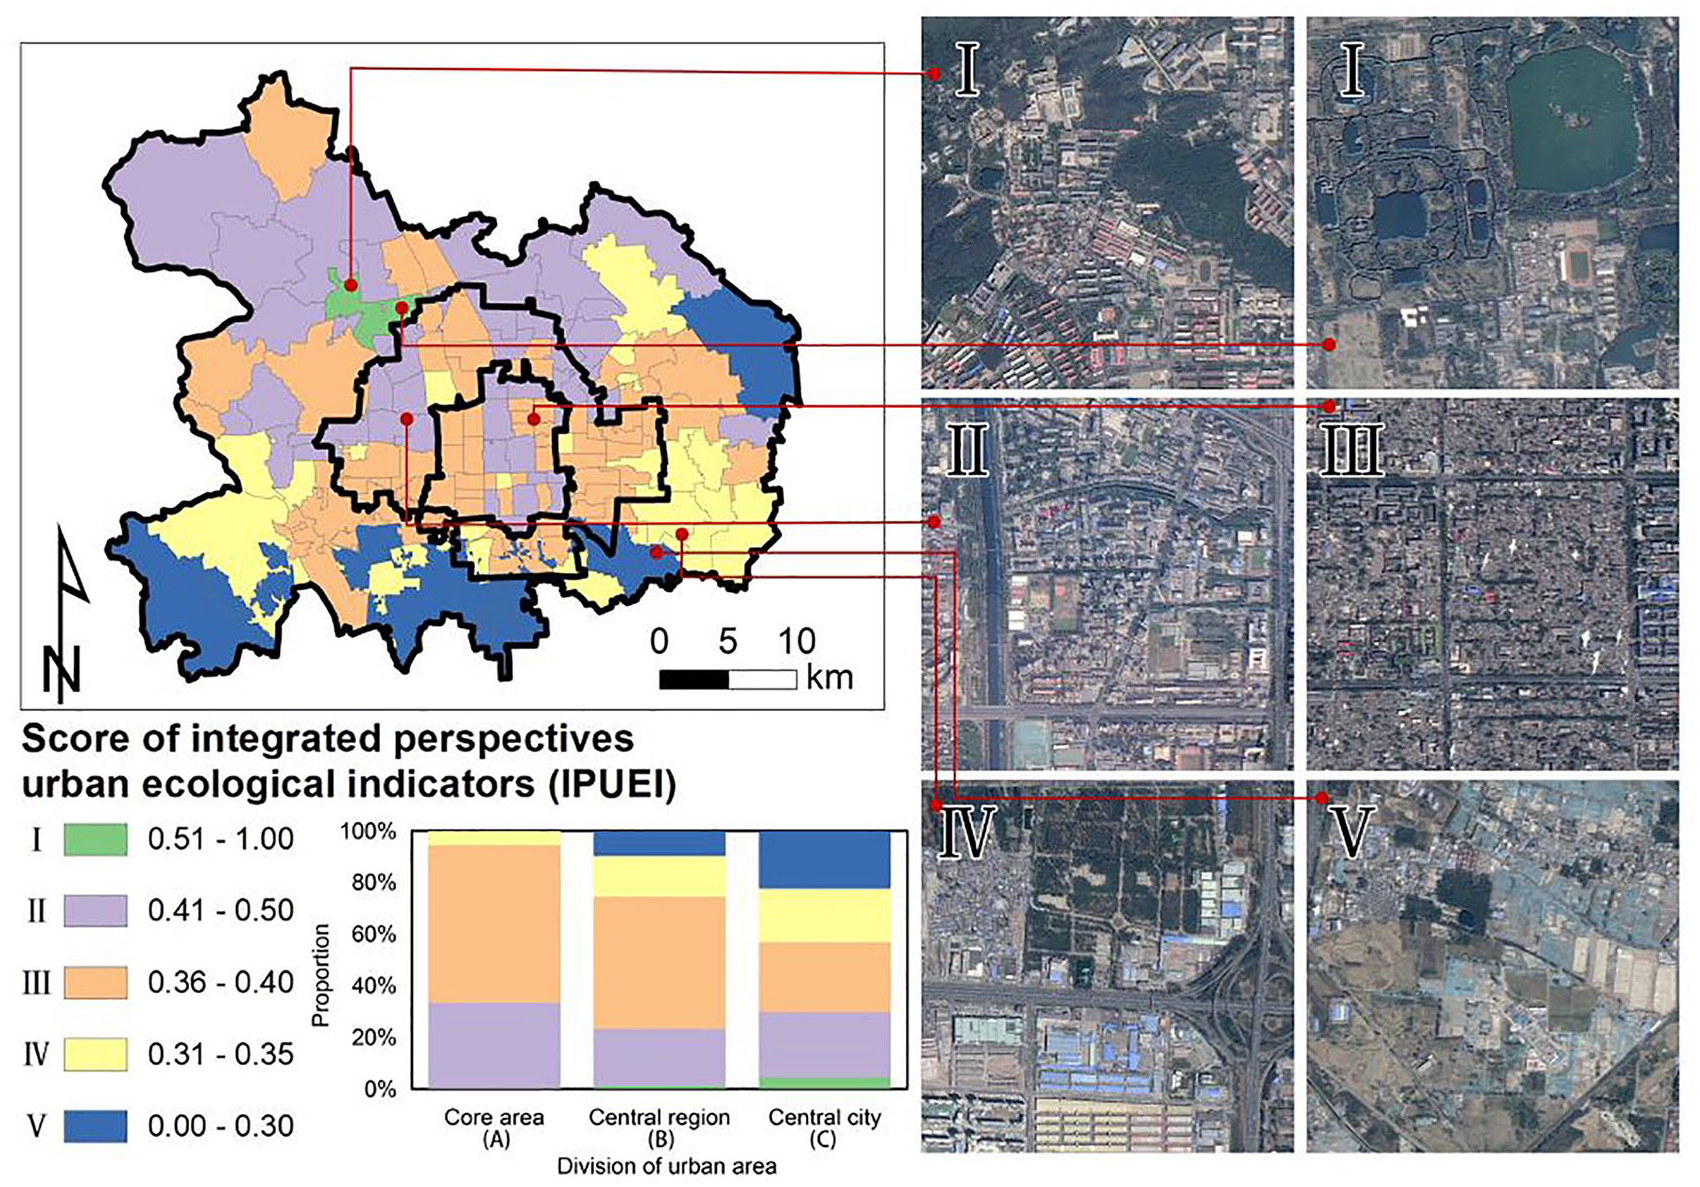
The spatial distribution of IPUEI score and typical regional images (the V-level indicates the worst IPUEI score and is shown in blue, while the I-level indicates the best score and is shown in green), and the remote sensing images are derived from the GF-2 satellite.
The park green space accessibility (E4), the coverage rate of urban public services (E8) and the coverage of public transport stations (E12) show obvious spatial aggregation, and generally have higher quality in the core area (C) (Figure 4a). The per capita park green area (E1), roof greening rate (E3), urban heat island intensity (E5), and urban vegetation growth status (E6) showed a distribution state of high in the northwest and low in the southeast. Some indicators may be greatly affected by the internal attributes of the city, and the spatial heterogeneity was more obvious, mainly in urban landscape planning and design (E7), urban per capita housing area (E10), urban waterlogging risk (E16) and richness of key protected wildlife (E20).
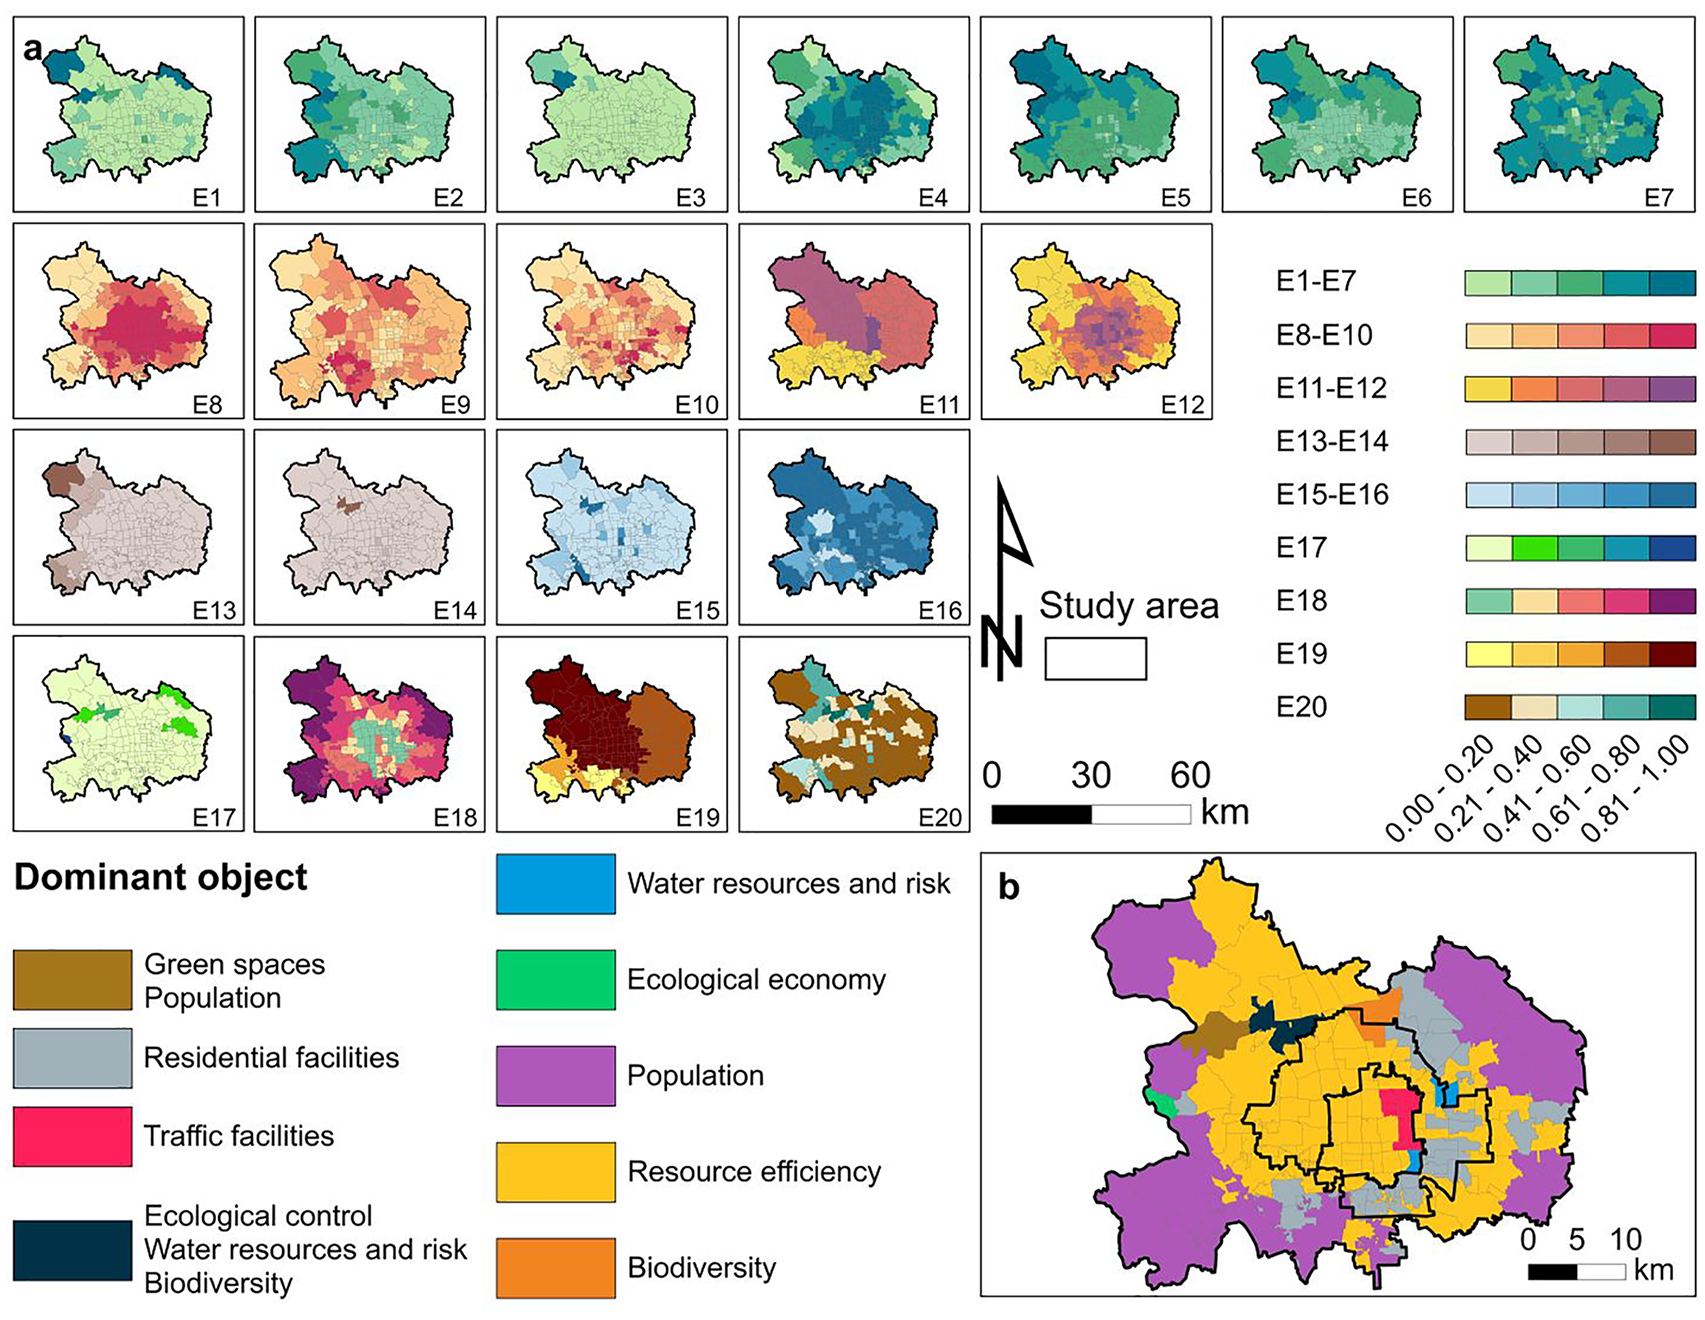
(a) Spatial distribution and dominant object of IPUEI (E1: per capita park green area, E2: urban road shade coverage rate, E3: roof greening rate, E4: park accessibility, E5: urban heat island intensity, E6: urban vegetation growth status, E7: urban landscape planning and design, E8: urban public service facilities coverage, E9: total urban construction, E10: urban per capita housing area, E11: average working day commuting time, E12: public transport site coverage, E13: ecological red line area, E14: historical and cultural protection line area, E15: water surface rate of rivers, lakes and wetlands, E16: urban flood risk, E17: ecosystem service value, E18: urban population density, E19: energy consumption per 10,000 yuan GDP, E20: richness of key protected wild animals); (b) dominant object of IPUEI.
Resource efficiency was the dominant object of IPUEI for most subdistricts, accounting for 57% of the total, followed by residential facilities at 18%. The dominant object of IPUEI in the marginal areas was population. Residential facilities were the dominant object of IPUEI on the east side of the central region (B), while traffic facilities predominated on the east side of the core area (C) (Figure 4b).
Coupling coordination among the three spaces and among the three indicator types
In terms of the relationship between the scores of different spaces and Sn in the subdistricts, the growth of the total score was mainly due to the driving force of production space and living space, while the growth of living space was not obvious. This indicates that the main improvement for high value IPUEI areas lies in the improvement of ecological and production space (Figure 5). Examining the correlation between the three indicator types and the Sn, the rise in the total score is largely attributable to the accessibility indicators.
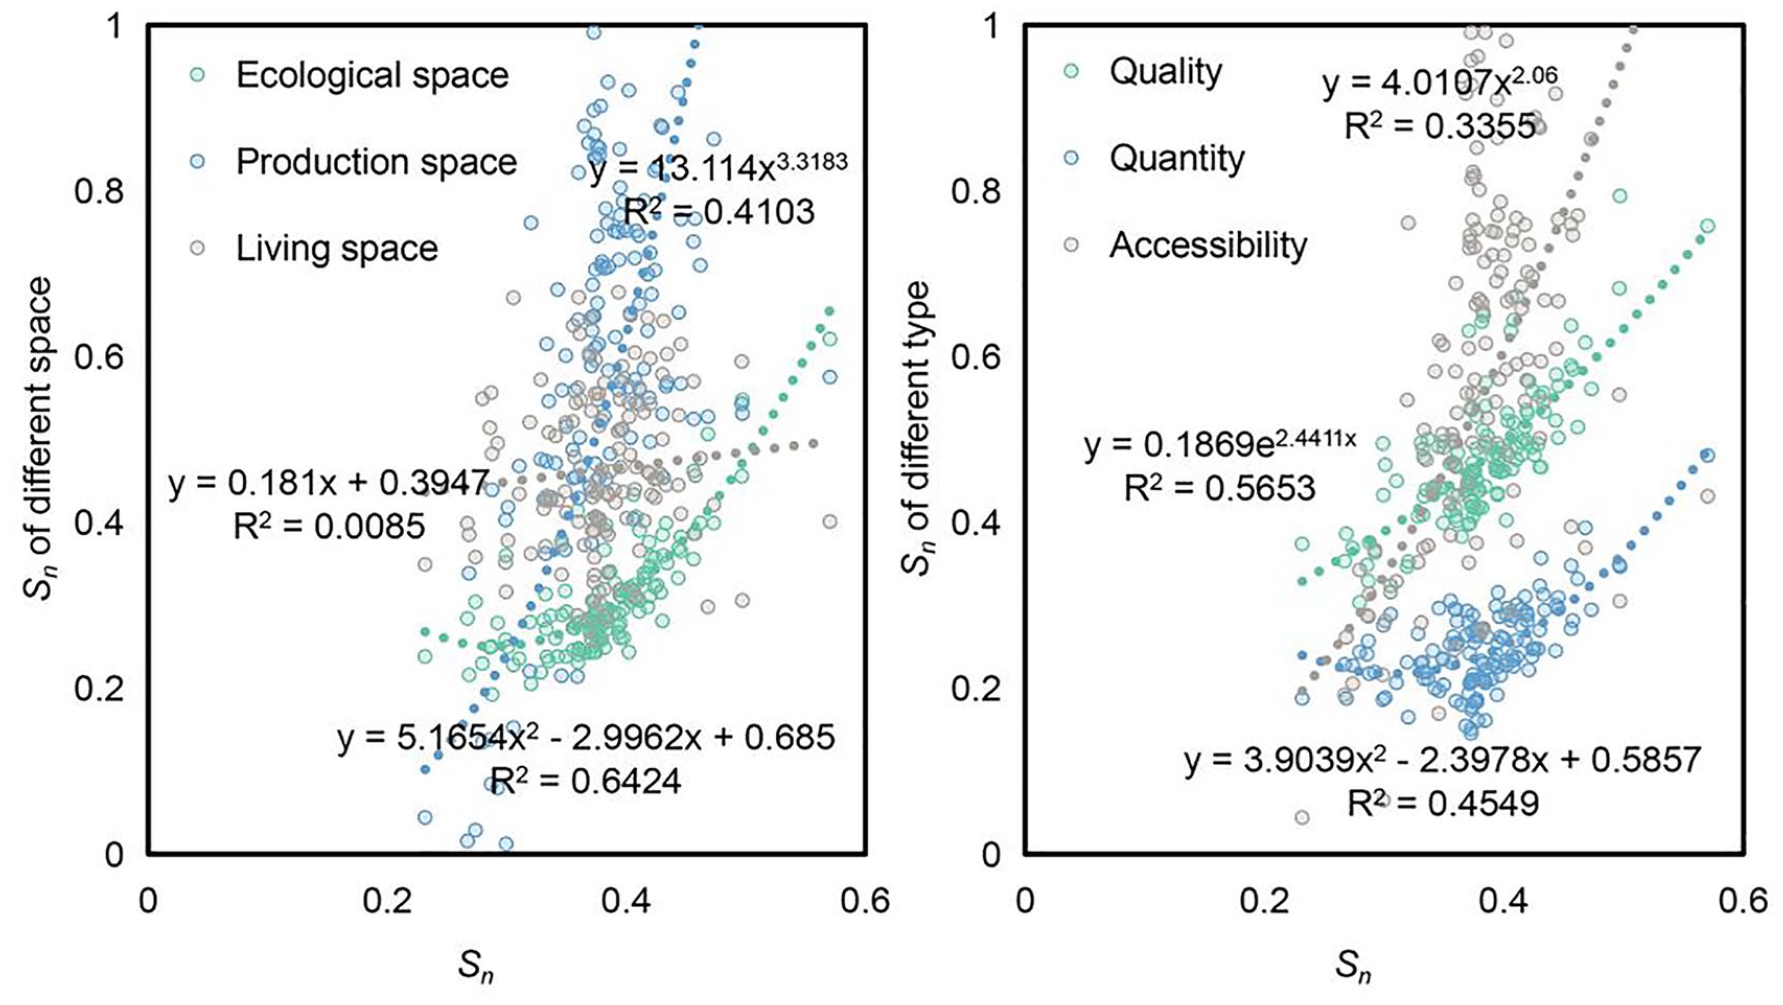
Trends in the relationship between Sn and the three spaces, and Sn and the three indicator types.
In terms of the overall level of coordination of the three spaces, most of the subdistricts were at three levels of good coordination (GC), basic coordination (BC), and low coordination (LC), and 82% of subdistricts were in good coordination (GC) (Figure 6a). From a spatial point of view, the subdistricts with higher coupling coordination were mainly located in the north side of the study area, while the areas with lower coordination were mainly located in the south and east, which was generally in the fringe area, with a lower degree of development and a more backward urbanization process. In terms of the overall level of coordination of the three indicator types, similar to the three spaces, most of the subdistricts were at three levels of good coordination (GC), basic coordination (BC), and low coordination (LC), and 63% of subdistricts were in good coordination (GC) (Figure 6b). This indicates that from the perspective of urban development, there is a need to pay attention to the areas at the periphery and the core of the city, which are at a relatively lower level of coordination. There are contradictions in terms of population and natural resources, as well as in terms of development direction.
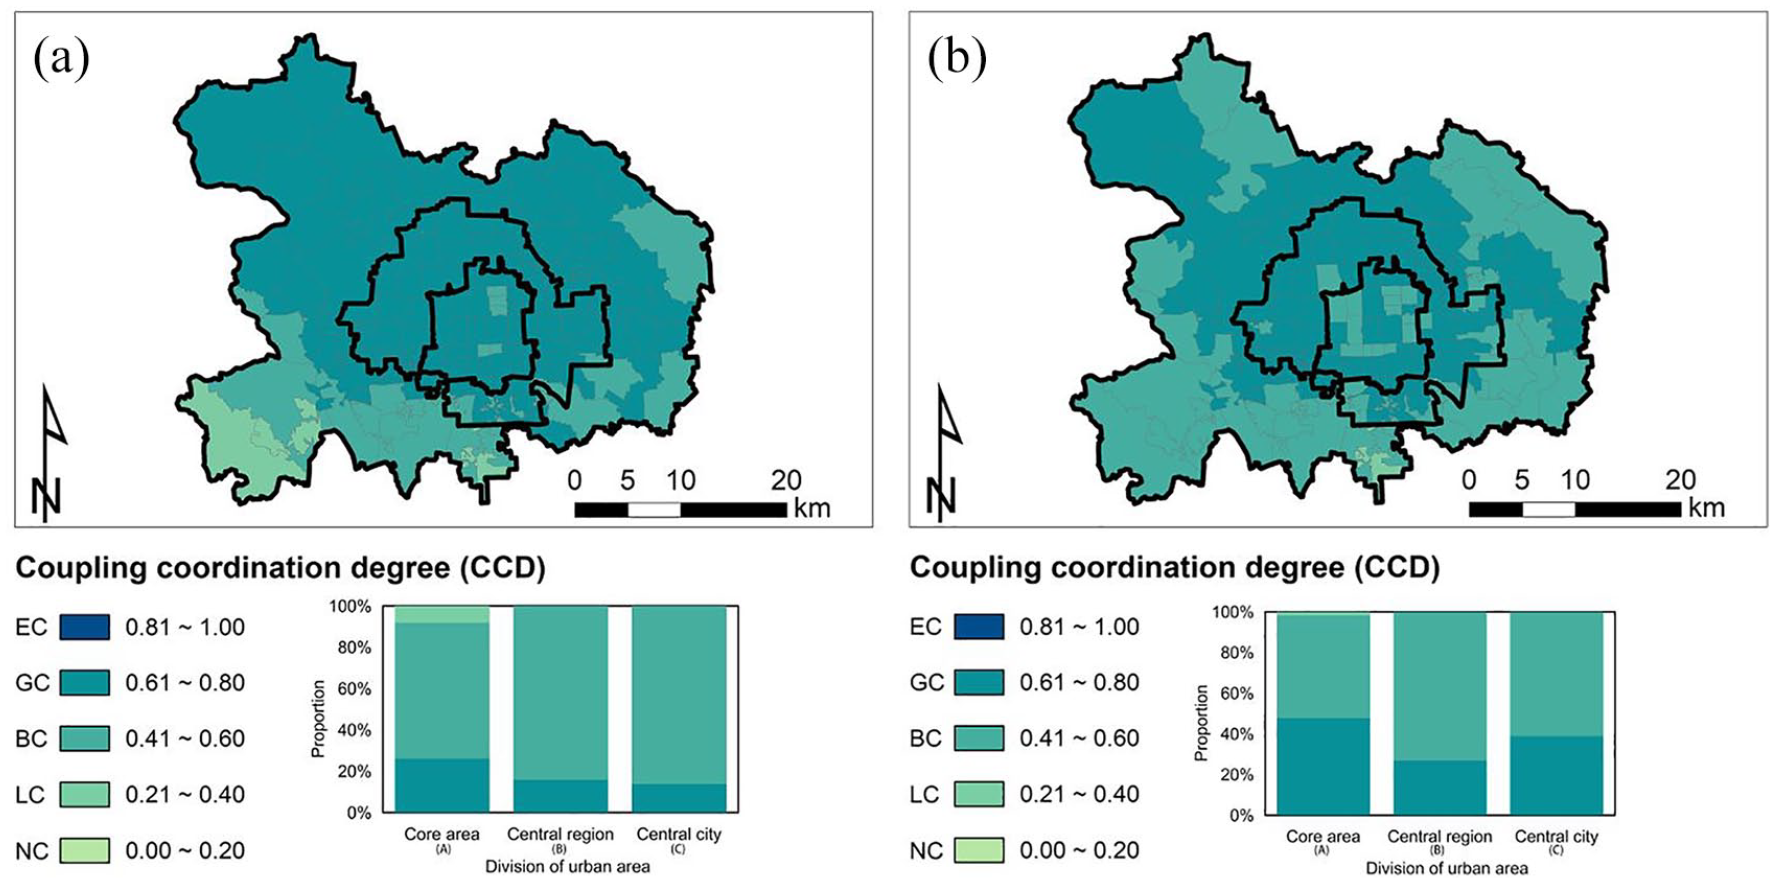
(a) Spatial distribution of CCD among three spaces; (b) spatial distribution of CCD among three indicator types.
Supply and demand evaluation of IPUEI
The LQi of all and elderly individuals was low in core area (C) (Figure 7). The LQi shows that most subdistricts in core area (C) were less than 1 except the Tiantan subdistrict, and the whole study area with inequality supply accounts for 79%. According to the LQi in differently aged individuals, the subdistricts with insufficient supply of elderly, middle-aged, and young individuals accounted for 81%, 84%, and 83% respectively, among which the subdistricts with severe insufficient supply (location quotient ⩽ 0.5) accounted for 19%, 11%, and 10% respectively. Seventy percent of the severely underprovided subdistricts for the elderly individuals were concentrated in the core area (C), while it was 16% for the middle-aged individuals, and 23% for the youth individuals.
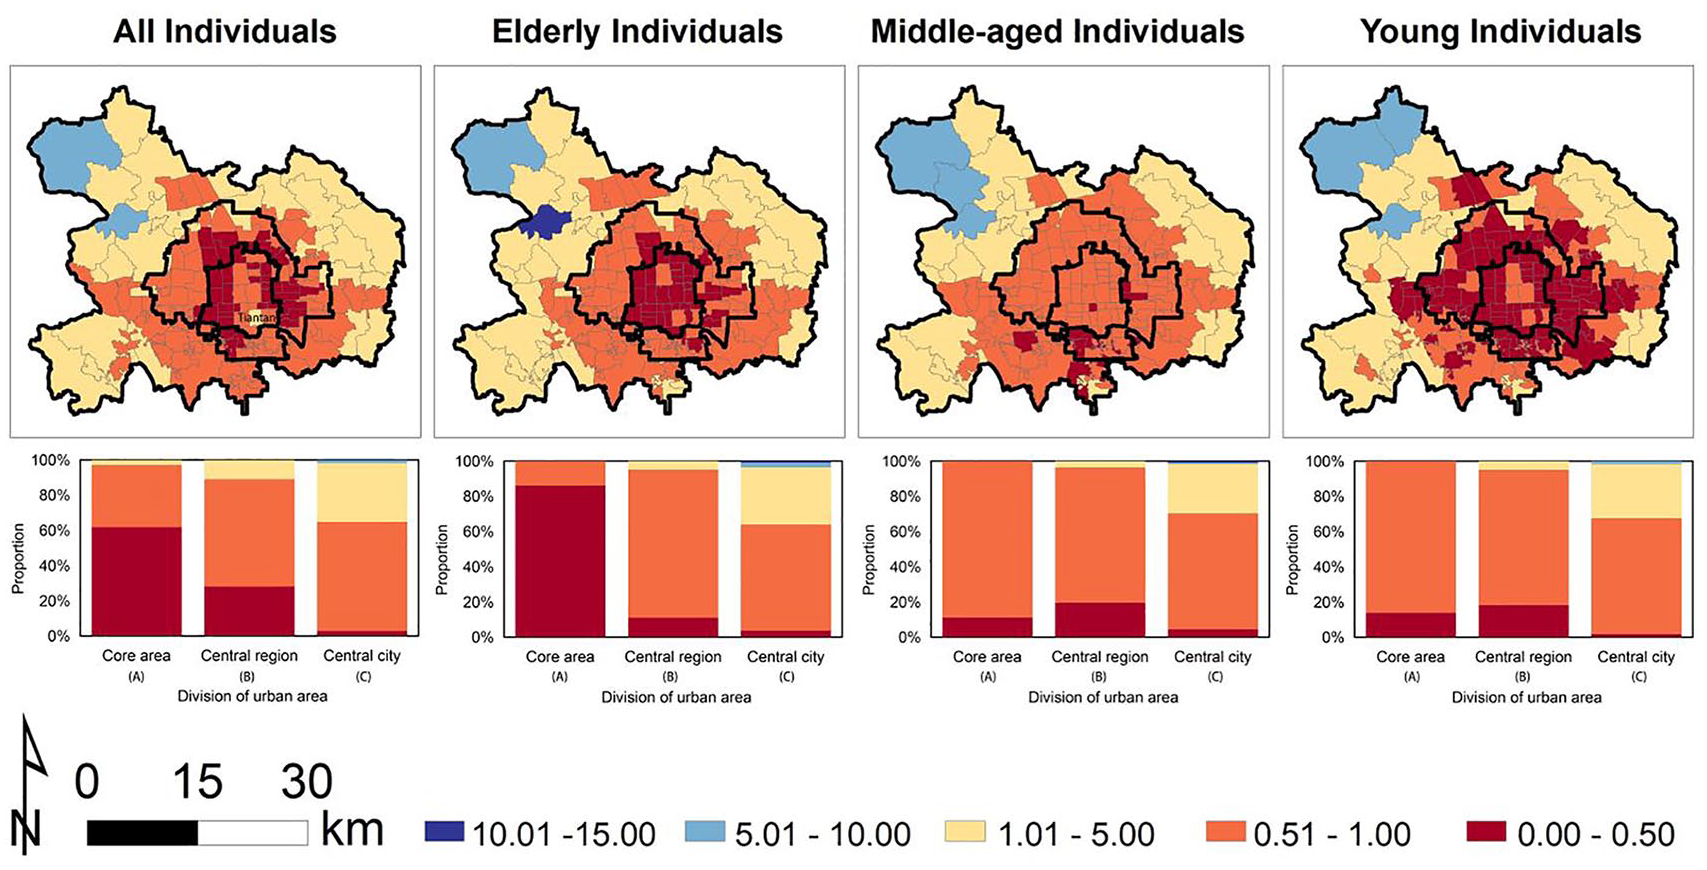
Per capita IPUEI location quotient (LQi represents the location quotient of the subdistrict i).
The LQi of each indicator shows that the residential and traffic facilities were relatively balanced (Figure 8). The difference between supply and demand was relatively large in green spaces, especially in roof greening. The ecological red line area and historical and cultural protection line area were also not balanced. In most indicators, the proportion of individuals with LQi greater than 1 was higher than that of elderly, middle-aged, and young individuals, indicating disparities in spatial distribution across age groups. The proportion of LQi greater than 1 was high in urban public service facilities coverage (E8) and public transport site coverage (E12), and low in roof greening rate (E3), ecological red line area (E13) and historical and cultural protection line area (E14).
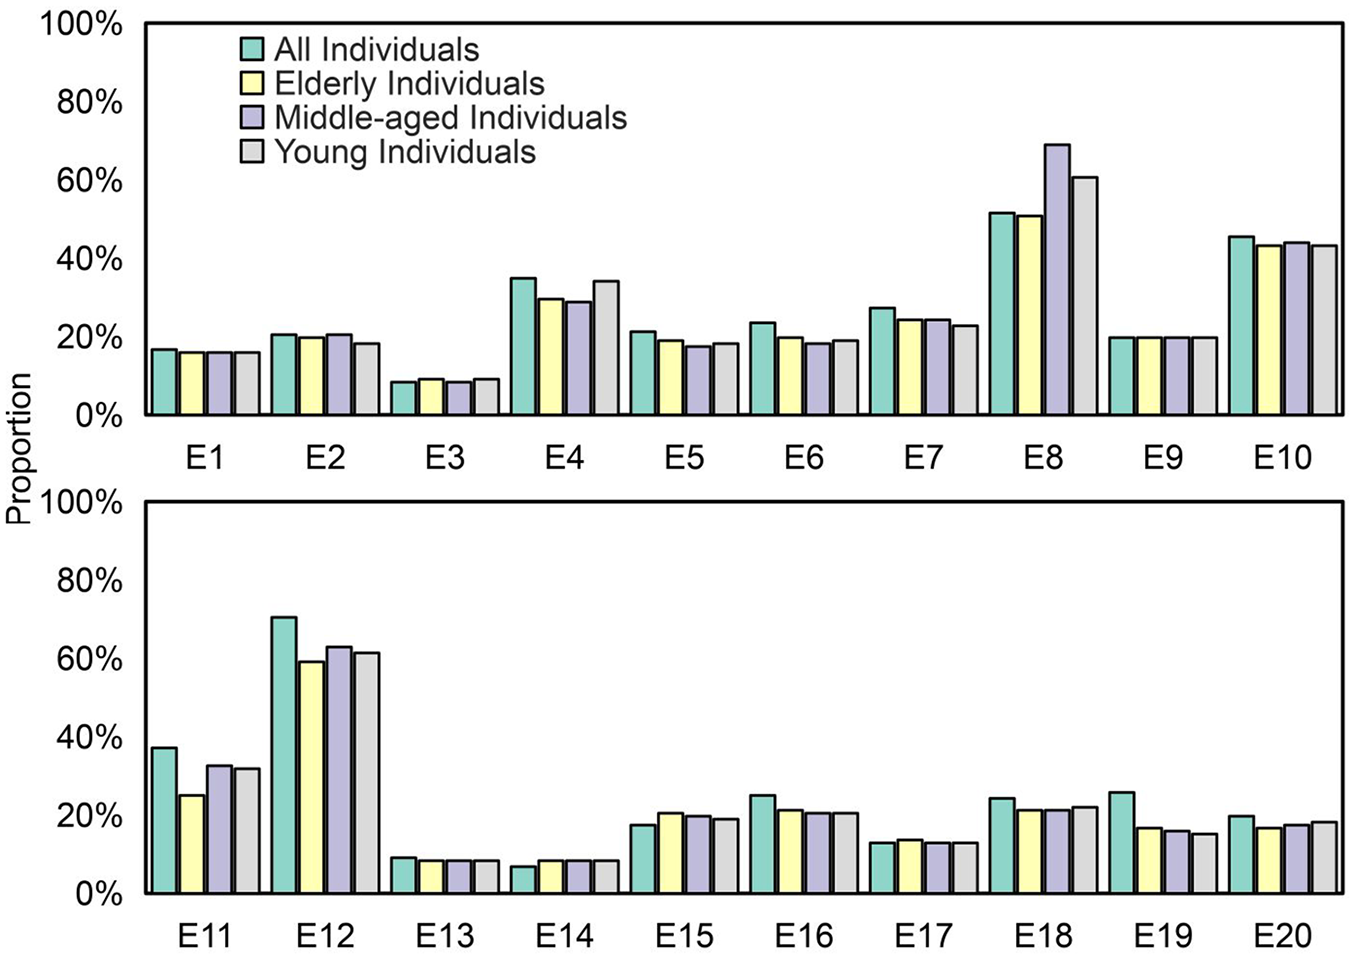
The proportion of LQi > 1 of different indicators (E1: per capita park green area, E2: urban road shade coverage rate, E3: roof greening rate, E4: park accessibility, E5: urban heat island intensity, E6: urban vegetation growth status, E7: urban landscape planning and design, E8: urban public service facilities coverage, E9: total urban construction, E10: urban per capita housing area, E11: average working day commuting time, E12: public transport site coverage, E13: ecological red line area, E14: historical and cultural protection line area, E15: water surface rate of rivers, lakes and wetlands, E16: urban flood risk, E17: ecosystem service value, E18: urban population density, E19: energy consumption per 10,000 yuan GDP, E20: richness of key protected wild animals).
Balancing population and IPUEI quality
We identified subdistricts with different score levels and location quotients, a score of IPUEI of II-level and above was considered as high, and an LQi > 1 was also considered as high (Figure 9). Although many subdistricts have high levels, due to the high population density, the IPUEI shows an imbalance between supply and demand, that is High Si -Low LQi. Of course, there were some subdistricts where the IPUEI quality was not very good, but the LQi of IPUEI was higher due to the low population density, that is Low Si -High LQi. The distribution differences of various types among different age groups were not significant. What can be observed was that the High Si -High LQi subdistricts of elderly individuals accounts for the largest proportion compared to other age groups, while the High Si -Low LQi subdistricts of middle-aged individuals accounts for the largest proportion compared to other age groups.
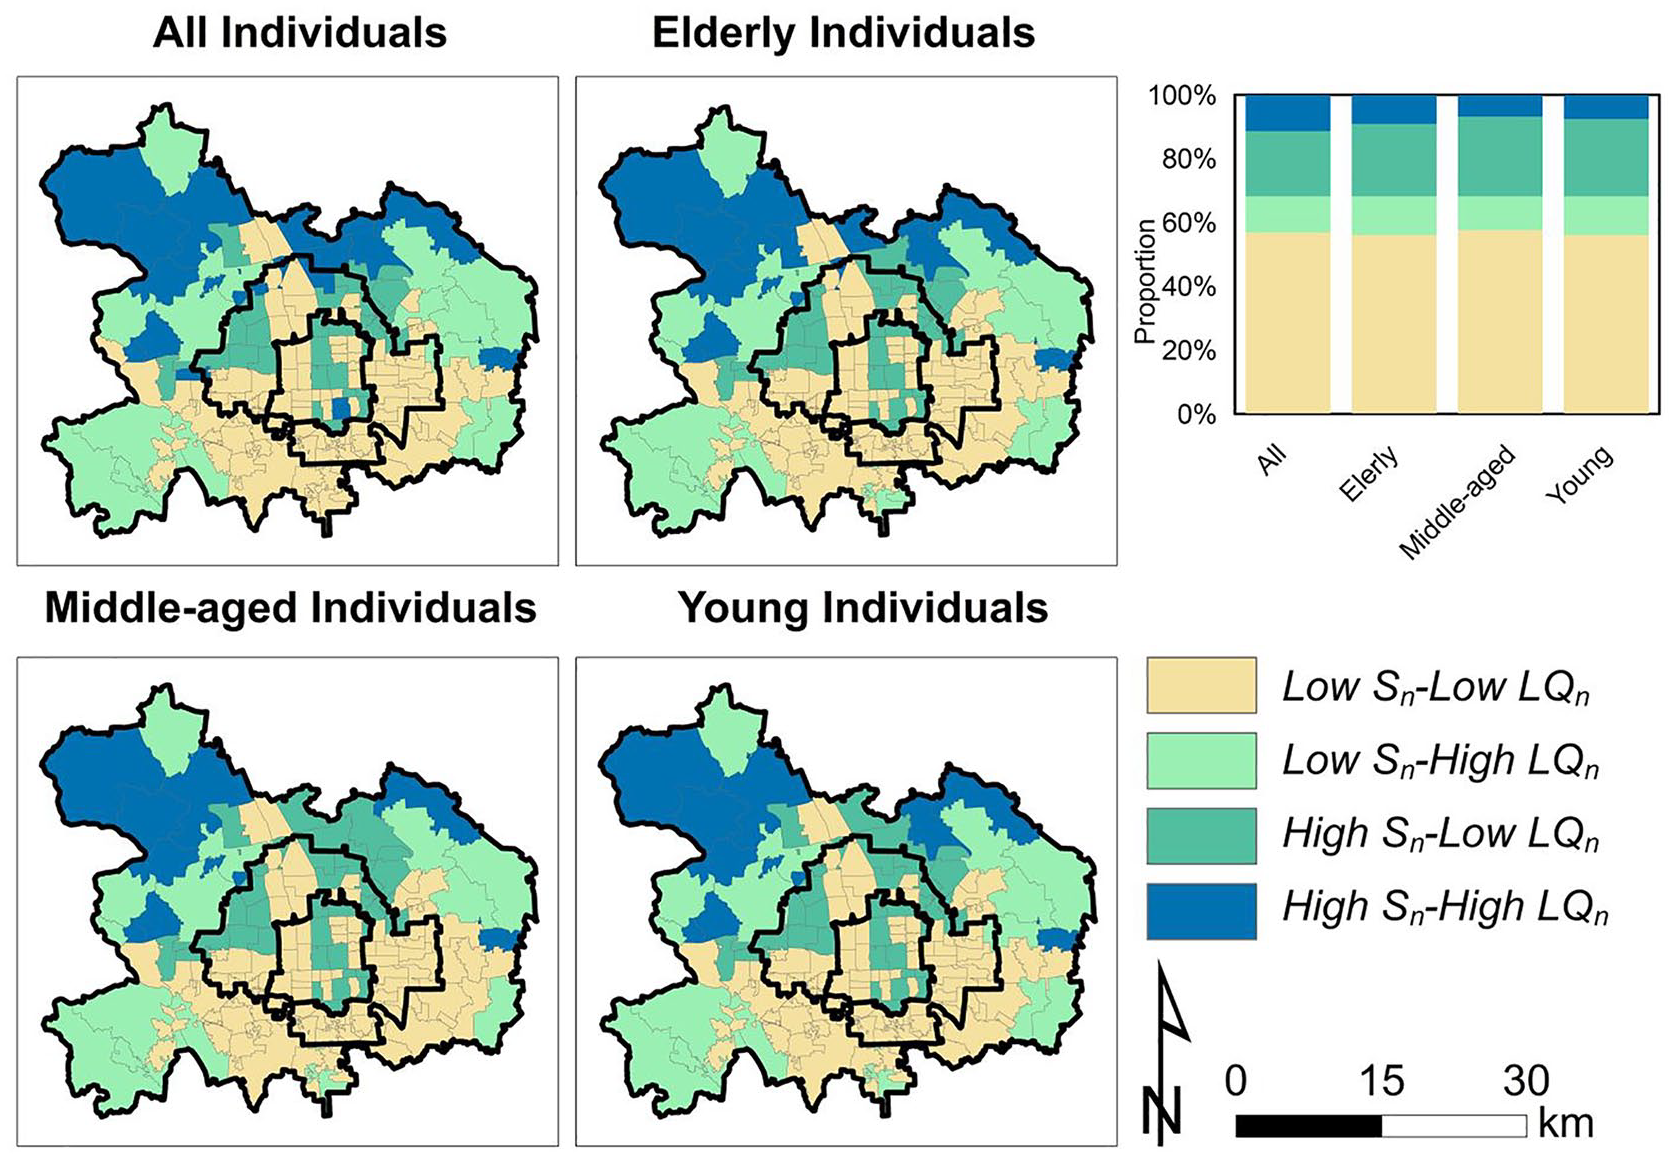
Subdistrict type classification of all, elderly, middle-aged, young individuals (Different score levels and location quotient: Low Si-Low LQi, Low Si -High LQi, High Si -Low LQi, and High Si -High LQi).
For all individuals, all low location quotient regions need to relieve 37% of the population or increase by 0.21 points to meet the existing supply and demand balance. For High Si-High LQi subdistricts, the status quo is mainly maintained; High Si -Low LQi subdistricts mainly need to relieve the population, they need to relieve 32% of the population to achieve balance; the Low Si-High LQi mainly need to improve the IPUEI quality of the city, which needs to increase the 0.05 points to achieve balance; Low Si -High LQi supply and demand subdistricts need to relieve population and improve IPUEI quality at the same time, which need to relieve 38% of the population or increase the 0.21 points. We also put forward corresponding improvement schemes for different age individuals in different types of subdistricts (Figure 10). For areas with High Si-Low LQi, 36% of the elderly, 28% of the middle-aged, and 30% of the young individuals need to be relieved; for areas with Low Si-High LQi, the IPUEI that focuses attention on the elderly, middle-aged and young individuals all need to increase by 0.06 points; for areas with Low Si-Low LQi, it is necessary to relieve 41% of the elderly, 40% of the middle-aged, 41% of the young, or IPUEI concerned with the elderly, middle-aged and young individuals need to be increased by 0.24, 0.23 and 0.23 points respectively.
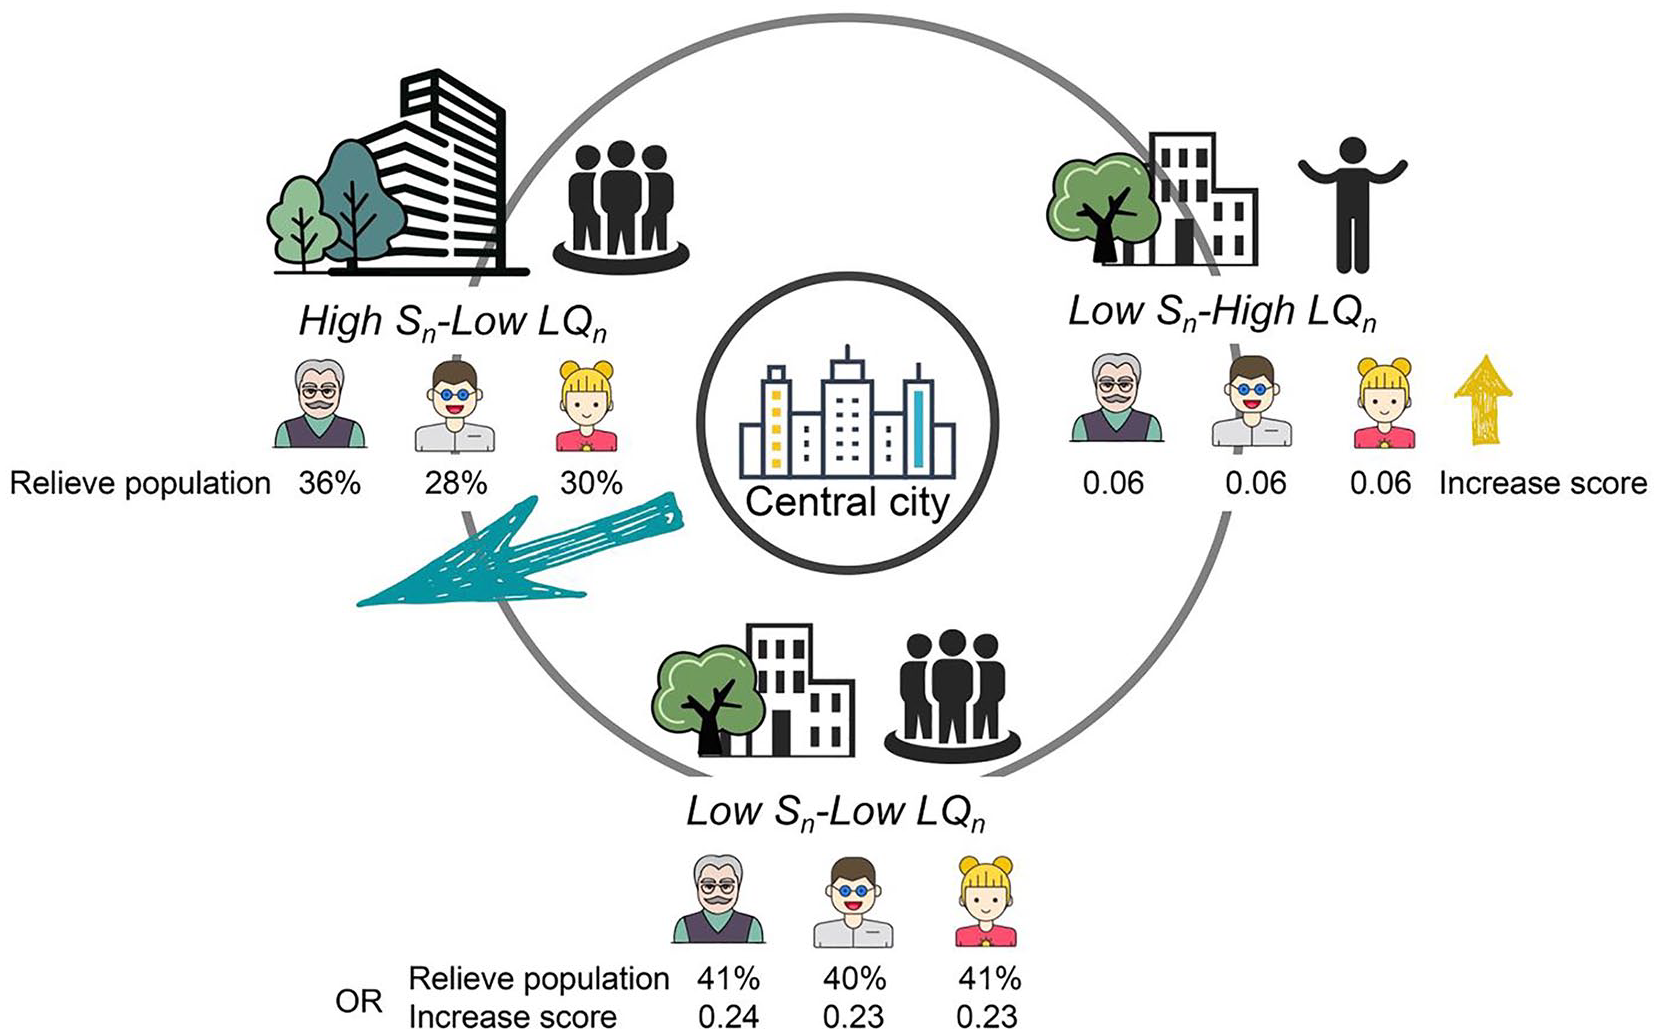
Inequality IPUEI improvement strategy for different subdistrict types.
Discussion
Assessment and spatial distribution of IPUEI
The study systematically evaluated the IPUEI of Beijing, a typical mega-city. Compared with previous urban ecological assessments that predominantly focused on singular dimensions, this study’s indicator system demonstrates greater comprehensiveness. Earlier evaluations often targeted specific aspects such as urban heat islands (Sekertekin and Zadbagher, 2021), soil contamination (Wang et al., 2012), and energy expenditure patterns (Han et al., 2022), or particular ecosystem types like wetland parks (Duan et al., 2011). This indicator system integrates the needs of various stakeholders. In addition, compared with the previous urban ecological assessments that focused on the whole city or urban agglomeration (Li and Li, 2014; Peng et al., 2021; Xia and Li, 2022), this study uses fine-grained data to complete a comprehensive assessment of IPUEI. It was not merely a collection of regional statistics, but a spatially represented unit that closely mirrored the actual distribution pattern through geographic visualization.
The IPUEI quality was high in the middle and northwest, and low in the southwest. The main reasons lie in the abundant natural resources in the northwest and the relatively complete infrastructure in the central region (B). However, in the analysis of the location quotient, we find that the central part of the city shows the opposite trend, indicating that the population in the urban central area has far exceeded the load. The possible reason lies in the fact that Beijing has concentrated the superior resources such as education and healthcare across the country. With the largest number of double-first class universities and grade-A tertiary hospitals in the country, a large number of people have gathered in the core areas (C) of the city, far exceeding the planned carrying capacity of these resources. Related urban ecological assessments, such as urban landscape ecological security (Wang et al., 2019), were relatively consistent with low-value areas of location quotient. For the dominant type, most were dominated by resource efficiency, indicating that Beijing has a reasonable control of energy consumption in industrial production. From the results of the CCD, it can be seen that the coupling coordination level of most areas in the main urban area of Beijing is at a medium level, and there is still much room for improvement. Among them, the growth of living space was lagging behind the growth of ecological and production space, which can easily lead to the loss of talent (Shen and Li, 2022).
Implications for urban planning and management
Currently, urbanization has reached a point of saturation with incremental development, and the regulation of population and the balance between the supply and demand of ecological resources have emerged as pressing and complex challenges. The high concentration of population has led to a severe imbalance between supply and demand of urban ecological resources. Although there were relevant studies on the balance of ecological supply and demand in cities, such as the use of the two-variable Moran’s I to evaluate the supply and demand of blue and green infrastructure (Dai et al., 2021), or the fairness of urban green space (Luo and Li, 2021; Wu et al., 2016), they were limited to the location description of unequal regions. This study analyzed the population that needs to be relieved and the IPUEI quality that needs to be improved. It points out that the central urban area needs to relieve 37% of the population to reach a balanced state. The results also show that the imbalance between supply and demand of different age individuals has significant spatial characteristics. The imbalance between supply and demand for the elderly individuals was mainly concentrated in the core area (C), and the middle-aged individuals were mainly concentrated in the business area, while the young individuals were mainly concentrated in the area where the universities were located. Therefore, these areas should be prioritized and different relief schemes should be established for different age groups, which is conducive to accelerating the structural optimization of land use. For example, through replacement, the core area (C), especially the elderly individuals living in hutongs (traditional narrow street or alley), will be placed in areas with better environmental and medical provisions, and the use of hutongs will be gradually optimized. The optimizing of the distribution of educational resources according to the distribution of residential areas, will gradually help achieving the balance of educational resources to meet the needs of the young individuals. Optimizing the proportion of commercial and residential areas in urban regional space, will gradually achieve the employment-housing balance. This is of great practical value today as Beijing continues to relieve non-capital functions, actively vacate urban and rural construction land, and relieve the population in the core area (Liu et al., 2018a).
The spatial pattern characteristics of urban green space are essential in realizing its ecosystem service value (Xu et al., 2016). Facing the opportunity period of urban spatial function pattern adjustment, IPUEI and the supply and demand research evaluation can provide a sound data basis for future urban spatial regulation. The evaluation of IPUEI serves as a foundation for a phased implementation to enhance the structure of urban land use, identify areas for retreat and determine the implementation strategy, enhancing the ecosystem service value of urban green spaces thereby enhances the city’s population carrying capacity.
Beijing is currently at a critical stage of urban development transformation. The improvement and optimization of IPUEI play an essential role in the high-quality development. For example, the analysis of the dominant object of IPUEI can match the existing resources and advantages of each region, and maximize the efficiency of regional resource advantages; the evaluation and analysis of the single indicator of IPUEI can clarify the shortcomings of ecological quality in different regions of the city. For the comprehensive evaluation of IPUEI, priority areas can be determined according to the level of IPUEI. This is of great practical value in the context of Beijing’s continuous efforts to de-populate non-capital functions, actively vacate urban and rural construction land, and de-populate core areas (Liu et al., 2018a).
Limitations and prospects
In terms of data acquisition, there were still some deficiencies in the accuracy of some data acquisition. For example, the location information of all respondents cannot be obtained due to the need for data confidentiality in the questionnaire survey. We only have the statistical data at the district level that can be obtained in energy consumption statistics, resulting in different accuracy of some indicator data, which affects the evaluation of IPUEI to a certain extent. In terms of model use, the coupled coordination degree model has specific limitations, such as the high demand for data quality and the static nature of the model, which to a certain extent affects the study of long time series in the study area. Regarding scale division, this study mainly discusses the distribution of IPUEI in subdistricts. However, the city has its unique texture, the content of IPUEI can be further refined according to the main urban road framework. Due to the dynamic characteristics of population distribution, the spatial distribution of different age groups may be biased in the actual data. Stakeholders may exhibit varying degrees of scrutiny and influence across diverse spatial categories. These may potentially affect the assessment results of IPUEI. With continuous advancements in data acquisition precision and temporal resolution, longitudinal studies spanning extended temporal scales will enable accurate delineation of evolutionary trajectories within urban ecosystems. In the future, it is necessary to fully take into account the dynamic characteristics of urban development in order to ensure the sustainable development of cities (Yi et al., 2021; Zhang et al., 2021). Furthermore, expanding the spatial parameters of investigation to encompass cities at analogous developmental phases will facilitate comparative analyses through robust methodological frameworks.
Conclusions
This study integrates the perspectives of scientists, governments, and urban residents to construct the IPUEI, and provides a feasible method. Based on the IPUEI, we accurately portrayed the coupling coordination among ecological, production, and living spaces, as well as among quantity, quality, and accessibility within the study area, along with inequalities in population and ecological resource distribution. Additionally, we calculated the proportion of the population that needs to be relocated, categorized by different age groups and subdistrict types. These results can support cities in effectively and rationally regulating urban landscapes. In terms of relieving Beijing of non-essential functions to its role as China’s capital, the research can provide strategic support in establishing the threshold for such distribution and optimizing the utilization of vacated land. Overall, this study offers valuable references for highly-urbanized "stock optimization" cities to address the contradiction between residents’ needs and ecological resource supply.
Supplemental Material
sj-doc-1-tee-10.1177_2754124X251335538 – Supplemental material for A scientific framework for integrating urban ecological protection and social sustainability among multiple stakeholders
Supplemental material, sj-doc-1-tee-10.1177_2754124X251335538 for A scientific framework for integrating urban ecological protection and social sustainability among multiple stakeholders by Ming Yan, Song Leng and Ranhao Sun in Transactions in Earth, Environment, and Sustainability
Footnotes
Author contributions
Declaration of conflicting interests
The author(s) declared no potential conflicts of interest with respect to the research, authorship, and/or publication of this article.
Funding
The author(s) disclosed receipt of the following financial support for the research, authorship, and/or publication of this article: This work was supported by the National Key R&D Program of China (2022YFF1303101).
Supplemental material
Supplemental material for this article is available online.
Author biographies
References
Supplementary Material
Please find the following supplemental material available below.
For Open Access articles published under a Creative Commons License, all supplemental material carries the same license as the article it is associated with.
For non-Open Access articles published, all supplemental material carries a non-exclusive license, and permission requests for re-use of supplemental material or any part of supplemental material shall be sent directly to the copyright owner as specified in the copyright notice associated with the article.