
Abstract
Healthcare accessibility is a crucial livelihood issue directly related to people’s health. Given that existing studies have often focused on residents’ potential geographic access in a single city, this study examines the access to healthcare services in Wuhan Metropolitan Area in both potential and realized dimensions. We pay particular attention to the quantitative measurement of the actual fit between healthcare services being offered and utilized. Overall, we found satisfactory potential access to healthcare facilities within reach of residential spaces in Wuhan Metropolitan Area, yet it is uneven across the nine cities and different areas. By measuring realized access through the coupling coordination degree of healthcare provision and utilization, our findings showed that except for Wuhan, all the other cities suffer from various levels of incoordination and lack resilience to public health emergencies. Taken together, this requires the regional government to formulate a more coordinated and comprehensive plan for resource allocation and to promote resource sharing among cities. Targeted policies for certain cities are also needed, to improve residents’ healthcare accessibility.
Introduction
Growing population density, rapid urbanization, and an irreversibly aging population have been posing challenges in providing essential services, especially healthcare, to all segments of the population (Giles-Corti et al., 2016). The unprecedented devastation brought about by the global outbreak of the COVID-19 pandemic has called researchers and policymakers to rethink approaches to this concerning problem, since healthcare accessibility is critical in assisting residents and communities to recover from such disasters (Haldane et al., 2021). For example, the COVID-19 outbreaks in China during early 2020 led to a severe shortage of hospital beds (Zhuang et al., 2021), which adversely affected the efficiency of healthcare system. The World Health Organization (WHO, 2020) reported that there were globally 651.92 million confirmed cases of COVID-19 as of the end of 2022, including 6.66 million deaths. Wuhan, with 50,008 COVID-19 cases as of April 8, 2020 (Xinhua News Agency, 2020), when the city government announced the end of the first lockdown, was the first city to be faced with such a public health emergency. As the core city of Wuhan Metropolitan Area (WMA), Wuhan attracted 3.95 million migrants in 2020, of whom 68.29% originated from other cities in Hubei province; thus, migrants accounted for over 32% of the total permanent residents (Wuhan Municipal Bureau of Statistics, 2021a, 2021b). This undoubtedly facilitated the rapid spread of COVID-19 from Wuhan to the other cities in WMA, during the 2020 Spring Festival traffic rush (Chen et al., 2020a; Wan and Wan, 2022). In this context, it is crucial to understand the extent to which healthcare services are available to the public in the whole Wuhan Metropolitan Area.
Researchers studying accessibility to urban amenities have aimed to understand the geographies of convenience or easiness that enable different segments of the population to use public services (McLafferty, 1982; Rahman et al., 2022; Sherman et al., 2005; Talen and Anselin, 1998). Scholars have explored the application of various data and methods to measure the relationship between the service delivery and individuals’ access to these services. Geospatial data are widely used in the measurement of geographic accessibility, regulated by space or distance, that allows individuals to easily reach their destination (Ashik et al., 2020; Dejen et al., 2019; Rahman et al., 2022). A diverse range of methods, including gravity approaches and cumulative opportunity measures, have been employed to evaluate spatial accessibility (Rahman et al., 2022). Aforementioned studies largely hinge on the assumption that services falling within residents’ catchment area are fully available to them (Wang and Luo, 2005), and therefore examine potential access (Khan, 1992). Statistical data on the quality and use of public services, on the other hand, offer the opportunity to examine residents’ actual choice and assess the relationship between the provision and utilization of public services (Chen et al., 2020b; Haynes et al., 2003). Researchers have used various techniques, such as the Gini coefficient and Robin Hood Index, to measure the degrees of equity and coordination of healthcare service allocation (Ren et al., 2021; Shadmi et al., 2014). While both potential and actual fit between healthcare services being offered and utilized is important for analyzing and improving residents’ access to essential services, few studies have combined the two dimensions.
Moreover, China’s radical urban transformation, at an unprecedented scale and speed, has led to the emergence of urban agglomerations (Zeng et al., 2015), which have fundamentally changed the organization of socioeconomic activities. However, the unevenness of economic development and resource allocation within the megalopolis or urban agglomeration has been a concern, especially regarding disparities between urban and rural areas (He and Zhang, 2022), and between large and small cities. In response to this spatial inequality, the State Council of China issued National New Urbanization Plan (2014–2020) in 2014 to “optimize the urbanization patterns” and promote more balanced development (Xinhua News Agency, 2014). Despite increasingly close collaborative networks in economic development (Fukuda, 2020), technology (Ma, 2022), and the ecological environment (Chen et al., 2022) in urban agglomerations, there have been few explorations of the intercity sharing of healthcare services in China. Even a decade after the Hubei province government issued Implementation Opinions on the Integrated Development of Healthcare Services in Wuhan Metropolitan Area in 2010, the number of healthcare institutions and beds in Wuhan in 2020 accounted for 54.2% and 42.3% of the entire metropolitan area, respectively (Hubei Provincial Statistics Bureau, 2021). The distribution of medical resources in WMA shows a high degree of polarization, which undermines the healthcare delivery system’s overall capacity. Therefore, the equitable allocation of healthcare resources at the regional level deserves greater consideration. However, only a handful of studies have studied the accessibility of healthcare services at the metropolitan area scale (Shen and Sun, 2022), and even fewer have paid attention to the central region of China.
Hence, there is currently a research gap in the evaluation of access to healthcare service in urban agglomerations. Accordingly, this paper aims to contribute to the existing literature in the following aspects: first, we measure the residents’ access to healthcare service in WMA in both potential and realized dimensions. Our particular focus on the quantitative measurement of the actual fit between the provision and utilization of healthcare services can offer important policy implications. Second, we establish a coupling coordination model to evaluate residents’ realized access to medical resources.
The remainder of this paper is organized as follows. The next section reviews relevant literature on the conceptualization and measurements of healthcare accessibility. The section after that describes the study area, as well as the data and methods utilized in this paper, followed by a section that presents major findings. After a discussions of the results, the paper concludes with the implications for regional healthcare resource allocation.
Literature review
Accessibility, as an important indicator of the efficiency, equity, and quality of public service delivery, has received extensive interest from academics and policymakers since the 1970s (Dalvi and Martin, 1976; Ingram, 1971). Researchers from a wide range of disciplines, including planning, public policy, and geography, have offered theoretically and operationally sound definitions of accessibility. In studies on access to healthcare services, “accessibility” has been understood as an attribute of an institution or service that is available whenever and wherever populations need it (Aday and Andersen, 1974; Donabedian, 1966). It describes characteristics—geographic and socio-organizational—that facilitate or hinder people’s efforts to utilize healthcare services (Donabedian, 1973). Based on this dichotomy between geographic and social-organizational aspects, two strands of studies have emerged and persisted in the literature on measuring health service accessibility.
Several researchers have explored the role of unevenly distributed physical or environmental features in affecting individuals’ ease of accessing the system (Guagliardo, 2004; Joseph and Phillips, 1984; Luo and Wang, 2003; Shannon et al., 1975). Many geographic studies use the “friction of space,” a function of the time and physical distance, to conceptualize and measure the spatial dimension of healthcare accessibility (Aday and Andersen, 1974). The progress in Geographic Information Systems (GIS) and spatially referenced data have led to a wide array of location-based accessibility measures. The most intuitive method is the use of the contour measure, also known as the isochronic measure, or cumulative opportunities, to count the number of reachable health services within a given catchment area, as defined by travel time, distance, or cost (Geurs and Van Wee, 2004). This measure has advantages in terms of its computability and interpretability, but suffers from poor theoretical grounding, since it neglects the effects of distance decay (Joseph and Bantock, 1982), and does not take into account individuals’ preferences. Hence, gravity-based measures have been introduced to more validly define catchment areas by discounting the accessibility with increasing distance or travel impedance (Guagliardo, 2004). The popular two-step floating catchment area also allows researchers to consider the interaction between supply and demand for health services (McGrail, 2012; Wang, 2012, 2018; Wang and Luo, 2005). Additionally, researchers have managed to incorporate additional travel information, including the street network, speed limits, travel time, and traffic lights, into these measures to evaluate accessibility (Kanuganti et al., 2016; Martin et al., 2002; Wang and Luo, 2005). For instance, by utilizing online map APIs to improve the travel time estimation, Tao et al. (2018) used the multi-modal two-step floating catchment area (2SFCA) method to identify regions with a shortage of healthcare services in Shenzhen, China.
In studying the multi-dimensional nature of healthcare accessibility, other researchers focus on characteristics of the population or of the structure, which render medical resources more or less easy to use (Andersen, 1995; Hawthorne and Kwan, 2013). First, it is of critical importance to consider individuals’ multiple axes of differences when assessing accessibility. These individual determinants (Andersen and Davidson, 2014; Andersen and Newman, 1973) not only include characteristics that reflect the healthcare needs of different groups, such as age and gender; they also incorporate factors describing resources specific to them, such as income and insurance coverage, as well as factors in their probability of seeking care, such as their attitudes toward and knowledge about healthcare (Aday and Andersen, 1974). Second, the structural features of the healthcare delivery system, including resources and organization, also determine whether entry can be efficiently gained. Measures of the health service delivery system focus on (a) the volume and distribution of healthcare resources, which includes medical manpower and facilities; and (b) the manner in which these resources are coordinated and controlled to offer health services (Andersen and Davidson, 2014; Coleman, 1975). These measures can be derived from indicators of health service capacity, such as the number of physicians, hospital beds, or institutions.
Nevertheless, while the above measurements investigate accessibility from diverse entry points, ranging from costs (e.g., physical or time distance) to psychological variables or health knowledge, most studies focus solely on the provision of medical service, and therefore examine potential access (Guagliardo, 2004; Khan, 1992). In other words, while potential access indicates the availability of healthcare services to residents, it does not signify an “automatic utilization” of these available services (Khan, 1992: 275). Only when residents actually utilize the service offered by the healthcare system is the realized access achieved, which is also referred to as a fit between the system and the patient (Penchansky and Thomas, 1981). Therefore, despite its validity in revealing residents’ ability to get care, research on potential access could be problematic in its neglect of the gap between the potential access offered by the healthcare system and the realized access by the residents (Joseph and Phillips, 1984; Lin et al., 2005). Outcome indicators of individuals’ actual entry into the system, such as utilization rates or satisfaction scores, are thus needed to permit “external validation” of the effectiveness of the healthcare system (Aday and Andersen, 1974; Khan, 1992). In this sense, the coupling coordination degree model—a concept that quantifies the degree of harmony between subsystems within the main system (Li et al., 2012, 2022)—is applicable to analyze the fit between health services being offered and utilized.
In addition, existing studies typically focus on the healthcare accessibility in a single city (Huang et al., 2019; Luo and Wang, 2003; Yang et al., 2006), but fail to take into account the emergence of urban agglomerations consisting of a group of cities, where healthcare resources complement or compete with each other (Guida and Carpentieri, 2021) and bring about increased intercity patient mobility (Andritsos and Tang, 2014; Ding et al., 2023). More importantly, achieving equity in healthcare accessibility is a challenge for decision-makers at every territorial scale (Guida and Carpentieri, 2021; Taleai et al., 2014; Weiss et al., 2018). The development of public health in China, for instance, has entered a new stage of striving for an equitable healthcare system, but the inequality of healthcare resource allocation remains prominent (Wang et al., 2019; Yin et al., 2018). Putting these two points together, regional urban agglomeration is an appropriate scale for studying the regional synergy of healthcare resources. However, previous studies have paid relatively limited attention to the regional heterogeneity of healthcare accessibility. Ghorbanzadeh et al. (2021) identified the high and low healthcare accessibility areas in the entire state of Florida, showing that northwest and southern Florida suffer from insufficient health services, while central Florida has the highest level of accessibility. Li and Wang (2022) evaluated the healthcare accessibility to high-tier medical institutions in the Changsha-Zhuzhou-Xiangtan urban agglomeration, China.
Recognizing that healthcare accessibility is a multi-dimensional and multi-scale concept, we seek to evaluate residents’ access to healthcare services in Wuhan Metropolitan Area in both potential and realized dimensions. For this purpose, this study firstly uses spatial analysis methods to measure residential spaces’ healthcare accessibility in each city and the whole Wuhan Metropolitan Area. Secondly, we employ the entropy-weighted TOPSIS model and coupling coordination model to measure the realized access to healthcare services. Our findings can offer useful insights for Wuhan Metropolitan Area and other urban agglomerations, to improve regional health service delivery systems. The methodology and results will be discussed in detail in the following sections.
Study area and methodology
Study area
The study focuses on Wuhan Metropolitan Area, Hubei Province, China. Comprising nine cities 1 (Wuhan, Huangshi, Ezhou, Xiaogan, Xianning, Huanggang, Xiantao, Qianjiang, and Tianmen), it is located on the middle reaches of the Yangtze River (see Figure 1). As the largest economically developing city cluster in Central China (Wen et al., 2021), WMA covers only 31.2% of the area of Hubei province, yet it concentrates a population exceeding 31.98 million and contributes to 60.38% of the province’s economic output (Hubei Provincial Statistics Bureau, 2021). According to Implementation Opinions on the Integrated Development of Wuhan Metropolitan Area issued in 2022, WMA strives to improve the sharing of public services, in which the optimization of healthcare resource allocation is of vital importance. In addition, Wuhan was the epicenter of the start of the COVID-19 pandemic in early 2020, followed by outbreaks in WMA. The overburdened healthcare system not only led to decreased quality of care, but also alerted the government to the urgent need for a more resilient healthcare system in WMA (Li et al., 2020).
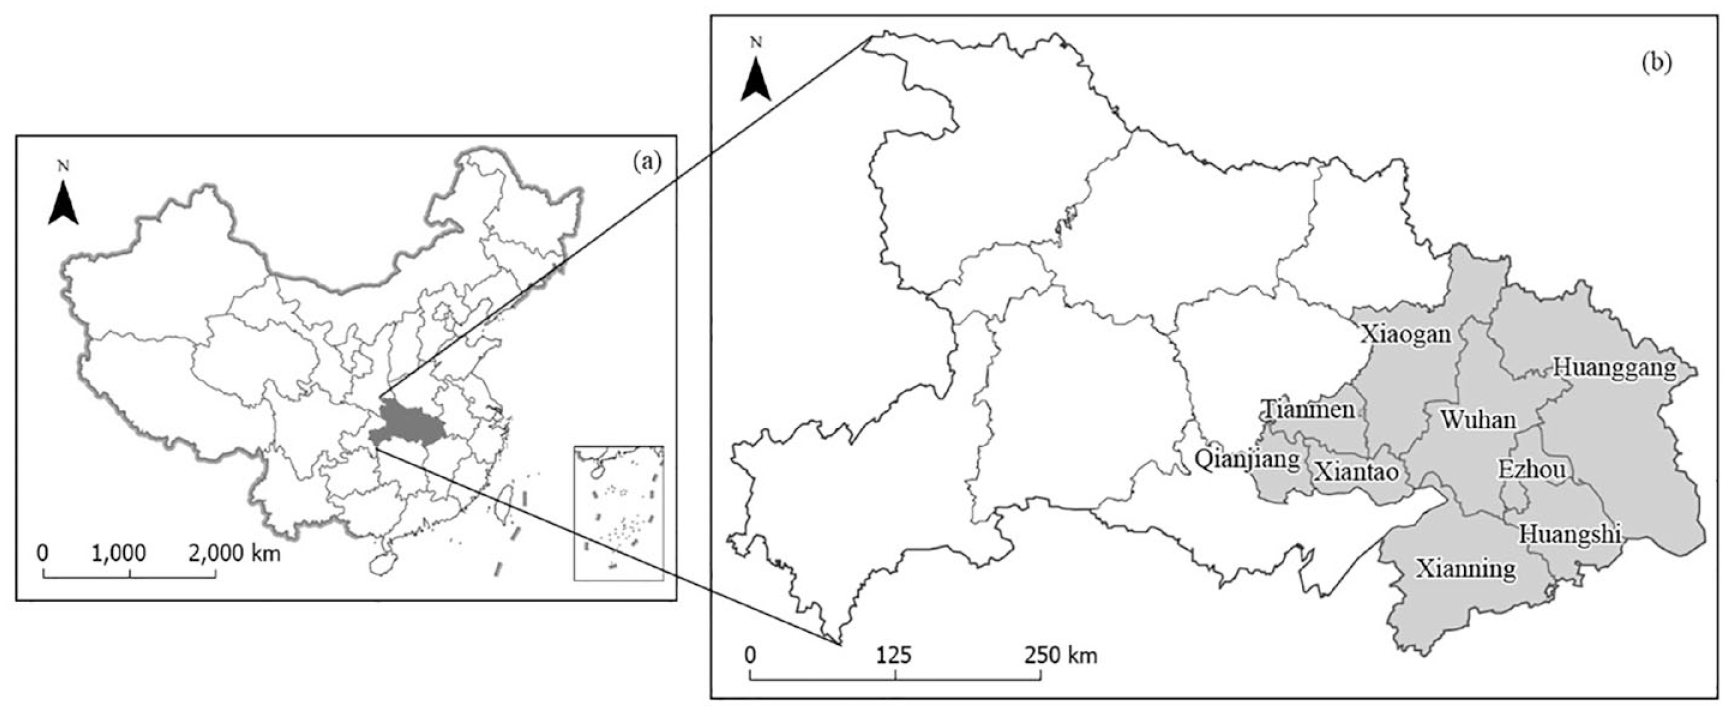
The location of Wuhan Metropolitan Area (WMA): (a) its location in China and (b) its location in Hubei Province.
Data
This study employed various data sources, including geographic and statistical data of healthcare services in Wuhan Metropolitan Area (see Table 1). Firstly, geographic data of healthcare services and residential spaces were scraped from Point-of-Interest (POI) datasets of the Gaode Map (AMap) Geocoding API in 2022. After de-duplicating, screening, and matching the datasets, we obtained POI footprint data of 32,891 healthcare facilities and 26,029 residential spaces. Among them, healthcare facilities include pharmacies, clinics, disease control and prevention centers, emergency rooms, specialized hospitals, and general hospitals; residential spaces include residential communities, residential–commercial hybrid buildings, dormitories, and industrial parks in urban areas, as well as villages and settlements in rural areas. Secondly, we used statistical data of healthcare services to measure the coupling coordination degree of medical service provision and utilization in each city in WMA during 2019–2020. The Healthcare Resource Density Index (HRDI) is employed to measure the healthcare resource provided by each city, including institutions, hospital beds, and healthcare technicians (Zhang et al., 2018). The health service utilization is measured according to the function of healthcare institutions, and therefore, considers the health consultations and inpatient operations, as shown in Table 1.
Data sources.
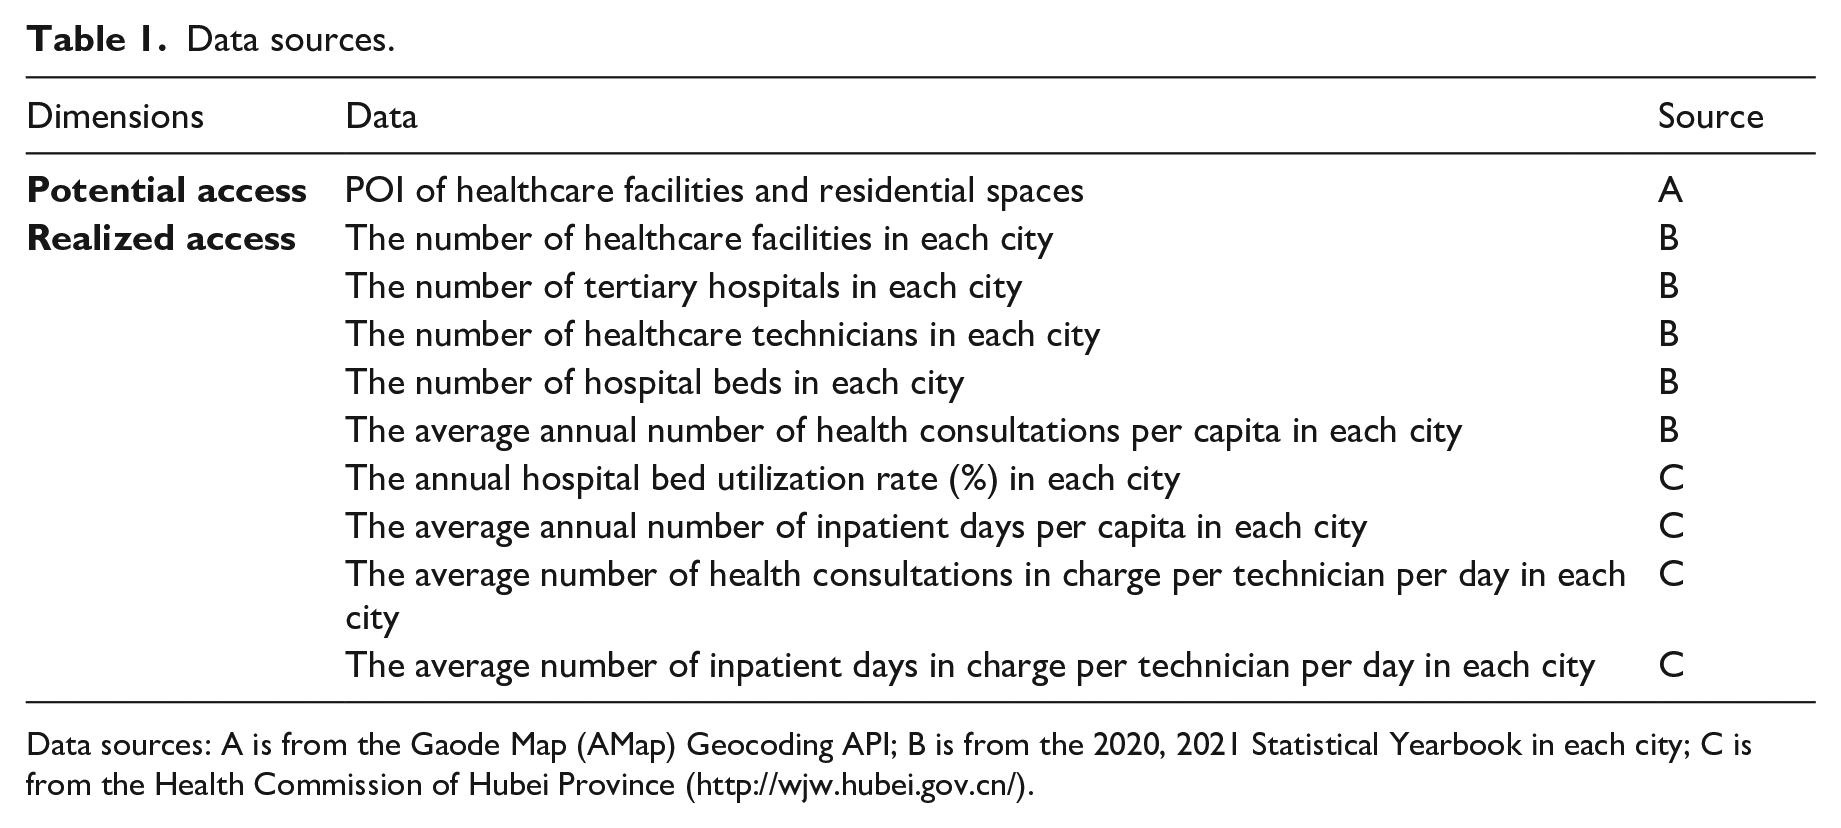
Data sources: A is from the Gaode Map (AMap) Geocoding API; B is from the 2020, 2021 Statistical Yearbook in each city; C is from the Health Commission of Hubei Province (http://wjw.hubei.gov.cn/).
Methodology
GIS spatial analysis
Four important GIS spatial analysis tools were employed in this paper to measure the residents’ potential access to healthcare services in Wuhan Metropolitan Area: 1) standard deviational ellipse; 2) average nearest neighbor; 3) kernel density; and 4) buffer analysis.
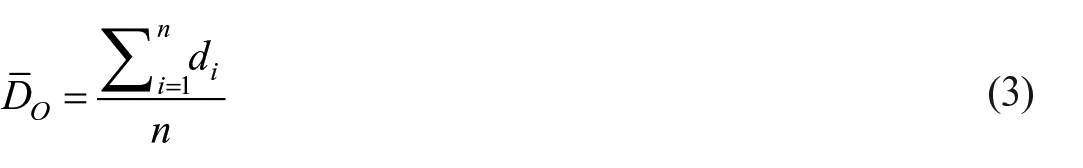
First, standard deviational ellipse is a common way to measure the spatial distribution of a set of points by calculating the standard deviation of the x-coordinates and y-coordinates from the mean center. The standard deviational ellipse is given as:
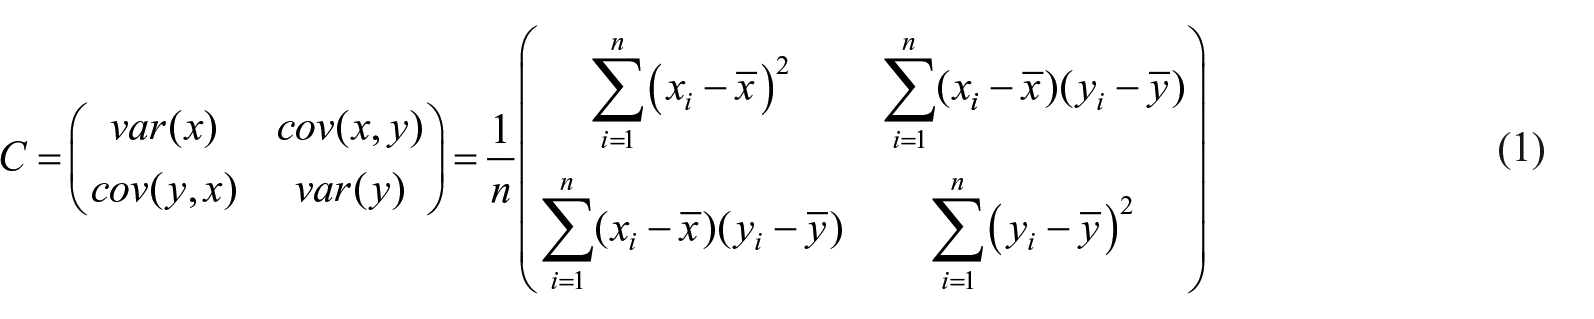
where
Second, the average nearest neighbor is a measure of the distance between each feature’s centroid and its nearest neighbor’s centroid. All these nearest neighbor distances are averaged and compared with a hypothetical random distribution (expected distribution) to reveal whether the features are clustered or dispersed. The average nearest neighbor ratio is calculated as:
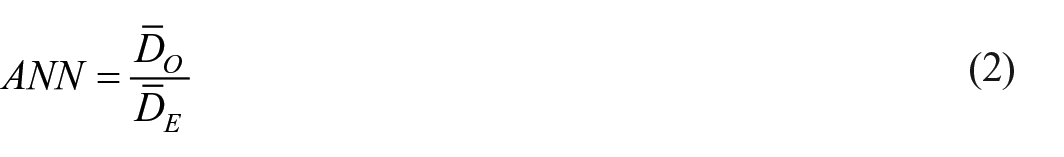
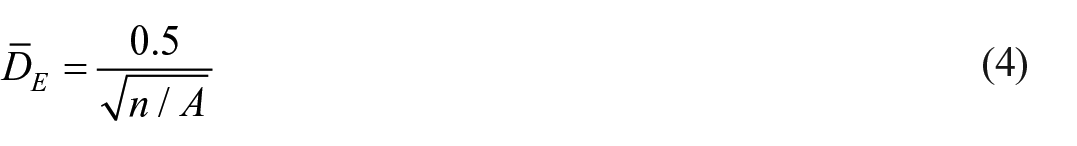
In the above equations,
Third, the kernel density tool has been applied to better assess healthcare service accessibility (Spencer and Angeles, 2007; Yang et al., 2006). It calculates the density of point features in a neighborhood around those features, and creates a smoothly curved surface fitting over each point. The surface value is highest at the location of the point and diminishes with increasing distance from the point, reaching zero at the search radius distance from the point. Referring to official guidelines for healthcare service planning, 2 this study chose five-minute walking distance (300 meters) and 15-minute walking distance (1000 meters) as the search radius distances for primary-level healthcare facilities (including clinics and community hospitals), and higher-level healthcare facilities (including emergency rooms, general hospitals, and specialty hospitals), respectively.
Accordingly, we created buffer polygons around healthcare facilities and residential spaces. We counted 1) the residential communities within the healthcare facilities’ catchment area and 2) the primary-level and higher-level healthcare facilities within the residential spaces’ catchment area. Furthermore, we created an overlay map of buffer analysis showing the areas with excess, sufficient, and insufficient healthcare resources in WMA: 1) if there is no residential space within the healthcare facilities’ catchment area, the area was defined as with excess healthcare resources; 2) if there are either primary-level or higher-level facilities within the residential spaces’ catchment area, the area was defined as with sufficient healthcare resources; and 3) if there is no healthcare facility within the residential spaces’ catchment area, the area was defined as with insufficient healthcare resources.
Entropy-weighted TOPSIS method and the coupling coordination degree model
Penchansky and Thomas (1981) emphasized that accessibility is the fit between a patient and the healthcare system. The entropy weighted TOPSIS method can objectively evaluate the level of healthcare resource provision and utilization (Sun et al., 2017), based on which the coupling coordination model allows us to measure the fit (Li et al., 2022); that is, residents’ realized access to healthcare services in WMA. Previous studies have applied the coupling coordination model to assess the supply and demand for urban green growth (Li et al., 2022), early care service (Zhang et al., 2022), and metro systems (Zhu et al., 2021). This study is among the first ones that apply entropy-weighted TOPSIS method and coupling coordination model to the evaluation of residents’ realized access to healthcare services. The evaluation process can be decomposed into the seven steps below:
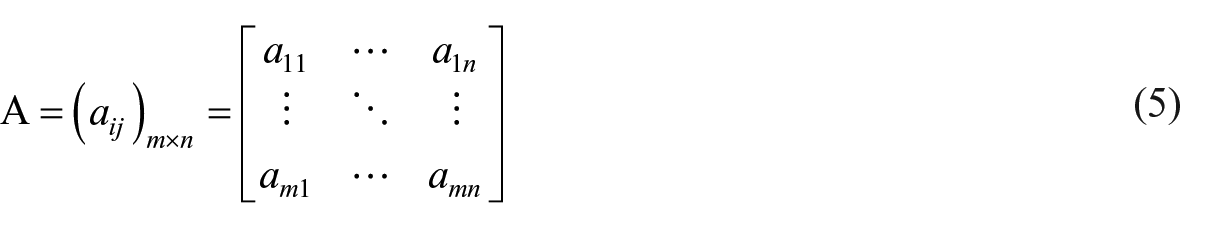
(1) Constructing the initial matrix and standardizing it
Assuming there are m cities and n indicators in the index system, the value of indicator j in city i is
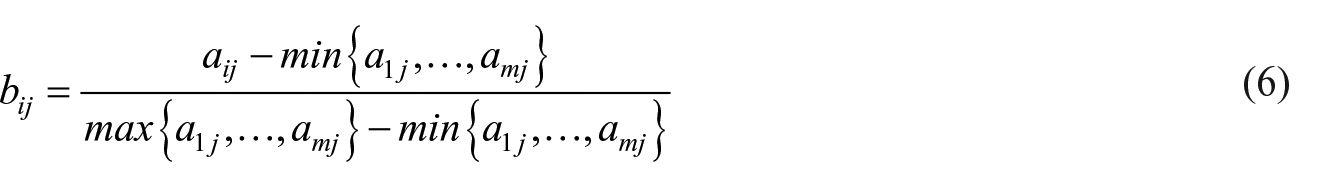
As all indicators (see Table 6) are positive in this paper, we used formula (6) to standardize the initial values
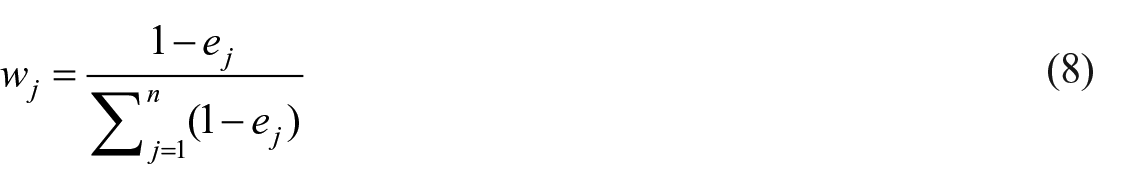
(2) Determining the indicator’s weight
In information theory, the entropy is used to quantify the average level of information or uncertainty (Gao et al., 2020; Huang, 2008) inherent to the indicator’s possible outcomes. It can be calculated as:
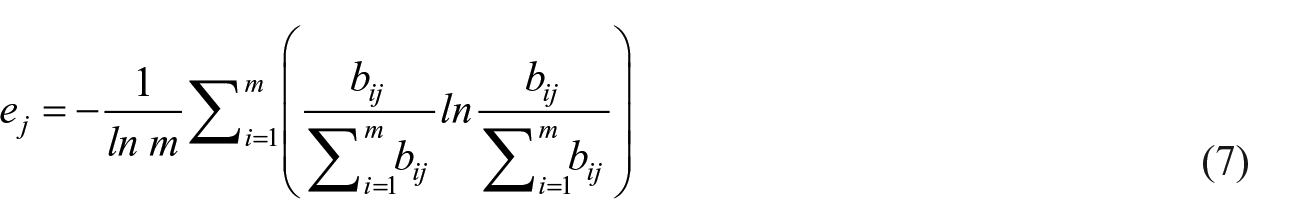
A larger
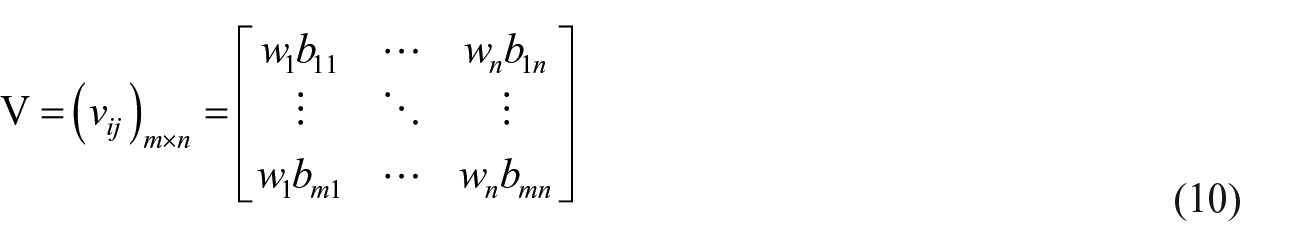
(3) Constructing the weighted matrix
The weighted value for indicator j in city i can be calculated using formula (9):

The weighted matrix can accordingly be represented as:
(4) Determining positive and negative ideal solutions


Where
(5) Calculating relative distance
This study used Euclidian distance in formulas (13) and (14) to calculate the distance between the weighted value of indicator j in city i to the indicator’s ideal solutions:
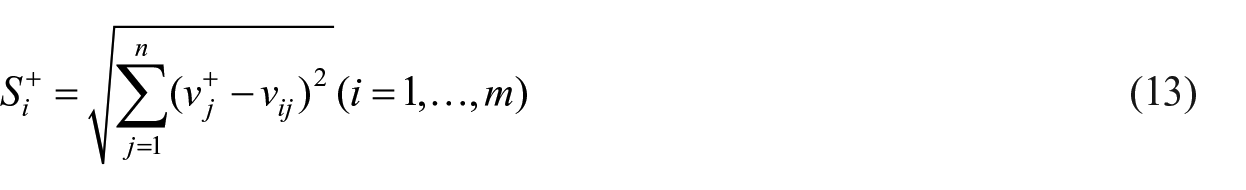
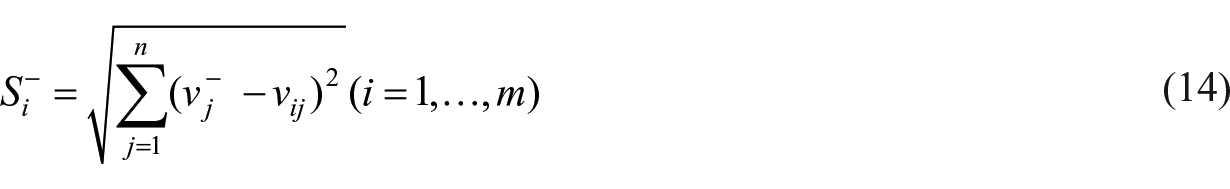
where
(6) Calculating the degree of approximation
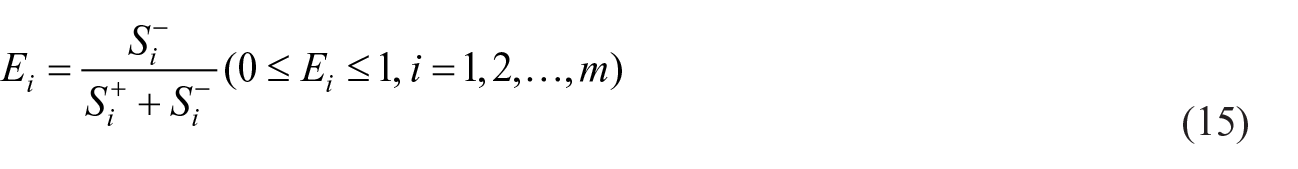
where
(7) Calculating the coupling coordination degree
Using Equations (5)–(15) and indicators in Table 6, we calculated the healthcare resource provision index
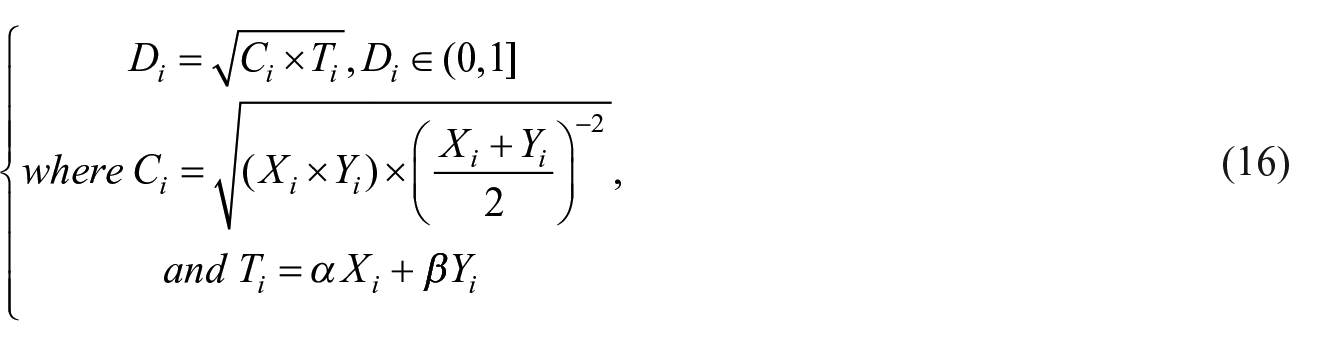
where
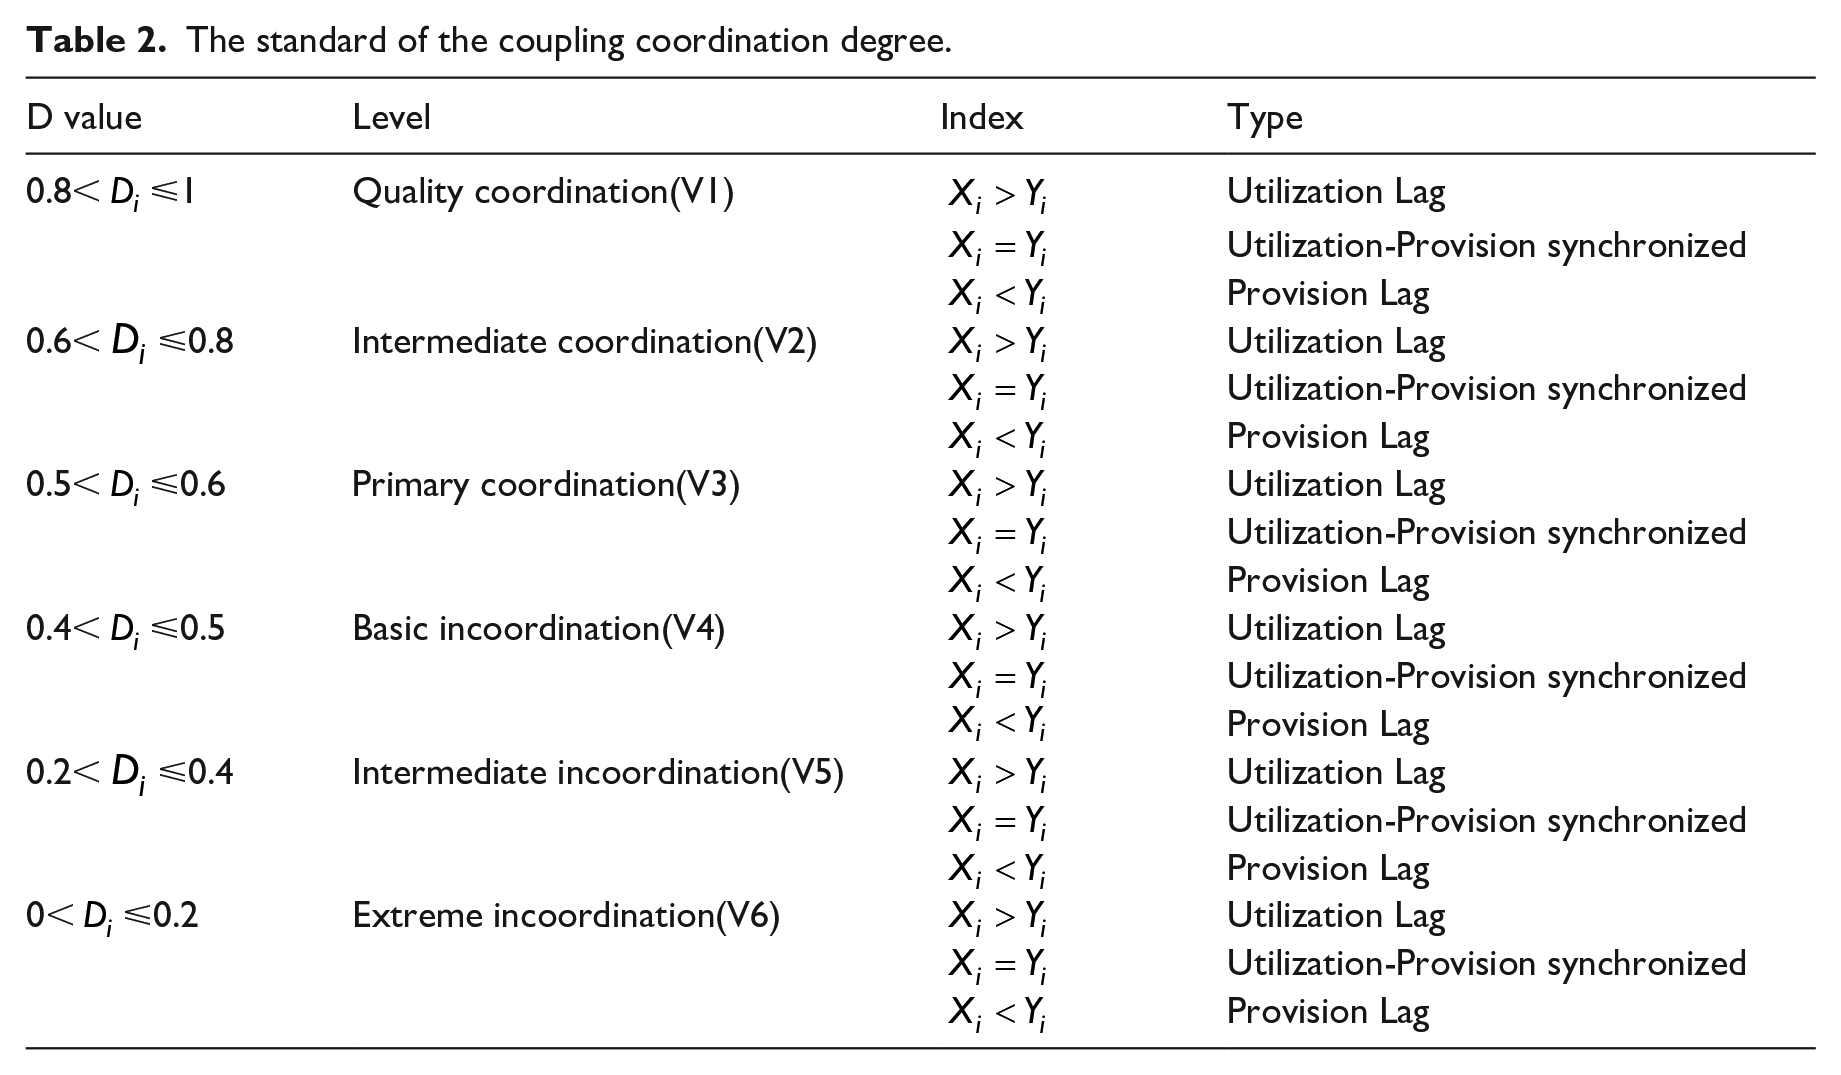
The standard of the coupling coordination degree.
Findings
Residents’ potential access to healthcare services
First, standard deviational ellipse analysis results shown in Figure 2 reveal the distributional trend of healthcare facilities and residential spaces in Wuhan Metropolitan Area. The dispersion patterns of healthcare resources and residential spaces are consistent in each city and in WMA. More specifically, as shown in Figure 2a, the distribution direction of healthcare facilities and residential spaces in WMA shows an east–west trend, with Wuhan as the center. At the city level, medical and residential points are distributed in various directions in different cities (see Figure 2b). For example, the distribution of the two types of spaces in Xiantao and Qianjiang is oriented east–west, while the layouts of medical and residential spaces in Xiaogan, Huangshi, Ezhou, and Huanggang are in the northeast direction. Such differences in the spatial orientation can be attributed to the cities’ geometry, topography, and location. In addition, the differences in the size of the standard ellipses illustrated by Figure 2 show that healthcare facilities in WMA are more dispersed than residential spaces.
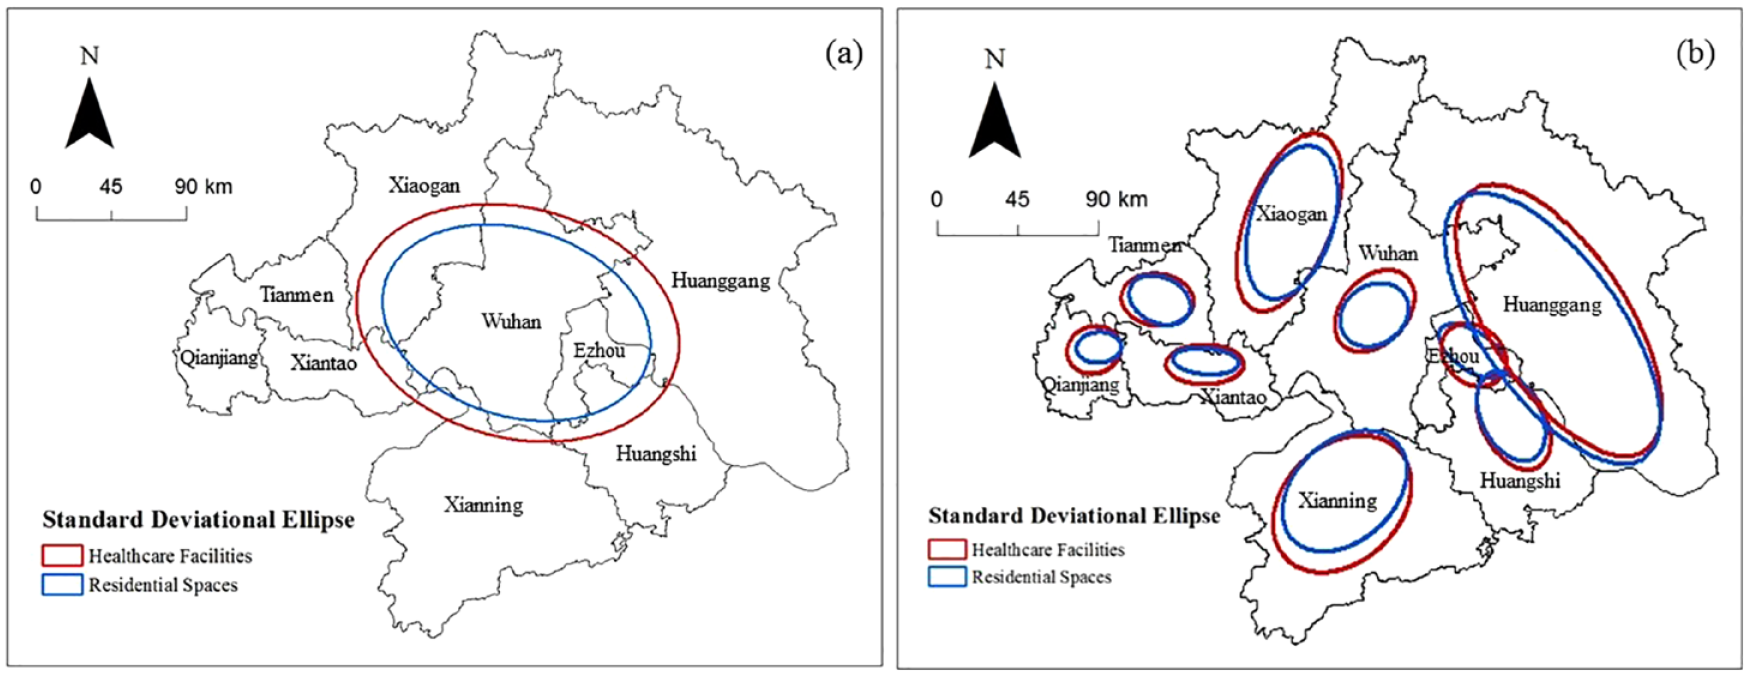
Standard deviational ellipse analysis of healthcare facilities and residential spaces in WMA at (a) regional level analysis and (b) city level analysis.
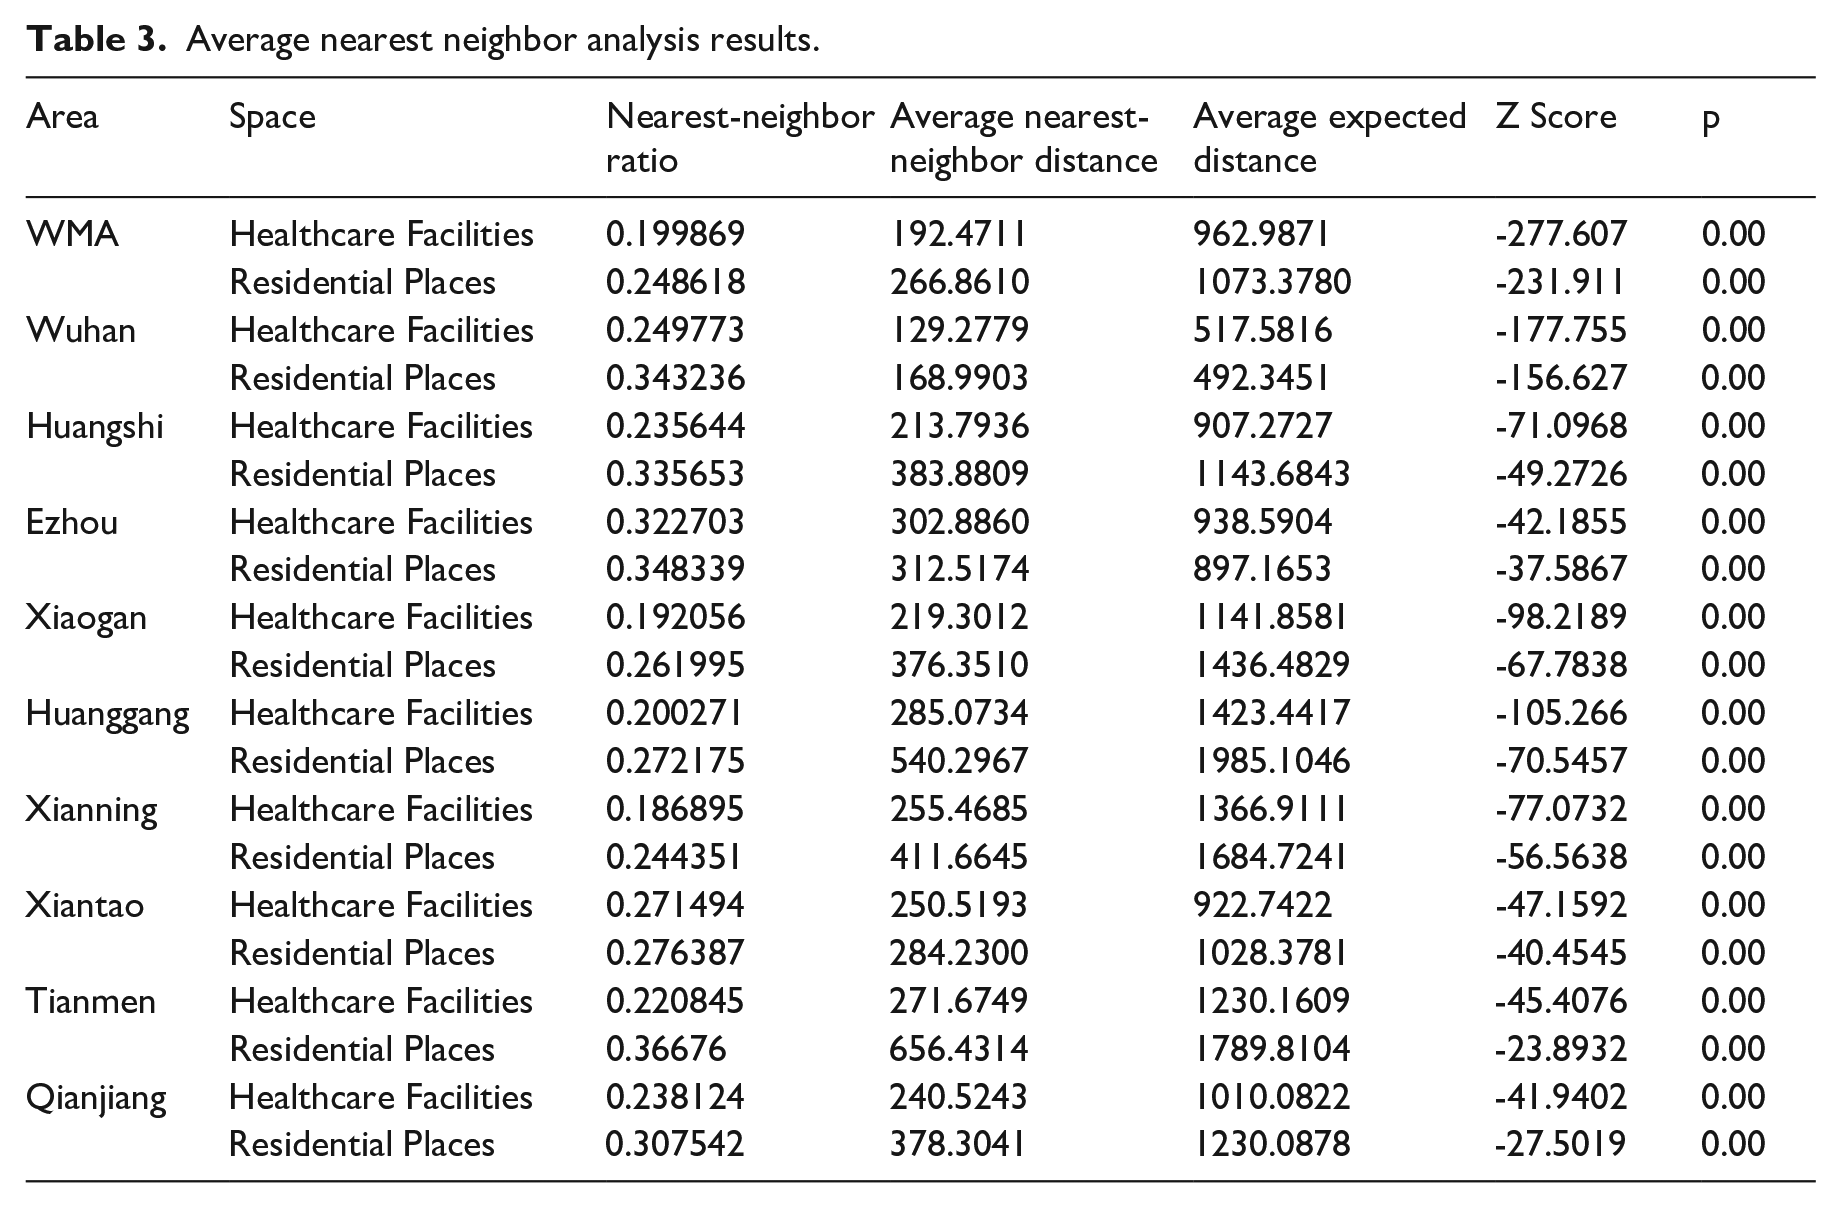
Second, Table 3 displays the results of average nearest neighbor analysis of the healthcare facilities and residential spaces in WMA. The average nearest neighbor ratios are less than 1, indicating clustering patterns of healthcare resources and residential spaces. Moreover, healthcare facilities and residential spaces are clustered to different degrees among the nine: they are more clustered in Xianning and Xiaogan, while less so in Wuhan, Xiantao, and Ezhou. Also note that the spatial distribution of healthcare resources is typically less clustered than that of residential spaces; this finding is consistent with the results of the standard deviational ellipse.
Average nearest neighbor analysis results.
Third, Figure 3 shows the kernel density analysis results for the healthcare facilities and residential spaces in WMA. From the perspective of the entire area, the highest density of both types of spaces can be observed in the central district of. Moreover, note that the density of high-level healthcare facilities such as general hospitals within a 15-minute range of the living area (Figure 3b) is higher than that of primary-level healthcare facilities, such as clinics, within five minutes of the living area (Figure 3a). For each city, the peak of the distribution density of both types of space is concentrated in the central area.
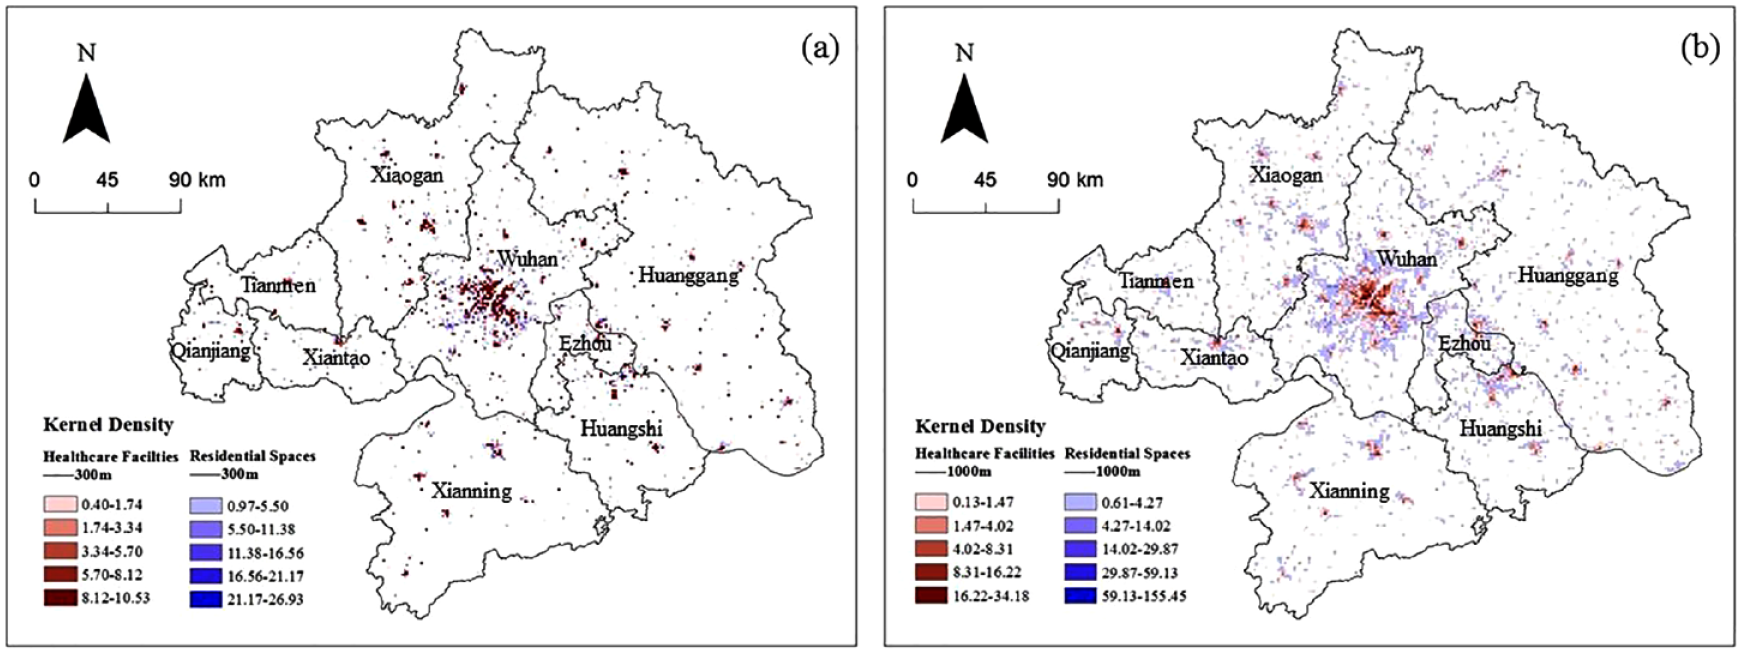
Overlay map of kernel density analysis of healthcare facilities and residential spaces within (a) 5-minute walking distance and (b) 15-minute walking distance.
Fourth, Figures 4 and 5 present the results obtained via buffer analysis of healthcare facilities and residential spaces in WMA. Using the buffer distance of healthcare facilities as the horizontal coordinate, we counted the settlements within each buffer zone. As shown in Figure 4, the 1000-meter buffer of healthcare facilities in most cities can cover over 90% of the residential spaces. However, except for Qianjiang (100%) and Wuhan (80.91%), the 300-meter buffer zones of healthcare facilities cover around 70% of the residential spaces. Moreover, we overlay the buffer of healthcare facilities and residential spaces, and categorize the buffers into areas with excess, sufficient, and insufficient healthcare resources (Figure 5). It is noticeable that the distribution of medical and residential spaces is typically most coordinated in urban central areas, especially that of Wuhan. Nevertheless, it also reveals that healthcare facilities are inadequate in the urban–rural continuum, while they are in surplus in peripheral areas of some cities, such as Wuhan, Xiantao, Xianning, and Huanggang.
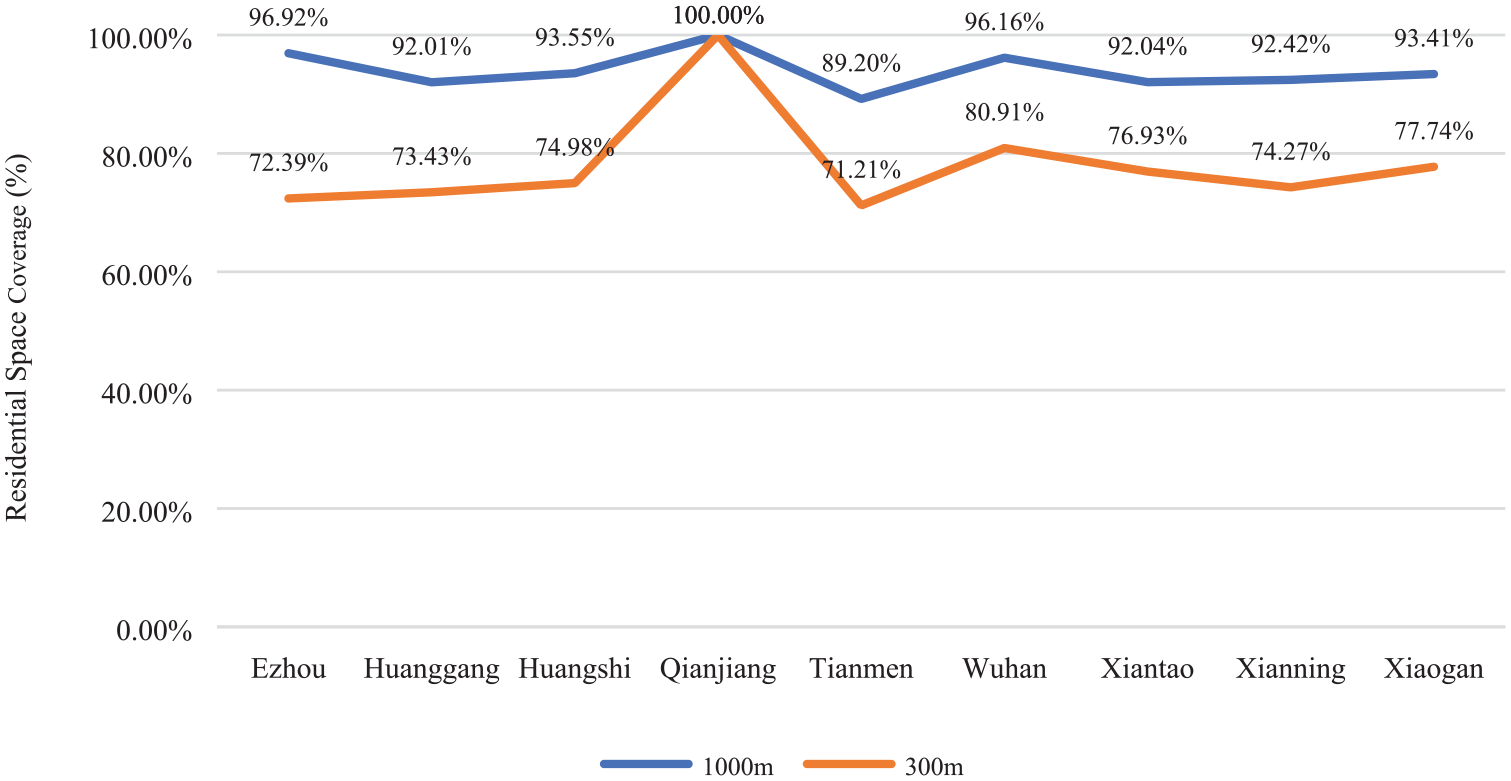
Coverage of residential areas by healthcare resources at 300 m and 1000 m.
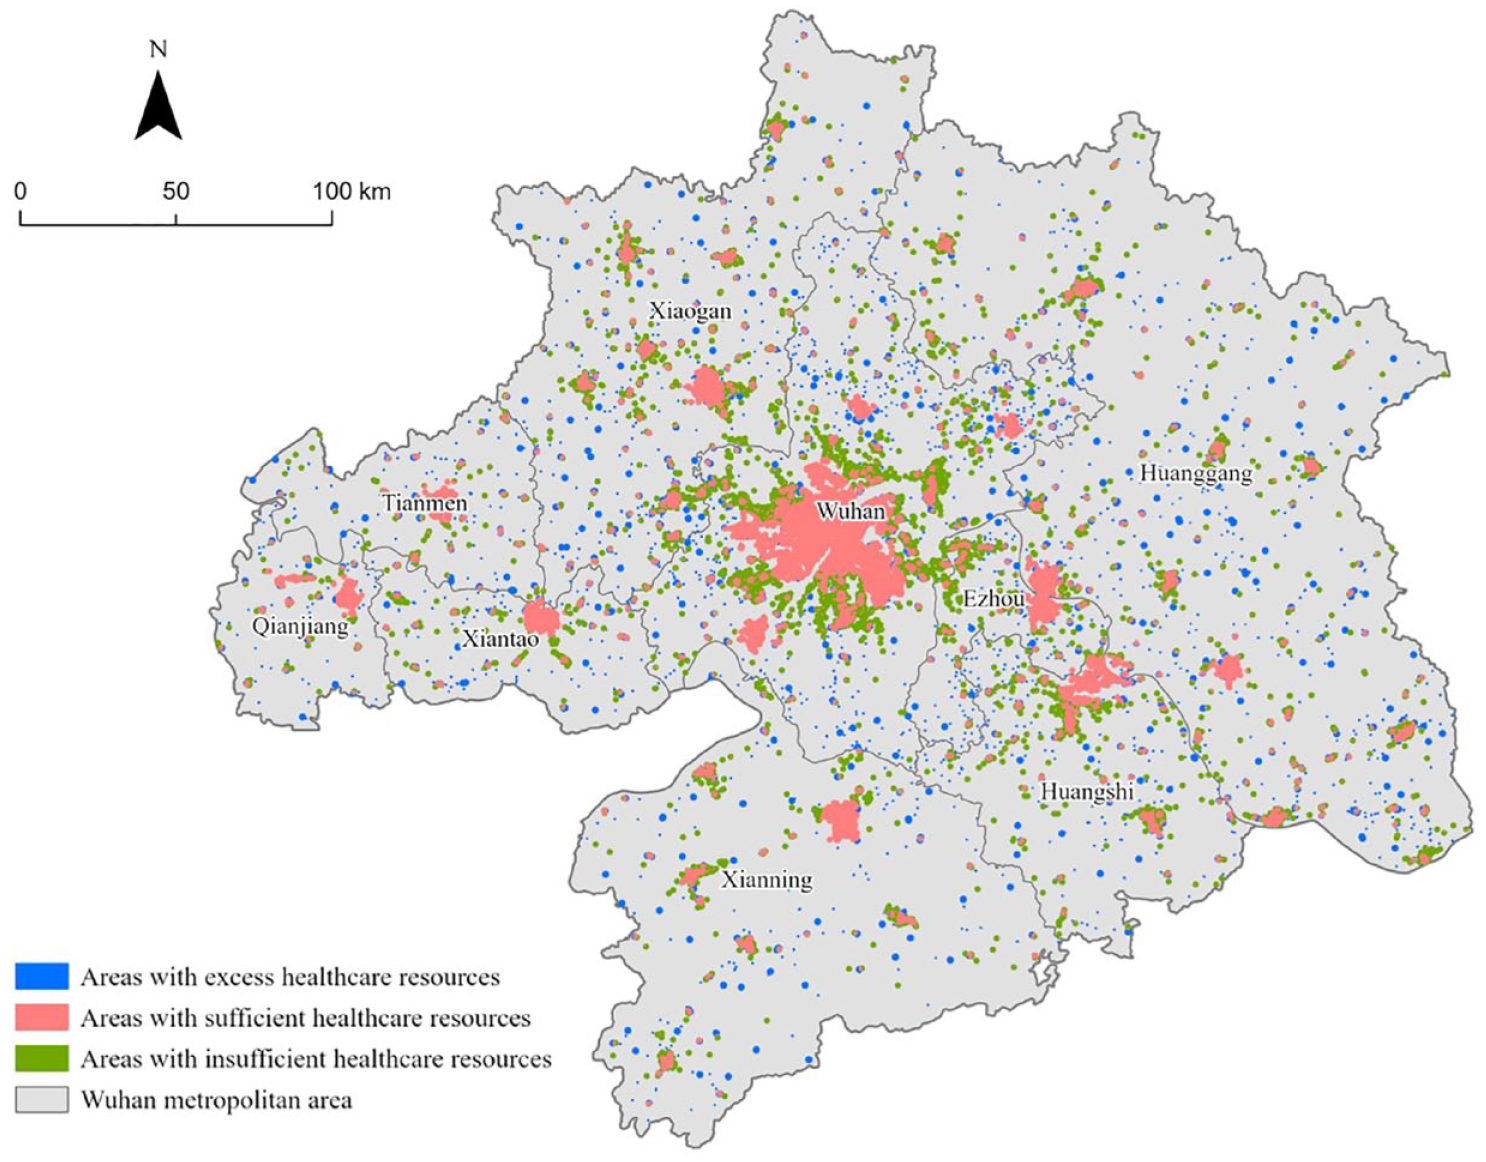
Overlay map of buffer analysis.
Coupling coordination degree analysis of healthcare resources
Healthcare service provision and utilization
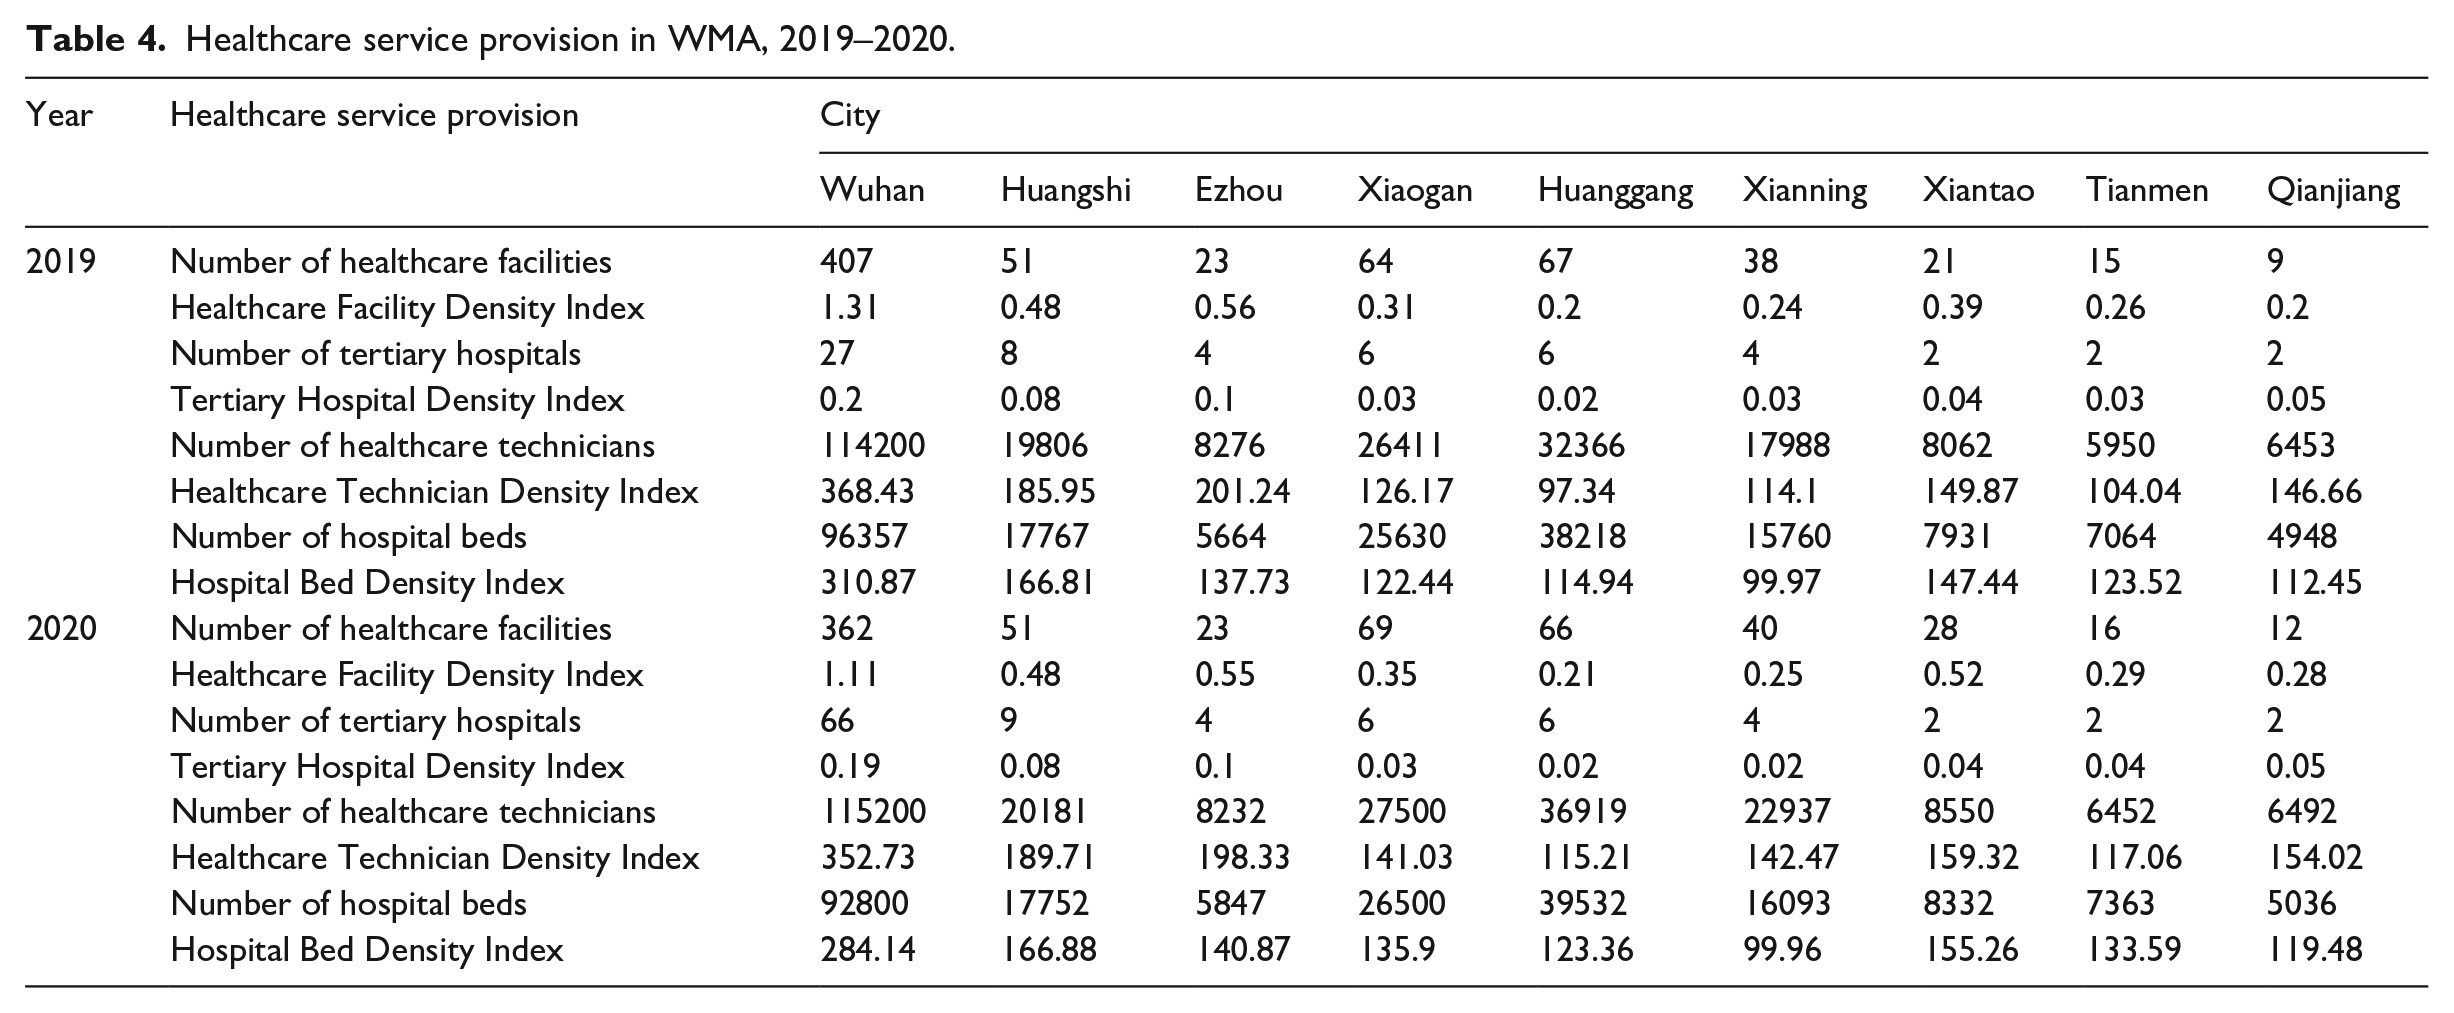
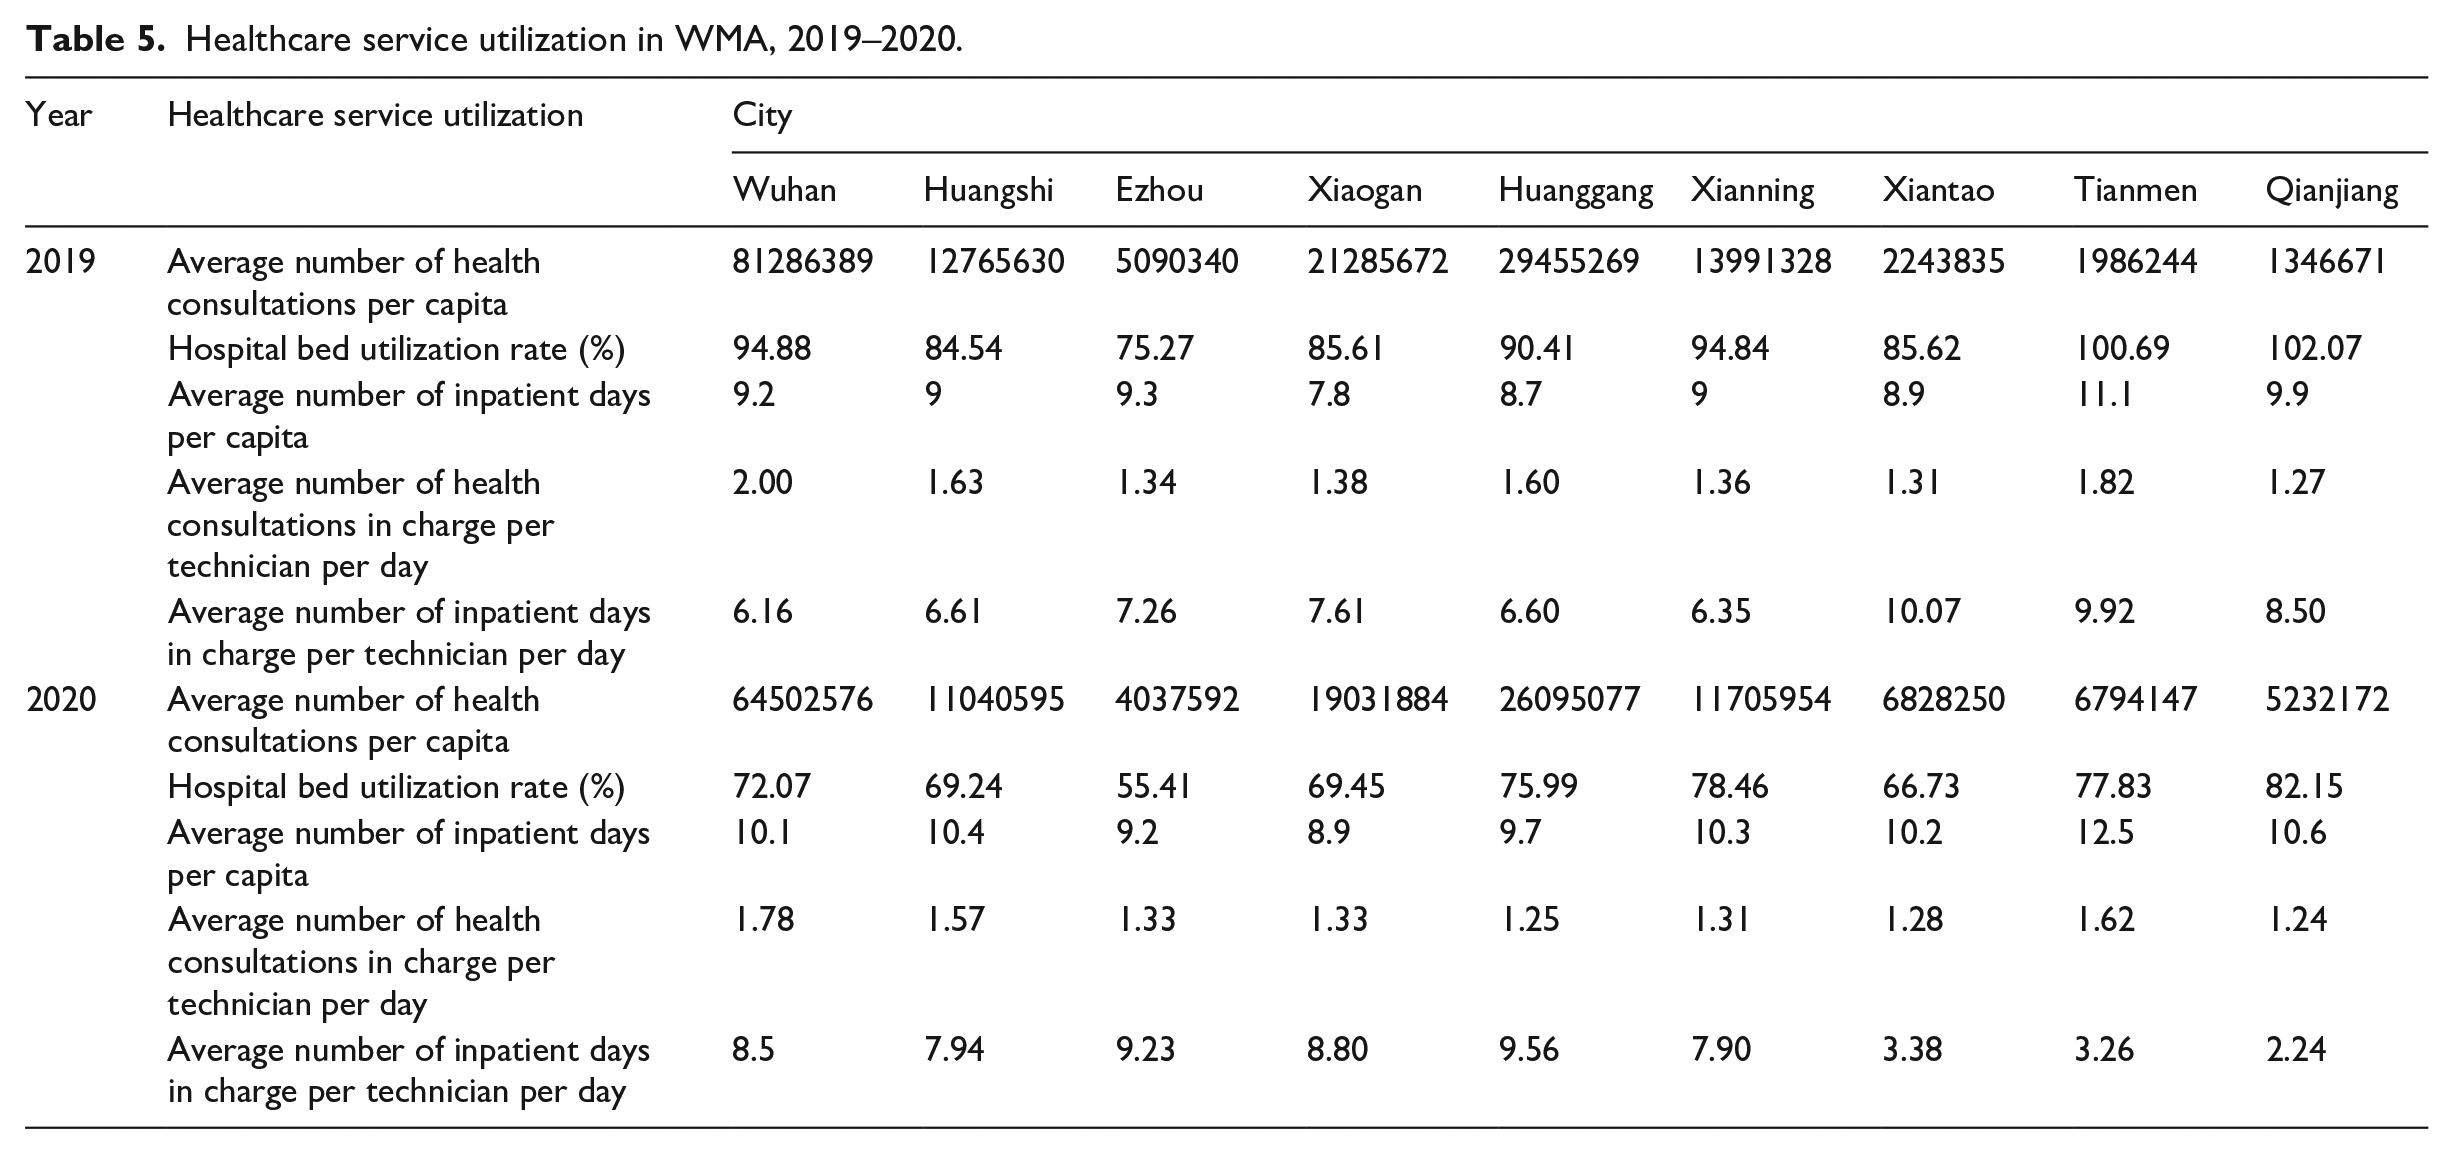
Tables 4 and 5 show the healthcare service provision and utilization in the Wuhan Metropolitan Area, respectively. Regarding the provision of healthcare services, Wuhan has concentrated most of the healthcare facilities, tertiary hospitals, healthcare technicians, and hospital beds. Although there is no significant change in healthcare resource provided by the city of Wuhan during 2019–2020, the density indices in other cities such as Xiaogan, Huanggang, and Xianning have increased. For healthcare service utilization, changes have been clear in these two years. The number of consultations per capita in Wuhan dropped from 8.13 in 2019 to 5.18 in 2020, and this trend is also reflected in other indicators such as hospital bed utilization rate. By contrast, as shown by the number of consultations, hospital utilization rate, and other indicators, healthcare resource utilization in Xiantao, Tianmen, and Qianjiang increased by varying degrees.
Healthcare service provision in WMA, 2019–2020.
Healthcare service utilization in WMA, 2019–2020.
Entropy-weighted TOPSIS evaluation results
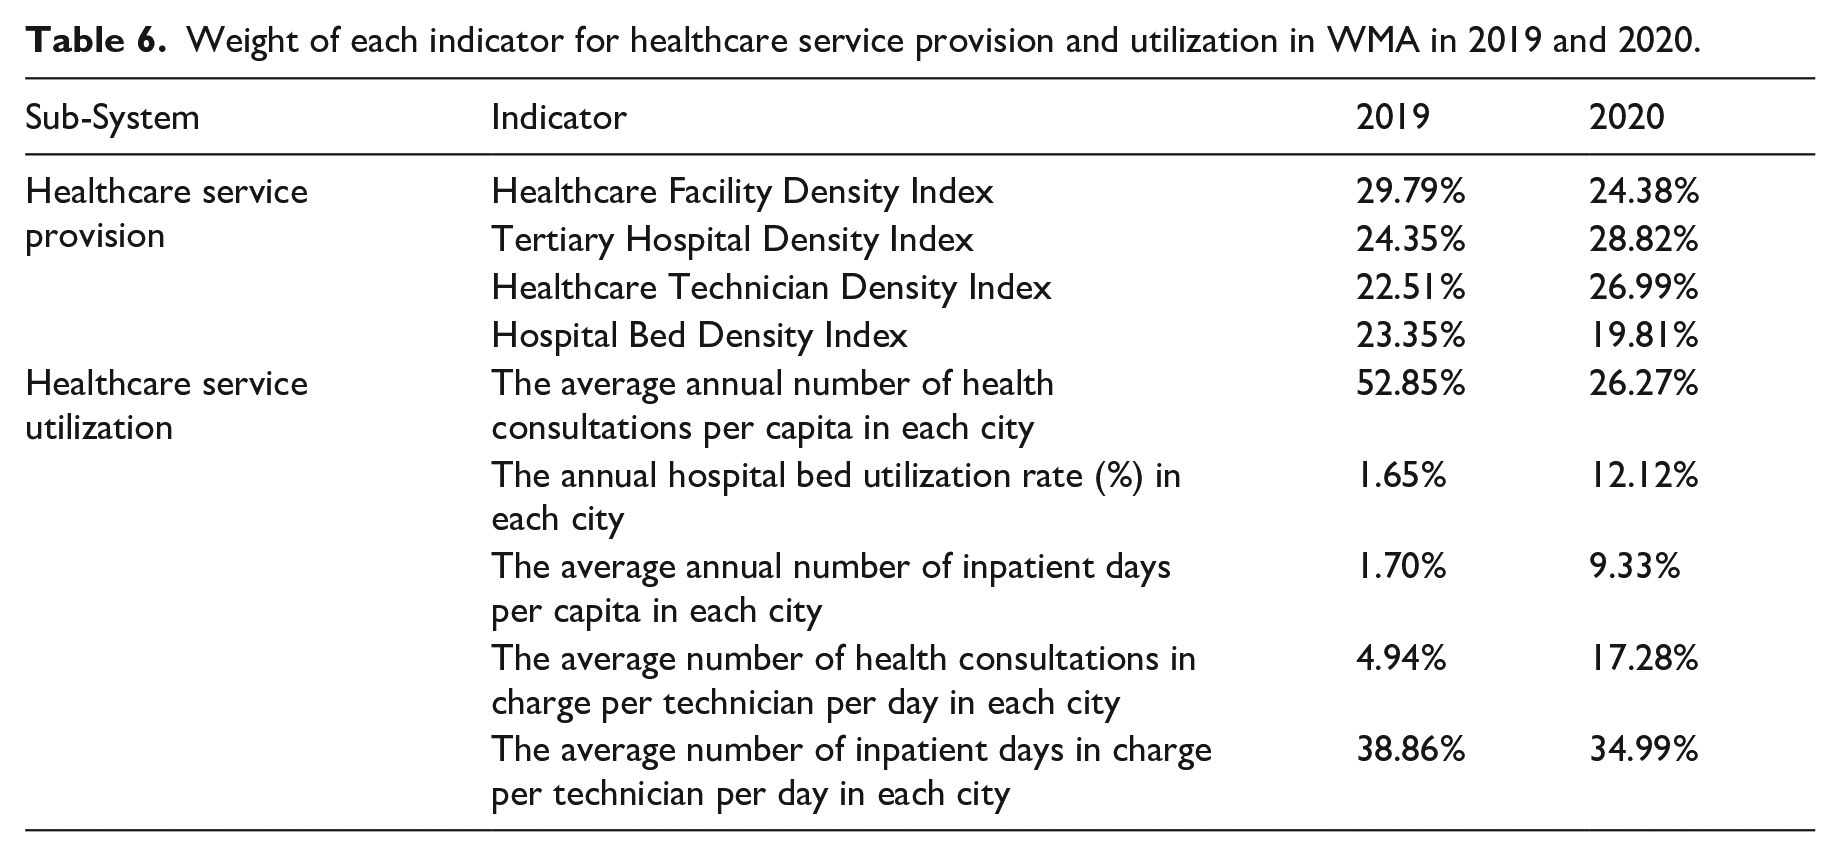
The entropy method provided the indicator weights of healthcare service provision and utilization from 2019 to 2020, as shown in Table 6. In terms of healthcare service provision, the healthcare facility density index was the most influential indicator (29.79%), while the health technician density index contributed least (22.51%) in 2019. Nevertheless, in 2020, the tertiary hospital density index became the most important indicator, with its weight increasing to 28.82%. This reflects the change after the outbreak of COVID-19 in 2020, when tertiary hospital and healthcare technicians became more critical resources. In terms of healthcare resource utilization, the weights of the five indicators vary considerably in each year, changing drastically from 2019 to 2020. In both years, note that the average number of inpatient days per technician in charge stand out in supreme importance. Meanwhile, the weight of the number of health consultations per capita decreased from 52.85% in 2019 to 26.27% in 2020. In contrast, the weights of hospital bed utilization rate, average annual number of inpatient days, and average number of inpatient days in charge per technician per day increased significantly.
Weight of each indicator for healthcare service provision and utilization in WMA in 2019 and 2020.
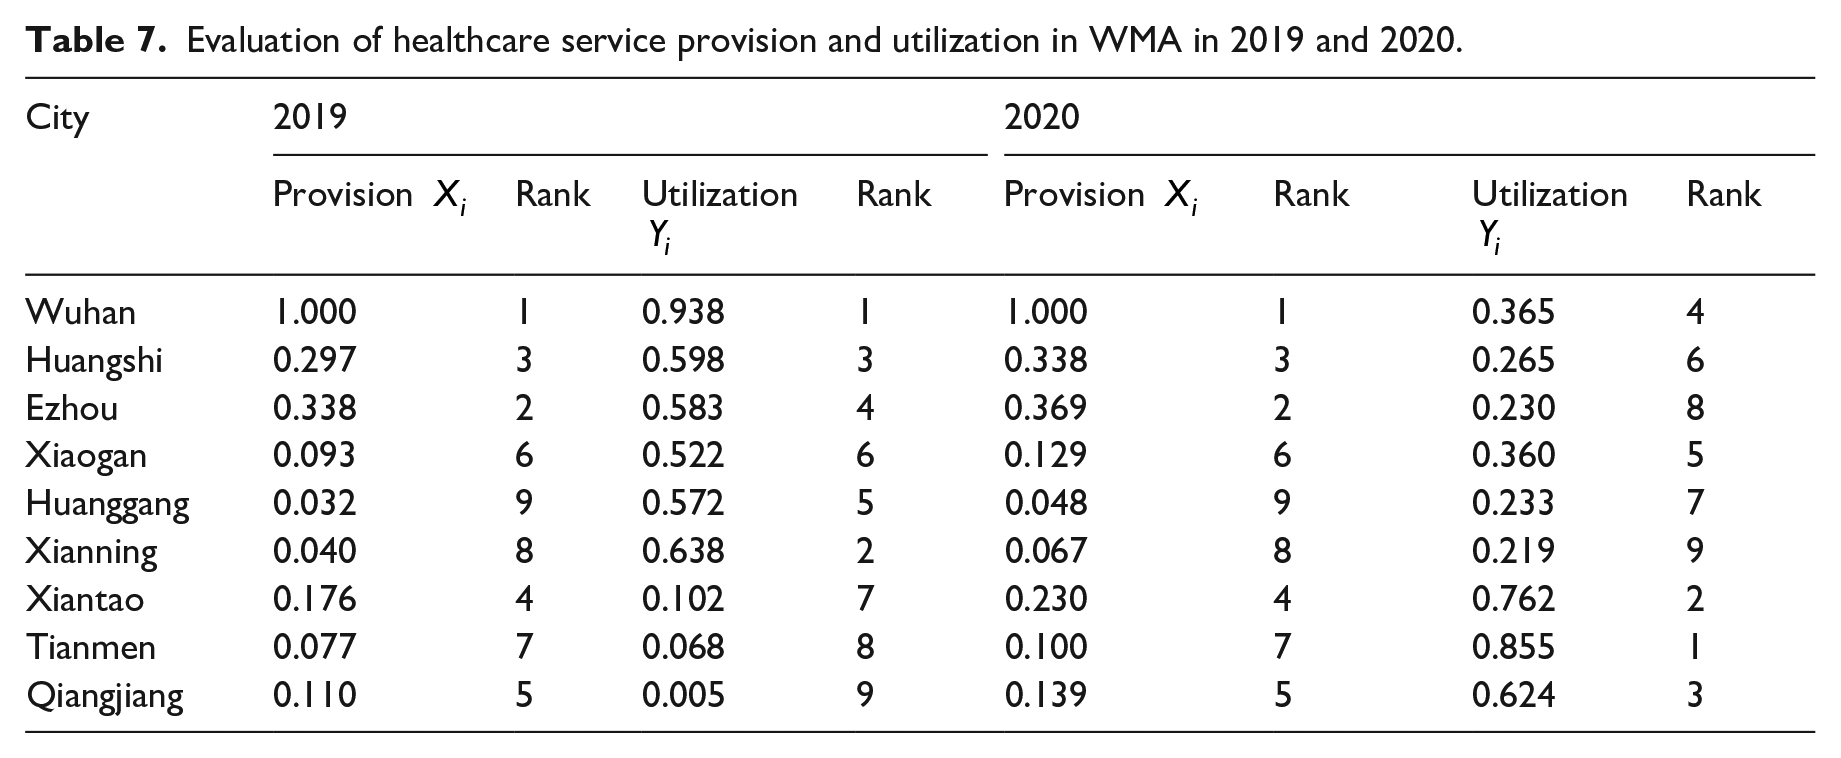
We further employed the entropy-weighted TOPSIS method to evaluate the healthcare service provision and utilization in each city of WMA during 2019–2020. Table 7 demonstrates wide variations in the provision and utilization of healthcare services across cities. The ranking of medical service provision in the metropolitan area remained unchanged from 2019 to 2020, with Wuhan consistently surpassing other cities by a wide margin in medical resources. However, it is also worth noting that except for Wuhan, the other eight cities experienced an increase in the healthcare service provision. In terms of healthcare service utilization, Wuhan was ranked first in 2019 but slipped to fourth in 2020. In contrast, Tianmen, Xiantao, and Qianjiang moved up from the last to the top three in medical resource utilization.
Evaluation of healthcare service provision and utilization in WMA in 2019 and 2020.
The dynamics of coupling coordination
Based on the entropy weighted TOPSIS evaluation results, we used the coupling coordination degree model to assess the interaction between healthcare service provision and utilization in Wuhan Metropolitan Area in 2019 and 2020. The results are classified into six levels and four types based on their coupling coordination degree and Xi–Yi relationship, as illustrated by Tables 2 and 8 and Figure 6. Figure 6 visually reveals two outstanding insights. First, despite apparent variations across cities and periods, the results reveal an overall incoordination between healthcare service provision and utilization in WMA. While Wuhan, Huangshi, and Ezhou reached coordination in 2019, they also saw a decline in the coupling coordination degree in 2020. In fact, only Xiantao, Tianmen, and Qianjiang experienced a marked increase in coupling coordination degree from 2019 to 2020.
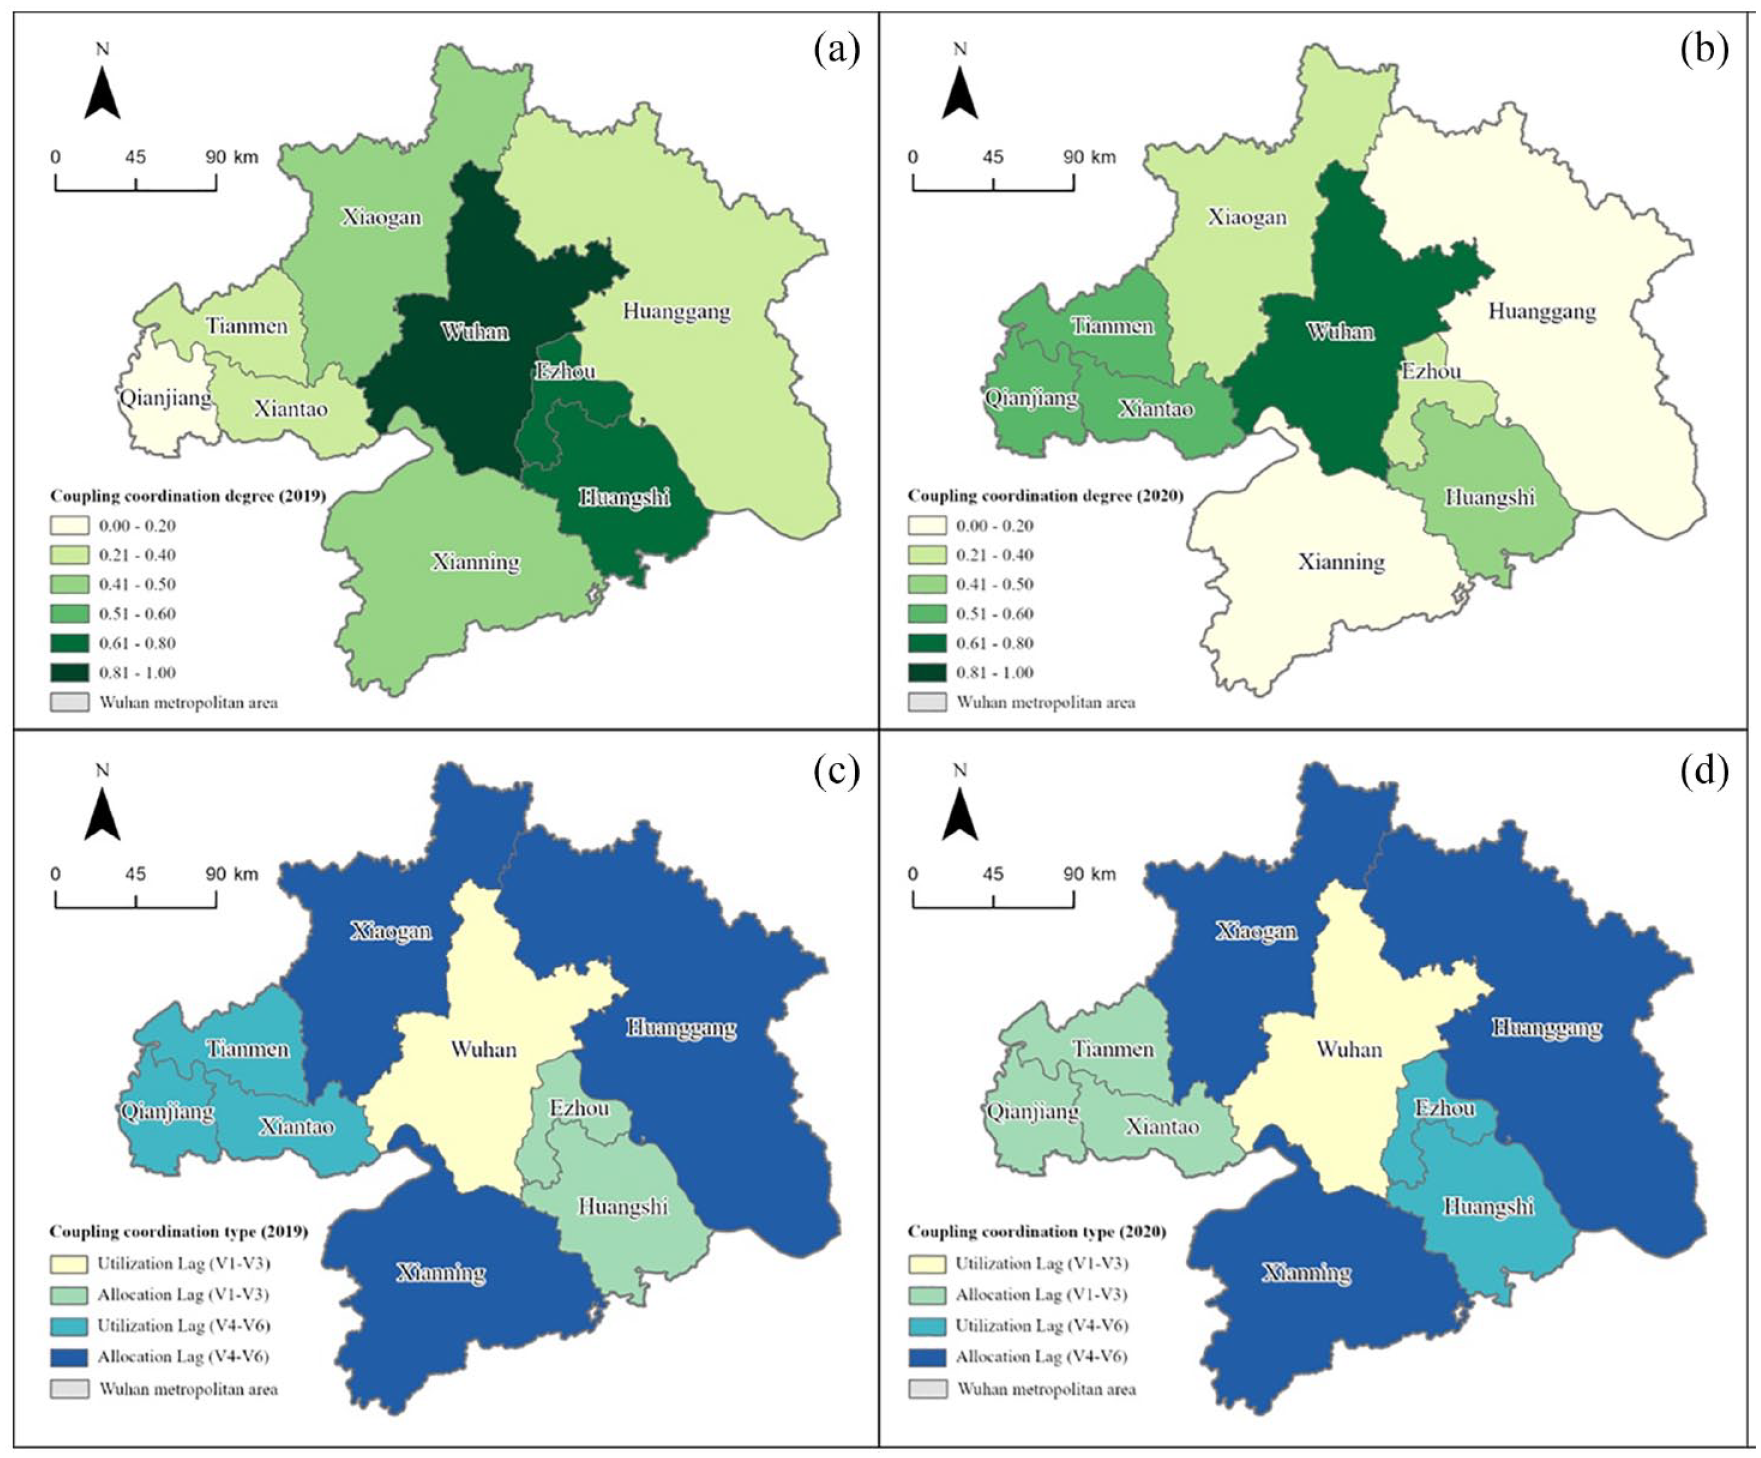
Coupling coordination degree level (up) and type (down) of healthcare resource allocation and utilization in WMA in 2019 (left) and 2020 (right).
Levels and types of coupling coordination degree of healthcare service provision and utilization in WMA in 2019 and 2020.
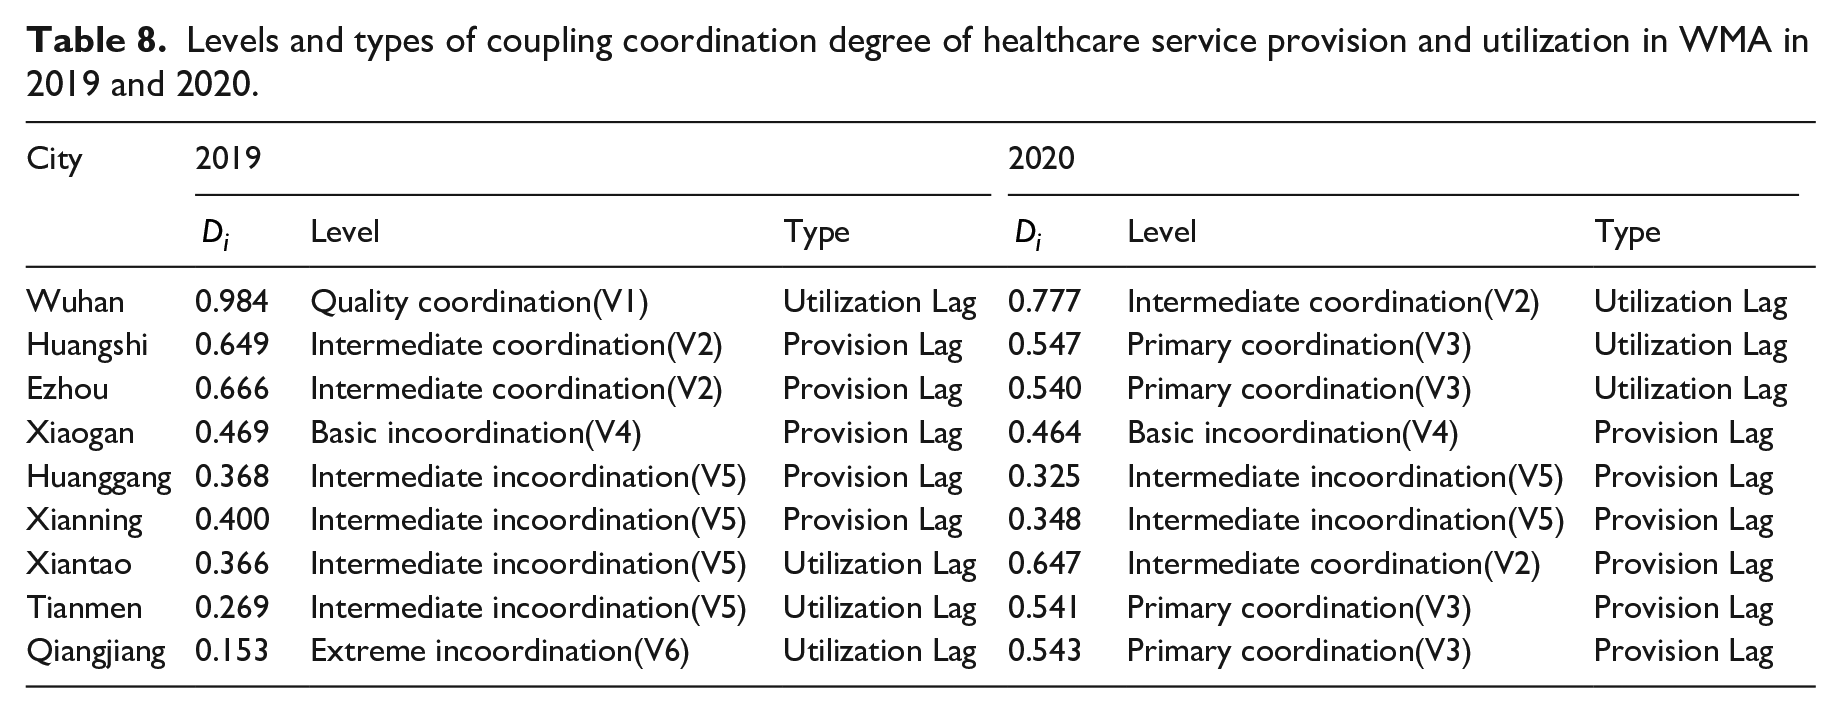
However, it is important to note that a high coupling coordination degree does not ensure a satisfactory realized access to healthcare services. For instance, while the level of coupling coordination degree in Tianmen reached primary coordination (V3) in 2020, it was due to a dramatic surge in the utilization of healthcare services in Tianmen. Note that it was ranked first in the utilization index but seventh in the provision index in 2020. This is why the second aspect, i.e., the type of coupling coordination degree model, is as important. Figure 6 presents various types of coupling coordination degree of healthcare service provision and utilization in WMA. It is noticeable that medical resources in Wuhan were consistently underutilized, while Xiaogan, Huanggang, and Xianning failed to provide adequate healthcare resources for their residents. In addition, Figure 6 captures changes in the coordination between healthcare service provision and utilization from 2019 to 2020. That is, the types of coupling coordination degree in Ezhou and Huangshi shifted from “under-resourced” to “under-utilized,” while Xiantao, Tianmen, and Qianjiang showed the opposite change.
Discussion
Potential access to healthcare services
As discussed in previous sections, this study utilized the standard deviational ellipse, average nearest neighbor, kernel density, and buffer analysis to measure the fit between medical and residential spaces (i.e., potential healthcare accessibility) in Wuhan Metropolitan Area. First, there is an overall spatial alignment between healthcare facilities and residential areas throughout the entire region, which implies the capacity of WMA’s healthcare services to satisfy most residents’ needs. However, the spatial analysis reveals an uneven potential healthcare accessibility in different areas. The distribution of medical and residential spaces is typically most coordinated in urban central areas, especially that of Wuhan. In contrast, healthcare facilities are inadequate in the urban–rural continuum, but in surplus in peripheral areas of some cities, such as Wuhan, Xiantao, Xianning, and Huanggang.
Moreover, potential spatial accessibility to healthcare facilities is also notably uneven across the nine cities. Wuhan residents enjoy the highest accessibility to healthcare facilities, whether primary facilities such as clinics and community health centers, or higher-level facilities such as general hospitals. This undoubtedly is closely connected with Wuhan’s dominant position in the urban hierarchy. However, the imbalance between provision and utilization in other cities of WMA is worth noting. While higher-level healthcare facilities in these cities manage to serve over 90% of the residential areas within a 15-minute walking distance, only approximately 70% of the settlements in cities except for Qianjiang are within a five-minute walk of primary-level healthcare facilities. This underscores that primary healthcare resources in WMA are far from adequate.
Realized access to healthcare services
Coupling coordination analysis is employed to understand the actual fit between healthcare services offered and utilized (i.e., residents’ realized access to healthcare services). Our analysis shows that despite the differences among the nine cities, the provision and utilization of medical resources in WMA as a whole is out of coordination. Wuhan has the highest coupling coordination degree of healthcare service provision and utilization, which reached quality coordination (V1) in 2019 but fell to intermediate coordination (V2) in 2020, indicating a generally satisfactory accessibility to healthcare services. Huangshi and Ezhou reachedat least primary coordination (V3) as well. However, all other cities have exhibited incoordination in the provision and utilization of healthcare resources to varying degrees at different times.
Combining the two aspects of coupling coordination degree, i.e., the level and the type, allows us to make observations about the impact caused by the COVID-19 pandemic. Among the nine cities, only Wuhan has been attracting migrants from other cities, particularly within Hubei province, while all the other eight cities have suffered from population loss. The COVID-19 pandemic temporarily changed this situation. It is noticeable that the coupling coordination degree in Wuhan exhibited a “utilization lag” in 2019; the COVID-19 outbreak and subsequent lockdowns in 2020 further magnified the underutilization of healthcare services. In contrast, Xiaogan, Huanggang, and Xianning continuously experienced insufficient healthcare resources, which was exacerbated in 2020. On the one hand, this can be attributed to their slow urban and economic development. Although these three cities are prefectural-level cities with a large population and administrative areas, their economic development (GDP per capita, etc.) was lagged, even compared with Xiantao, Qianjiang, and Tianmen, which are county-level cities (Hubei Provincial Statistics Bureau, 2021). On the other hand, the COVID-19 pandemic and the Wuhan lockdown required residents to stay put in their hometown and seek local healthcare services. This may also explain the shifting from “utilization lag” to “provision lag” in Xiantao, Tianmen, and Qianjiang. These three cities previously had a high number of out-migrants; but Wuhan’s lockdown and the COVID-19 pandemic blocked out-migration, and accordingly put great pressure on the local healthcare system.
Conclusion and implications
Healthcare accessibility is an important livelihood issue directly related to people’s health. China’s healthcare service capacity has improved significantly; however, the lack of coordination between provision and utilization of healthcare services remains prominent (Wang et al., 2019; Yin et al., 2018). By synthesizing spatial analysis and statistical modelling, this paper has revealed the healthcare accessibility in Wuhan Metropolitan Area, in both potential and realized dimensions. The distribution of healthcare facilities in WMA presents a clustering pattern, with a single and strong core emerging in the city center of Wuhan. Assuming a walking distance of 5 minutes for primary healthcare and 15 minutes for higher-level healthcare, we found residents’ potential access to higher-level healthcare facilities satisfactory; however, access to primary-level healthcare facilities still needs to be improved in most cities. Moreover, potential access to healthcare facilities is uneven across WMA’s nine cities and different areas. We call for more attention to areas in the urban–rural continuum, where healthcare facilities are most inadequate. In terms of the actual fit between healthcare services offered and utilized, our findings showed that except for Wuhan, all the other cities suffer from different levels of incoordination and therefore, a lack of resilience to public health emergencies.
The major contribution of this study is a combined evaluation of residents’ potential and realized access to healthcare services. The findings offer valuable information for policymakers to enhance the overall capacity of the healthcare system. First, the unevenness of economic development and healthcare resource allocation among different cities and regions suggests that governments at all scales in the metropolitan area should collaborate to formulate a more coordinated and comprehensive plan for resource allocation, and to promote resource sharing. On the one hand, it is crucial to enhance Wuhan’s radiation ability, since the core city of the metropolitan area enjoys the most advantaged healthcare services. Moreover, this paper reveals a surplus provision of healthcare resources in Wuhan. Hence, encouraging residents in the surrounding areas to make use of Wuhan’s medical resources can clearly improve their utilization efficiency. On the other hand, there is an urgent need to improve the healthcare resource abundance in cities such as Xiaogan, Huanggan, and Xianning, where the supply of healthcare services is not enough to meet residents’ demand. Second, both the quantity and quality of healthcare services need to be improved to enhance urban resilience to public health emergencies. Hit by the COVID-19 pandemic in 2020, the coupling coordination degree of healthcare service provision and utilization in all cities dropped, to varying extents. Moreover the number of tertiary hospitals and health technicians, were found to be more important than usual during the pandemic. Therefore, the regional and city governments should take the public health emergency into consideration to build a more resilient healthcare system.
The analysis is not without its shortcomings. One problem is the heterogenous healthcare accessibility issues faced by Chinese urban and rural residents. In terms of the provision of healthcare resources, the Principle of Medical Institution Planning issued by the National Health Commission highlights two parallel three-tier healthcare service systems for urban and rural regions. On the demand side, the rural population considers primary healthcare facilities (i.e., township health centers) as their default choice while urban residents prefer higher-level facilities (Liu et al., 2018). Secondly, this study evaluates the availability and utilization of healthcare services solely at the city level. Consequently, it overlooks the nuanced distinctions in healthcare facility types and levels, as well as different groups’ specific healthcare needs. These questions could be better addressed in future research with micro-level data.
Footnotes
Declaration of conflicting interests
The author(s) declared no potential conflicts of interest with respect to the research, authorship, and/or publication of this article.
Funding
The author(s) disclosed receipt of the following financial support for the research, authorship, and/or publication of this article: This work was supported by the National Natural Science Foundation of China [42171205]