
Abstract
Protecting and restoring ecosystems while enhancing residents' sense of ecological access and well-being is an urgent challenge in the current context of ecological protection and restoration of territorial spaces. This study proposes a novel ecological network-based framework for identifying key areas for ecological protection and restoration by incorporating ecological needs into their identification. The results indicate that the distribution of ecological sources in Huanghua City has minimal spatial overlap with areas of high ecological demand. A composite corridor network totaling 801.9 km was constructed, comprising 207.60 and 594.30 km of ecological and demand corridors, respectively, which resulted in extensive coverage. Thirty-two key areas for ecological protection and restoration were identified, including seven ecological nodes, 10 ecological pinch points, and 15 ecological barriers. In addition to these key areas, protecting core ecological sources, enhancing the construction of parks and green spaces, and improving water network connectivity are essential strategies for enhancing residents' ecological access. The identification of key areas for ecological protection and restoration based on the composite network offers insights into how these processes can improve the well-being of residents.
Introduction
Since the Industrial Revolution, intensified human activities have led to ecological problems such as habitat fragmentation and ecosystem degradation, which seriously threaten human well-being and sustainable socio-economic development (Keesstra et al., 2018; Qin et al., 2023; Tarrasón et al., 2016; Vu et al., 2014). Therefore, ecological protection and restoration are urgent tasks. In their Sustainable Development Goals, the United Nations has repeatedly called for ecosystem protection and restoration (Griggs et al., 2013). At the 20th National Congress of the People's Republic of China, improving ecosystem service functions by protecting and restoring key ecological areas was proposed (Dou et al., 2024). Defining ecosystem protection and restoration objectives, as well as selecting appropriate key areas, is essential for achieving sustainable development (Chen et al., 2023).
Ecosystem protection and restoration need to balance the enhancement of the ecological environment with human well-being (Peng et al., 2020; Wang et al., 2021a). Thus, it is a proactive response to ecological degradation as its goals have evolved with human society. In the early days of industrial civilization, ecological protection and restoration focused on single environmental issues. In the mid to late 20th century, the focus shifted to the entire ecosystem (Fu et al., 2019). In the 21st century, sustainable development and human well-being have become central issues in ecology, and now increasing attention is being paid to ecological protection and restoration from an integrated socio-ecological system perspective (Sun et al., 2023). Improving a region's ecological environment to meet residents’ needs and enhance their sense of ecological access is one approach to achieve human well-being through ecological protection and restoration (Fu, 2021; Liu et al., 2019; Peng et al., 2020).
Identifying key areas for protection and restoration is an effective strategy to achieve ecological protection goals. Due to the uneven distribution of natural conditions and human activities, different areas exhibit varying ecological backgrounds and importance within regional ecosystems. Focusing on protection and restoration efforts in priority areas can enhance the regional ecological environment more efficiently and reduce time and economic costs (Ding et al., 2024). Consequently, numerous scholars have conducted extensive research to identify key areas for ecological protection and restoration from various perspectives, such as regional ecological problem identification, key species protection, ecosystem service enhancement, and landscape integrity (Liu, 2021; Tu et al., 2022a, 2022b; Xiang et al., 2023). Despite the increasing attention being paid to residents' ecological needs, the identification of key areas is dominated by a single ecological perspective. Therefore, case studies are urgently needed to identify key areas for protection and restoration that balance regional ecosystem protection with the satisfaction of residents’ ecological needs to effectively connect ecological and living spaces within a region (Wang et al., 2022a).
Identifying key areas for ecological protection and restoration using ecological networks can enhance the ecological environment and the residents' sense of ecological access. An ecological network connects ecological sources, corridors, and other elements in an organic spatial configuration (Wang et al., 2021b). A healthy ecological network is essential for maintaining regional ecosystem stability and enhancing human well-being. Delineating vulnerable and obstacle areas within the network, followed by protection and restoration, has become the mainstream method for identifying key areas based on ecological networks (Dou et al., 2024; Tu et al., 2022b). This approach has led to the formation of a basic paradigm: ‘source identification, resistance surface construction, corridor extraction, and node determination’ (Xu et al., 2024, p.1073). Under this paradigm, numerous studies have identified key areas for ecological protection and restoration using methods such as the minimum cumulative resistance model (Wang et al., 2022b), circuit theory (Wang et al., 2023), and graph theory (Huang et al., 2023). These studies focused on aspects such as landscape connectivity, ecosystem service functions, and habitat quality and accumulated a substantial research base (Huang et al., 2024; Qiu et al., 2024). However, this approach exposes deficiencies such as a single perspective in network construction and insufficient emphasis on residents' sense of ecological access. Currently, a key issue is the construction of a composite ecological network that simultaneously satisfies regional ecological protection and restoration goals, enhances residents' sense of ecological access, and identifies key areas for protection and restoration based on this network.
Huanghua City is located at the intersection of two major economic zones: the ‘Bohai Rim’ and the ‘Beijing-Tianjin Rim’. Owing to its rapid and disorganized socio-economic development, the city faces challenges in ecological protection and restoration, as well as in meeting residents' ecological needs. In this study, Huanghua City was selected to construct a composite ecological network that connects ecological source areas and high-value demand areas based on habitat quality assessments and measurements of human ecological demand. Key areas for ecological protection and restoration were identified from the perspective of network function optimization, while protection and restoration plans were formulated. This study provides a basis for formulating ecological protection and restoration policies in Huanghua City and offers a reference framework for identifying key areas that balance regional ecosystem protection by fulfilling residents' ecological needs.
Study area and data sources
Study area
Huanghua City is located in the eastern part of Cangzhou City, Hebei Province, between latitudes 38°09′N and 38°39′N and longitudes 117°05′E and 117°49′E. The city experiences a warm-temperate, semi-humid, monsoon climate and features a landscape dominated by retreating siltation and impact plains. It covers a total area of 2425 km2 with elevations ranging from 1 to 7 m above sea level. Huanghua City has a dense river network comprised of 21 rivers, including the Nanpai River, totaling 543.3 km in length. The city also contains extensive water bodies and wetlands covering 621.6 km2. Severe soil salinization restricts the growth of regional plants. Additionally, issues such as significant habitat fragmentation and poor connectivity pose major threats to ecological security and stability as well as to the well-being of the inhabitants. Administratively, the city was divided into 16 township districts. Huazhong Street, Huaxi Street, and Huadong Street were combined into street offices because of their small sizes, similar physical and social characteristics, and comparable geographical locations (Figure 1).
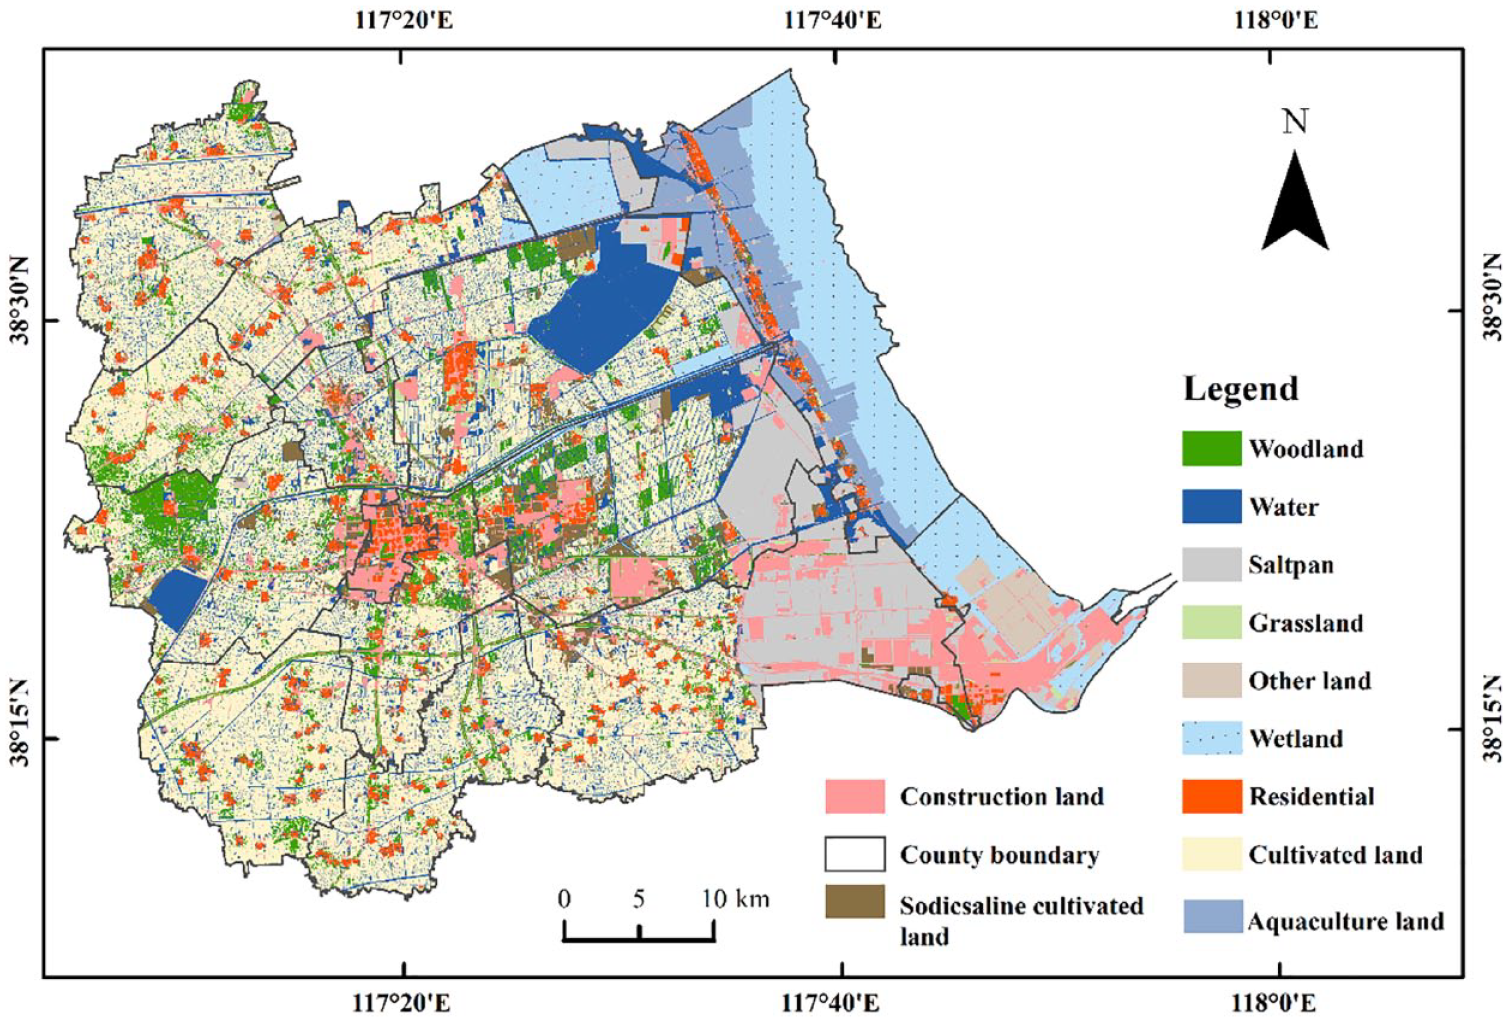
Land use classification map of administrative regions.
Data sources
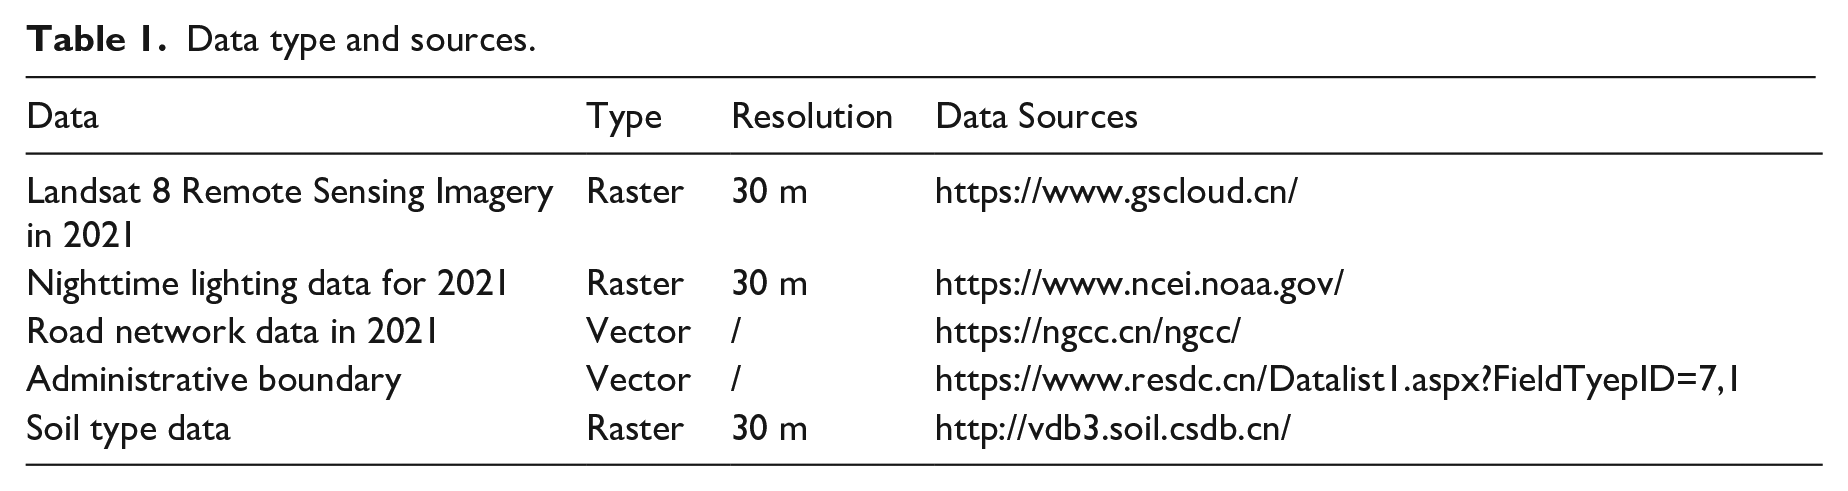
The data used in this study included Landsat 8 OLI remote sensing imagery, nighttime light data, road data, administrative boundaries, soil type data, and other data for 2021. Table 1 summarizes the data sources. Land-use data were obtained through visual interpretation of Google Earth remote sensing images.
Data type and sources.
Methods
This study developed a strategy to identify key areas for ecological protection and restoration from the perspective of ecological protection and needs (Figure 2). This strategy consists of the following three steps. First, ecological demand was measured using ecological demand intensity and travel convenience, and ecological source areas were identified by combining habitat quality (HQ) and morphological spatial pattern analysis (MSPA). Second, the minimal cumulative resistance (MCR) model and circuit theory were employed to construct a composite corridor network. Finally, based on the results of the composite corridor network construction, ecological ‘pinch points,’ ecological nodes, and ecological obstacles were identified as key areas for ecological protection and restoration. Different protection and restoration strategies were formulated based on the current land use status, regional characteristics, and key ecological issues.
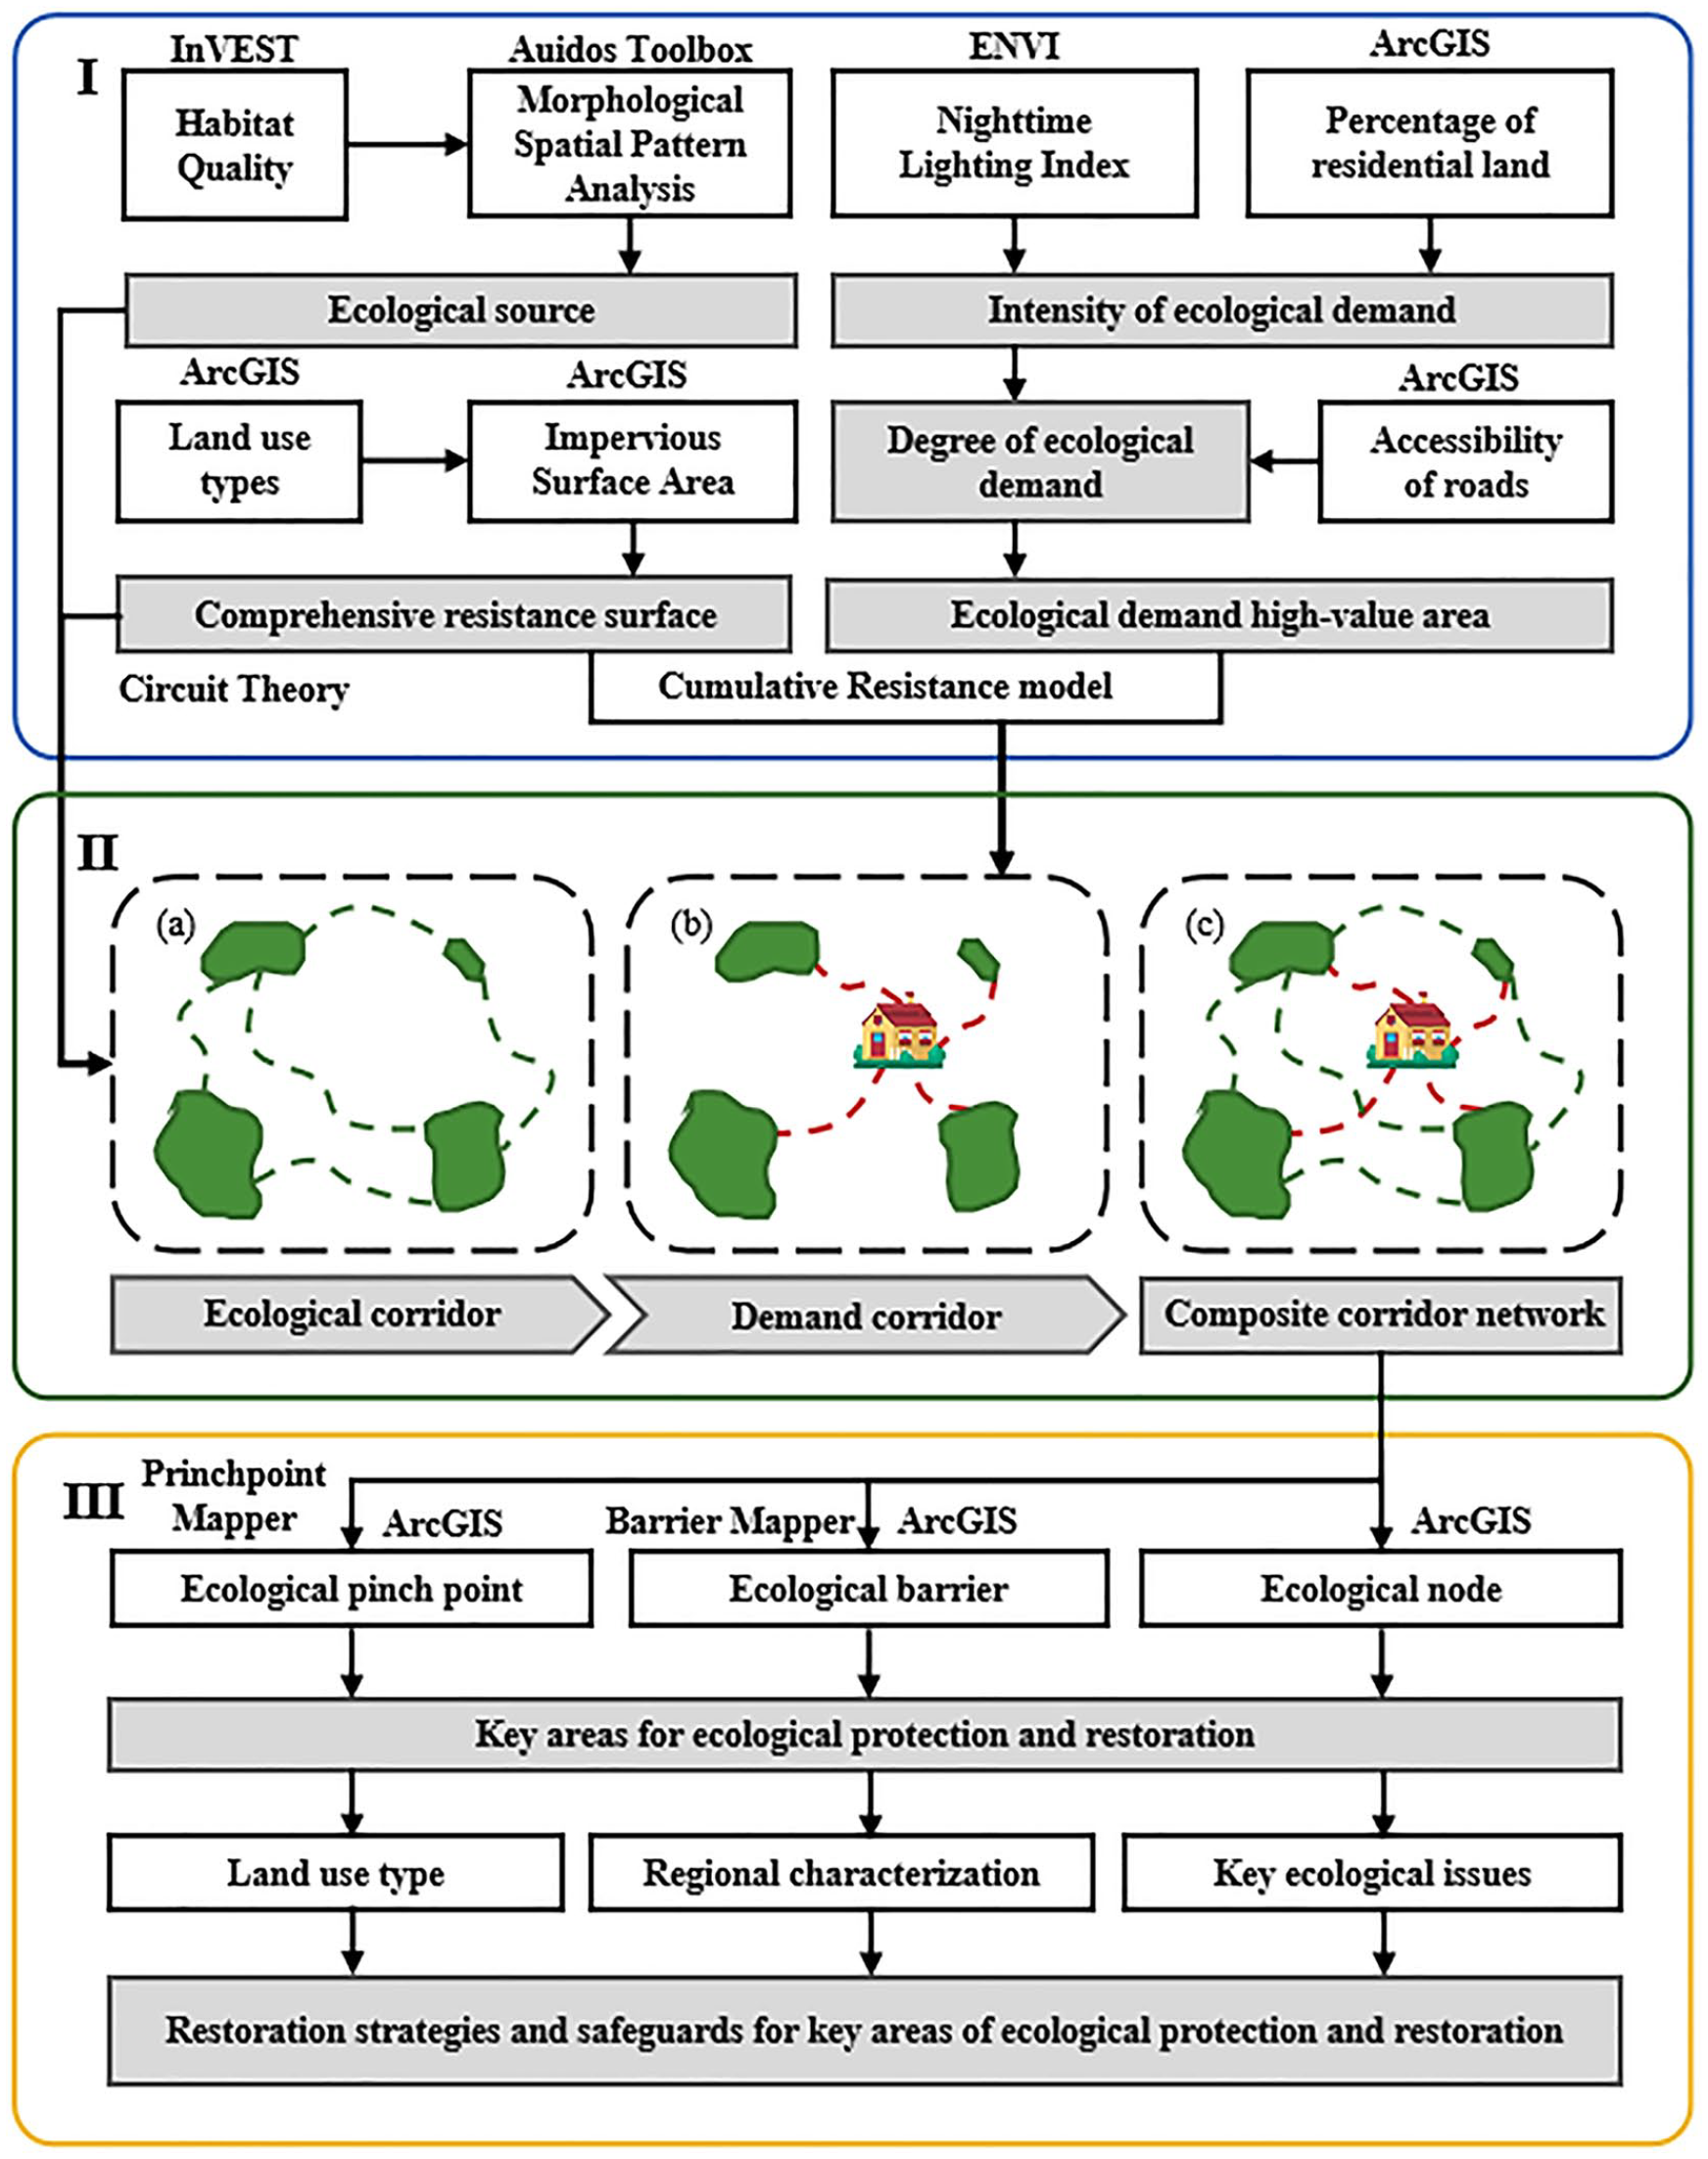
The research framework.
Degree of ecological demand
With societal development, the ecological needs of residents are manifested in an urgent demand for high-quality ecological recreational areas and ecological service lands. Satisfying residents' demands for nearby ecological lands for recreation and short-term outings is the primary way to enhance their sense of ecological access and well-being (Wang et al., 2022a). Regional residents' ecological needs are primarily influenced by the intensity of their ecological demands and the convenience of travel. In regions with denser settlements, higher human activity intensity, and better transportation conditions, ecological needs are higher (Li et al., 2020; Meng et al., 2016). In this study, the ecological demand of regional residents was measured using ecological demand intensity and road accessibility, which were calculated as follows:
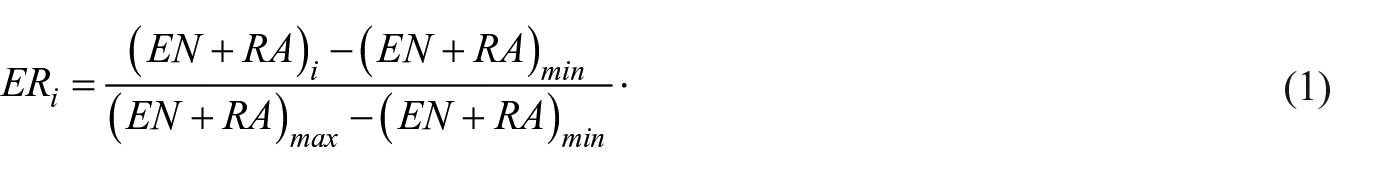
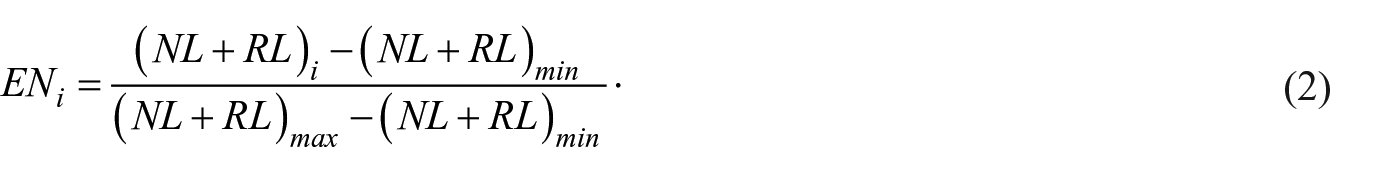
where
Habitat quality
Ecological source areas are regions with significant ecological functions and values that are characterized by high habitat quality and ecological functionality (Meng et al., 2016). The InVEST model is a collaborative modeling system developed by Stanford University, The Nature Conservancy (TNC), and the World Wide Fund for Nature (WWF) (Leh et al., 2013). This modeling system allows the assessment of ecosystem service functions based on land use and land cover data (Sánchez-Canales et al., 2012). The habitat quality index (HQI) of the study area was assessed using the habitat quality module in the InVEST model. The HQI evaluates the ecological environment of a region based on habitat suitability and degradation of regional land-use types, producing values ranging from 0 to 1, where higher values indicate better habitat quality (Yu et al., 2016; Zhang et al., 2020). The calculation formula is as follows:
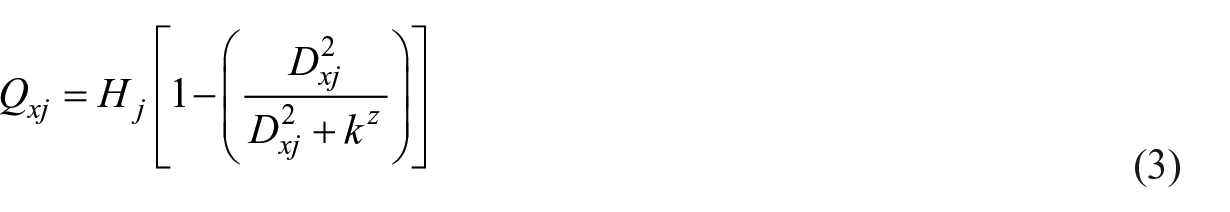
where
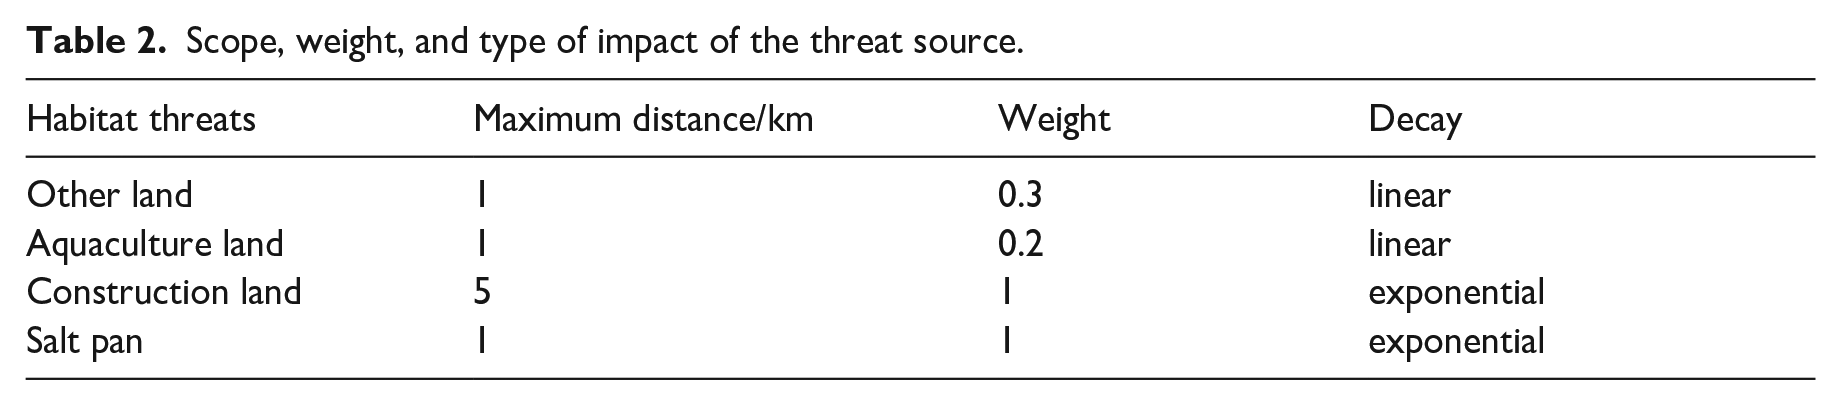
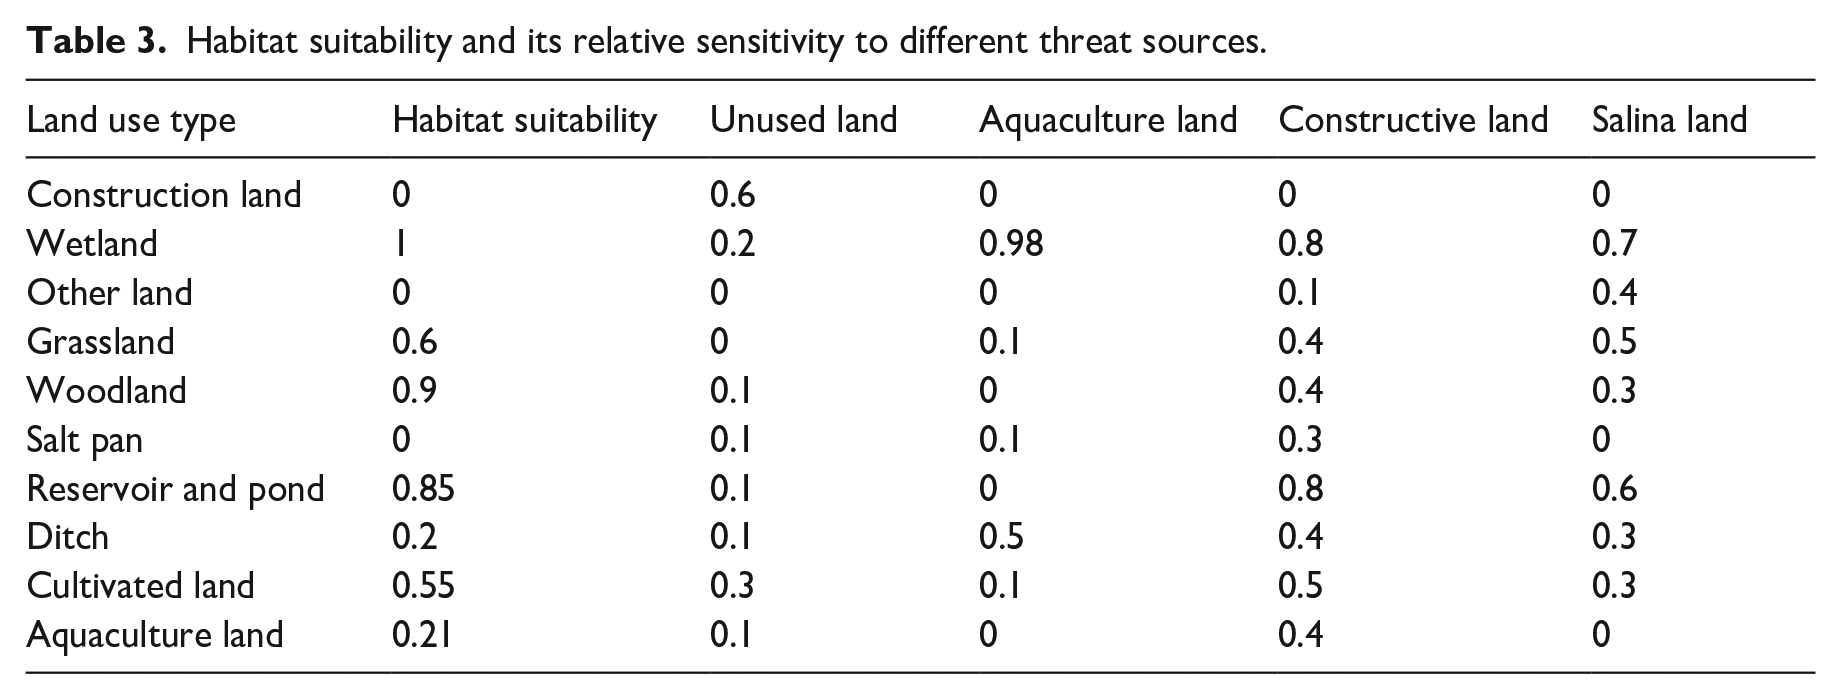
We extracted core patches of areas with high habitat quality as ecological source sites using the habitat quality module of the InVEST model. Tables 2 and 3 list the habitat stressors and parameters identified in previous studies (Hao et al., 2019).
Scope, weight, and type of impact of the threat source.
Habitat suitability and its relative sensitivity to different threat sources.
Morphological spatial pattern analysis
MSPA classifies binarized raster images based on mathematical morphology principles (Soille and Vogt, 2008). This method can be used to classify landscapes efficiently into core areas, isolated islands, edges, perforations, bridges, loops, and branches (Xu et al., 2015). Core areas provide extensive habitats for various species and play vital roles in biodiversity conservation (Wang et al., 2019). MSPA analysis was conducted using Auidos Toolbox software to extract core patches of high habitat quality areas (Soille and Vogt, 2008). In the analysis, the parameters were set as follows: image pixel edge length of 30 m, 4-neighbor algorithm for neighborhood connectivity, patch connectivity distance threshold of 400 m, and connectivity probability of 0.5.
Circuit theory model
Circuit theory models are used in corridor construction by analogizing the processes of species migration or dispersal using electrical circuits in physics (McRae, 2006). The model represents the landscape as a conductive surface and species migration or diffusion as an electric current (McRae et al., 2008). Higher current values indicate better connectivity between ecological sources, leading to more frequent use of the ecological corridor and facilitating its construction. This model is widely used in corridor constructions (Peng et al., 2018b). In this study, we used the Linkage Mapper software to apply circuit theory based on an integrated resistance surface to identify ecological corridors connecting ecological source sites.
Minimum cumulative resistance model
Demand corridors facilitate the movement of ecological flows from ecological resource supplies to the demand areas. The MCR model is a landscape connectivity assessment tool that identifies corridors by calculating least-cost paths between sources and destinations (Chen et al., 2022). Compared to corridors constructed using circuit theory, those constructed using the MCR model are directional and are among the most widely used corridor construction methods (Peng et al., 2018a). In this study, we introduced the MCR model, which allows directional construction of corridors to design demand corridors.
Resistance surface
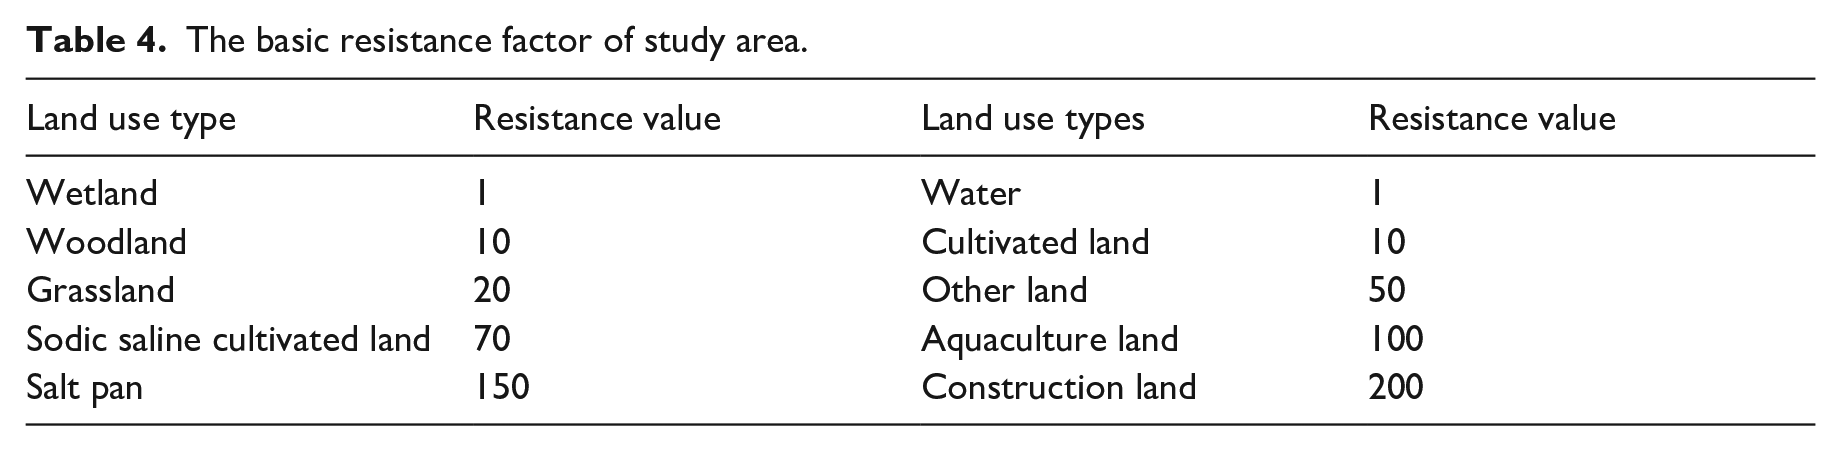
Resistance surfaces were constructed based on land-use types, considering regional ecological background conditions and expert knowledge. Due to severe soil salinization in Huanghua City, we further subdivided the land use types (Table 4) and referred to related studies to determine the resistance values (He et al., 2015). Additionally, we incorporated the impervious surface area (ISA) to adjust the resistance values and derive an integrated resistance surface (Xu and Wang, 2016; Yue et al., 2015). This adjustment compensates for the limitation of assigning resistance values based solely on land-use classes, which would otherwise ignore intra-parcel differences.
The basic resistance factor of study area.
Key areas for ecological protection and restoration
We selected key areas for ecological protection and restoration from the perspective of network optimization. Ecological pinch points are areas with high landscape connectivity and significant ecological protection. These areas are often selected as key ecological flow points because ecological degradation in these regions can jeopardize connectivity between source areas. Therefore, these areas should be prioritized for ecological protection zone designation. In this study, the Pinchpoint Mapper tool was used to identify the ecological pinch points based on the corridor identification results (Yue et al., 2015).
The intersections of the ecological and demand corridors are key areas for facilitating ecological and demand flows. The ecological quality of these intersections is directly linked to the maintenance of regional corridor functions and the enhancement of ecological satisfaction. Therefore, these intersections were recognized as ecological nodes using ArcGIS 10.2 software.
Barrier sites impede the flow of materials and energy, and restoring such areas can significantly improve overall habitat connectivity and ecosystem function. In this study, a barrier mapper tool was used to identify the areas where the greatest recovery of current density would occur after removal, designating them as ecological barrier points.
Results
Ecological source
Watersheds, mudflats, and wetlands are the primary ecological sources in Huanghua City and are predominantly distributed in the western part of the city. Based on the habitat quality assessment results, we excluded areas of small size and scattered distribution, ultimately identifying 32 ecological source sites. These source sites cover a total area of 363.14 km2, which accounts for 15.0% of the total area of Huanghua City (Figure 3). The areas of the ecological source sites varied greatly among the different land-use types. Waters and mudflats accounted for 324.06 km2, or 89.2% of the total source area; forested land covered 12.19 km2, or 3.4%; and grassland, arable land, and construction land accounted for a smaller area, totaling 7.4% (Figure 4a). Due to the extensive distribution of mudflats and wetlands in the western part of Huanghua City, it has become the most significant aggregated area of ecological sources.
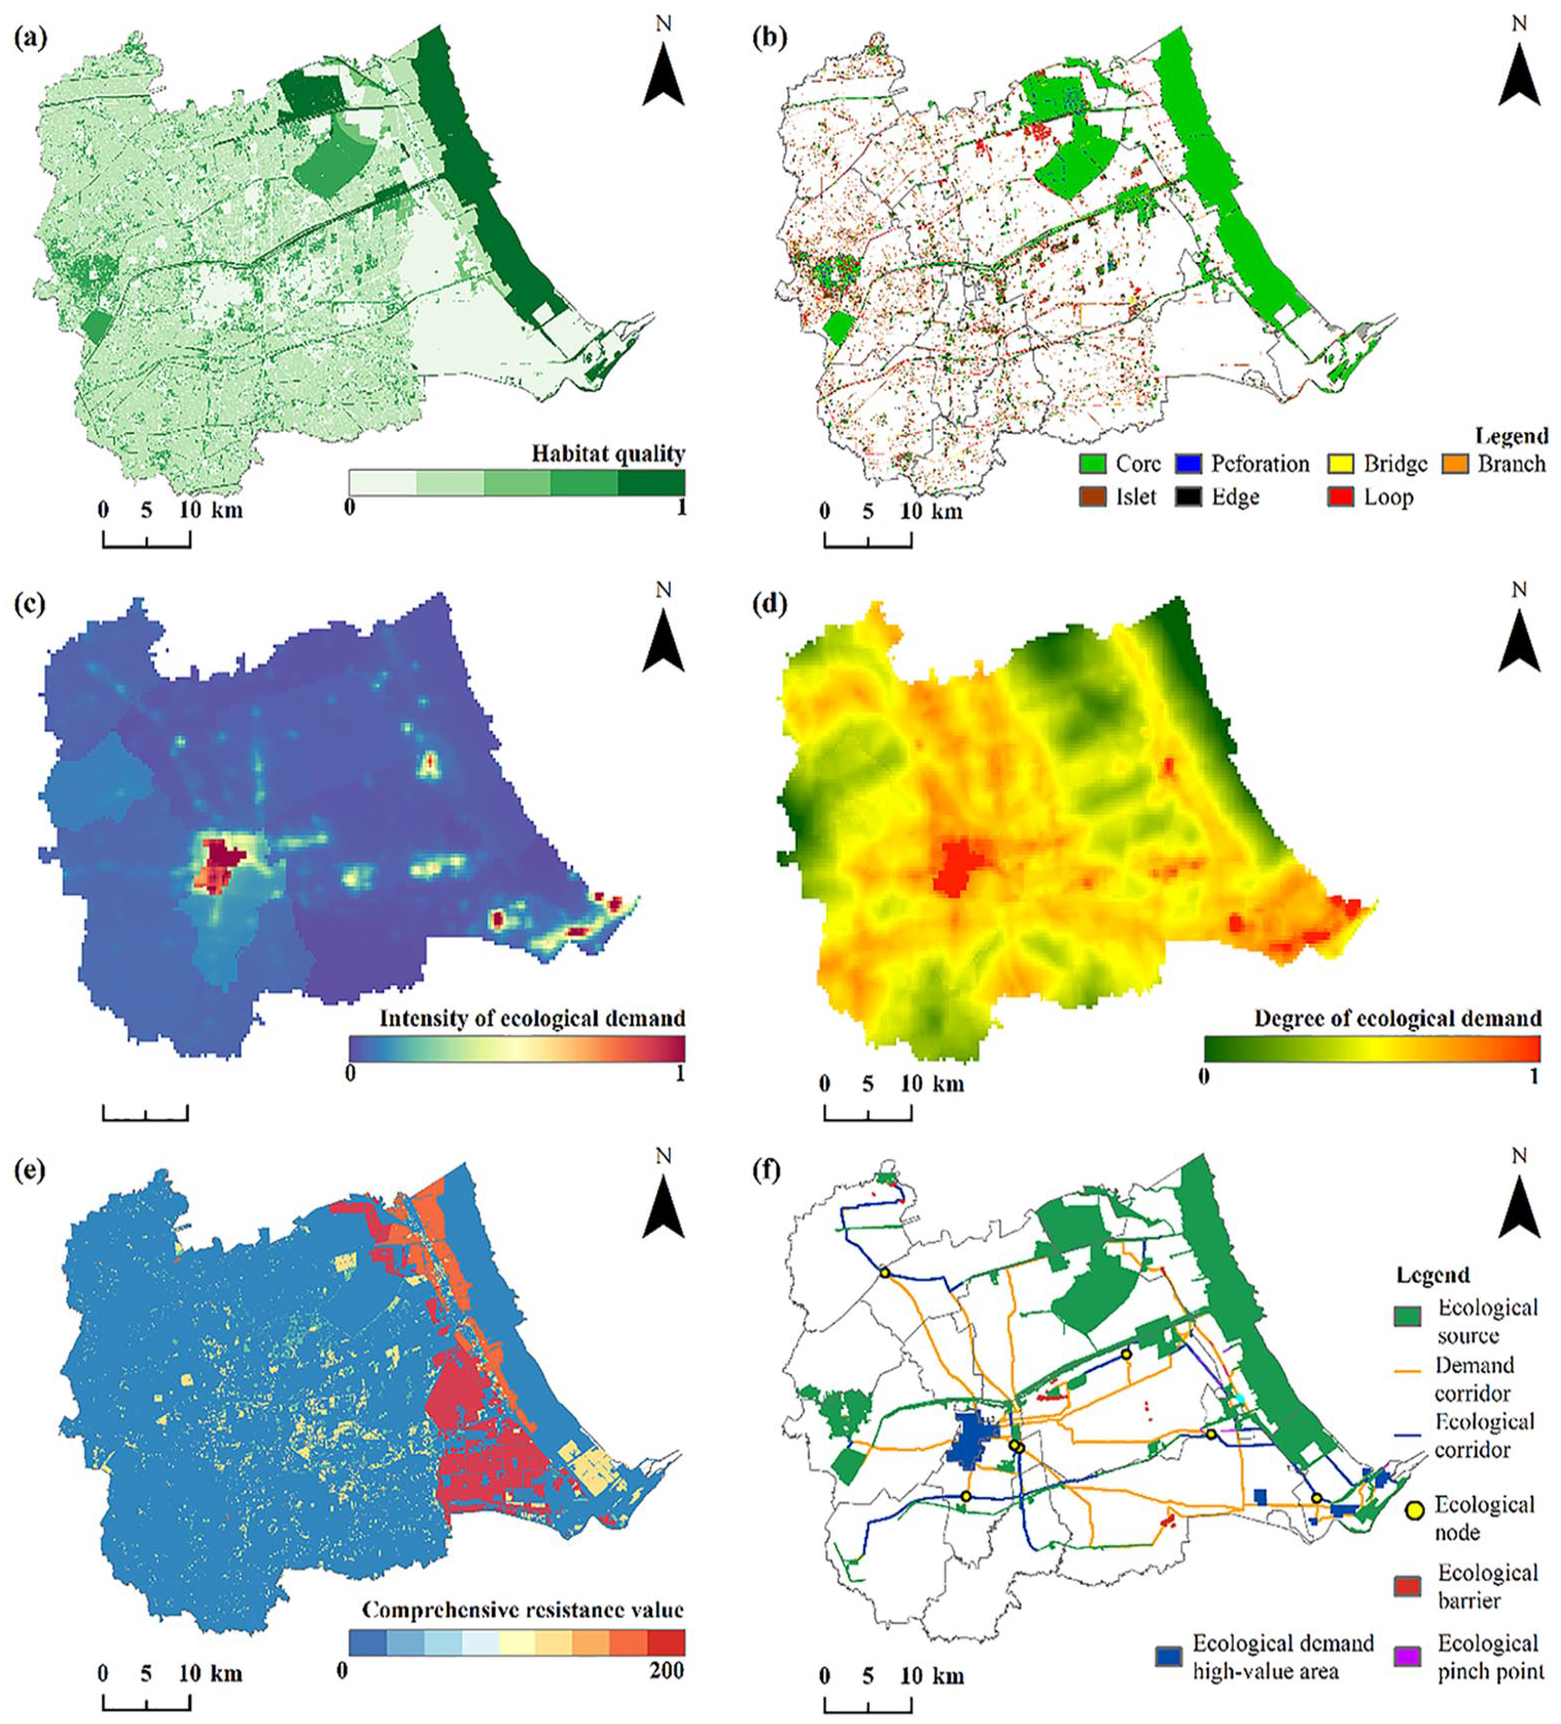
Construction of a composite corridor network and identification of key areas for ecological protection and restoration of territorial space: (a) Habitat quality in Huanghua; (b) MSPA analysis results of high-value habitat quality areas; (c) Ecological demand intensity in Huanghua; (d) Degree of ecological demand in Huanghua; (e) Comprehensive resistance surfaces in Huanghua; (f) Key areas for composite corridor network and ecological protection and restoration of territorial space in Huanghua.
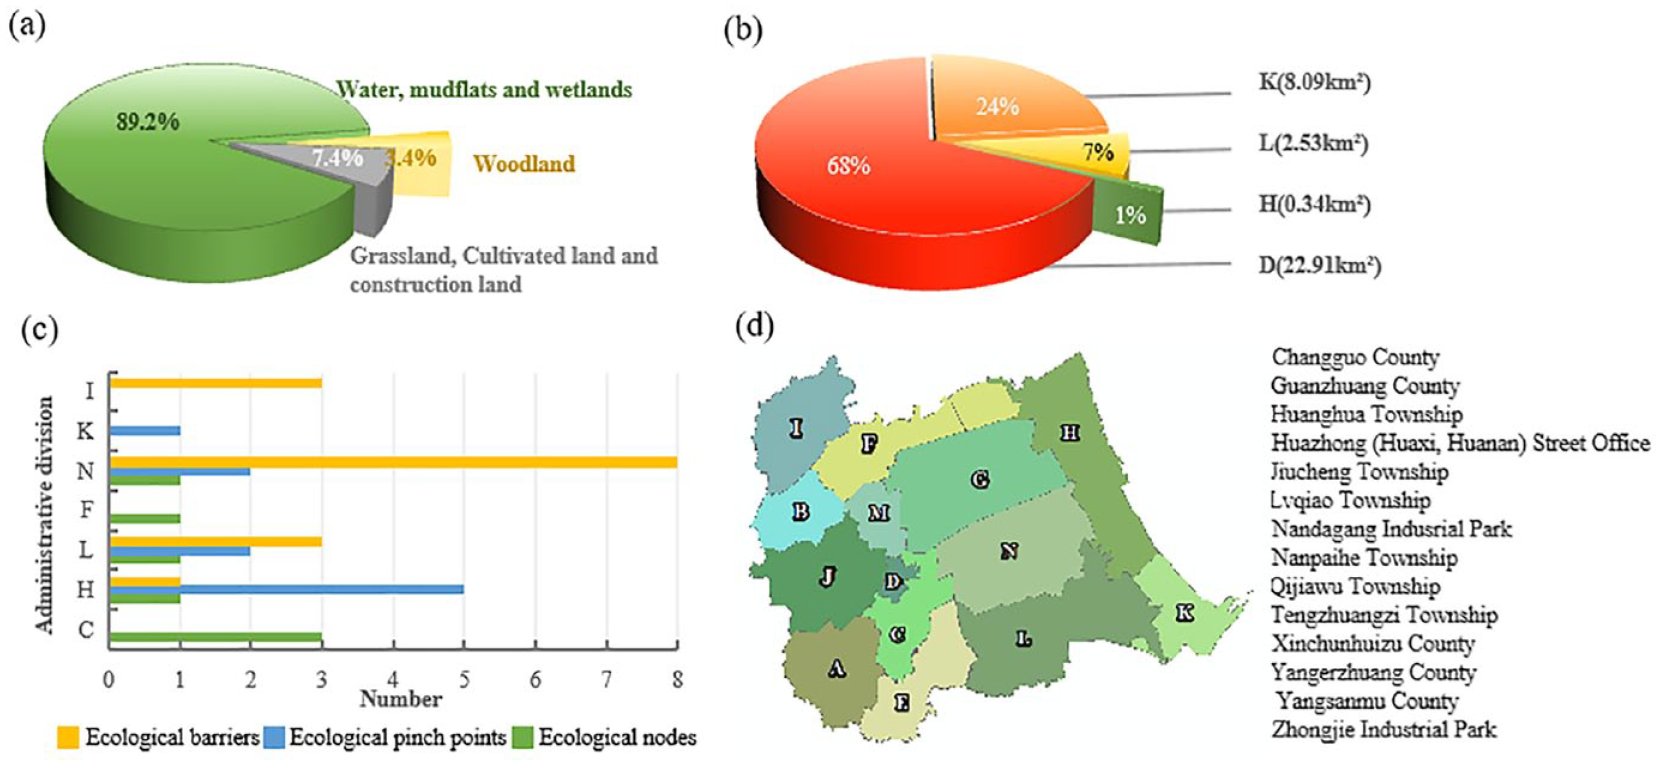
Distribution of ecological source areas, high-value ecological demand areas, and key areas for ecological protection and restoration in Huanghua City: (a) Proportion of each type of ecological source area; (b) Proportion of high-value ecological demand areas in each district and county; (c) Proportion of key areas for ecological protection and restoration per district and county; (d) Administrative divisions of Huanghua City.
Degree of ecological demand
Spatial differences in the degree of ecological demand were evident in Huanghua City, with minimal spatial overlap between the distribution of ecological source areas and areas of high ecological demand. The degree of ecological demand exhibited high values in the central and southeastern parts, low values in the western and northeastern parts, and an uneven distribution among counties and districts (Figure 3d). We employed the natural break method to classify the degree of ecological demand in Huanghua City into five categories by identifying areas with extremely high values as ecological demand areas. Seven ecological demand areas, covering an area of 33.87 km2, were identified and were primarily distributed in the central and southeastern parts of Huanghua City (Figure 3f). The Huazhong (Huaxi, Huanan) Street Office occupies the largest area with 22.91 km2, accounting for 68% of the total area; Xincunhuizu County, Yangerzhuang County, and the ecological needs area within Nanpaihe Township cover 8.09, 2.53, and 0.34 km2, respectively, accounting for 24, 7, and 1%, respectively.
Composite corridor network
The composite corridor network covers a wide area. By superimposing the 15 ecological and 20 demand corridors, we identified 35 composite corridors (Figure 3f) with a total length of 801.9 km. Of this, 207.6 and 594.3 km were ecological and demand corridors, respectively. The ecological corridors were mainly distributed along rivers. In the northwest, the ecological corridor of the Qijiawu Township connects forestland sources in the north to the Beipai River via the Zijiaxin River. The central ecological corridor connects the ecological sources along the South Pai River with other riverine ecological sources such as the Forest Park, Huanglang Pai Drain, and Huangnan Pai Drain.
The demand corridors cover large areas. Nine demand corridors converged in the Street Office demand area (Figure 3f), forming a relatively dense cluster. Eight demand corridors converge in the southeastern demand area (Figure 3f). In addition, three demand corridors converged in the demand area near the mouth of the South Row (Figure 3f).
Identification of key areas for ecological protection and restoration
A total of 32 key areas for ecological protection and restoration were identified, comprising 10 ecological pinch points, seven ecological nodes that require protection, and 15 ecological obstacles that require restoration (Figure 4c).
After excluding fragmented and small areas, we identified 10 ecological pinch points with high ecological flow, covering a total area of 1.08 km2. These were primarily located around the eastern inter-salt field ecological corridor and the northeastern interbuilding site ecological corridor (Figure 3). The areas and percentages of construction land, water bodies, and breeding pits within these pinch points are 0.90 km2 (83.3%), 0.16 km2 (15.8%), and 0.02 km2 (0.9%), respectively. The total areas of these pinch points within Xincunhuizu County, Zhongjie Industrial Park, Nanpaihe Township, and Yangerzhuang County are 0.55, 0.26, 0.15, and 0.12 km2, respectively.
Additionally, we identified seven ecological nodes at the intersections of the ecological and demand flows. The land-use types of these ecological nodes are predominantly construction land, with smaller areas of cultivated land, forest land, and water bodies. Except for Huanghua Town, where the distribution was more concentrated, the nodes were scattered. Huanghua Town has a dense ecological network owing to its large areas of high-value ecological demand and small areas of ecological source land, resulting in shorter distances between ecological nodes.
After excluding fragmented and small areas, we identified 15 barriers to ecological flow, covering a total area of 3.04 km2. These areas are mostly distributed near ecological sources and corridors (Figure 3). The areas and percentages of land use types within these obstacle sites are as follows: cultivated land: 0.96 km2 (31.6%), forest land: 0.89 km2 (29.3%), salinized cultivated land: 0.70 km2 (23.0%), construction land: 0.30 km2 (9.9%), and breeding pits: 0.19 km2 (6.3%). The total areas of obstacle sites in Zhongjie Industrial Park, Yangerzhuang County, Qijiawu Township, and Nanpaihe Township are 1.53, 0.82, 0.53, and 0.19 km2, respectively. Of the 15 key restoration areas, 11 have an area of less than 0.2 km2 each, making them less challenging to restore. Upon completion of restoration, the overall ecological connectivity of the region significantly improved.
Regional ecological restoration strategies
Measures to protect and rehabilitate key areas
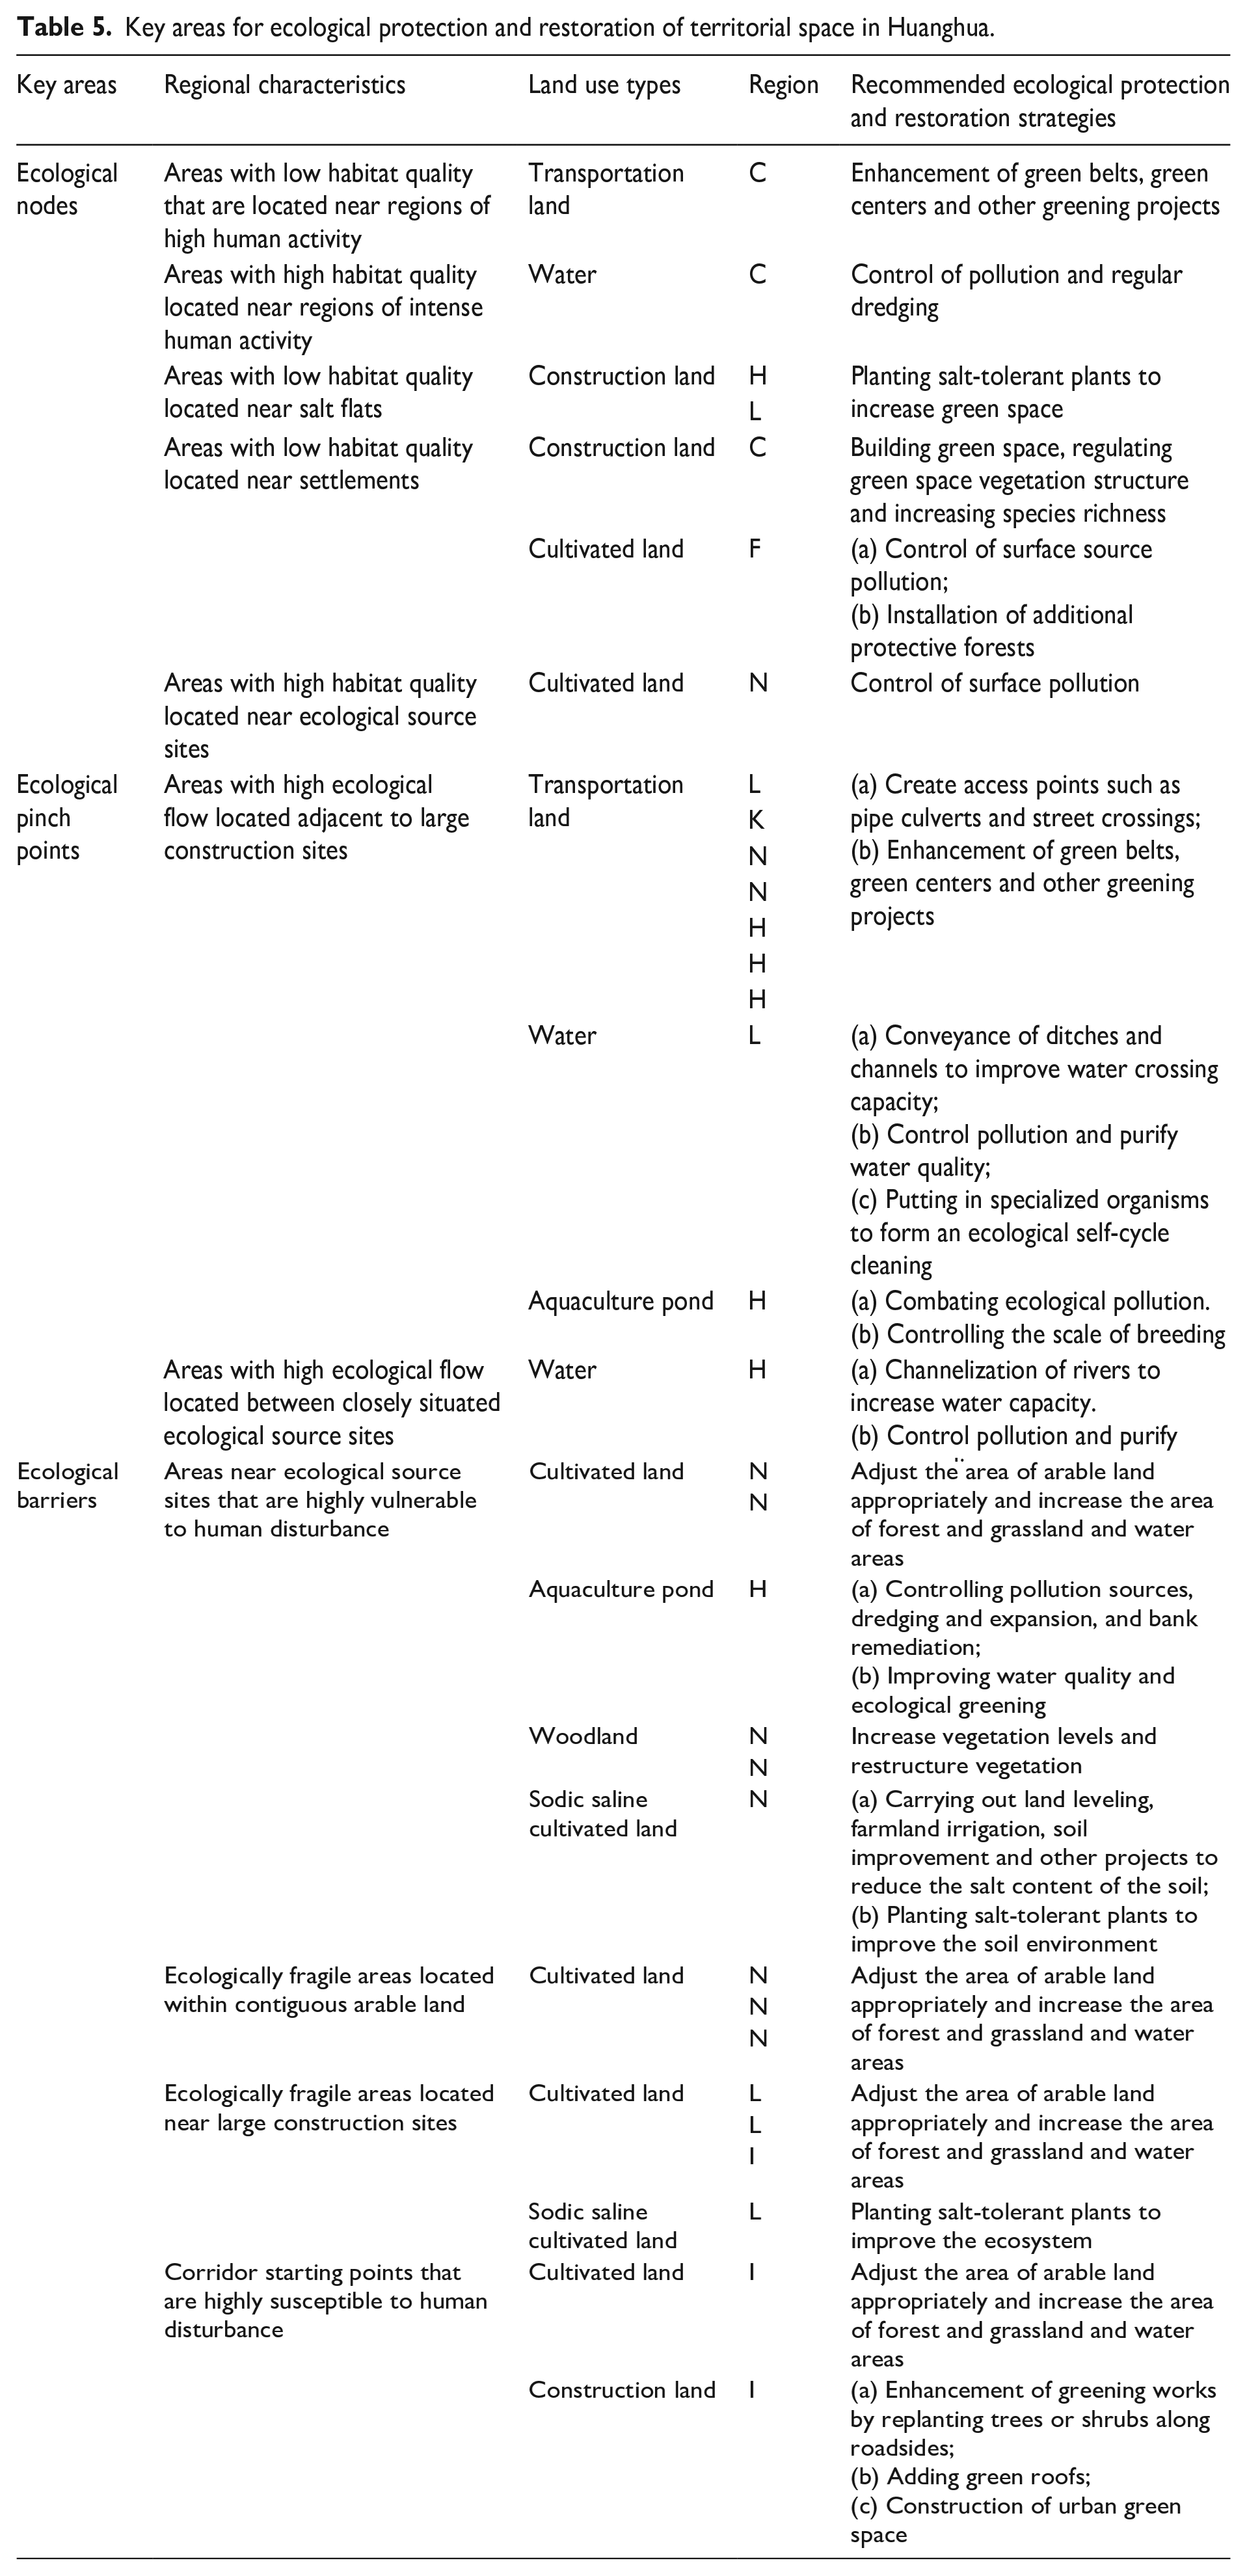
Ecological protection and restoration efforts should focus on current land-use conditions, key ecological issues, and functional centers of gravity within key areas. Different areas have distinct characteristics and therefore require targeted protection and restoration measures. Key areas identified through ecological network construction should be considered when formulating protection and restoration measures to optimize network function. By identifying the land-use types of key areas and their roles within the ecological network, we proposed protection measures for ecological pinch points, nodes, and obstacles (Table 5).
Key areas for ecological protection and restoration of territorial space in Huanghua.
Regional ecological restoration strategies and safeguards
In addition to targeted protection and restoration efforts in key areas, formulating reasonable strategies and safeguards to improve the overall ecological quality of the region and enhancing the residents' sense of ecological accessibility is crucial for achieving sustainable development. This study proposes the following recommendations.
Discussion
Identification of key areas for ecological protection and restoration based on a composite corridor network
The method proposed in this study for identifying key areas for ecological protection and restoration using a composite corridor network enhances the connection between human society and the natural environment. As researchers and governments increasingly focus on satisfying residents' ecological needs, identifying key areas for ecological protection and restoration solely from an ecological perspective is no longer sufficient for socio-ecological system development. Therefore, the incorporation of human ecological needs into the identification of key areas has become a prevailing research trend.
Although some studies have explored ecological networks that promote regional socio-ecological synergistic development from a ‘supply-flow-demand’ perspective to increase the spatial connectivity between residents' well-being and ecological sources (Hu and Chen, 2021; Wang et al., 2022a; Wu et al., 2020), their application in identifying key areas for ecological protection and restoration, as well as in formulating ecological restoration strategies, remains limited. Huang and colleagues introduced the concept of ecological demand earlier in the identification of key areas, and the ecological demand assessment in this study targeted ecological land, neglecting the spatial connections between residents and ecological land (Huang et al., 2019). Hu and Chen identified key nodes for protection and restoration within a network based on the supply and demand of ecosystem service flows. However, their analysis only considered the impact of human activities on ecological environmental protection (Hu and Chen, 2021). Wang et al. constructed landscape ecological safety maintenance corridors and ecosystem service proximity corridors based on ecosystem service supply and demand assessments and identified key areas for ecological protection and restoration from the perspective of network optimization (Wang et al., 2022a). In comparison, this study considered the interaction between ecological networks and demand networks in identifying key areas and identified the intersections between the two types of corridors as key areas. The intersections between the ecological and demand corridors should be included in key ecological protection and restoration areas because of their role in promoting ecological flow and fulfilling residents' ecological needs.
Compared to the method of solely constructing an ecological network connecting ecological sources, the composite network proposed in this study adds 594.30 km of demand corridors, accounting for 74.1% of the total corridor length. Compared with the method of identifying areas with high ecological flow and high ecological flow resistance as key areas for protection and restoration, we identified seven additional key ecological areas by superimposing the composite network, representing 21.88% of the total number. This framework offers a viable approach for meeting residents' ecological needs while ensuring ecological protection and restoration.
Limitations and further research
This study had several limitations. First, it did not assess the restoration timeline, costs, or effectiveness in key areas. Future research should prioritize the protection and restoration of key areas by evaluating restoration effectiveness and considering the multifactorial interplay between restoration costs to achieve more efficient ecological protection and restoration. Additionally, owing to data acquisition constraints, this study did not refine the ecological needs of residents. Future studies could employ questionnaires to address this gap, thereby better incorporating residents' needs and preferences into the designation of key areas for ecological protection and restoration.
Conclusions
This study presents a framework for integrating ecological needs into the identification of key areas for ecological protection and restoration and examines strategies to enhance residents' sense of ecological accessibility while protecting and restoring ecosystems. We identified ecological source areas through habitat quality evaluation and morphological spatial pattern analysis and assessed ecological needs by combining indicators such as road accessibility, human activity intensity, and settlement density. Furthermore, by constructing a composite corridor network, we identified key areas for ecological protection and restoration and proposed corresponding management measures. The main conclusions are as follows.
(a) A composite corridor network totaling 801.9 km was constructed, 32 key areas for ecological protection and restoration were identified, and corresponding protection and restoration measures were proposed.
(b) In addition to protecting and restoring key areas, Huanghua City should safeguard core ecological sources, enhance the construction of parks and green spaces, and improve the connectivity of the water network to enhance residents' sense of ecological accessibility.
(c) The identification of key areas for ecological protection and restoration based on a composite network offers insights into enhancing resident well-being through ecological protection and restoration.
Footnotes
Author Contributions
Y.P.: Software, Formal analysis, Writing-Original Draft, Visualization, Writing- Reviewing and Editing. M,X.: Conceptualization, Validation, Resources, Supervision. C.Z.: Data curation, Software.
Y. L.: Data curation, Software.
Data availability
The original contributions presented in the study are included in the article, further inquiries can be directed to the corresponding author.
Declaration of conflicting interests
The author(s) declared no potential conflicts of interest with respect to the research, authorship, and/or publication of this article.
Funding
The author(s) disclosed receipt of the following financial support for the research, authorship, and/or publication of this article: This article was supported by the National Natural Science Foundation of China [grant number 41771204].