
Abstract
Urbanization has increasingly disrupted natural ecosystems, leading to various environmental problems and slowing sustainable economic and social development. Ecological restoration zoning is key to efficient restoration efforts and helps balance economic growth with ecological protection. This study develops an ecological risk evaluation system, constructs an ecological security pattern, and identifies urban construction space to guide the ecological restoration zoning of Jiaozuo City. The goal is to create a scientific and practical zoning program. The findings are as follows: (1) Ecological risk in the study area is characterized by a distribution of ‘low risk in the northern mountains and southern mudflats and high risk in the central plains’, whereas ecological resilience is characterized by ‘high risk in the northern mountains and southern mudflats and low risk in the central plains’. (2) The construction of the ecological security pattern led to the identification of 57 ecological source areas, 164 ecological corridors, 254 ecological pinch points, and 36 ecological barrier points. (3) This study divides the area into five ecological restoration zones: key protection, priority restoration, general management, moderate utilization, and urban ecological restoration zones. Each zone requires specific restoration strategies for efficient ecological recovery. This study provides a foundation for ecological protection, spatial planning, and green development in Jiaozuo City. This study also provides a new perspective and framework for ecological restoration zoning research.
Keywords
Introduction
With the rapid advancement of urbanization, the impact of human activities on natural ecological spaces has become increasingly significant. This has led to a series of ecological and environmental challenges (López-Sánchez et al., 2024). Additionally, the decline in the supply capacity and resilience of regional ecosystem services (Storry et al., 2013), restricts the sustainable use of natural resources and hinders sustainable economic and social development. There is a growing global consensus on the need to integrate urban construction with ecological protection, striving for orderly development and efficient utilization of territorial space (Chen and Yao, 2023). Therefore, scientifically outlining ecological restoration zones (Strassburg et al., 2020), accurately identifying key restoration spaces (Chen et al., 2019; Ma et al., 2019), and formulating targeted ecological restoration strategies and measures (Song et al., 2019) are essential. This holistic and systemic approach aims to promote the overall protection and synergistic management of both natural and social ecosystems.
The concept of ecological restoration zoning is rooted in ecological regionalization. In 1976, Bailey (Bailey, 1976) combined natural vegetation types with regional climate information to develop a hierarchical system of ecological regions in the United States, establishing a crucial foundation for the detailed delineation of ecological regionalization (McMahon et al., 2001). The release of the Global Terrestrial Ecological Regionalization Programme provided essential guidance and a basis for flourishing research in ecological zoning (Geldmann et al., 2014). Despite its growing importance, there is no standardized definition of ecological restoration zoning. We define it as a process that involves qualitative and quantitative analysis, leveraging spatial data, and focusing on addressing ecological challenges and enhancing ecological benefits. It aims to identify key ecological spaces, thereby delineating critical areas for ecological protection and restoration (Chen et al., 2006). Current research on ecological restoration zoning can be categorized into four primary types. The first category is problem oriented and focuses on specific ecological issues. This type typically selects a single ecosystem element or functional indicator as its basis (Li et al., 2023). Examples include mine rehabilitation ecological zoning (Li, 2022), vegetation restoration zoning (Jia et al., 2018), marine protected area zoning (Li et al., 2014), and the ecological zoning of typical watersheds on the Loess Plateau (Zhou et al., 2019). The second category includes research paradigms centered on ecological security patterns based on the ‘ecological source - resistance surface - ecological corridor’ framework. In this approach, ecological nodes are identified as key areas that require protection and restoration (Jiang et al., 2022; Zhang et al., 2024b). The third category involves partitioning based on the supply and demand of ecosystem services, treating these two aspects as independent variables (Liu et al., 2020b; Wang et al., 2024) while considering their interrelationships. Finally, the fourth category employs an indicator system evaluation method for determining ecological restoration zoning. Examples include zoning on the basis of ecological risk or resilience (Ji et al., 2024; Li et al., 2024a) and zoning on the basis of ecosystem health assessments (Lv et al., 2023). Previous studies have primarily focused on a single restoration goal (Ni et al., 2020), with limited consideration of an ecosystem’s ability to maintain or restore its original state, structural changes, and the potential pressures from human activities (Chen et al., 2024a). However, ecological restoration should be characterized as holistic, systematic, and comprehensive (Chen et al., 2024c) to better address complex ecological issues. Overall, the limitations of existing zoning approaches for ecological restoration highlight the urgent need for a more integrated and comprehensive approach (Yao et al., 2024).
Ecological restoration zoning, guided by various ecosystem evaluation indicators, plays a crucial role in ecological protection and restoration initiatives (Xu et al., 2020). This includes assessments of ecological risk and ecological resilience. Ecological risk pertains to the potential pressures faced by an ecosystem and its components, including the likelihood and severity of future losses (Hunsaker et al., 1990; Lipton et al., 1993). It emphasizes how external stressors affect landscape composition, structure, function, and processes within a given region (Liu et al., 2020a). Historically, ecological risk assessments have focused primarily on the evaluation of biological or chemical substances (Wang et al., 2008). The evaluation scales used in studies range from the national level (Shi et al., 2022) to the regional and watershed levels (Yang et al., 2024) and down to the urban scale (Huang et al., 2024). Ecological resilience refers to an ecosystem's ability to withstand external disturbances and regulate itself (Arani et al., 2021; Baho et al., 2017), reflecting its capacity to maintain balance and buffer impacts (Liu et al., 2019). Holling (1973) first introduced the concept of resilience to ecology in 1973, defining it as ‘the ability of a system to digest disturbances, reorganize in response to change, and basically ensure the normal functioning, structure, characteristics, and feedback effects of the system’. Today, ecological resilience is considered a key attribute of social-ecological systems (Cumming et al., 2005). Ecological risk reflects ecological problems, while ecological resilience reflects ecosystem health and sustainability. Therefore, we combine the two to analyze the vulnerability and self-repair capacity of ecosystems in the region, with the aim of scientifically delineating ecological restoration zones.
The ecological security pattern (ESP) plays a vital role in safeguarding regional ecological security by protecting essential landscape elements necessary for sustaining the health and safety of ecological processes, thus establishing a network structure (Tarabon et al., 2020). Currently, ESP is widely applied in fields such as biodiversity conservation, spatial planning, and protection and restoration (Bai and Weng, 2023; Shi et al., 2020). Through exploration and practical application, the construction of the ecological security pattern has gradually developed into a foundational research paradigm (Kong et al., 2010; Wei et al., 2022a) , which consists of the following stages: ‘Selection of Ecological Sources - Construction of Ecological Resistance Surfaces - Extraction of Ecological Corridors - Identification of Ecological Nodes’. Ecological sources are landscape patches essential for maintaining regional ecological security (Li et al., 2022); they serve as crucial points for species dispersal, ecological function flow, and propagation. Ecological corridors connect isolated patches of critical habitat, enabling the sustained flow of materials and energy (Yu, 1996), and serve as migratory routes for species (Santos et al., 2018). Ecological nodes are key locations within the landscape matrix that facilitate the movement and diffusion of organisms (Li et al., 2021a). The ecological security pattern, as a holistic planning measure, highlights the importance of safeguarding key areas. Consequently, integrating the ecological security pattern into ecological restoration zoning is essential for clarifying the primary tasks involved in ecological protection and restoration to create a comprehensive ecological network. Ecological protection and restoration require a combination of holistic protection and localized restoration (Jiang et al., 2022). As a comprehensive planning measure, the ecological security pattern contributes to realizing overall ecological benefits (Luo et al., 2021). Therefore, we identify localized protection areas through in-depth analysis of ecological risks and ecosystem resilience, incorporating ecological security pattern research to strengthen overall protection, and constructing ecological restoration zones by considering the impact of human activities in relation to urban construction space.
Jiaozuo City is a critical component of the ecological security of the Yellow River Basin and a key area for ensuring water conservation and ecological function restoration of the Yellow River. However, the rapid economic development of Jiaozuo, including the over-exploitation of coal mines and other resources, has resulted in environmental issues such as soil erosion and ecosystem degradation. Balancing economic and social development with ecological protection is a fundamental challenge that must be addressed. Therefore, this study takes Jiaozuo City as a case to explore an ecological restoration zoning program with targeted restoration strategies. The objectives of this study are: (1) conduct a comprehensive analysis of the ecological status of Jiaozuo City and establish ecological restoration zones; (2) revise the preliminary ecological restoration zoning based on ecological security patterns and the spatial identification of urban development; (3) propose differentiated restoration strategies for each zone. This study provides a scientific basis for ecological protection and green socio-economic development in Jiaozuo City, contributing to the ecological security barrier in the Yellow River Basin. It also offers a novel perspective and framework for ecological restoration zoning research.
Materials and methods
Overview of the study area
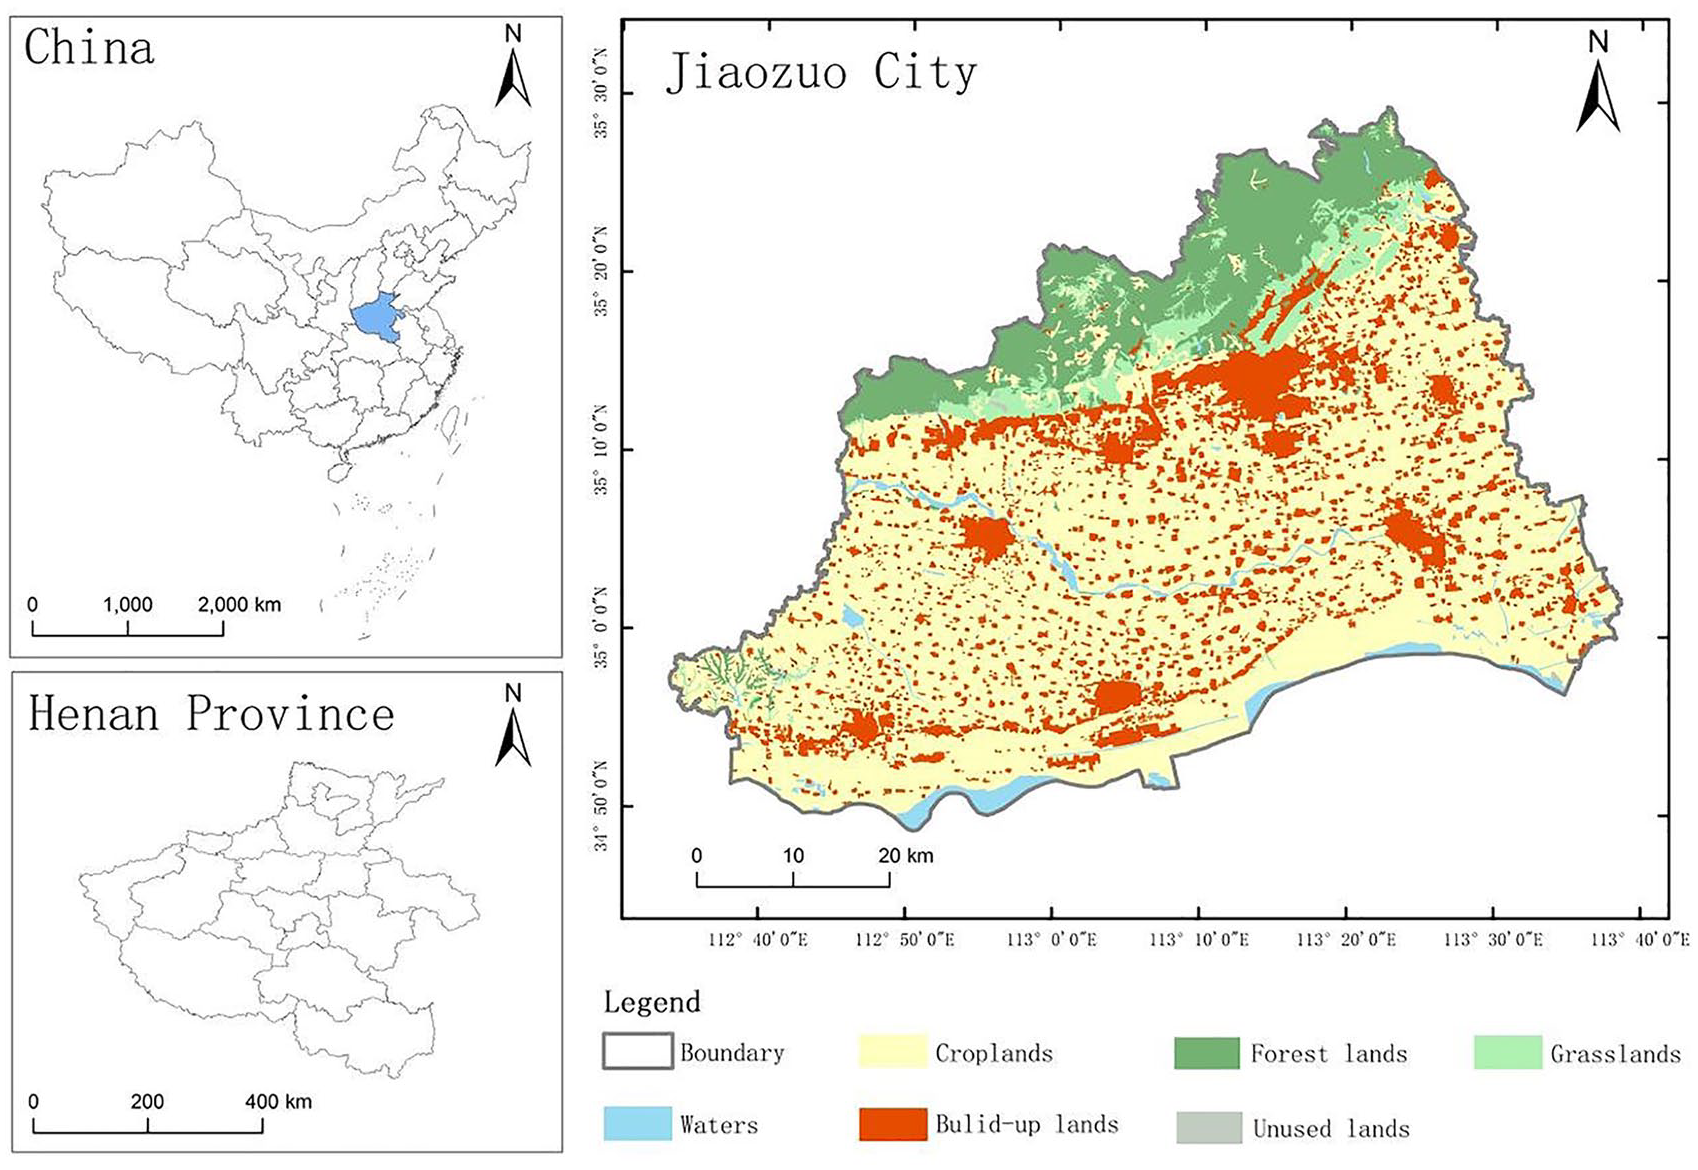
Jiaozuo City is located in the northwestern part of Henan Province and is defined by eastern longitudes of 112°43′31″ to 113°38′35″ and northern latitudes of 34°49′03″ to 35°29′45″. The city comprises five districts, four counties, and two county-level cities, covering a total area of 3,972.61 km2 (Figure 1). The region's topography primarily features plains and mountains, with an elevation gradient that slopes gradually from northwest to southeast and flattens from north to south. As of the end of 2022, the city's resident population was 3,523,500, with an urbanization rate of 64.35%. Jiaozuo City, located in the Yellow River Basin, is one of China’s first resource-exhausted cities. It has long been affected by the over-exploitation of coal resources and industrial restructuring, facing dual pressures of economic transformation and ecological restoration, which threaten its ecological security and regional sustainable development. The implementation of ecological restoration zoning within this study not only aims to improve the ecological environment quality of the Yellow River Basin and provide crucial ecological security for northern Henan and the Central Plains urban agglomeration, but also offers scientific support and serves as a reference model for policy formulation and management practices in resource-depleted cities.
Overview of the study area.
Data sources and processing
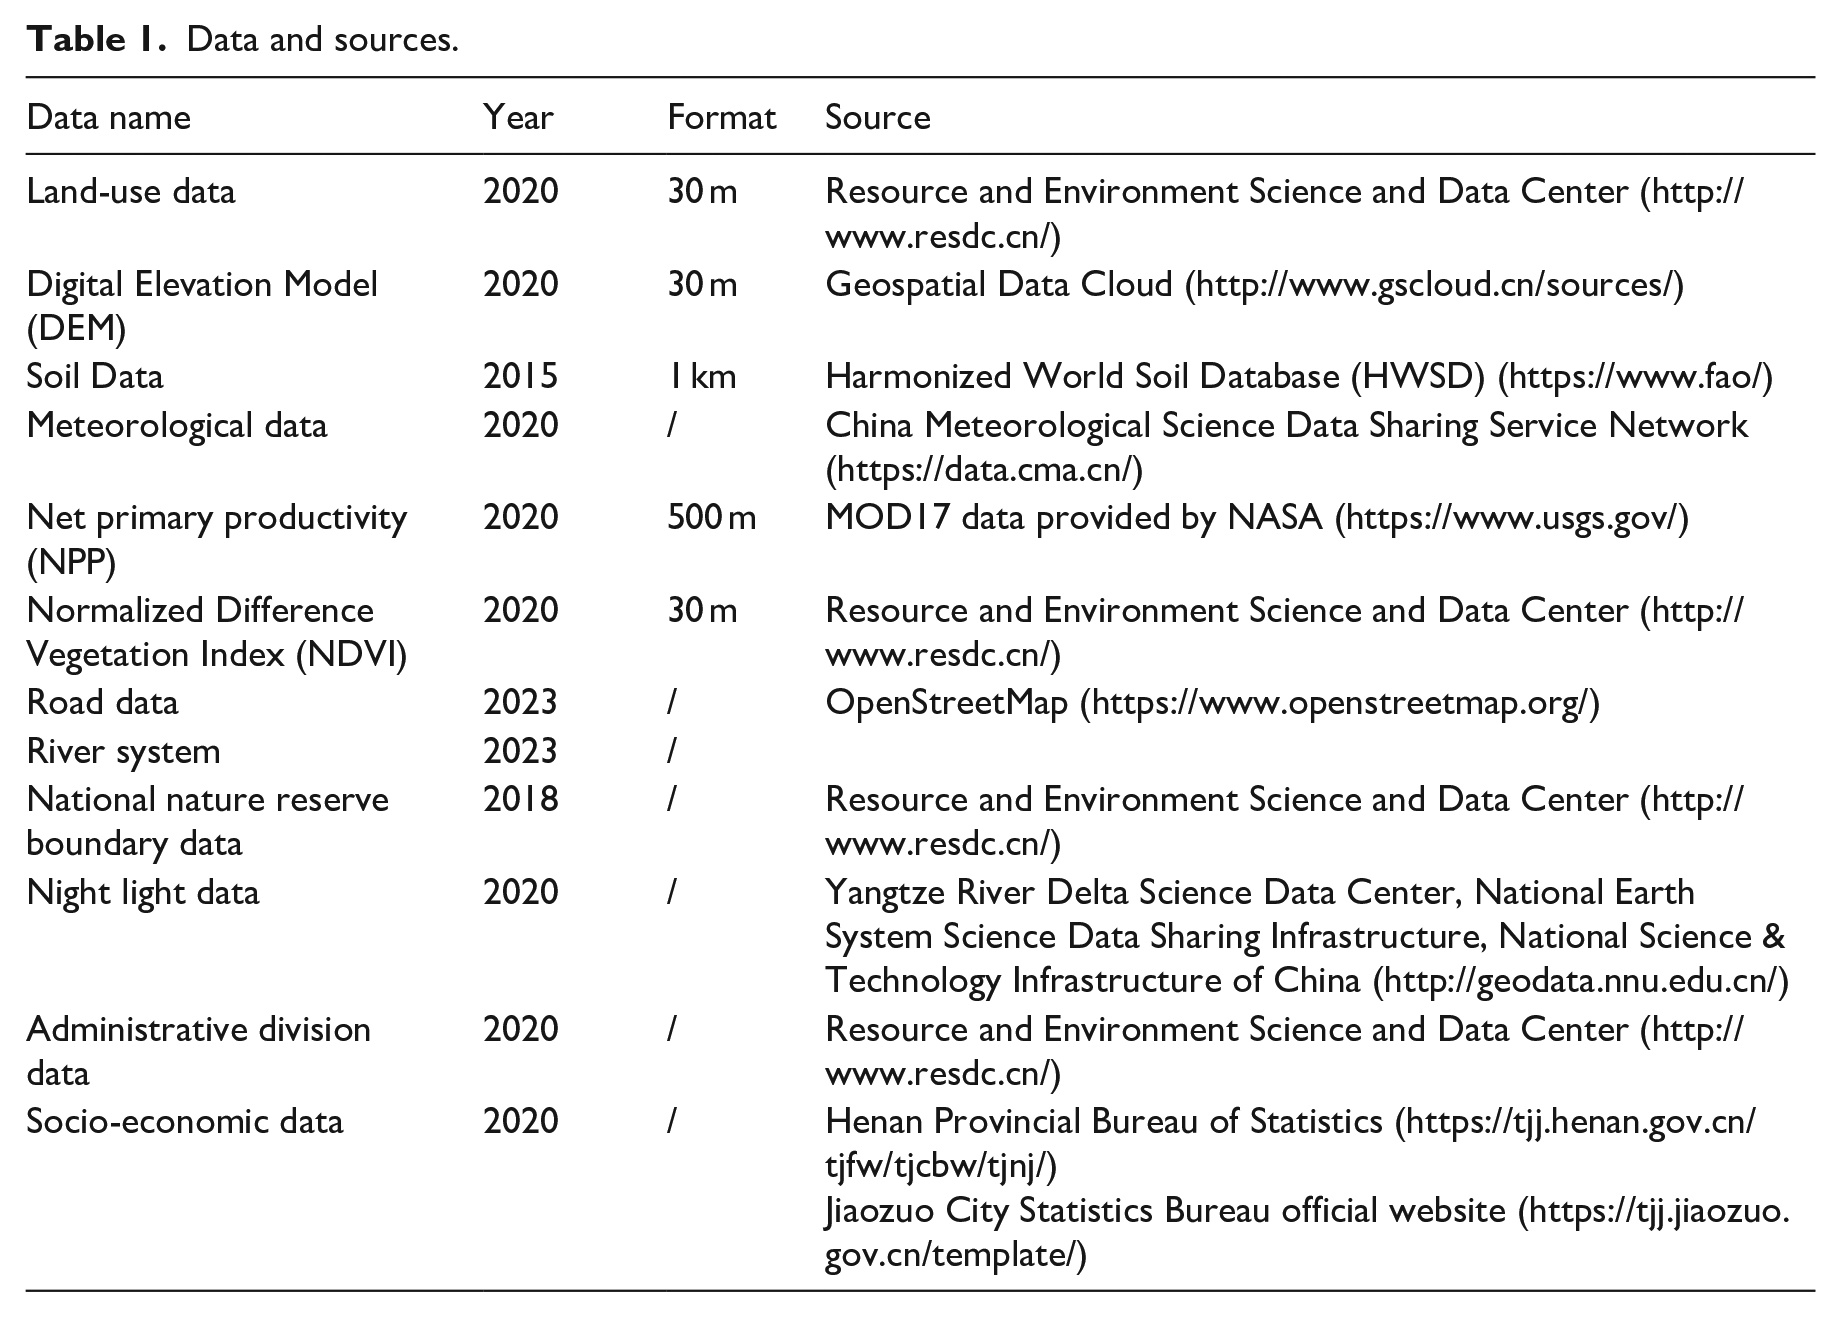
The foundational data utilized in this study include land use data, digital elevation model (DEM) data, soil data, vegetation data, meteorological data, road infrastructure data, river system data, and various socio-economic datasets. The land use data include six primary categories and 25 secondary types, with the primary categories including cropland, forestland, grassland, watersheds, construction land, and unused land. The kriging interpolation method was employed to interpolate daily values from meteorological stations in Henan Province for the year 2020, thereby generating meteorological data such as rainfall and air temperature for the study area. Using the normalized vegetation index (NDVI), the image element binary model was applied to derive the fractional vegetation cover (FVC) within the study area. To facilitate overlay analysis, all the aforementioned spatial data coordinates and projection information were standardized to the CGCS_2000_3_Degree_GK_Zone_38 format, and all the raster data were resampled to a resolution of 30 × 30 meters (Table 1).
Data and sources.
Research framework
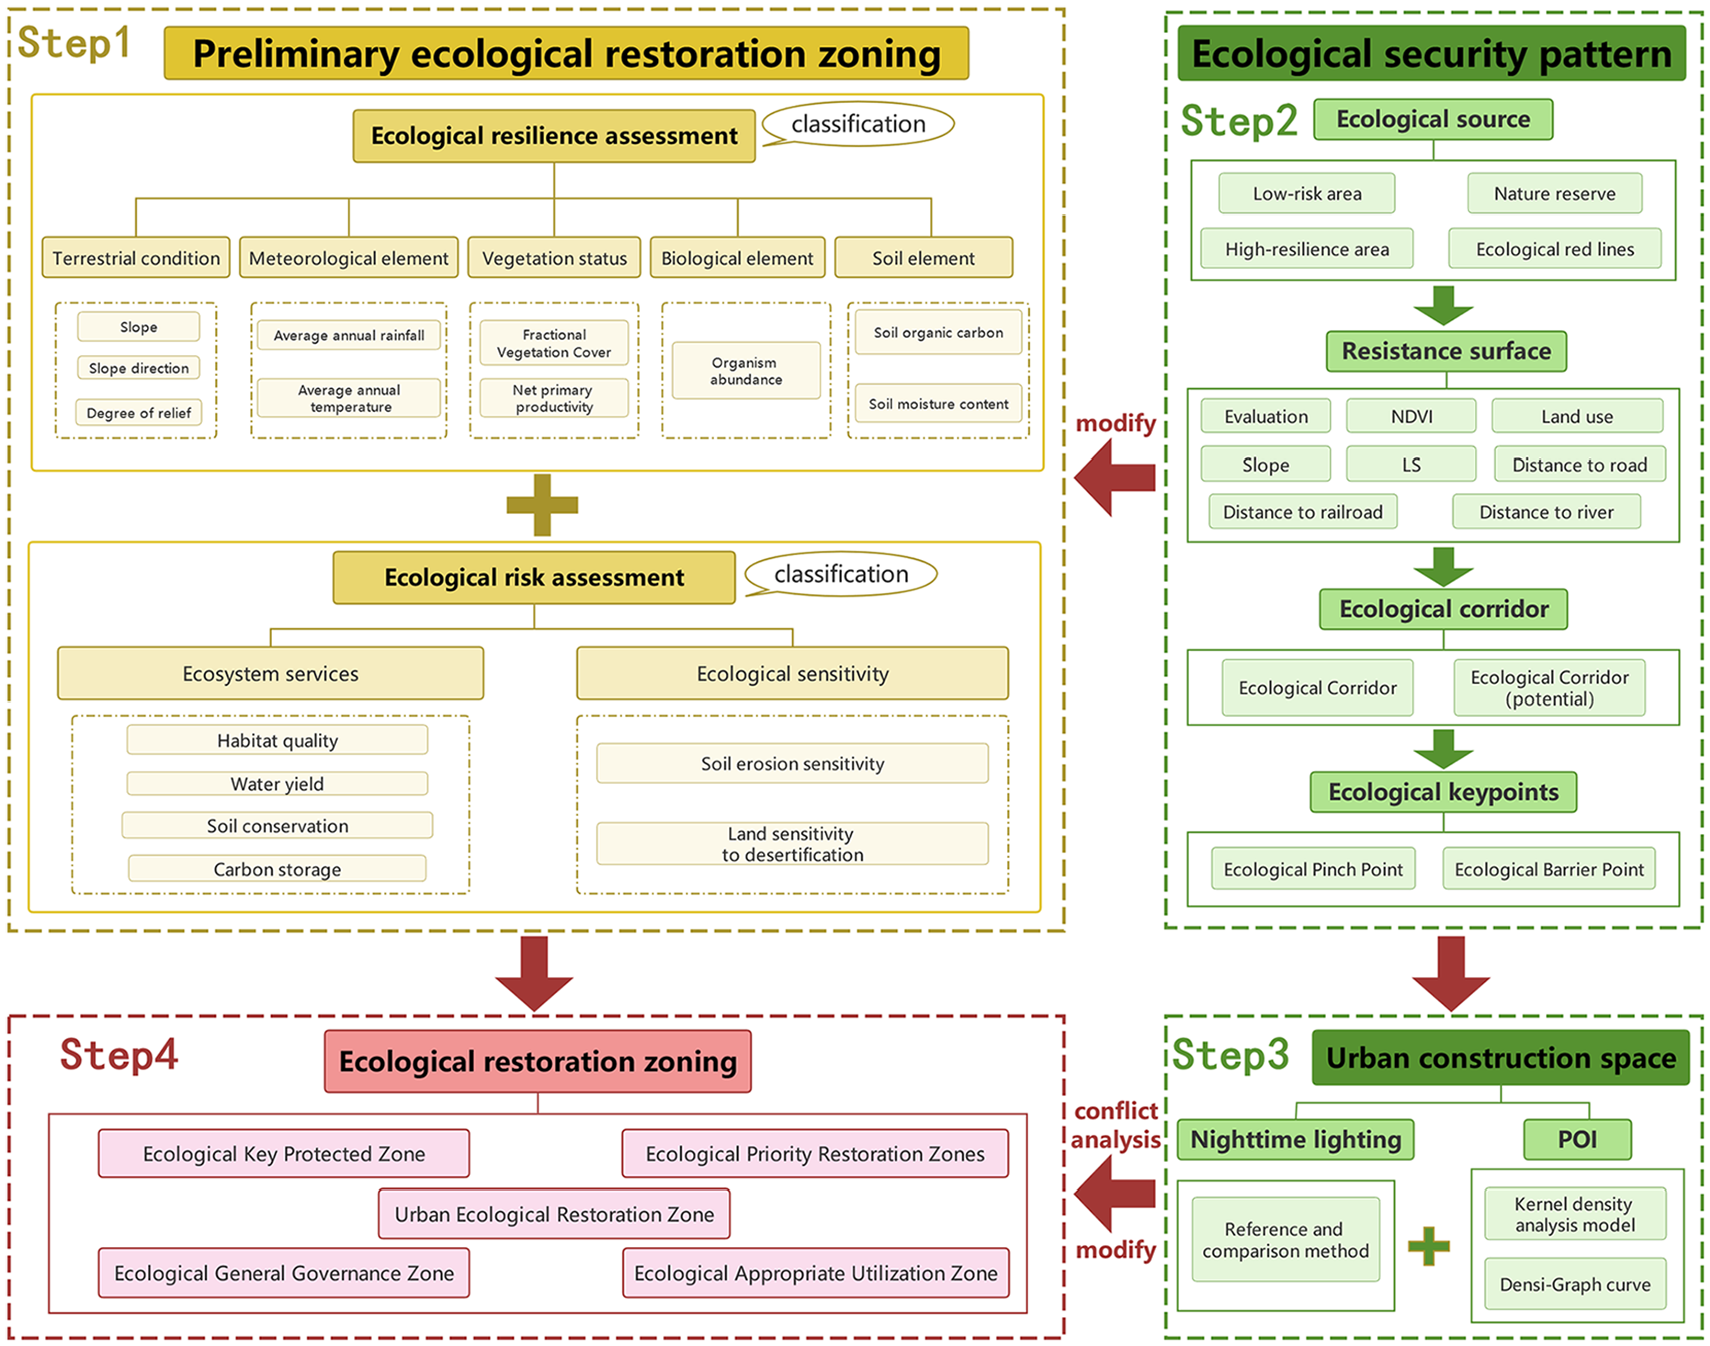
This study outlines ecological restoration zones through the lenses of ecological risk evaluation and ecological resilience assessment. On the basis of the findings from the ecological security pattern construction and the spatial identification of urban development, the initial delineation of ecological restoration zones has been refined. The primary ecological challenges and restoration directions for each zone are investigated, leading to the formulation of targeted ecological restoration strategies (Figure 2). Specifically, the ecological risk assessment utilized five indicators: habitat quality, water yield, soil conservation, soil erosion sensitivity, and land sensitivity to desertification. The level of ecological resilience is assessed through eight indicators: slope, terrain relief, temperature, precipitation, vegetation cover, soil organic carbon content, soil water content, and biological diversity. The ecological security pattern is developed from the evaluations of ecological risk and resilience, in conjunction with existing nature reserves and ecological protection red lines, following the framework of ‘source area - resistance surface - corridor - key point’. Urban development areas are identified via point of interest (POI) data and nighttime lighting data, employing kernel density analysis and reference comparison methods, respectively.
Ecological restoration zoning framework of the study.
Ecological restoration zoning based on ecological risk and ecological resilience assessment
Ecological risk assessment
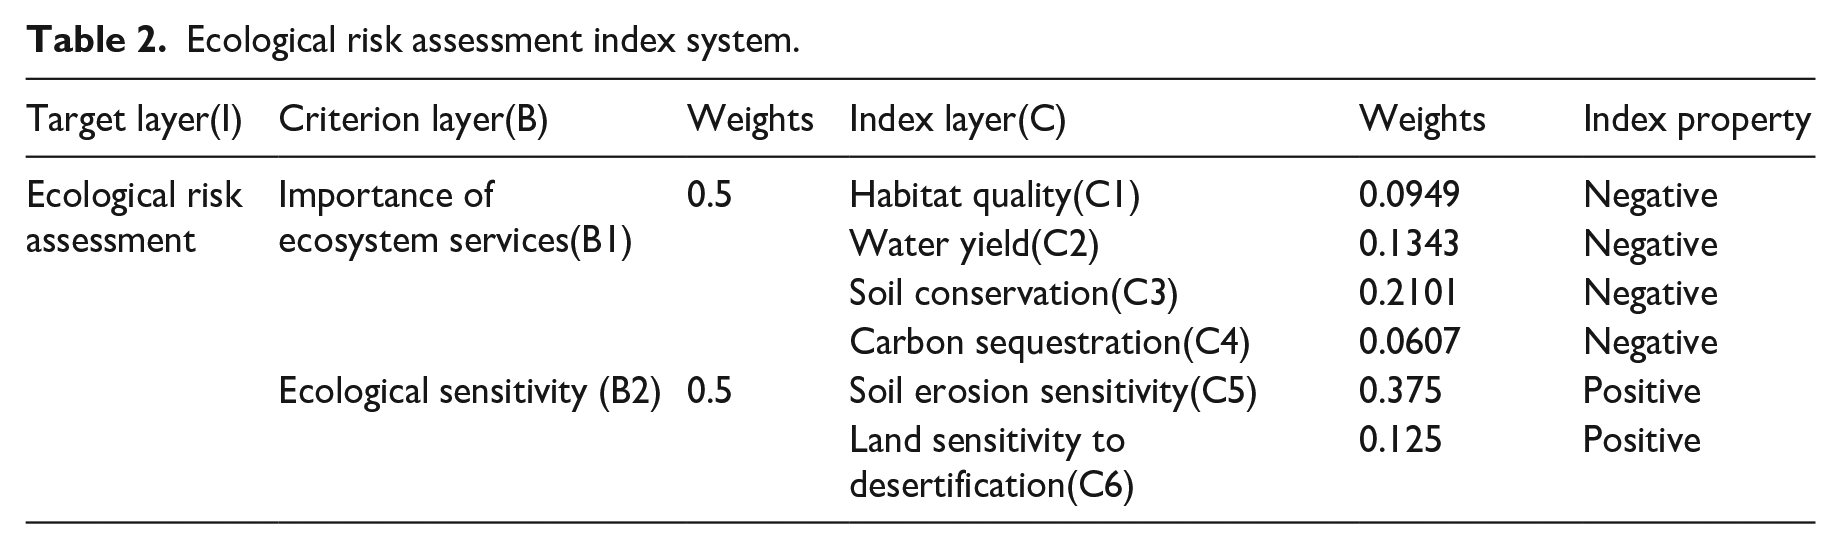
Drawing from relevant studies (Guo et al., 2023; Huang et al., 2022; Zhang et al., 2024a; Zhu and Cai, 2023) and taking into account the natural background conditions, actual ecological environment, and key ecological issues in Jiaozuo City, we conducted a comprehensive evaluation of ecological risk. The key ecosystem services assessed included habitat quality (HQ), water yield (WY), soil conservation (SC), and carbon sequestration (CS), whereas ecological sensitivity was evaluated through soil erosion sensitivity and land sensitivity to desertification (Table 2). We employed the analytic hierarchy process (AHP) to assign weights to each indicator and utilized the maximum–minimum normalization method to standardize the data across the indicators. The process commenced with the standardized data of each indicator and their respective weights, which were fed into a linear weighted evaluation model to compute the comprehensive ecological risk for the study area. The output was subsequently classified into five categories-low, relatively low, medium, relatively high, and high-using the natural breaks method.
Ecological risk assessment index system.
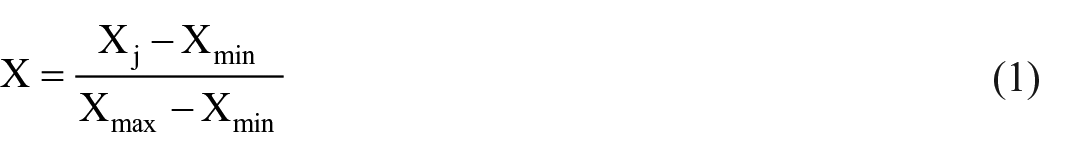
Standardization of positive indicators:
Standardization of negative indicators:
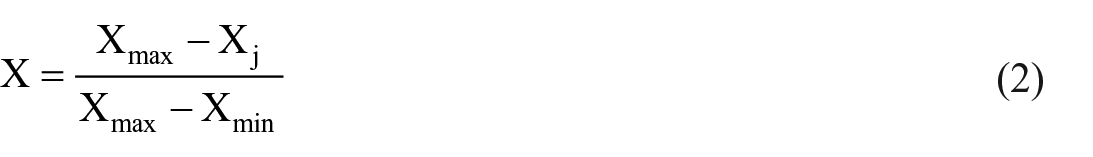
Where: X is the normalized value; Xj is the original value of the indicator; Xmin is the minimum value of the indicator; Xmax is the maximum value of the indicator.
HQ, WR, CS, and SC, as the four key ESs, belong to the three broad categories of provisioning, regulating, and supporting services, making the type of assessment more comprehensive. Habitat quality (Chen et al., 2024c) refers to the ability of an ecosystem to provide essential conditions for the survival and reproduction of species, which can, to some extent, reflect biodiversity. This study utilized the Habitat Quality module within the InVEST model to calculate the Habitat Quality Index, using 2020 land-use data from Jiaozuo City and incorporating various biodiversity threat factors (Qin et al., 2024; Wei et al., 2022b). The provision of freshwater is crucial for the ecosystem services within the study area. To account for factors such as topography, climate, vegetation, and soil, the water yield module of the InVEST model was employed to evaluate the annual water production value for each grid cell (Chen et al., 2024d; Redhead et al., 2016; Zhang et al., 2014). Soil conservation, which involves the management of soil erosion and the maintenance of soil quality, is vital for sustaining the ecological balance. The study area's soil conservation services were assessed via the sediment delivery ratio (SDR) module of the InVEST model (Williams and Arnold, 1997; Wischmeier and Smith, 1965), which relies on the modified universal soil loss equation (RUSLE). Additionally, the carbon sequestration services within the study area were evaluated via the carbon storage module of the InVEST model (Bacani et al., 2024; Li et al., 2014; Zafar et al., 2024).
Ecological sensitivity denotes the responsiveness of ecosystems to human disturbances and changes in the natural environment (Ouyang et al., 2000) characterizing the likelihood and ease of ecological and environmental issues arising within a region. Specifically, Jiaozuo City is located in the central part of Henan Province, within the Yellow River Basin, characterized by an interspersed landscape of hills and plains. Influenced by topography, climate, precipitation, and other factors, the city faces significant soil erosion issues. Over-cultivation, coupled with water scarcity, has resulted in large areas of sandy land. The main risks facing Jiaozuo City's ecology are severe soil erosion and land desertification. Therefore, this paper employed an indicator evaluation method to assess both soil erosion sensitivity and land sensitivity to desertification in the area. The assessment formulas are as follows:

where SS represents the degree of soil erosion sensitivity, R represents the rainfall erosivity factor, K represents the soil erodibility factor, LS represents the topographic relief factor, and C represents the vegetation cover factor.

where I represents the dryness index, I = 0.16 (year-round ⩾10° cumulative temperature/year-round⩾10° period precipitation); W represents the number of sandy days with wind uplift greater than 6 m/s in winter and spring; K represents the soil texture factor; and C represents the vegetation cover factor.
Ecological resilience assessment
Ecological resilience refers to the intrinsic ability of an ecosystem to maintain its structural integrity and functional stability (Yuan and Bai, 2020). It is an important indicator for assessing ecological protection and restoration efforts. The natural resilience of an ecosystem is influenced by its intrinsic characteristics, which in turn are influenced by its surrounding environmental conditions (Walker and Salt, 2012) . The main environmental factors include topography, climate, soil, water and organisms (Yan et al., 2012). Based on relevant literature (Jin et al., 2023; Zhang et al., 2022), an evaluation index system for ecological resilience was established, including five main dimensions that are closely related to ecosystems: topographic conditions, meteorological elements, vegetation conditions, soil characteristics and biological factors (Liu et al., 2016; Wang et al., 2023).
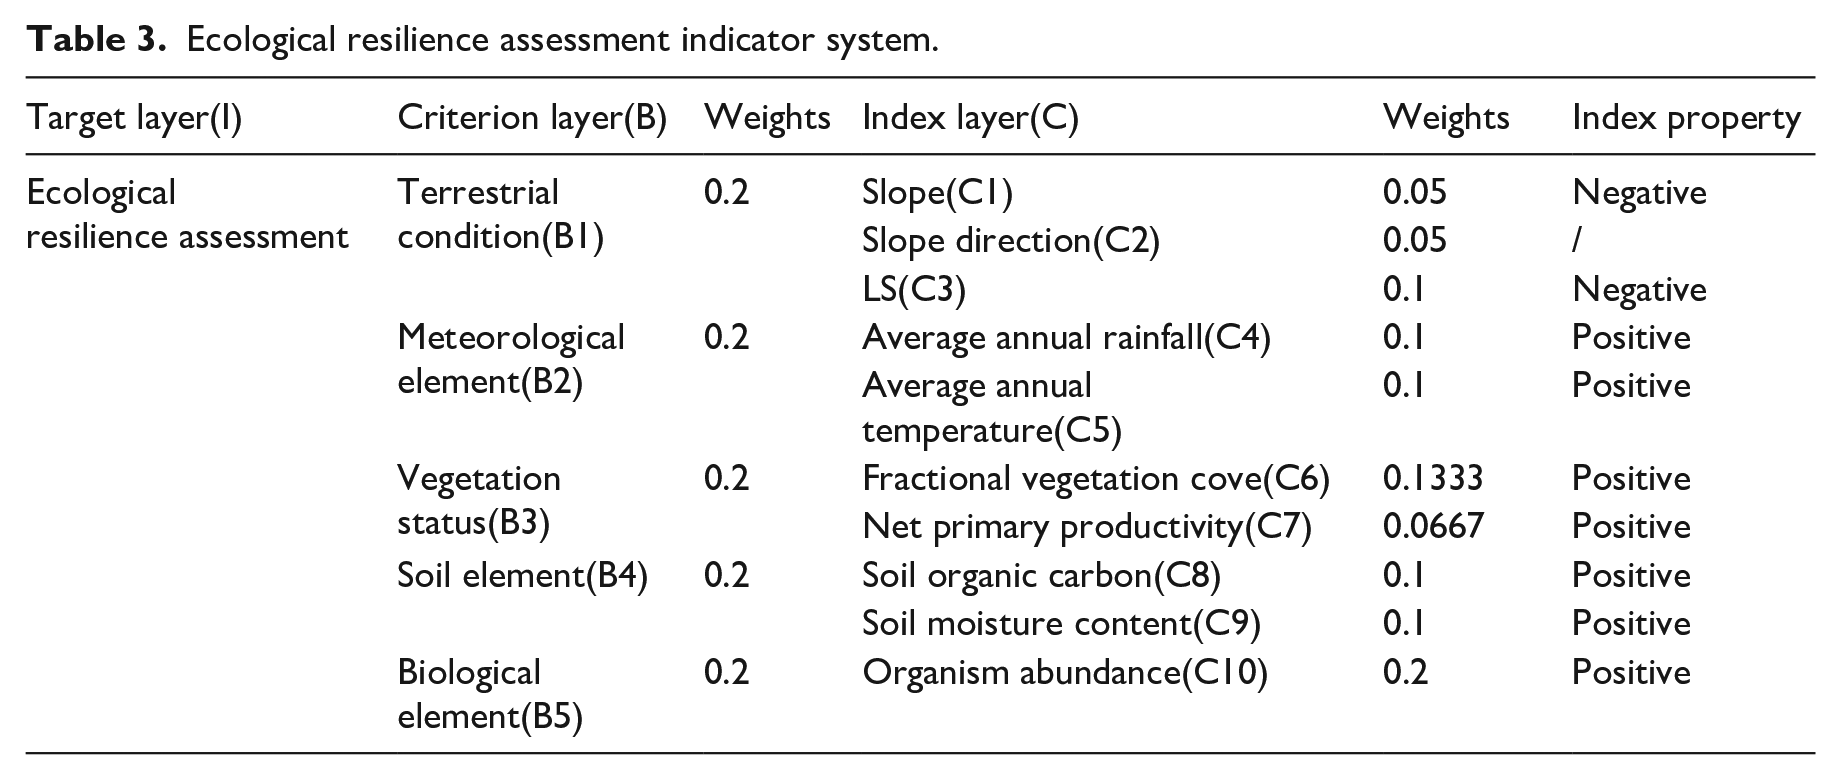
We selected ten indicators to evaluate ecological resilience in the study area (Table 3). Among these factors, topography influences ecological stability; the greater the relief, the more plant water uptake and light conditions are affected. Differences in slope and aspect also indirectly impact hydrothermal conditions. Climate affects ecosystem processes by influencing plant photosynthesis and respiration. Temperature governs biochemical processes, while precipitation influences plant water availability, thereby affecting growth rates. Soil structure and fertility directly affect plant growth, and higher soil organic carbon content enhances ecological resilience. Soil moisture content is also critical to ecological recovery. Vegetation cover (FVC) and net primary productivity (NPP) reflect ecosystem health, and greater species diversity leads to increased ecosystem stability. Specifically, the slope orientation data were reclassified into five categories: no slope orientation, sunny slopes, semi-sunny slopes, semi-shaded slopes, and shaded slopes (Wen et al., 2018).
Ecological resilience assessment indicator system.
Preliminary zoning for ecological restoration
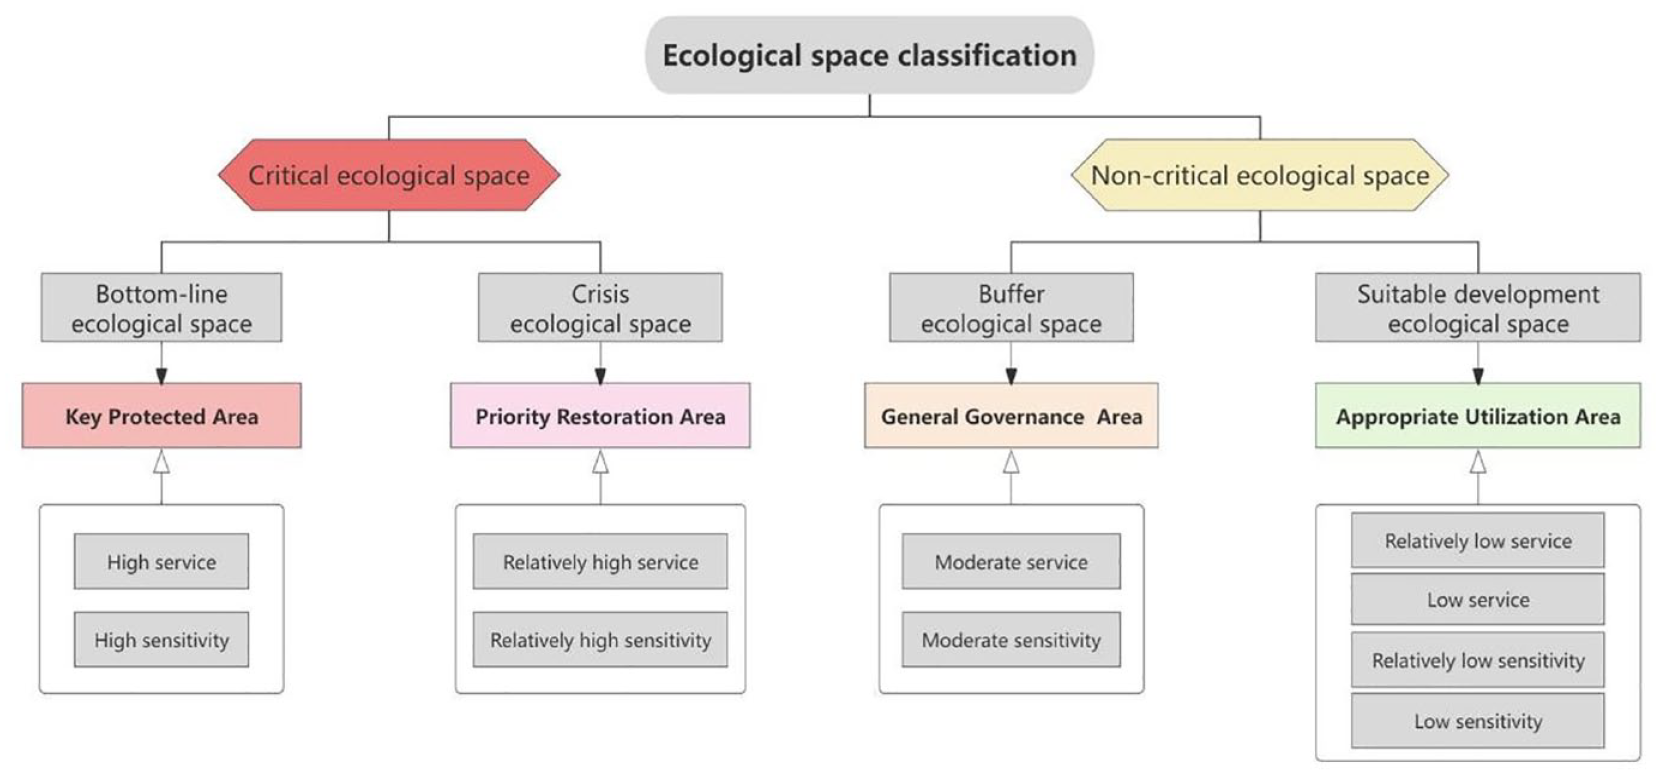
Using GIS spatial analysis technology, informed by related studies (Huang et al., 2020; Zhou et al., 2023), we categorized the ecological restoration partitions according to the level of ecological protection and restoration (Figure 3). In this framework, regions exhibiting high ecosystem service scores alongside significant ecological sensitivity are classified as bottom-line ecological spaces, invoking the implementation of stringent ecosystem protection policies and identifying them as key protected areas. Conversely, regions characterized by relatively high ecosystem service scores and substantial ecological sensitivity are designated crisis ecological spaces, where ecological restoration efforts should be prioritized, thus marking them as areas for priority restoration areas. Additionally, areas exhibiting medium ecosystem service scores and medium ecological sensitivity are labeled as buffer ecological spaces, which fall under general governance areas. Finally, regions with relatively low ecosystem service scores and low ecological sensitivity, which have undergone extensive exploitation, are classified as suitable ecological spaces for resource extraction and are designated as appropriate utilization areas.
Ecological restoration zoning flow chart.
On the basis of the findings of the ecological resilience evaluation, ecological restoration strategies were established for each subarea, with resilience levels differentiated through z score standardization. For areas exhibiting high ecological resilience (where resilience is standardized to be greater than 0), natural restoration should take precedence, supplemented by suitable artificial restoration measures. This approach aims to minimize human intervention, thereby allowing the ecosystem to recover naturally and maximally via its inherent restoration capabilities to expedite the ecological restoration process. Conversely, for regions with low resilience (where resilience is standardized to less than 0), a mixed approach incorporating both natural and artificial restoration methods is necessary to comprehensively enhance the ecosystem's recovery capacity. The formula is as follows:
where x′ is the result after standardization of x; x is the observed value of the individual data; µ is the mean of the overall data; and δ is the standard deviation of the overall data.
Modified zoning based on ecological security patterns
The establishment of an ecological security pattern effectively links various ecological patches to create a cohesive ecosystem. By developing an ecological security pattern (Fang et al., 2020; Gao et al., 2023), identifying critical areas for ecological restoration, and optimizing ecological restoration zoning, we aim to strengthen the connectivity between northern and southern ecological patches, to form a complete ecosystem network. Ecological restoration zoning was optimally adjusted on the basis of the identified ecological security pattern, which includes sources, corridors, ecological pinch points and barrier points (Qin et al., 2020).
Identification of ecological sources
Ecological source areas serve as vital core zones for ecological protection, acting as a source of stability for ecosystems. Previous studies have generally recognized areas that provide high-quality ecosystem services or exhibit strong landscape connectivity as ecological source areas, as evaluated from the perspectives of ecosystem service assessment and ecological security appraisal (Fu et al., 2020; Peng et al., 2019). In this study, we selected low-risk areas identified through ecological risk evaluations and areas exhibiting high and relatively high resilience from the ecological resilience evaluation for further analysis. These areas were then integrated with existing nature reserves and ecological protection red lines within the study area (Hao et al., 2019) to outline the ecological source areas.
Extraction of ecological corridors
The migration of biological species across heterogeneous landscapes involves varying degrees of resistance, which are influenced by both internal landscape structure and external disturbance factors (Doyle and Snell, 1984). In this study, the construction of resistance surfaces is informed by land use types and integrated with factors such as elevation, slope, topographic relief, the NDVI, and networks of railways and rivers. In addition, based on the positive or negative impacts of resistance factors on ecological elements (He et al., 2024; Pickett et al., 2017; Wang et al., 2022a), employed hierarchical analysis to determine the weights of each resistance factor (Table A1).
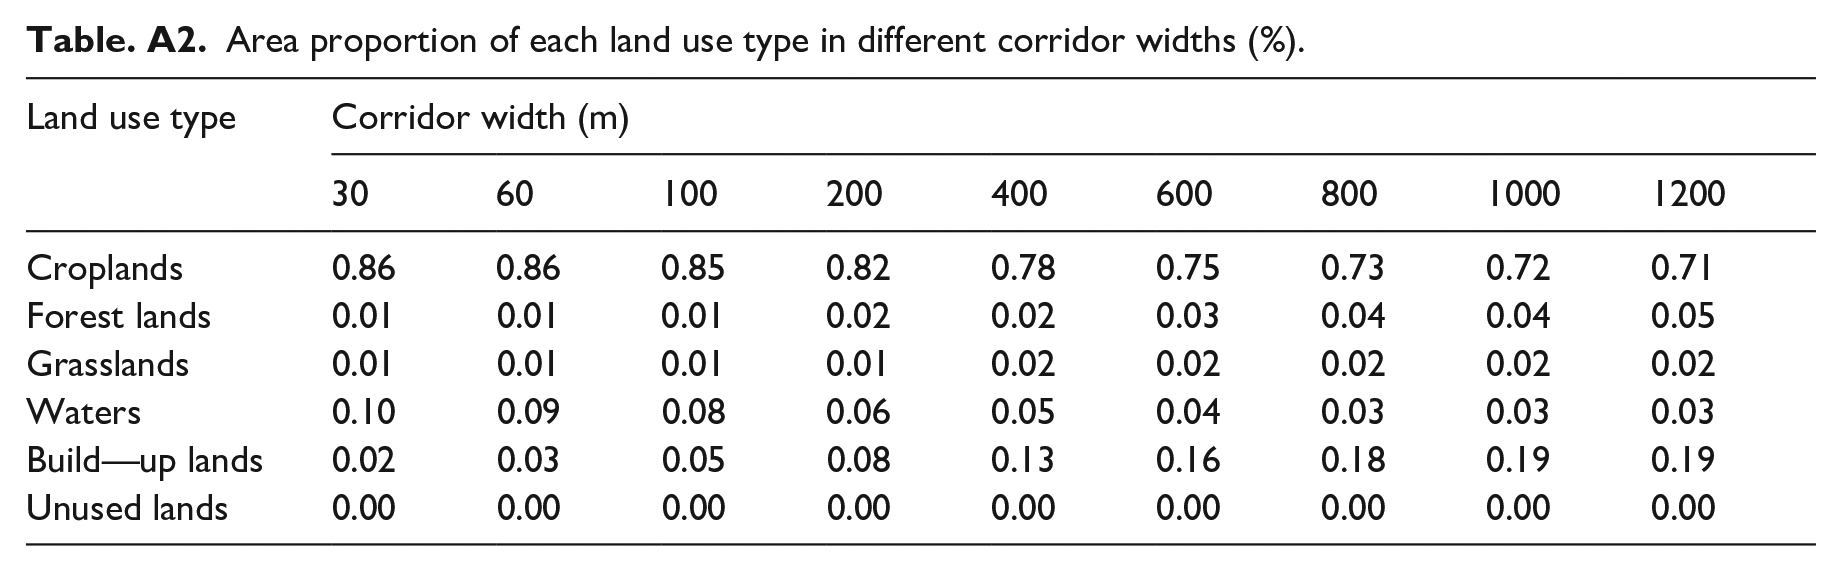
Ecological corridors are continuous linear or ribbon-like elements in ecological spaces that connect isolated or dispersed ecological units. They serve as important channels for the exchange of materials and information (Avon and Bergès, 2016). This study uses the circuit theory from physics to construct ecological corridors (Peng et al., 2018) and applies the Linkage Pathways module in the Linkage Mapper toolbox to extract least-cost pathways. Circuit theory models the landscape as a lattice with nodes and resistors, where ecological flows resemble electric currents. Corridors are identified on the basis of current strength through nonecological sources (McRae et al., 2008). The width of ecological corridors influences species diversity and ecological benefits (Wang et al., 2022b), and corridors of sufficient width are essential for fulfilling ecological service functions (Xu et al., 2018). In this study, the constructed ecological corridor was used as a baseline for analysis, with buffer zones of 30, 60, 100, 200, 400, 600, 800, 1000, and 1200 meters. A statistical analysis of the area of each land use type within these widths was conducted to determine the optimal corridor width.
Identification of key areas
Ecological pinch points are areas with high current densities, indicating their biological activity and importance in migratory pathways (Zhou et al., 2023) . Protecting these areas helps maintain connectivity between ecological source sites. The Circuitscape open-source program was used for simulation, with the ‘All Pairs’ mode of the Pinchpoint Mapper tool. To ensure that the core pinch point locations were unaffected by corridor width changes, the corridor's cost-weighted distance was set to 30,000 m after several tests.
Ecological barrier points are significant obstacles that organisms face during migration. Removing these barriers improves connectivity between source sites and reduces ecological resistance (An et al., 2021). The ‘Maximum’ mode of the Barrier Mapper module was used for iterative calculations. A search radius of 50 m to 200 m was set, with 50 m steps, to identify ecological obstacles via the moving window method. On the basis of practical conditions, a 50 m gradient was selected as the iterative radius for this study.
Modified zoning based on urban construction space
Ecological restoration zoning must account for the impact of urban development and outline human activities within noncritical ecological spaces to maintain a balance between economic growth and ecological preservation. Nighttime lighting data can be used to identify urban built-up areas effectively, thereby mitigating issues related to spectral confusion. Additionally, by analyzing the density and agglomeration characteristics of POI data points, we can accurately pinpoint regions with high levels of human socio-economic activity. Analyzing the conflict between urban construction space and ecological restoration zoning allows for further refinement of the ecological restoration zoning strategy (Figure 4).
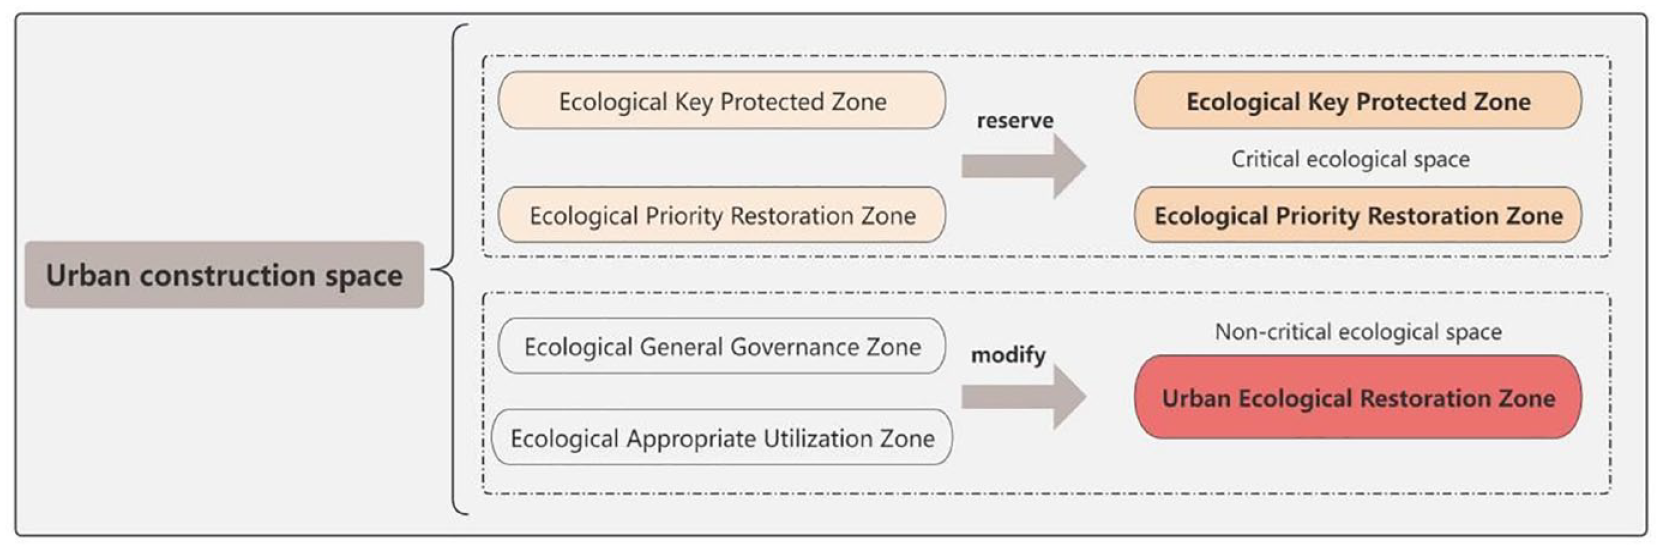
Ecological restoration zoning amendment diagram.
First, the urban built-up area is outlined via a series of nighttime lighting thresholds. This built-up area is subsequently compared with data published in the statistical yearbook. The threshold that results in the smallest deviation from the published data is identified as the optimal threshold, after which the built-up area is extracted. The spatial extent of the urban built-up area is determined through kernel density analysis of POI data (Henderson et al., 2003; Huang et al., 2016; Okabe et al., 2009). As the density centers converge, an overall decline in POI density along the urban fringe results in an upward trend in the curve, indicating that the corresponding kernel density value (d) represents the critical threshold for defining the built-up area boundaries. The formula is as follows:
where Pi represents the kernel density value of any point i in the region; Kj represents the weight of the jth POI; Dij represents the distance from any point i to POI point j in the region; R is an artificially specified bandwidth parameter whose value needs to be greater than that of Dij; and n denotes the number of all the POI points included in a given bandwidth.
where d represents the density value corresponding to the contour and Sd denotes the theoretical radius of the area S into which the contour d becomes.
Results
Preliminary zoning
Characterization of the spatial distribution of ecological risk
Ecosystem services and ecological sensitivity in Jiaozuo City exhibit distinct spatial distribution characteristics. The values of habitat quality (Figure 5a), carbon sequestration services (Figure 5c), and soil conservation services (Figure 5d) were high in the northern region and low in the central and southern parts of the city. Particularly in ecological land types such as woodlands and high-cover grasslands, where vegetation cover is significant and all three ecosystem services are enhanced. In contrast, areas with low habitat quality are block shaped and concentrated in the central and southern plains, dominated by construction land and exhibiting a poor ecological environment. Low-carbon sequestration areas are scattered across the construction land in the central plains of Jiaozuo City, where strong anthropogenic activities and sparse vegetation result in diminished carbon sequestration and oxygen release capacities. The water-producing capacity (Figure 5b) tends to decrease from south to north, with low-value areas mainly found in the shallow mountainous regions of the northern mountains and the central plains. These areas are predominantly industrial, mining, and residential lands, which are characterized by low evapotranspiration capacity and diminished vegetation cover.
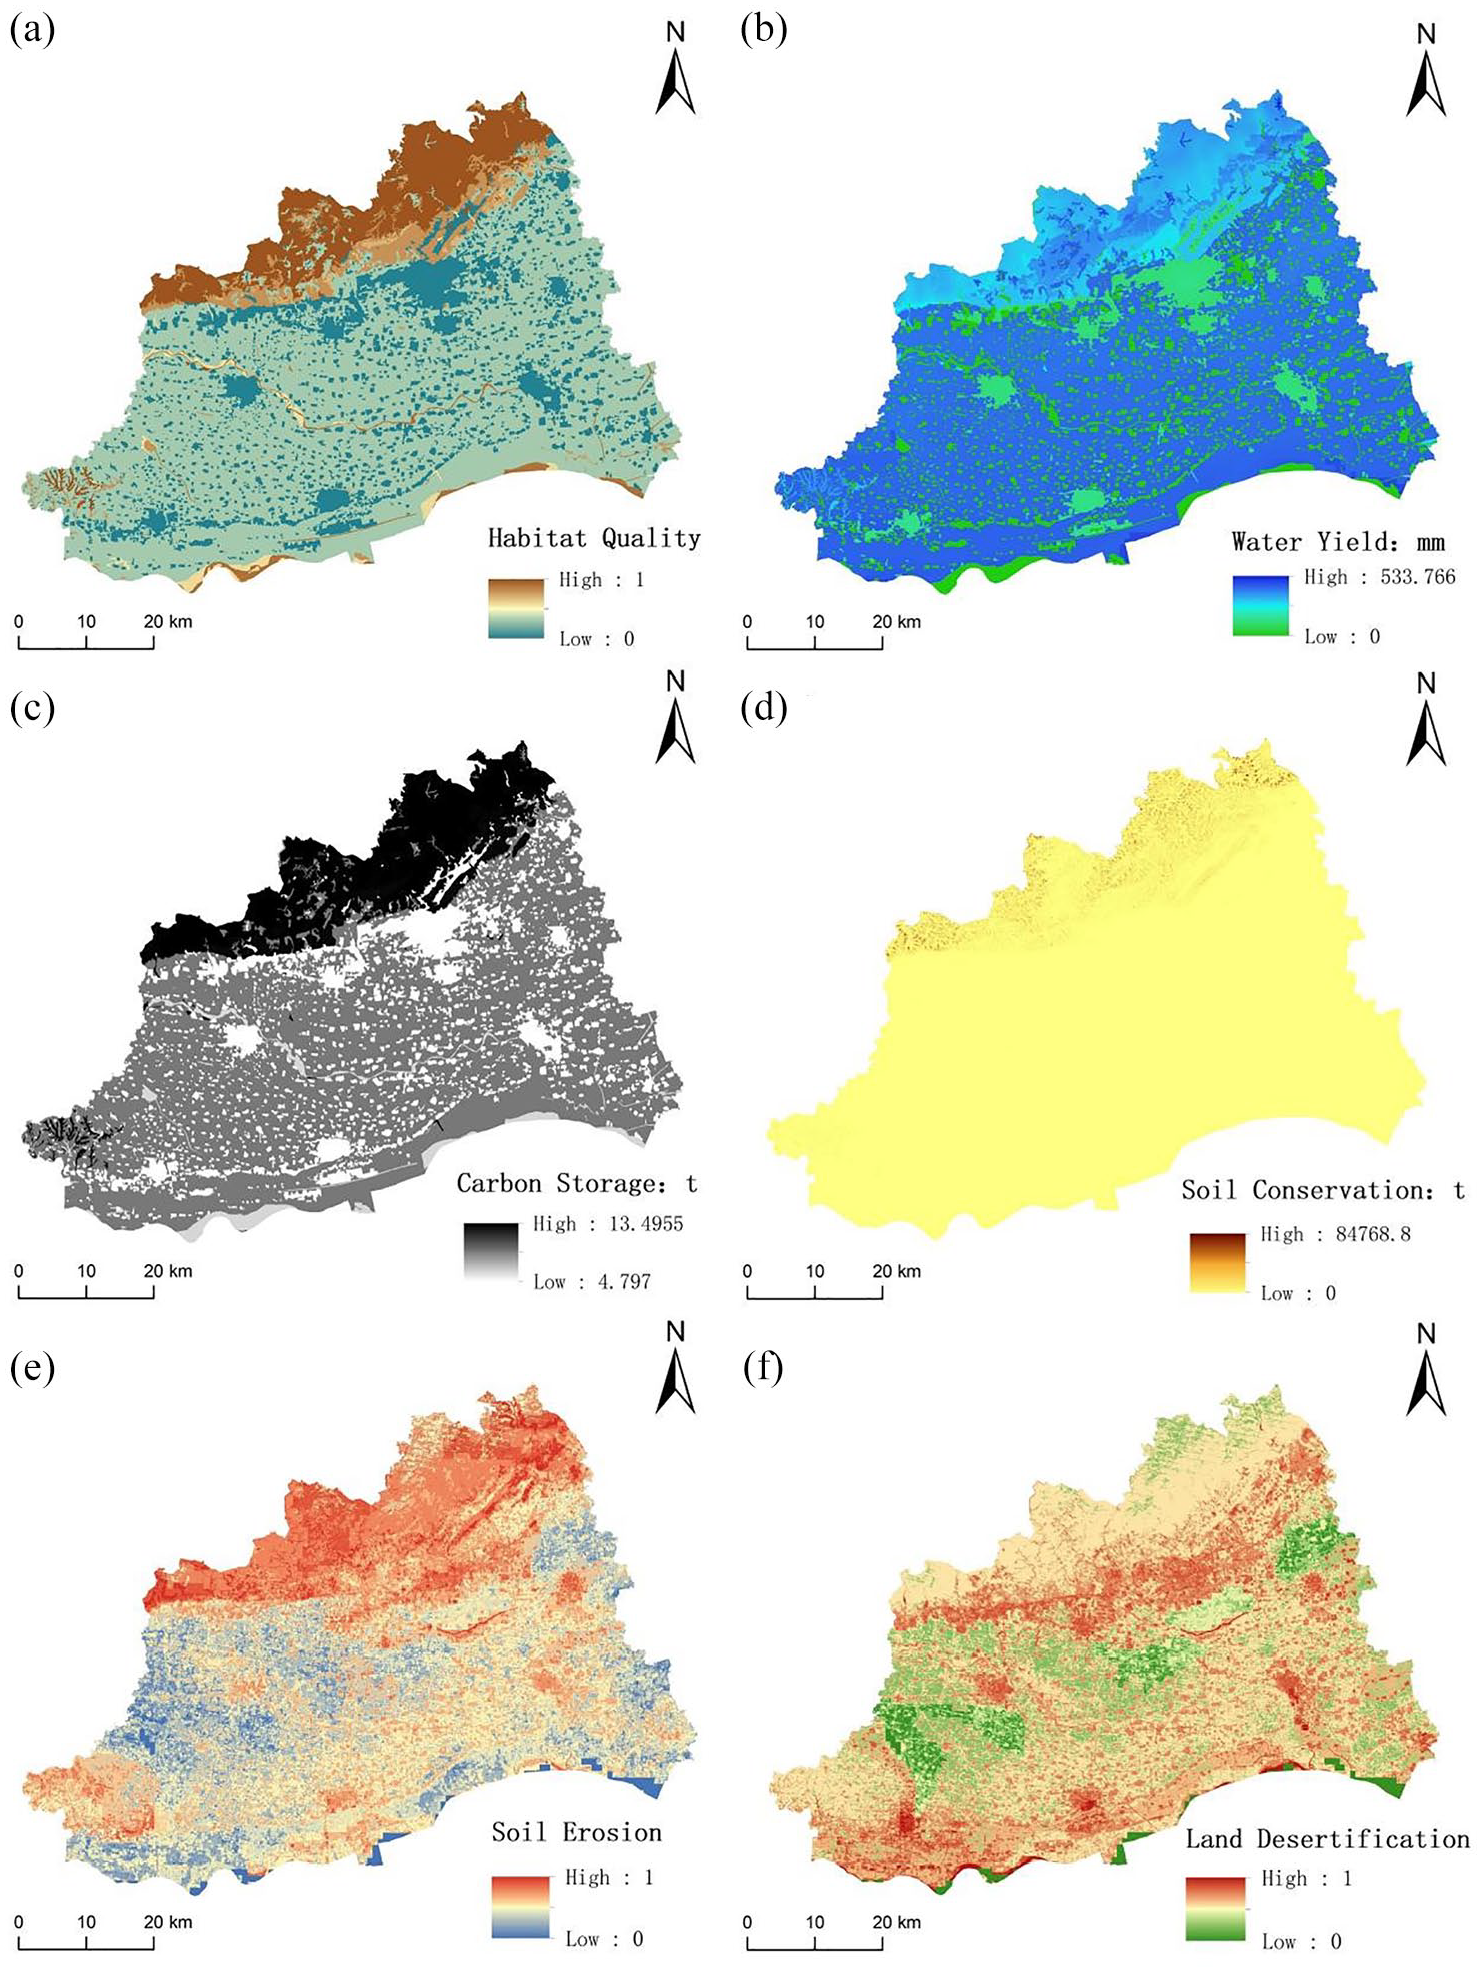
Results of the evaluation of the indicators of ecological risk. (A) Habitat quality result map; (B) Water yield result map; (C) Carbon sequestration result map; (D) Soil conservation result map; (E) Soil erosion sensitivity result map; (F) Land sensitivity to desertification result map.
The sensitivity of soil erosion in Jiaozuo City is considered moderately low (Figure 5e), high-sensitivity zones are concentrated in the northern mountainous and premountain regions, which exhibit significant topographic relief, steep slopes, and concentrated precipitation. In contrast, soil erosion in the southern region, particularly along the Yellow River beach area, is relatively insensitive. In terms of land desertification sensitivity (Figure 5f), high-value and relatively high-value areas are found primarily within the shallow mountainous regions of the Taihang Mountains in the north, as well as in the plain areas to the south. The shallow mountainous zones, which are predominantly utilized for mining activities, generally lack tall and dense vegetation cover, rendering them highly susceptible to desertification. Moderately sensitive areas are widely distributed throughout the city, representing the largest proportion of land. Areas of low sensitivity are located primarily in the southern Yellow River beach area.
The overall ecological risk in the region is characterized by a distribution pattern of ‘low risk in the northern mountains and southern beaches and high risk in the central plains’ (Figure 6). High-risk and relatively high-risk areas are primarily concentrated in central Jiaozuo, particularly in regions with significant construction, such as industrial, mining, and residential lands, which account for 14.65% and 11.81% of the city’s total area, respectively. Conversely, low-risk areas are mainly found along the Yellow River beach in southern China, comprising only 1.03% of the city's area. Additionally, certain regions in the shallow mountainous areas of the northern mountains present relatively high levels of ecological risk, especially in abandoned mine sites where the risk levels are notably elevated and more concentrated. Consequently, the focus of ecological restoration efforts in Jiaozuo should prioritize these abandoned mine areas.
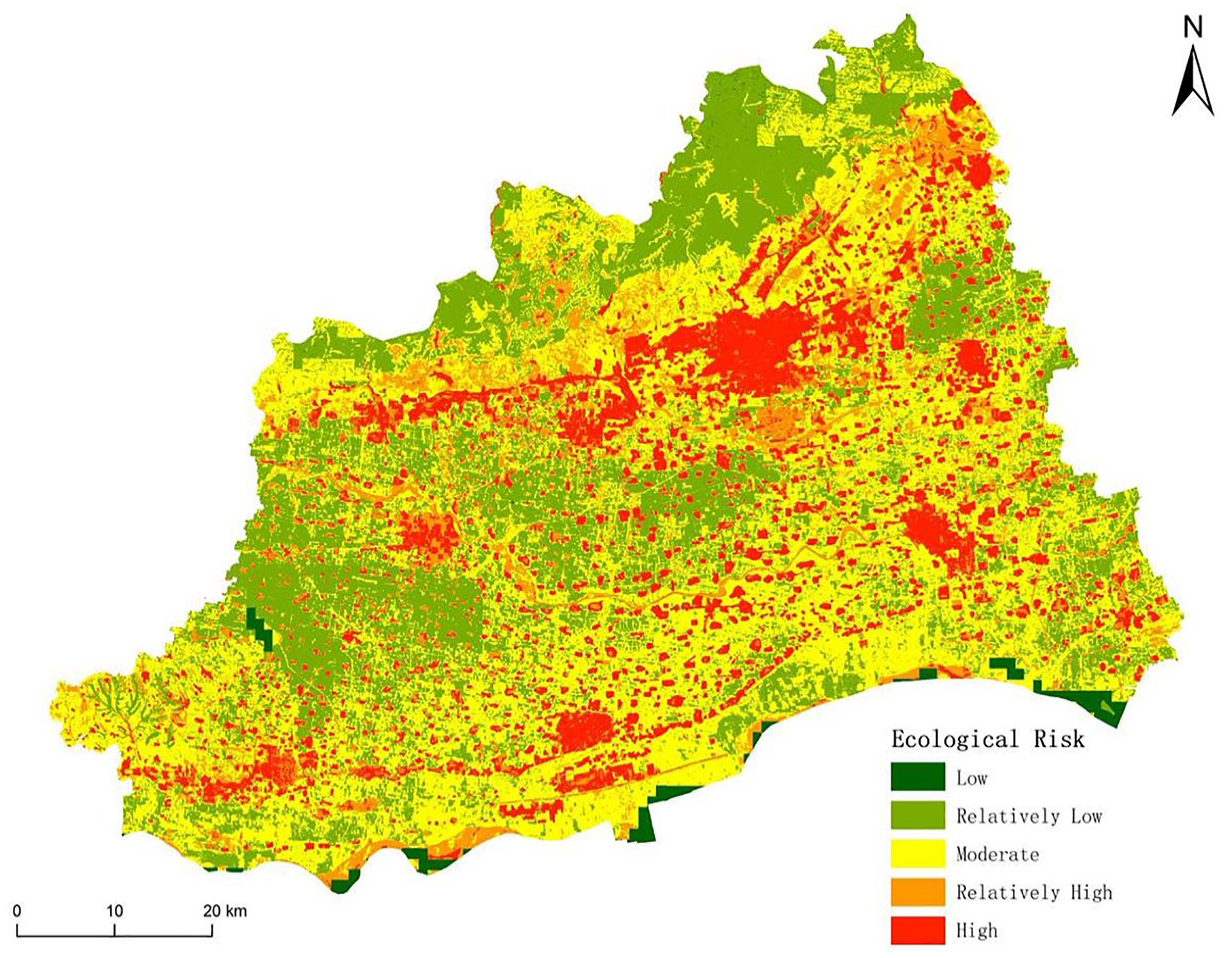
Results of the comprehensive ecological risk assessment.
Characterization of the spatial distribution of ecological resilience
The largest portion of ecological resilience in Jiaozuo City is classified as medium resilience, representing approximately 33.73%, followed by relatively high resilience at approximately 28.44%. The relatively low-resilience, low-resilience, and high-resilience areas account for 15.81%, 9.90%, and 12.12%, respectively. Overall, Jiaozuo exhibited a reasonably good level of ecological resilience (Figure 7). Areas with high resilience, particularly in the northern mountains, western region, and select locations along the Yellow River beach, demonstrate a strong capacity for natural recovery and other cost-effective restoration methods following disturbances. In contrast, the resilience level in the central plains is categorized as low to medium, primarily due to the prevalence of mines and construction sites that have adversely affected the local ecology, resulting in diminished resilience.
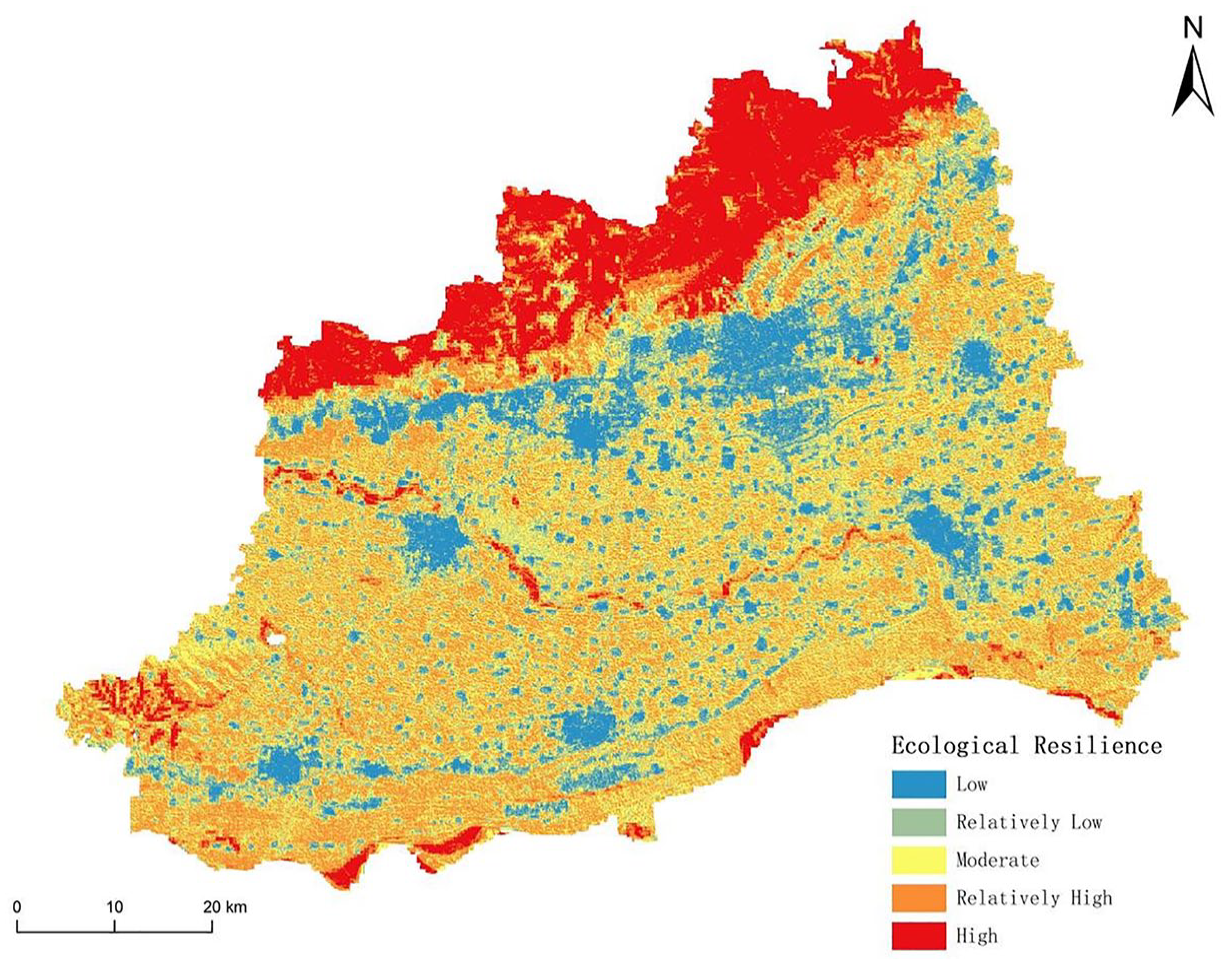
Results of the ecological resilience evaluation.
Preliminary results of ecological restoration zoning
The ecological key protection zone is located primarily in the Taihang Mountains in the northern part of the study area, whereas the ecological priority restoration zone is located predominantly in the northern premountain areas and certain locations in the southern part of the study area. The ecological general governance zone and the ecologically appropriate utilization zone include the largest expanses and are extensively distributed throughout the central and southern regions of the study area, primarily within cropland and construction areas (Figure 8a). The zone employing an ecological restoration approach based on natural recovery (Figure 8b) is located primarily in the northern and southwestern portions of the study area, with a concentration in the Taihang Mountain region. In contrast, the zones utilizing integrated restoration methods that combine natural and artificial interventions (Figure 8c) are distributed widely across the central and southern sectors of the study area.
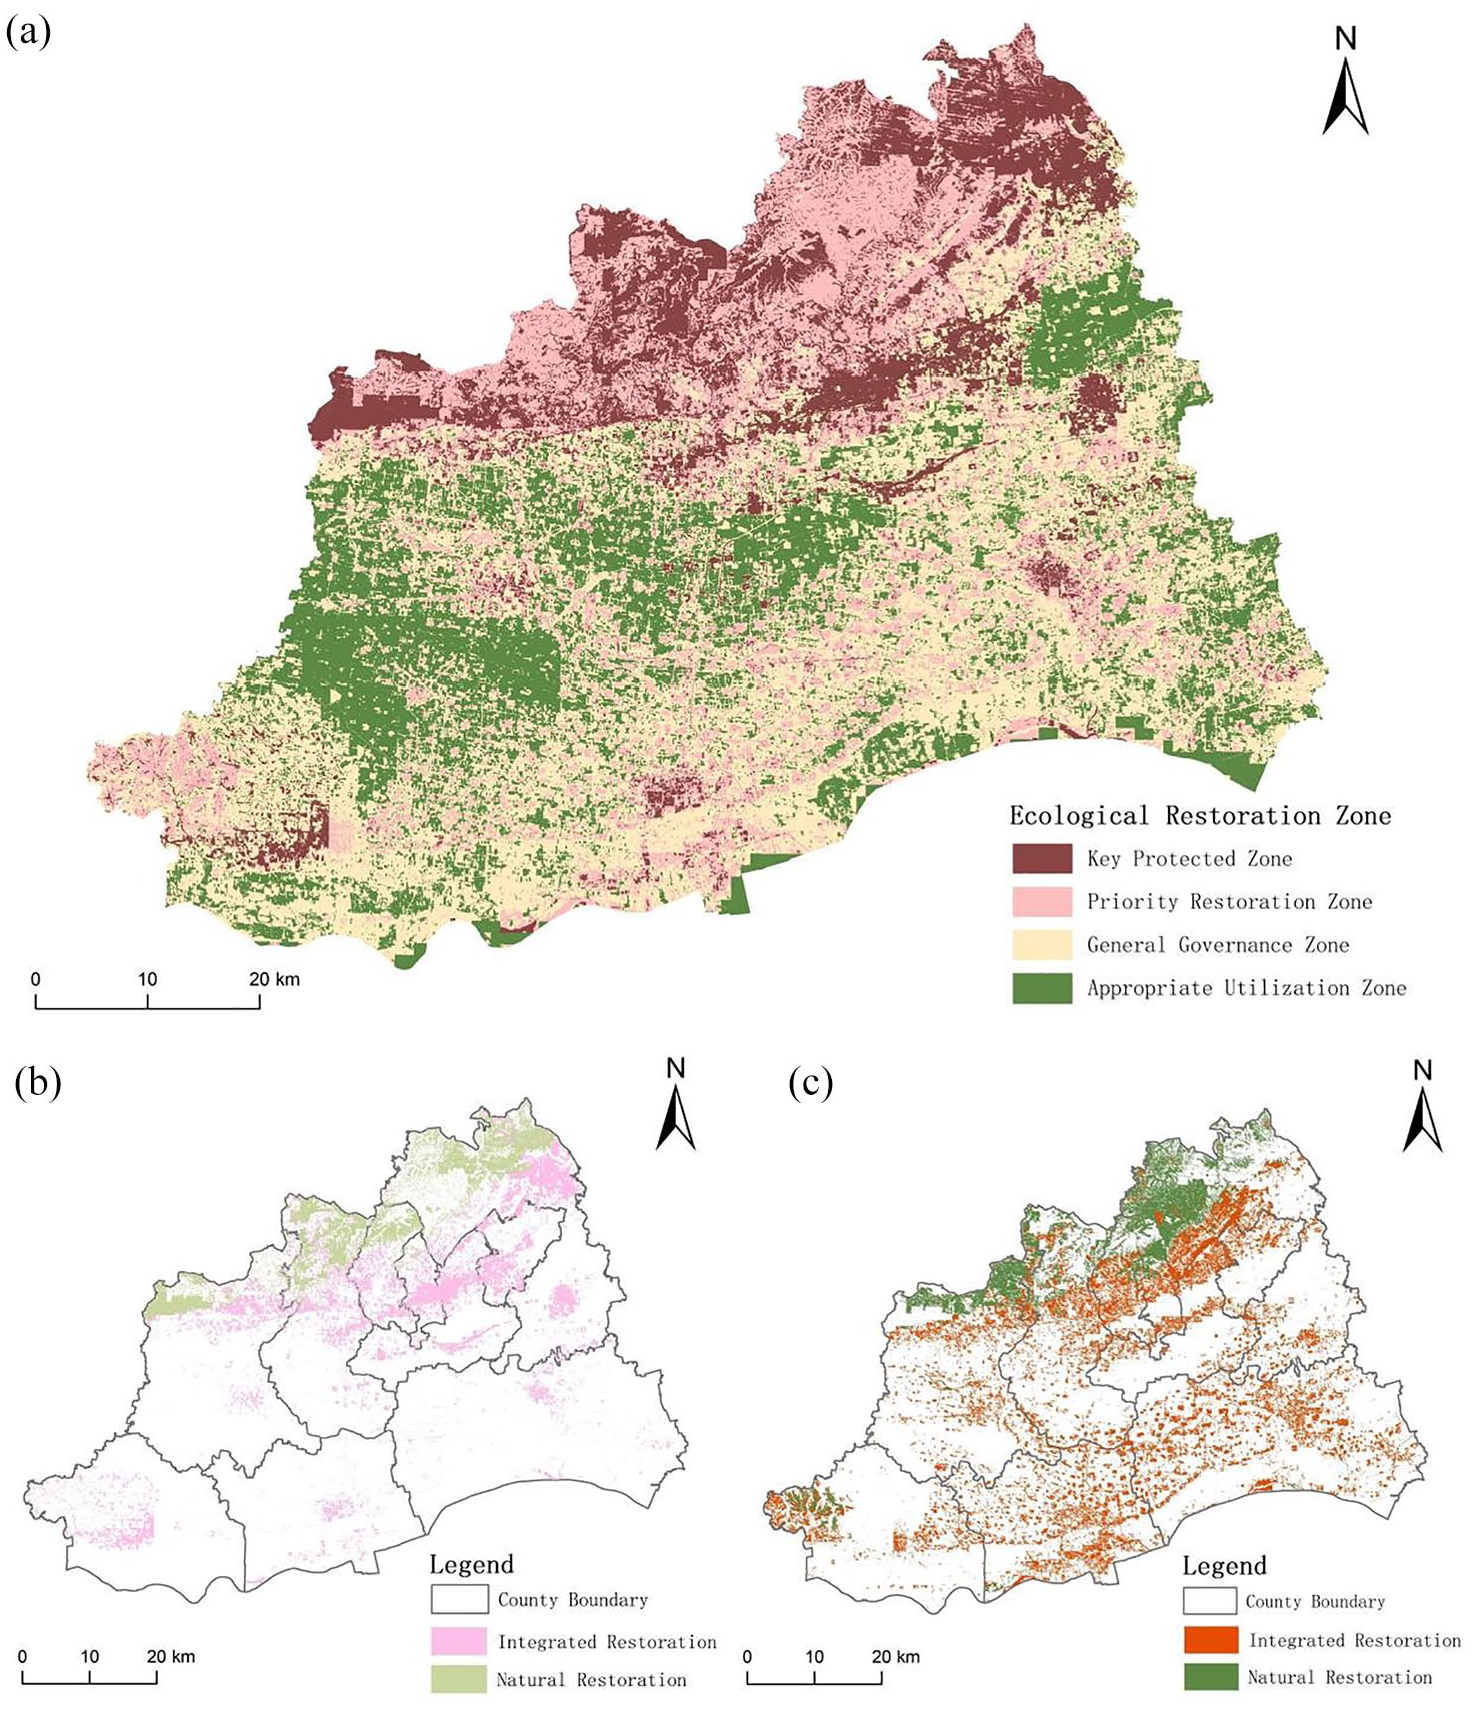
Preliminary results of ecological restoration and restoration methods. (A) Preliminary ecological restoration zones, (B) Natural restoration area, (C) Natural and artificial restoration area.
The ecological key protection zone covers an area of approximately 628.27 km2, representing approximately 15.82% of the total study area. This zone is vital for the preservation of the overall ecological environment and requires robust protection. Within the ecological key protection zone, 62.21% of the area was subjected to natural restoration methods, indicating a strong capacity for ecosystem restoration. Additionally, the integrated natural and artificial restoration zone constituted 37.79% of the total area, characterized by a relatively homogeneous species composition. This area necessitates artificial restoration measures that combine natural processes with human intervention to facilitate comprehensive ecosystem recovery.
The ecological priority restoration zone covers approximately 886.69 km2, accounting for approximately 22.32% of the study area. This zone provides essential ecosystem services and is particularly vulnerable to significant issues, such as ecosystem imbalance and degradation due to human activities, which highlights the need to prioritize restoration efforts. Within this zone, areas predominantly engaging in natural restoration make up 28.28%, whereas those incorporating integrated natural and artificial restoration constitute 71.72%. It is essential to restore and enhance the ecological functions of this zone through scientifically informed and rational restoration methods to safeguard the health and stability of the ecosystem.
The ecological general management zone spans 1492.11 km2, making up 37.56% of the total study area, thus representing the largest portion. This zone possesses substantial spatial carrying capacity and abundant cropland resources, making it suitable for highly efficient utilization. Consequently, this area should prioritize ecological restoration methods that focus on artificial intervention. The ecological appropriate utilization zone covers an area of 965.54 km2, accounting for 24.30% of the total study area. The land use in this zone is dominated by construction, resulting in complete ecological degradation and an inability to perform essential ecological functions. Therefore, restoration efforts should concentrate on reinstating the fundamental ecological landscape to enhance the ecological functionality of this area.
Modified zoning based on ecological security patterns
Results of ecological security pattern construction
In terms of resistance values within the study area (Figure 9), regions exhibiting elevated resistance values are located primarily within the urban territories of Boai, Zhongzhan, Jiefang, Shanyang, Macun, and Xiuwu. Mining sites in the northern Taihang Mountains also have relatively high resistance values. Additionally, forested areas in the northern mountains typically display lower resistance, although some locations experience increased resistance due to pronounced surface relief. Relatively low resistance values are found in certain southern and central sections of the study area.
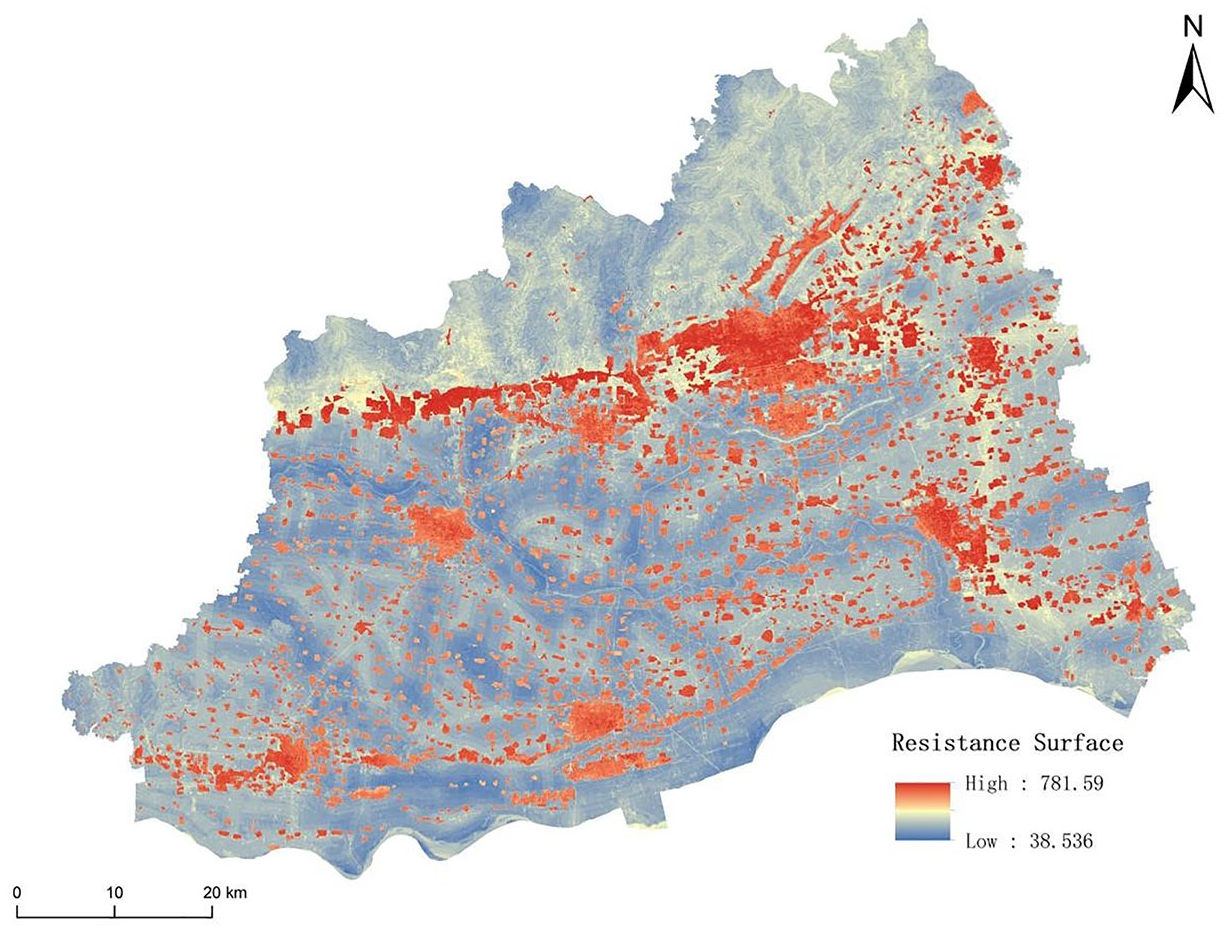
Ecological resistance.
A total of 57 ecological sources were identified (Figure 10), predominantly concentrated in the northern and southern regions of the city, with fewer sources located in the central area. The cumulative area of these ecological sources within the study area is 916.27 km2, which constitutes 23.06% of the total area of Jiaozuo City. Notably, Xiuwu County boasts the largest expanse of ecological sources, covering 273.74 km2, followed by Mengzhou and Qinyang, which have areas of 176.11 km2 and 151.89 km2, respectively. The most significant ecological source is situated within the Taihang Mountain Macaque National Nature Reserve, which spans Qinyang, Boai, Zhongzhan, and Xiuwu. This area is predominantly forested, with nearly the entire surface occupied by trees and various forms of vegetation, including approximately 200.50 km2, or 21.88% of the total ecological source area.
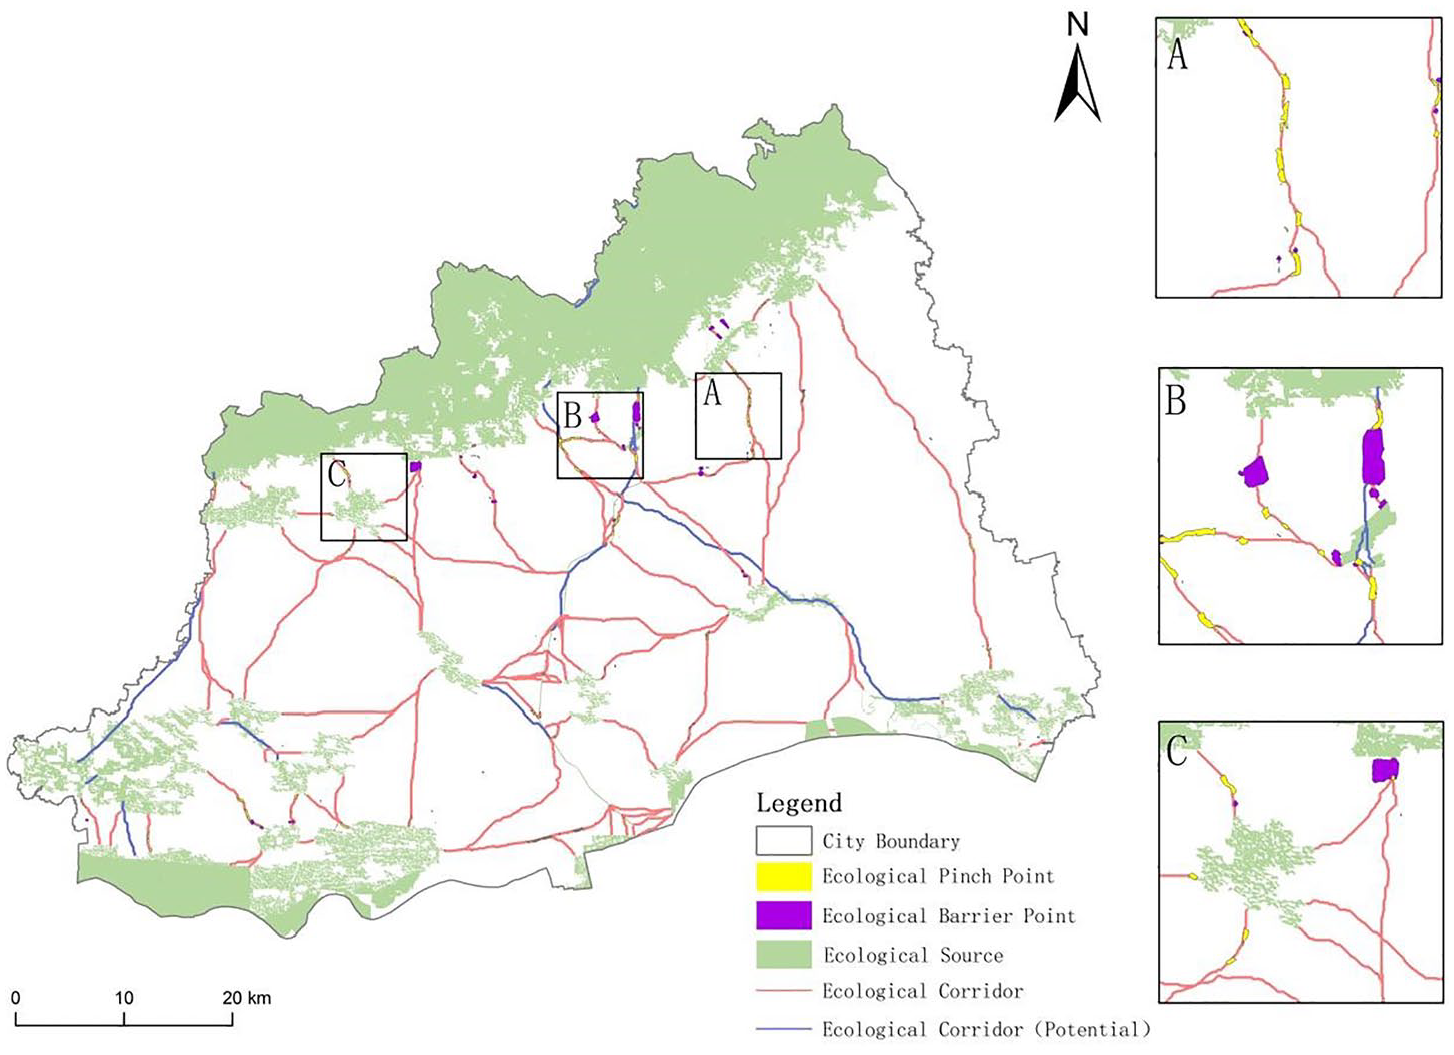
Spatial distributions of the ESP components.
A total of 164 ecological corridors were identified (Figure 10), with an overall length of 887.85 km, revealing a dense distribution throughout the study area. Among these corridors, 142 are classified as key corridors, totaling 716.28 km, which represents 80.68% of the entire corridor length. Additionally, there are 22 potential corridors measuring 171.57 km, accounting for 19.32% of the total corridor length. The distribution of land use types within the corridor varies considerably across different width ranges (Table A2), with built-up land increasing substantially as corridor width expands. At a 200 m width, the proportion of cropland decreases moderately, allowing for the introduction of more forest land, grassland, and water, which enhances vegetation cover and habitat space. Meanwhile, built-up land remains at 8.44%, effectively limiting human disturbance. A 200 m corridor width is thus deemed optimal for supporting bird populations and biodiversity (Zhu et al., 2005), as it facilitates species migration and ecological diversity protection in Jiaozuo City. Overall, these corridors effectively circumvent constructed areas, such as mining and residential zones, demonstrating a dense configuration across the study area.
The ‘pinch points’ (Figure 10) were identified in regions with high current density, resulting in the identification of 254 pinch point areas, covering approximately 5.32 km2. These pinch points are primarily concentrated in Wen, Boai, Wuzhi, and Qinyang. Furthermore, the ‘barrier points’ (Figure 10) were determined on the basis of areas exhibiting high values of the improvement coefficient, leading to the identification of 36 barrier points that collectively occupy approximately 4.84 km2. The barrier points are largely focused in Zhongzhan, Jiefang, Qinyang, and Boai.
Ecological zoning modification based on ESP
Among the ecological sources, the area designated the ecological key protection zone spans 295.41 km2, accounting for 32.24% of the total ecological sources. The ecological priority restoration zone covers 37.67% of the overall ecological sources and is situated within the Taihang Mountain Macaque National Nature Reserve and the Yellow River Wetland National Nature Reserve, which should be preserved as a unified priority area. The ecological key protection zone within the ecological corridor covers an area of 24.45 km2, which represents approximately 6.58% of the corridor’s total area. Additionally, the ecological priority restoration area covers 59.84 km2, accounting for 16.11% of the total corridor area. This restoration area is primarily concentrated in the northern sections of the ecological corridor, specifically in Boai, Zhongzhan, Jiefang, and Xiuwu (Figure 11).
Modified zoning based on the ecological security pattern.
Ecological sources and corridors collectively form a comprehensive ecological network with interconnected components that support the survival of living organisms while also increasing their environmental capacity. We designated the regions that included these ecological sources and corridors as key ecological protection zones, where we implemented the strictest measures for ecological protection and restoration. Furthermore, ecological pinch points play a crucial role in preventing habitat degradation, whereas eco-barrier points significantly influence connectivity between source areas and are vital during species migration. Accordingly, we included the areas identified as ecological pinch points and ecological barrier points within the key ecological protection zone, designating them as priority areas for ecological restoration.
Modified zoning based on urban construction space
Results of the spatial identification of urban construction space
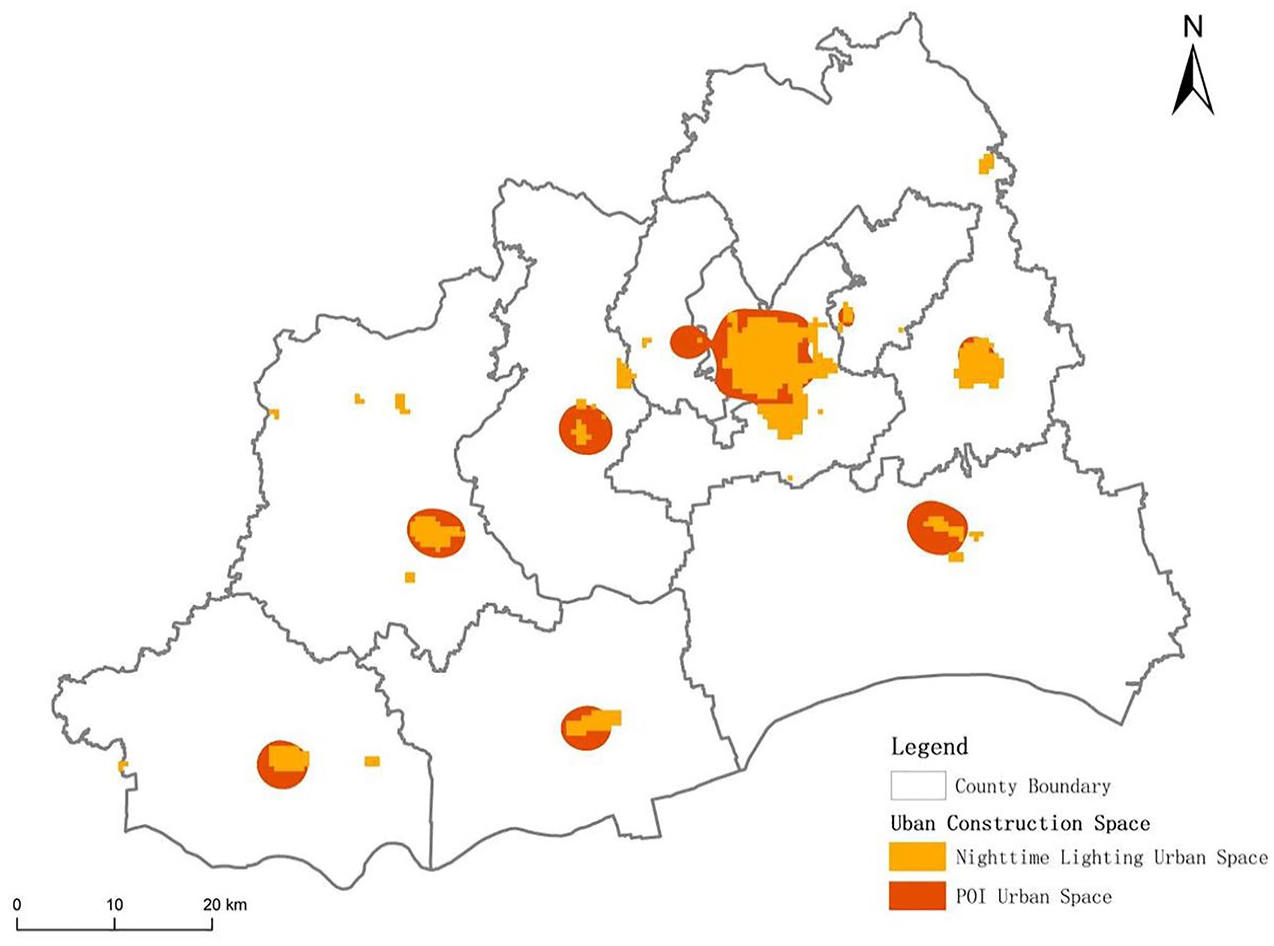
The selection of the bandwidth in the nuclear density analysis significantly influences the localized characteristics of the nuclear density distribution. In this analysis, a bandwidth of 2500 m was chosen to identify the urban construction space, effectively preserving the localized distribution characteristics while minimizing fragmentation.
Using the Densi-Graph curve, the corresponding nuclear density value is identified as the boundary of the urban construction space when a notable and irreversible increase in radius occurs. The built-up area is then extracted on the basis of the DN value derived from nighttime lighting data, confirming the recognition of the urban construction space. By integrating the identification results from both the POI data and nighttime lighting data, the urban construction space of the study area is ultimately defined (Figure 12), covering a total area of 209.11 km2. Comparisons reveal a high degree of overlap between the identified urban construction space of Jiaozuo City and the central construction lands of each county and district, indicating that the extraction results for urban construction space are both accurate and reasonable.
Results of spatial identification of urban construction space.
Optimization and adjustment of ecological restoration zones
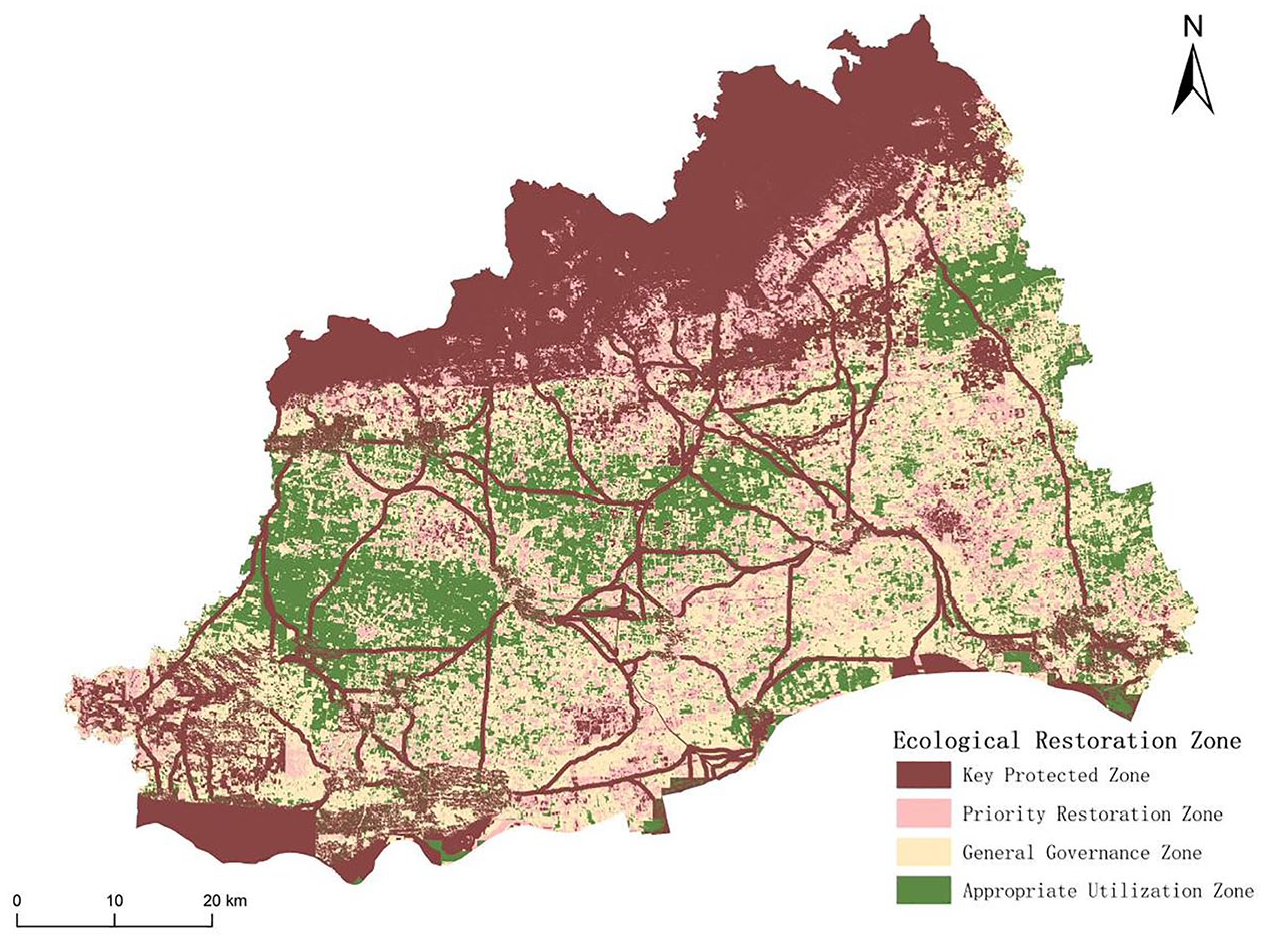
The study further refines and adjusts the ecological restoration zones on the basis of the findings from urban construction space identification. Following these adjustments, the area designated the ecological general management zone was reduced by 52.66 km2, whereas the ecological moderate use zone decreased by 6.91 km2. In contrast, the area of the new urban ecological restoration zone increased by 59.57 km2. Ultimately, the revised ecological restoration zones were categorized into five distinct types: ecological key protection zones, ecological priority restoration zones, ecological general management zones, ecologically appropriate utilization zones, and urban ecological restoration zones (Figure 13).
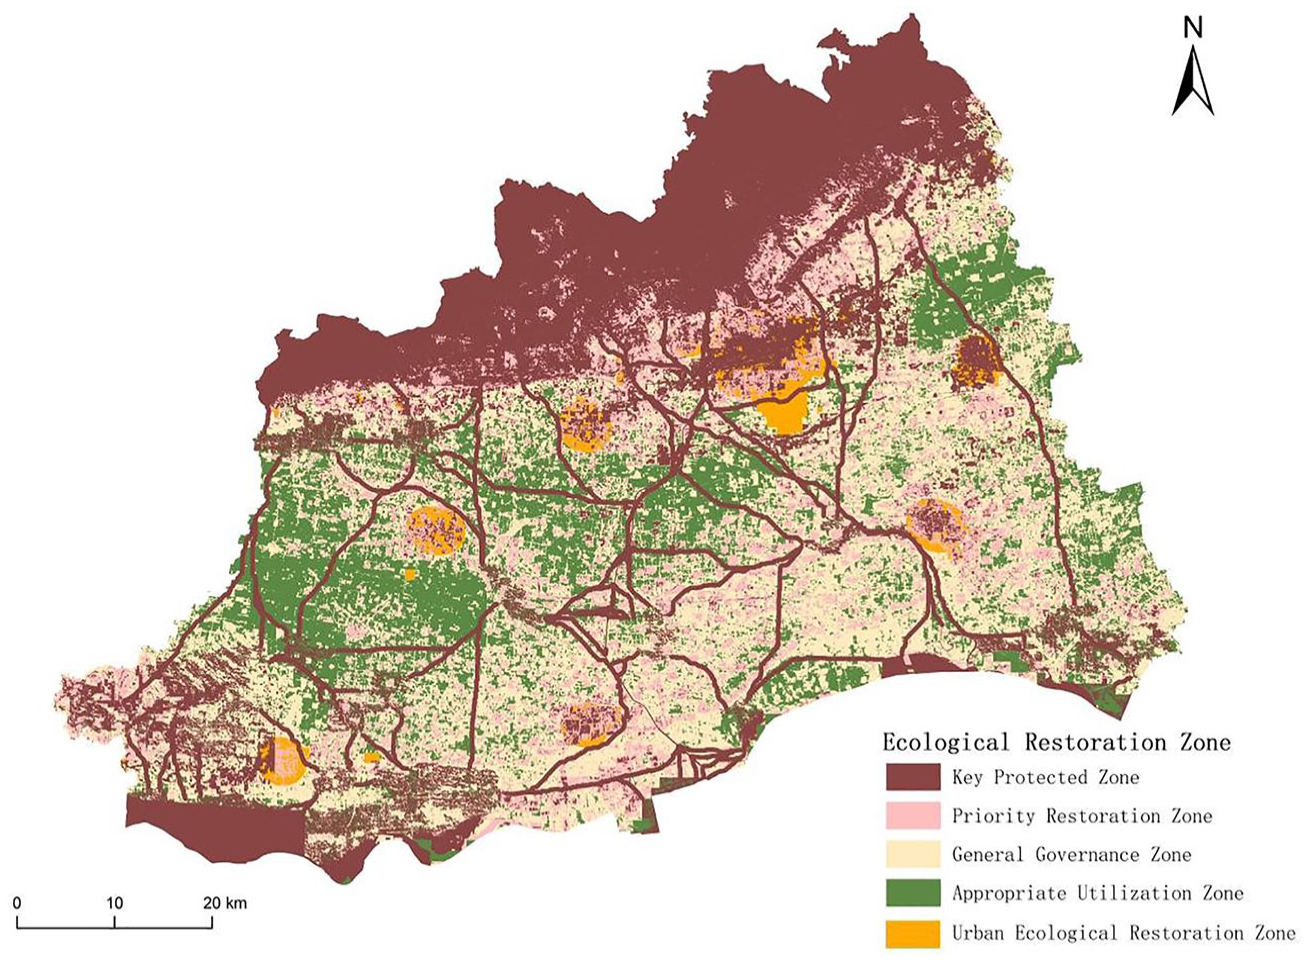
Ecological restoration zoning final results.
The ecological key protection zone serves as a critical ecological space essential for maintaining the fundamental functions of ecosystems and should be prioritized for protection. This zone is located primarily in the northern Taihang mountainous area of Jiaozuo, as well as in the southern beach area along the Yellow River. This zone has a total area of approximately 1590.06 km2, accounting for 40.03% of the overall study area, with dominant land use types including forests, grasslands, and watersheds. The ecological priority restoration zone represents a vulnerable ecological space that is prone to human interference, potentially leading to a range of ecological issues; thus, it should be prioritized for restoration efforts. This zone is mainly found in the shallow mountainous areas of the northern region. The total area of this zone is approximately 506.39 km2, constituting 12.75% of the overall study area. The predominant land use types are various grasslands, with some forestland in the northern mountainous areas and a small amount of cropland in the southern part of the study area.
The ecological general governance zone functions as a buffer-type ecological space, where land use efficiency can be enhanced to mitigate land use conflicts when necessary. This zone is widely distributed across the central and southern parts of the study area and is primarily situated in the central plain region. It includes a total area of approximately 1112.93 km2, representing 28.02% of the entire study area. The primary land use type in this area is cropland. The ecologically appropriate utilization zone is part of the development-friendly ecological space and is located primarily in the central and southern sections of the study area. This zone includes an area of approximately 756.32 km2, representing 19.04% of the total study area. The predominant land use in this region is construction land. The urban ecological restoration zone, which is classified within the urban ecological space, is situated mainly in the economically developed areas of various counties and districts. This zone covers approximately 6.91 km2, accounting for 0.17% of the total area of the study region, with a predominance of urban land use.
Discussion
Analysis of regional conflicts between urban construction and ecological restoration
Mitigating the conflict between construction land and ecological land has become a critical issue for sustainable regional development (Yan and Chen, 2023). Land use conflicts are not only social challenges but also geographical issues (Bao et al., 2021), requiring guidance through measures such as spatial planning (Zou et al., 2020). The key to harmonizing the space between economic development and ecological protection lies in identifying the conflict zones between the two (Hu et al., 2022). However, most existing studies primarily focus on identifying the drivers of conflict and lack a comprehensive consideration of the overall spatial development of the national territory (Jiang et al., 2020). In response, this study identifies spatial conflicts between urban construction areas and ecological land, and subsequently adjusts restoration zoning to develop a comprehensive approach that integrates socio-economic development with ecological protection. This approach is crucial for balancing urban sprawl and ecological conservation areas.
Key ecological protection zones and ecological priority restoration zones, which are integral components of crisis-type ecological spaces, are often at odds with urban development initiatives. These zones are crucial for maintaining ecological integrity. To preserve existing delineations, a strong emphasis is placed on ecological protection. In contrast, the ecological general management zones and ecologically appropriate utilization zones, which are categorized as buffer-type ecological spaces, are suitable for a moderate degree of efficient land use, provided that the ecological balance is maintained. Thus, the ecological general management zone and the ecological moderate utilization zone situated within urban development areas will be redefined as urban ecological restoration zones.
Specifically, 45.25% of the urban construction space is located within the key ecological protection zone, covering approximately 91.40 km2, primarily in the regions of Jiefang, Shanyang, and Xiuwu. Additionally, 25.25% of urban construction occurs within the ecological priority restoration zone, which spans approximately 51.00 km2 and is found mainly in Qinyang, Boai, Wuzhi, Jiefang, and surrounding districts. Furthermore, 26.07% is found in the ecological general governance zone, which includes approximately 55.66 km2 and is located primarily in Shanyang District and Mengzhou District. Finally, 3.42% fell within the ecologically appropriate utilization zone, spreading across an area of approximately 6.91 km2 (Figure 14). Overall, 70.5% of the area falls within the key ecological protection and ecological priority restoration zones, suggesting significant conflicts between ecological protection and restoration efforts and urban construction and development. This indicates a critical ecological space that emphasizes the necessity of prioritizing ecological protection, underscoring the importance of implementing ecological preservation and restoration initiatives alongside urban development. In contrast, 29.50% of the area is designated within the ecologically general governance and ecologically appropriate utilization zones, allowing for a certain level of efficient land use while maintaining ecological balance. This strategic reclassification aims to facilitate the rational development of urban construction, thereby promoting ecological protection while enabling moderate economic growth.
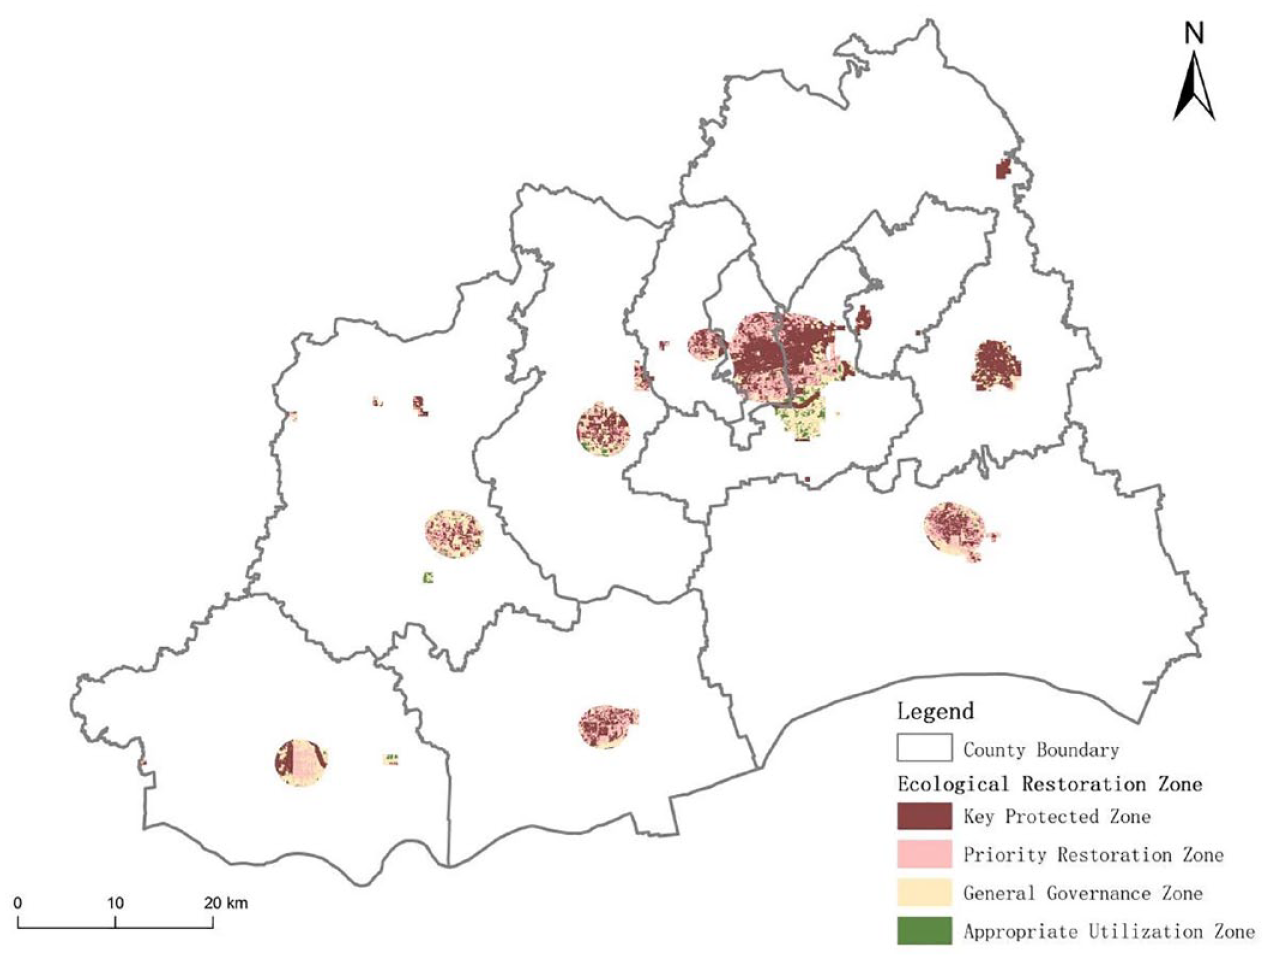
Spatial distribution of conflicts between urban construction space and ecological restoration.
Proposals for zoning management in three dimensions: Ecological risk, ESP and town building space
Targeted policies and restoration strategies are crucial for enhancing ecological health across different restoration zones (Bian et al., 2023; Bustamante et al., 2019). Therefore, this study formulates conservation and restoration strategies based on the specific needs and characteristics of each zone, which will effectively promote ecological restoration and foster more sustainable and resilient environments.
The ecological key protection zone boasts a favorable ecological environment and rich biodiversity, providing essential ecosystem services while exhibiting high resilience. The primary means of ecological restoration in the region is the protection and preservation of existing natural ecosystems (Chen et al., 2024b). The northern Taihang Mountains are characterized primarily by woodlands and grasslands, dominated by forests and shrublands, which include most of the ecological protection red line area. This region is home to several nature reserves, forest parks, and forest farms. Large-scale economic activities should be prohibited to prevent detrimental human disturbances from threatening the fragile ecological balance (Han et al., 2022). In contrast, the southern beach area along the Yellow River consists mainly of beachlands, river canals, and reservoirs, including the Yellow River Wetland National Nature Reserve. Here, ecological restoration measures focus on protection and conservation, and monitoring of key ecological nodes and networks should be strengthened to ensure the sustainable supply of ecosystem services (Ma et al., 2021).
The ecological priority restoration zone, situated in parts of the northern Taihang Mountains, is largely adjacent to the key ecological protection zone and plays a crucial role in buffering and safeguarding the integrity of ecological sources and nature reserves. In this region, restoration efforts should be prioritized, with natural restoration as the primary strategy, strengthening land use control, optimizing ecological landscape configuration, and improving ecosystem quality (Lemm et al., 2021). In cultivated southern areas, where ecological resilience is relatively low, a combination of natural and artificial approaches should be adopted to foster a seminatural farmland ecological environment. It is recommended to implement ecological restoration measures, such as returning farmland to forest projects and comprehensive soil erosion control, to enhance the ecological function of land resources (Li et al., 2021b).
The ecological general governance zone is predominantly composed of drylands, which feature relatively fragile ecosystems vulnerable to external disturbances and prone to degradation, as well as facing pollution and soil erosion challenges. In this region, artificial restoration measures, including agricultural land reorganization, the reclamation of paddy fields, and the redevelopment of old farmland into high-standard cultivation areas, are implemented, improving land use efficiency and establishing buffer zones between different ecological spaces to reduce the negative externalities of human activities (Xu et al., 2022).
The ecosystems within ecologically appropriate utilization zones are significantly degraded, which poses challenges for restoration through natural processes alone. Therefore, artificial restoration methods should be adopted in this area to restore the basic ecological landscape. This should be done while adhering to the principles of ‘low-impact’ development and construction, alongside the implementation of control measures that prioritize green development (Collin and Melloul, 2003) . Additionally, the presence of a mining area in the region exacerbates the degradation of the ecological environment, leading to issues such as soil erosion and ground subsidence. Focusing on the prevention and control of geological disasters, a combination of engineering measures and ecological approaches should be adopted to restore mine vegetation and strengthen the geological environmental protection and ecological restoration of mines (Li et al., 2024b; Wei et al., 2023).
In urban ecological restoration zones, the focus should be on balancing economic development with ecological protection. As we pursue economic growth, it is vital to reinforce the management of ecological spaces and safeguard critical waters and green landscapes within cities, encouraging the rational use of ecological resources, exploring various paths for the development of ecological industries, and promoting the integrated development of ecology and the economy (Yao et al., 2024).
Limitations and avenues for research direction
This study thoroughly examined the relationship between urban construction and ecological protection, focusing on the zoning of the ecological restoration of Jiaozuo City through four key dimensions: ecological risk, ecological resilience, ecological security patterns, and urban construction space. However, the study has certain limitations. First, the ecological corridor width of 200 meters requires further examination to assess its suitability for the specific conditions of the study area. Future research could strengthen the validity and scientific rigor of corridor width determination through a comprehensive analysis combining simulation experiments and field observations, thereby optimizing the construction of ecological security patterns. Second, the research characterized the spatial overlap between urban construction areas and ecological restoration zones as conflict areas without accounting for how the scale of the evaluation unit might influence these results. Future studies should explore the definition of conflict zones and the influence of scale on conflict zone identification. Furthermore, ecological restoration zoning was outlined on the basis of only two factors: ecological protection and urban construction. The incorporation of additional elements, such as geological hazards and human activities, into the zoning process is crucial. Future work should clarify the relationships among agricultural land, ecological land, and construction land. Additionally, the distribution of arable land resources should be considered within the ecological restoration zoning framework to refine the results and ensure a harmonious balance among production, living, and ecological spaces.
Conclusions
Taking Jiaozuo City as the study area, this study comprehensively assessed its ecological risk and resilience, developed ecological restoration zoning, and optimized it using the ecological security pattern and urban construction space, creating a framework for ecological restoration zoning that integrates ecological protection with socio-economic development. The results show that Jiaozuo City has a low overall ecological risk and a high level of ecological resilience. The ecological security pattern includes 57 ecological sources, 164 ecological corridors, 254 pinch points, and 36 barrier points. Using POI and nighttime lighting data, a total urban construction area of 209.11 km2 was identified. Finally, we outlined five categories of ecological restoration areas: ecological key protection zones, ecological priority restoration zones, ecological general governance zones, ecological appropriate utilization zones and urban ecological restoration zones. Different management strategies are necessary for various zoning types. This study is instrumental in fostering coordinated and sustainable ecological conservation alongside socioeconomic development in the study area.
Supplemental Material
sj-docx-1-tee-10.1177_2754124X251315132 – Supplemental material for Ecological restoration zoning based on ecological risk and resilience assessment: A case study of Jiaozuo City
Supplemental material, sj-docx-1-tee-10.1177_2754124X251315132 for Ecological restoration zoning based on ecological risk and resilience assessment: A case study of Jiaozuo City by Kexin Zhang, Ying Zhou, Jiabin Wang, Zhe Feng and Kening Wu in Transactions in Earth, Environment, and Sustainability
Footnotes
Annex
Area proportion of each land use type in different corridor widths (%).
| Land use type | Corridor width (m) | ||||||||
|---|---|---|---|---|---|---|---|---|---|
| 30 | 60 | 100 | 200 | 400 | 600 | 800 | 1000 | 1200 | |
| Croplands | 0.86 | 0.86 | 0.85 | 0.82 | 0.78 | 0.75 | 0.73 | 0.72 | 0.71 |
| Forest lands | 0.01 | 0.01 | 0.01 | 0.02 | 0.02 | 0.03 | 0.04 | 0.04 | 0.05 |
| Grasslands | 0.01 | 0.01 | 0.01 | 0.01 | 0.02 | 0.02 | 0.02 | 0.02 | 0.02 |
| Waters | 0.10 | 0.09 | 0.08 | 0.06 | 0.05 | 0.04 | 0.03 | 0.03 | 0.03 |
| Build—up lands | 0.02 | 0.03 | 0.05 | 0.08 | 0.13 | 0.16 | 0.18 | 0.19 | 0.19 |
| Unused lands | 0.00 | 0.00 | 0.00 | 0.00 | 0.00 | 0.00 | 0.00 | 0.00 | 0.00 |
Declaration of conflicting interests
The author(s) declared no potential conflicts of interest with respect to the research, authorship, and/or publication of this article.
Funding
The author(s) disclosed receipt of the following financial support for the research, authorship, and/or publication of this article: This work was supported by the General Program of National Natural Science Foundation of China [grant numbers 42371279], State Key Program of National Natural Science of China [grant numbers 42430705] and Henan Provincial Science and Technology Research Joint Fund [grant numbers 235200810045].
Supplemental material
Supplemental material for this article is available online.
Author biographies
References
Supplementary Material
Please find the following supplemental material available below.
For Open Access articles published under a Creative Commons License, all supplemental material carries the same license as the article it is associated with.
For non-Open Access articles published, all supplemental material carries a non-exclusive license, and permission requests for re-use of supplemental material or any part of supplemental material shall be sent directly to the copyright owner as specified in the copyright notice associated with the article.