
Abstract
The supply and demand of ecosystem services is a popular research topic, however, studies on ecosystem services related to hydropower are rare. We selected hydropower stations in the Lhasa River of the Qinghai-Tibet Plateau as the beneficiaries of hydropower development. We then identified three ecosystem services. We assessed the supply of ecosystem services and the demand of hydropower for them. Finally, we discussed the relationship between hydropower and watersheds.
The results demonstrated the following: (1) Water yield was 309.0 ± 110.3 mm, with a decreasing spatial pattern from the northeast to the southwest. Soil conservation was 119.2 ± 224.6 t/(hm2⋅a), with a spatial pattern that was high in the southeast and low in the northwest. Flood mitigation was 21.3 ± 2.9 mm, and the lower values were in lower elevation areas. (2) Hydropower has produced demands for the three services. The demand for the water yield of the five stations was 0.45 × 10⁸ m3 − 1.64 × 10⁸ m3. The demand for soil conservation from the Pangduo and Zhikong stations were 7.87 and 4.53 times their storage capacity, respectively. The demand for the flood mitigation of these two stations were 1.49 times and 1.09 times that of their flood regulation storage capacities. (3) The supply of the water yield service was greater than the demand for nearly the entire year, with an ecosystem supply and demand index between 4.73 and 14.06. The supply and demand of soil conservation services was nearly balanced. The flood mitigation service provided by the upstream ecosystem of Pangduo was 70.18 times the demand and 20.58 times the service of Zhikong. The results demonstrated that hydropower has a strong dependence on ecosystem services. This indicated that both enhancement and mitigation should be considered in the design payment of ecosystem service roles.
Keywords
Introduction
Ecosystem services are the benefits that ecosystems provide to humans (Costanza et al., 1997). The supply of ecosystem services refers to the capacity of ecosystems to provide a bundle of ecosystem goods and services within a given time period that is available for human enjoyment (Burkhard et al., 2012). Ecosystem demand refers to the type and quantity of services that human society expects from ecosystems for survival and development (Villamagna et al., 2013). Research on the relationship between supply and demand can identify the characteristics and changes in the spatial and temporal patterns of ecosystem services. By performing an evaluation of the ecosystem service supply and demand and by analyzing their correlation and coupling mechanism, we can more thoroughly understand and ensure ecosystem security and improve human well-being (Crossman et al., 2013).
In recent years, comprehensive research based on supply and demand has received attention, focusing on the balance of supply and demand and the spatial pattern (Lorilla et al., 2019). Currently, the primary methods that have been utilized to quantify the supply and demand of ecosystem services are the comprehensive index (Hossain et al., 2016), model evaluation (Boithias et al., 2014; Villa et al., 2014), public participation (Burkhard et al., 2009), land use estimation (Kroll et al., 2012; Serna-Chavez et al., 2014), and value evaluation (Wang et al., 2017). In the comprehensive index method, supply is primarily assessed using physical indicators such as the grain yield and water yield (Wu et al., 2022). Demand indicators are primarily sourced from consumption (Morri et al., 2014), vulnerability degree (Larondelle and Lauf, 2016), and public preference and willingness (Pena et al., 2015). The model evaluation method evaluates the supply and demand of ecosystem services by establishing the environmental parameters (Xiao et al., 2016). The land use estimation method is based on land use types according to the supply and demand characteristics of ecosystem services (Kroll et al., 2012). Valuation assessment methods quantify the supply and demand of ecosystem services in monetary terms. The public participation method is conducted by surveying stakeholders on their personal preferences, perceptions, and willingness to pay for ecosystem services. The empirical judgment method proposed by Burkhard (Burkhard et al., 2009) has been successfully applied to Bornhoveder Lake in Germany (Kandziora et al., 2013), Phang Nga Bay in Thailand (Kaiser et al., 2013), and the Yangtze River Delta in China (Tao et al., 2018; Tao et al., 2022). This method truly reflects the needs of different stakeholders.
Ecosystem services and their supply and demand relationships have been discussed at multiple scales and are primarily based on land-use changes and climate change. There are few reports in the literature regarding the relationship between the supply and demand of ecosystem services related to hydropower development, and there are few relevant studies from the perspective of energy companies such as hydropower stations. Most research has focused on the impact and restoration of hydropower projects on the ecological environment, such as biological community changes (Costea et al., 2021), slope stability (Li et al., 2015), and heavy metal deposition (Li et al., 2019).
The Lhasa River Basin is located in the central and southern portion of the Qinghai-Tibet Plateau. It is rich in hydropower resources and has a profound impact on the ecological security and human well-being of itself and its adjacent areas. With the acceleration of urbanization, large-scale and high-speed resource development has brought new challenges to the protection and sustainable development of the ecological environment, and the region is facing greater pressure on ecological protection. Based on the relationship between the supply and demand of ecosystem services, establishing a payment for an ecosystem mechanism and taking active measures to protect and restore the ecological environment of rivers is a realistic way to realize the sustainable development of hydropower (Tao et al., 2022). The socio-environmental impact of hydropower development has been well reported, while the dependence of hydropower development on ecosystems has been neglected for a long time. In this study, we assess the water yield, soil conservation, and flood mitigation services using the InVEST model. We quantify the demand for ecosystem services from hydropower plants and explore the supply and demand relationship between hydropower stations and ecosystems. The results will be helpful for promoting watershed protection and green hydropower development.
Material and methods
Study area
The Lhasa River is the largest tributary of the Yarlung Zangbo River. It originates from the southern foot of the middle section of the Nyainqentanglha Mountains, with a drainage area of 32,871 km2 and a river length of 568 km (An et al., 2021). The Lhasa River Basin belongs to the plateau temperate arid and semi-arid climate zone. The annual solar radiation intensity and daytime temperature vary greatly, and the average annual precipitation is approximately 650 mm (Huo et al., 2021). The average relative humidity is 45%, and the maximum snow thickness is 11 cm (Huo et al., 2021). The average altitude is approximately 4900 m (Huo et al., 2021), and the annual average flow is 288 m3/s (Cai et al., 2021).
Hydropower development in the Lhasa River Basin began in 1956, with the first station named the Duodi Hydropower Station. The Najin and Xianduo Hydropower Stations were then constructed to ensure the power supply of Lhasa City. After the Zhikong Hydropower Station was placed into operation in 2007, the cumulative installed capacity reached a maximum value of 278.97 MW in 2014. Currently, there are five hydropower stations in operation in the Lhasa River Basin, namely, Najin, Xianduo, Puntuo, Zhikong, and Pangduo, all of which are located on the main stream of the Lhasa River (Figure 1).
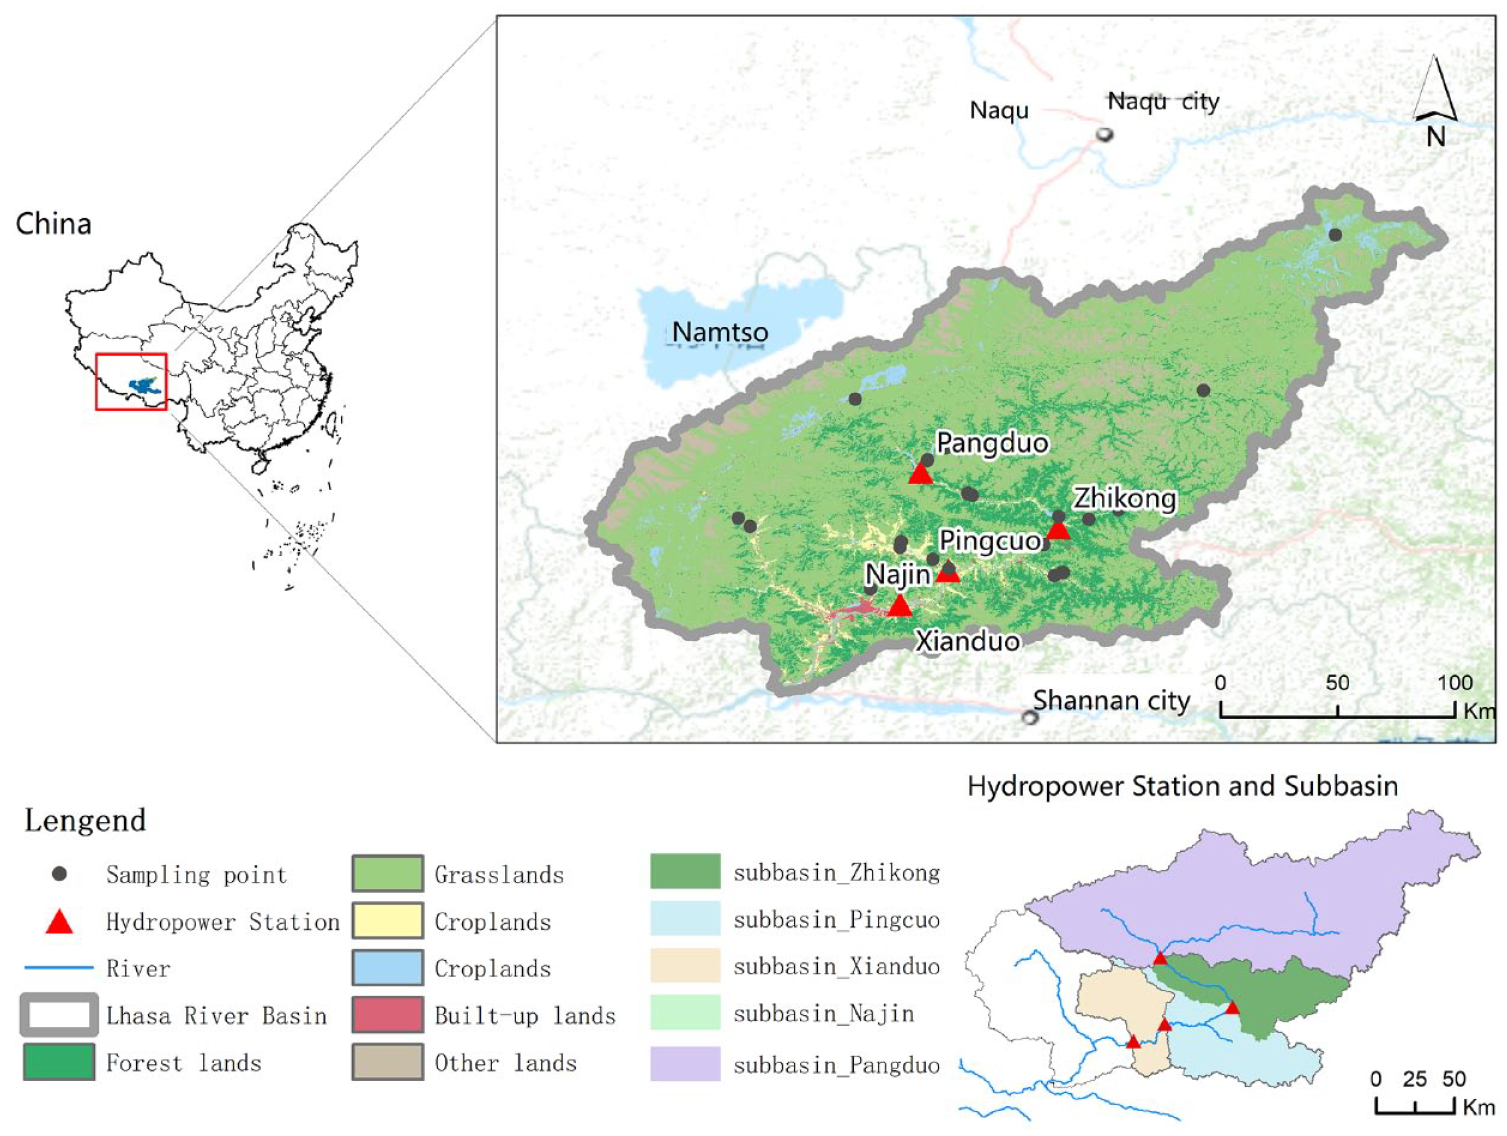
Hydropower stations and land use in the study area.
Data
From 10 to 21 May 2021, we investigated the major hydropower stations in the Lhasa River Basin. We collected relevant information regarding the hydropower stations in operation, including the dam parameters, the monthly power generation, and the installed capacity. Soil sampling was conducted at 32 points in the upper, middle, and lower reaches of the Lhasa River Basin to obtain the evaluation parameters of ecosystem services (Figure 1). The land cover data of the Qinghai-Tibet Plateau in 2000, 2010, and 2015 were obtained from a research project named “Second Comprehensive Scientific Expedition to the Qinghai-Tibet Plateau”. The land cover was divided into six categories, namely, forest land, grassland, cultivated land, water and wetland, construction land, and desert. The daily meteorological data were obtained from eight national meteorological stations near the Lhasa River Basin. The kriging interpolation was used to generate spatial meteorological data with a resolution of 30 m. The soil data were download from the China Soil Dataset v1.1 based on the World Soil Database (HWSD).
Ecosystem services assessment
Ecosystem service supply
Water yield
The water yield service depends on precipitation and evapotranspiration (Sellers, 1976). We used the InVEST water yield module to calculate the water yield of the ecosystem:


where

where Mi is the average water yield in month I;
Soil conservation
Soil conservation is an important service provided by ecosystems and is typically calculated by the difference in the potential soil erosion and the actual soil erosion:

where Ac is the soil conservation service,

where Ai is the soil loss per unit area (If CP = 0, Ai = Ap, otherwise, Ai = Ar); R is the rainfall erosivity factor; K is the soil erodibility factor; L is the slope length factor; S is the slope factor; C is the vegetation cover and management factor; and P is the factor of soil and water conservation measures.
Flood mitigation
According to the climate characteristics of the Tibet autonomous region, rainstorm events were selected with precipitation ⩾ 25 mm within 24 hours. The Soil Conservation Service (SCS) curve method was used to calculate the surface runoff caused by heavy rain. The amount of flood mitigation was obtained by subtracting the runoff from the rainstorm:


where
Ecosystem service demand
Water yield
The demand (

where W is the annual average power generation of the hydropower station (kWh); P is the total installed capacity of the hydropower station (kW); N is the output of the hydropower station (kW); H is the rated head of the hydropower station (m); K is the output coefficient, and the value range is 8.0−8.5 that is related to the efficiency of the unit, and the value of K is 8.2 in the calculation process; and h is the actual monthly power generation hours of the hydropower station.
Soil conservation
The value of soil conservation services lies in maintaining land productivity, reducing river siltation, and protecting the safety of water conservancy projects. This study aims to avoid loss of the storage capacity of hydropower stations, which is utilized as the demand for the soil conservation services (


where
The average annual loss rate of the reservoir capacity is related to many factors, including the operating parameters of the reservoir. According to related research (Deng et al., 2022), the annual loss rate is calculated using the reservoir operating time:

Najin Hydropower Station was built in 1965, with an installed capacity of 7.8 MW and a total storage capacity of 6.6 million m3 (Wu et al., 2000). Najin Reservoir is nearly silted up after having been in operation for 50 years. Therefore, the above fitting results can be corrected for Najin Reservoir using Equation 2-16 so that the quantitative relationship between the operating time of the reservoir and the average annual siltation rate is in line with the actual situation of the Lhasa River Basin. The corrected equation is below:


where
Flood mitigation
Hydropower stations with storage capacities can reduce flooding. However, owing to the limited storage capacity, a hydropower station also must deal with the threat of flooding. The difference between the potential floods and flood control storage was used as the demand for the flood mitigation services of hydropower stations

where
Relationship between the supply and demand of ecosystem services
We primarily analyzed the spatial and quantitative relationships of ecosystem services. The spatial relationship was analyzed using the sub-basins of hydropower stations, and the quantitative relationship was measured using the ecosystem supply and demand index (ESSDI), as calculated below:

where the ESSDI is the supply and demand ratio index of ecosystem services; and where ESS and ESD represent the supply and demand of ecosystem services, respectively. When the ESSDI is greater than 1.0, this is an oversupply of an ecological service. When it is equal to 1.0, this indicates a balance between supply and demand. When it is less than 1.0, this indicates a shortage of ecosystem services.
Results
Water yield
Supply of the water yield service
In 2000, 2010, and 2015, the total water yield in the Lhasa River Basin was 120 × 108 m3, 82 × 108 m3, and 98 × 108 m3, respectively, and the average value was 100 × 108 m3. Compared with the average annual runoff of the Lhasa River Basin of 88.6 × 10⁸ m3 (Wu et al., 2000), the relative error of the calculation was 12.9%.
Spatial pattern
The average value of the water yield services was 309.0±110.3 mm, and the spatial differences of the water yield services in the Lhasa River Basin were obvious (Figure 2). The water yield in the northeast of the basin was significantly higher than that in the southwest, and it showed a decreasing trend. The higher value area was distributed in Jiali County, Naqu County, and Biru County in the northeastern portion of the basin. The water yields reached 398.3, 380.4, and 375.1 mm, respectively, exceeding the average of the entire basin by 28.9%, 24.3%, and 21.4%, respectively. Chengguan District, located in the southwest, had the least water yield, with an average of 205.1 mm, and this was 33.6% lower than that of the entire basin.
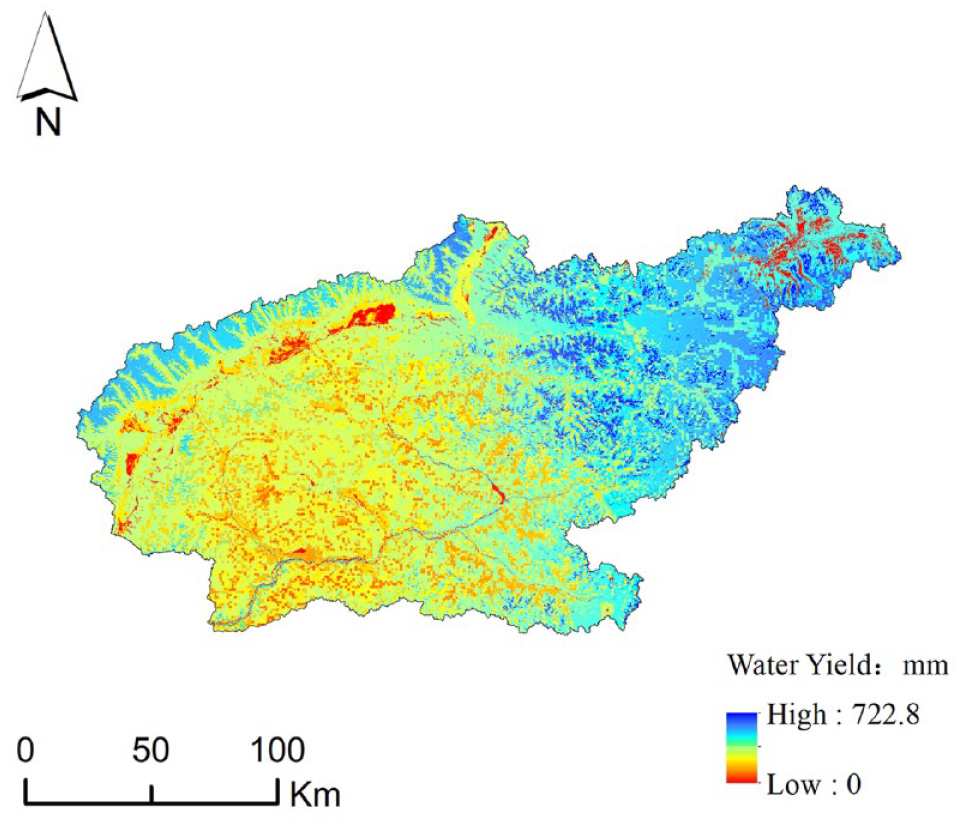
Spatial pattern of the water yield service (average in 2000, 2010, and 2015).
Variety with seasons
Based on the monthly average precipitation and actual evapotranspiration in 2000, 2010, and 2015, the monthly water yield was calculated. The results are shown in Figure 3, and they show obvious seasonal changes. The supply of the water yield services was primarily concentrated from July to September, of which the water yield in August reached 29.6% of the entire year. The month with the smallest water yield was December, which only accounted for 0.01% of the annual water yield.
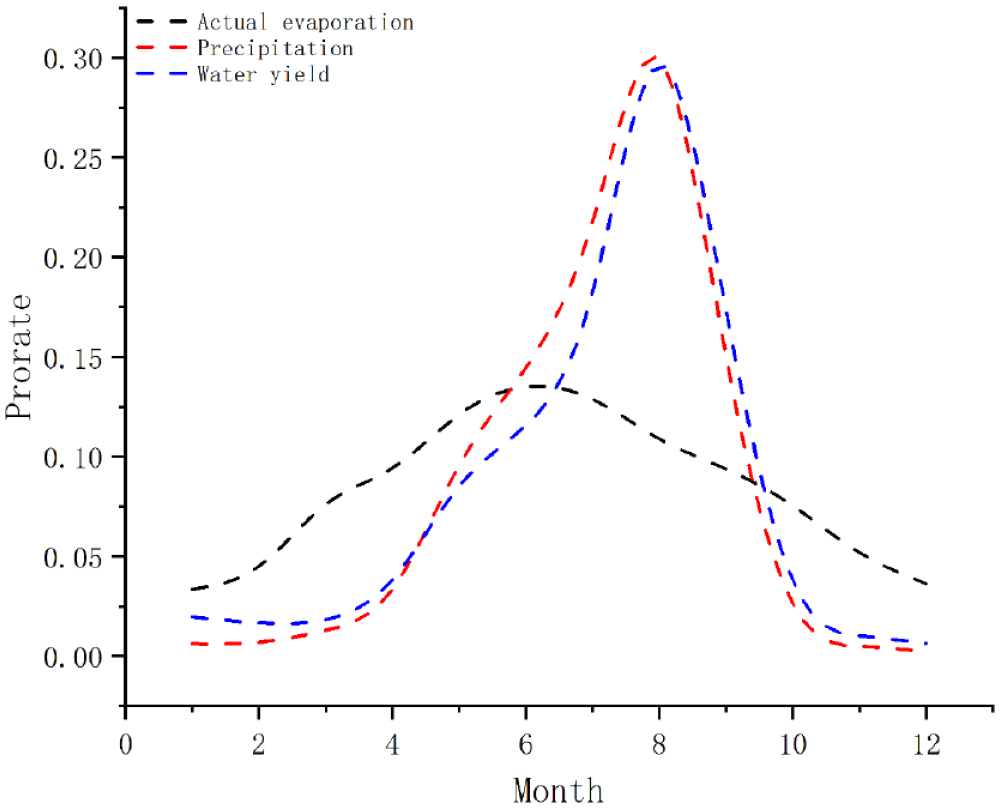
Changes in the water yield service supply in the Lhasa River Basin.
Demand for water yield services
The demands for ecosystem water yield services in the Najin, Xianduo, Pingcuo, Zhikong, and Pangduo stations were 1.64 × 10⁸ m3, 0.65 × 10⁸ m3, 0.79 × 10⁸ m3, 0.45 × 10⁸ m3, and 0.79 × 10⁸ m3, respectively. Using the average monthly actual water consumption for power generation in 2018 and 2019, the results are shown in Figure 4. The actual water consumption of the Najin and Pingcuo stations did not exceed the designed water consumption for the entire year, and the actual water consumption of the Xianduo station exceeded the designed water consumption in December. The actual water consumption of the Zhikong and Pangduo stations exceeded the designed water consumption from May to November, while it did not exceed the designed water consumption from January to April and in December.
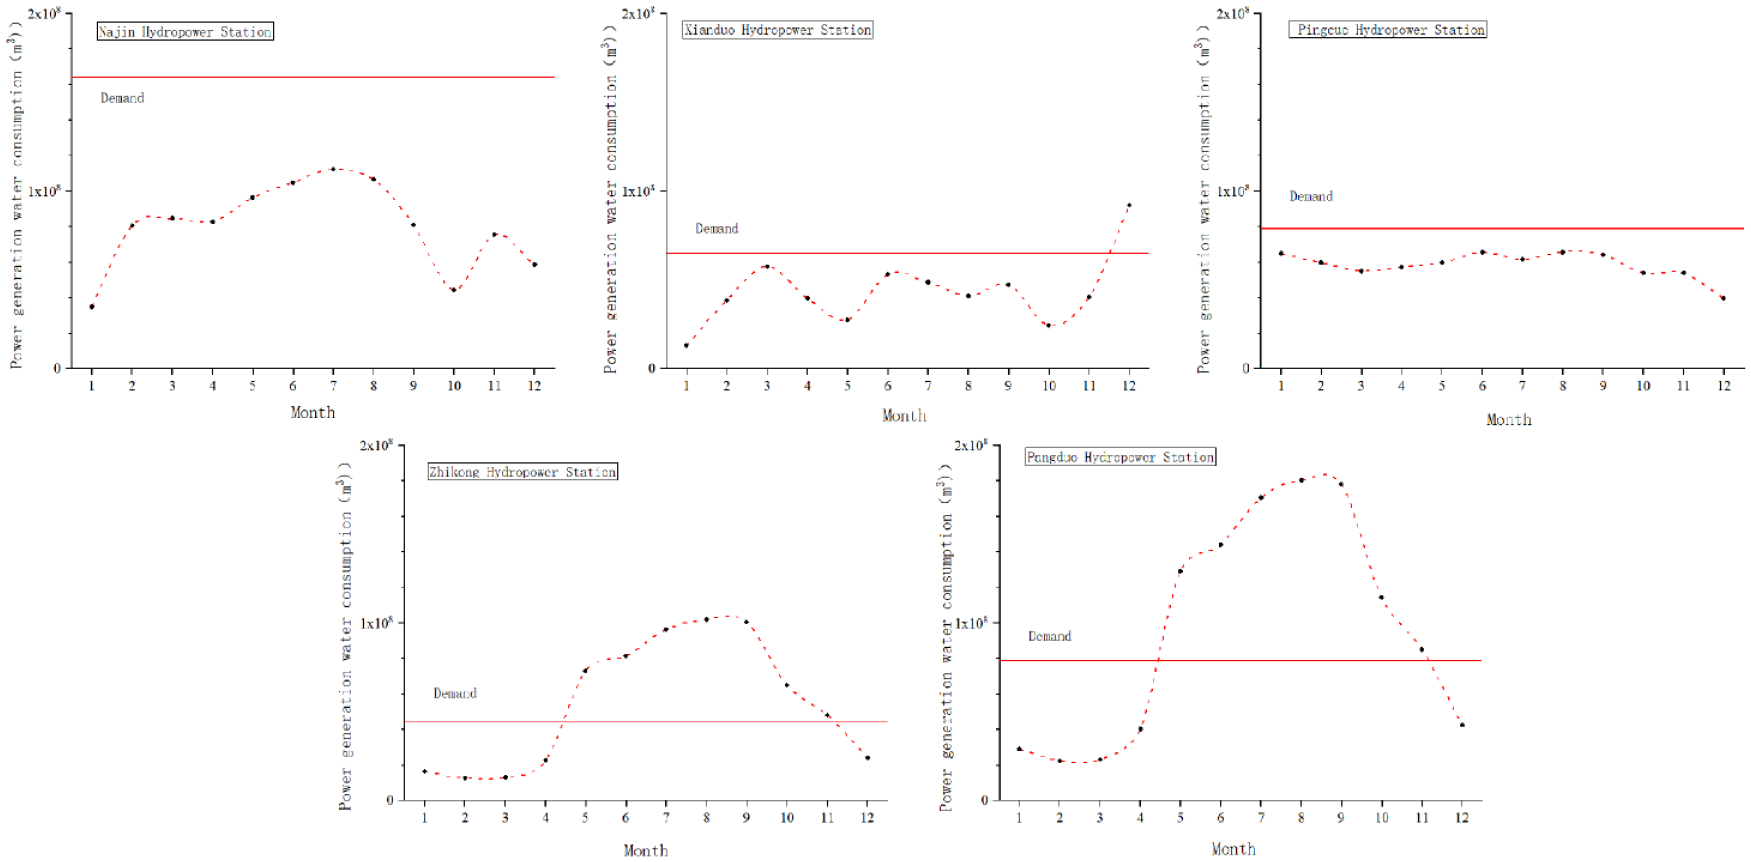
Demands of the hydropower stations for ecosystem water yield services (in the figure, the straight line represents the water demand of each power station, and the curve represents the actual water consumption).
Ecosystem supply-demand ratio index (ESSDI)
Figure 5 shows the supply of water yield was less than the demand for some hydropower stations during the dry season (for example, the ESSDIs of the Najin Hydropower Station were 0.95, 0.58, and 0.36 in February, November, and December, respectively), and the water yield services of the ecosystem were far greater than the demand of the hydropower stations for nearly the entire year (the annual average ESSDIs of the five hydropower stations were 4.73, 14.06, 6.68, 11.95, and 9.83, respectively). In addition, the ESSDI showed obvious seasonal changes, reaching a peak in August, in which month the supply-demand ratios of the Zhikong, Xianduo, and Pingcuo hydropower stations were 50.01, 42.5, and 34.98, respectively.
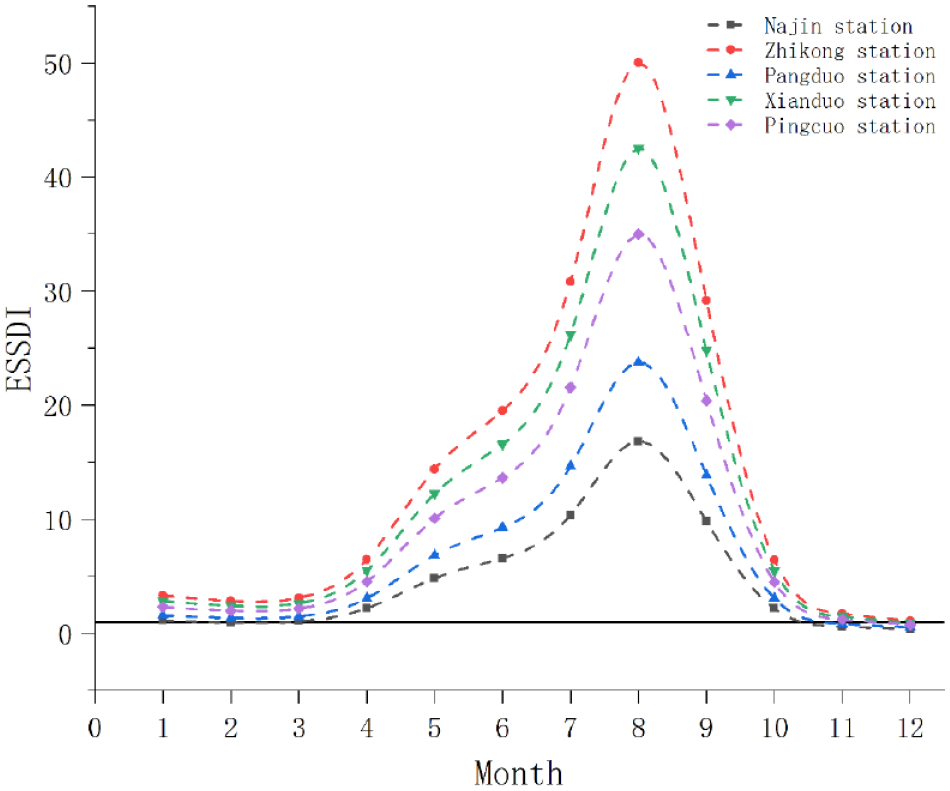
ESSDIs of the water yield service.
Soil conservation
Supply of the soil conservation services
The total amount of sediment entering the river in the Lhasa River Basin in 2000, 2010, and 2015 was 108.75 thousand tons, 807.2 thousand tons, and 870.4 thousand tons, respectively. The average value of soil loss from 2000 to 2015 was 92.17 thousand tons. Comparatively, the annual average suspended sediment observed was 115.6 thousand tons (Wu et al., 2000), and the relative error was 20.3%.
Spatial pattern
The average value of the ecosystem soil conservation was 119.2 ± 224.6 t/(hm2⋅a). The spatial distribution of the soil conservation in the Lhasa River Basin displayed a spatial distribution pattern of high in the southeast and low in the northwest (Figure 6). Soil conservation in the lower elevation areas was generally higher than those in the upper watershed. In 11 administrative districts, the Duilongdeqing district had the highest average soil conservation service at 156.15 t/(hm2⋅a), and Biru County in the northeast had the lowest soil conservation service at 24.5 t/(hm2⋅a).
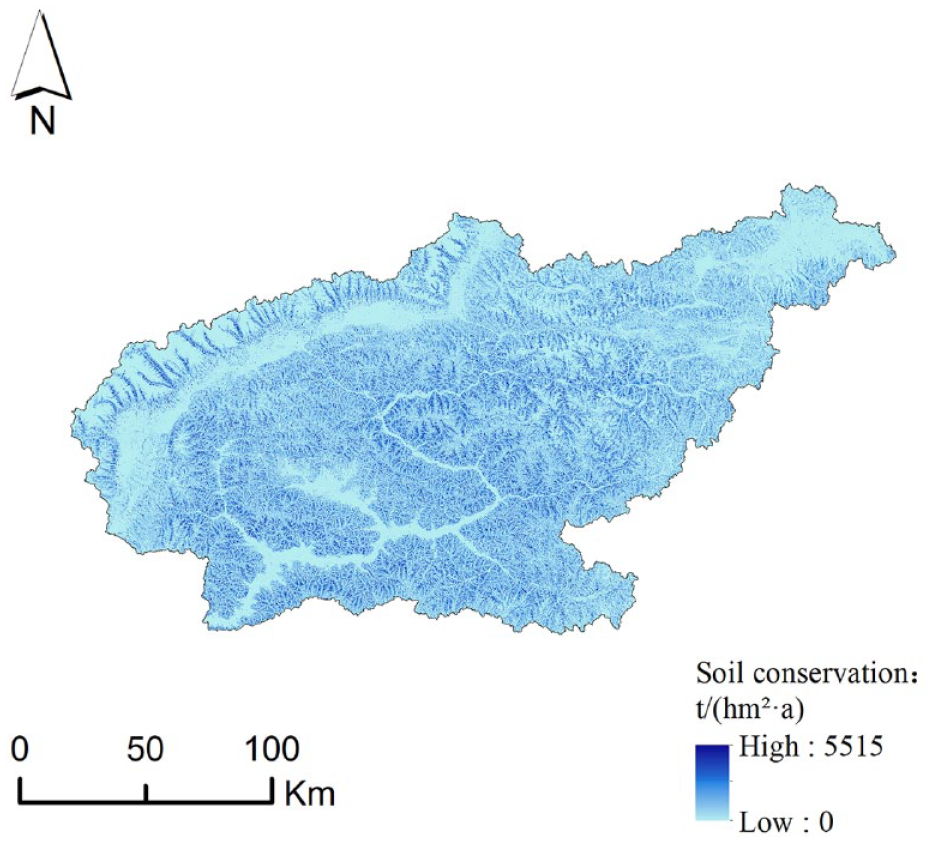
Spatial pattern of the soil conservation service in the Lhasa River Basin (averages in 2000, 2010, and 2015).
Variety with time
The soil conservation supplies by the ecosystem in the upper watershed of the Zhikong Hydropower Station in 2010 and 2015 were 8.96 × 10⁸ m3 and 9.38 × 10⁸ m3, respectively, with an increase of 4.69% in five years. In 2015, the supply of soil conservation services in the upper watershed of the Pangduo Hydropower Station was 6.89 × 10⁸ m3, which was 2.49 × 10⁸ m3 less than that of the downstream Zhikong Hydropower Station in the same year.
Demand for soil conservation
The Pangduo station is located in the middle reaches of the Lhasa River. The power station was built in 2014, with an installed capacity of 160 MW and a total storage capacity of 12.30 × 10⁸ m3. The Zhikong station is located downstream of the Pangduo Reservoir. The hydropower station was constructed in 2007, with a total installed capacity of 100 MW and a total storage capacity of 2.24 × 10⁸ m3 (Wu et al., 2000).
Figure 7 shows that in 2010 and 2015, the allowable silt storage capacities of the Zhikong Hydropower Station were 532.7 × 10⁴ m3 and 485.3 × 10⁴ m3, respectively, and the potential soil erosion amounts were 9.87 × 10⁸ m3 and 10.3 × 10⁸ m3, respectively. Therefore, the demands for soil conservation services from the Zhikong Hydropower Station were 9.82 × 10⁸ m3 and 10.27 × 10⁸ m3, which were 4.38 and 4.58 times its total storage capacity, respectively. In 2015, the simulated allowable siltation volume of the Pangduo Hydropower Station was 3247 × 108 m3, and the potential soil erosion volume simulated by the model was 7.7 × 10⁸ m3. Therefore, the demand for soil conservation of the Pangduo Hydropower Station in 2015 was 7.4 × 10⁸ m3, which was 7.87 times its storage capacity. This revealed that there was a greater demand for ecosystem soil conservation services in the Zhikong and Pangduo hydropower reservoir areas.
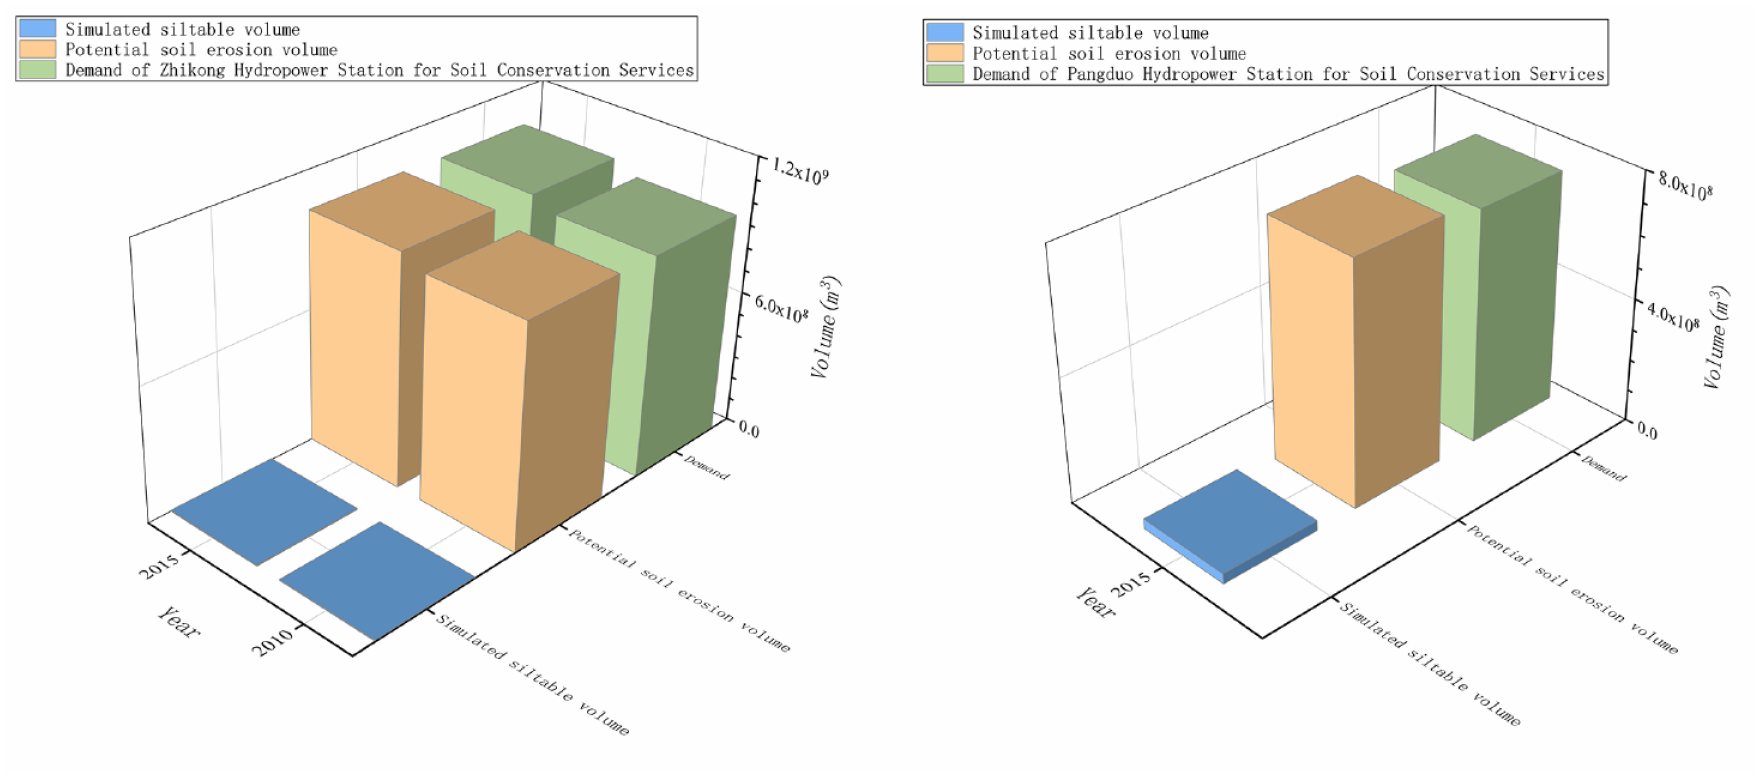
Demand of the hydropower stations for ecosystem soil conservation services (left: Zhikong, right: Pangduo).
Ecosystem supply-demand ratio index (ESSDI)
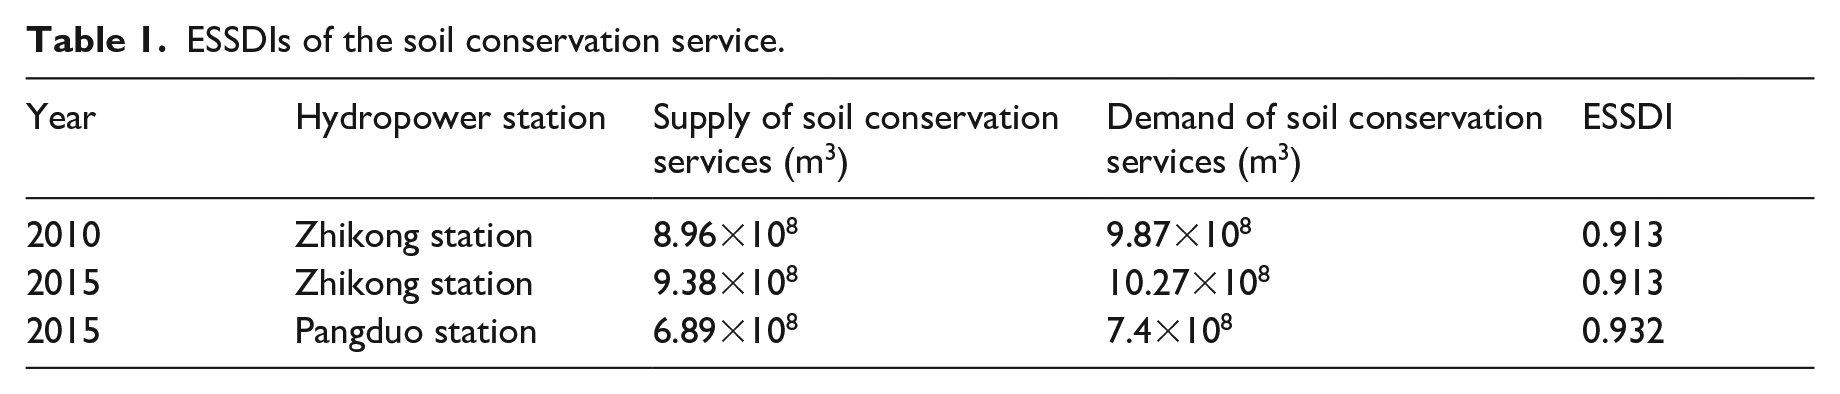
The ESSDI shows that soil conservation services play an important role in the operation of a hydropower station. In 2010, the total amount of soil conservation in the reservoir area of the Zhikong Power Station was 8.96 × 10⁸ m3, while the demand was 9.87 × 10⁸ m3; thus, the supply met 91.3% of the demand. By 2015, the demand had grown to 10.27×10⁸ m3, while the supply also kept growing, keeping the ESSDI at its original value. The Panduo Power Station was constructed in 2015. Because its storage capacity is larger than that of the Zhikong station, the soil conservation requirement is lower and is only 72.05% of Zhikong station. In addition, its soil retention supply was also smaller. However, the ESSDI was higher at 0.932. This indicated that the basin ecosystem had greatly reduced the storage capacity siltation loss of the Zhikong and Pangduo hydropower stations.
Flood mitigation
Supply of flood mitigation
Discovered by simulation, in 1996, the Jiali meteorological station recorded a maximum storm of 47.4 mm in 40 years (1978−2018). The flood volume calculated was 2.68×10⁸ m3, and the average flow was estimated as 3103.0 m3/s. Compared with the historical maximum flood flow in the Lhasa River Basin of 3000 m3/s (Wu et al., 2000), the relative error was 3.4%.
Spatial pattern
The spatial differences of flood mitigation services in the Lhasa River Basin was obvious (Figure 8). The high-value areas of flood mitigation services were distributed in the upper, middle, and lower reaches of the basin. For example, in most areas of Mozhugongka County, Sangri County, and Linzhou County, the average values of ecosystem flood mitigation were 21.88, 21.74, and 21.62 mm, respectively. The low values were primarily distributed in the lower elevations of the watershed, and the flood mitigation service in the Chengguan District was the smallest, but the average value still reached 19.56 mm.
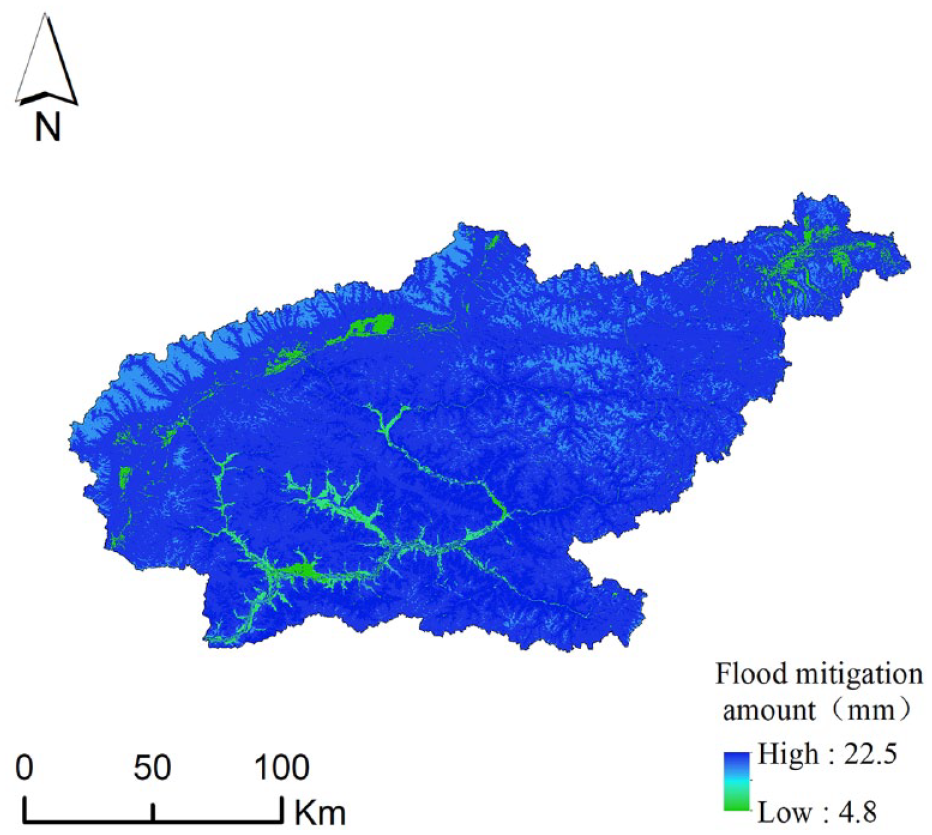
Spatial pattern of the flood mitigation service (average in 2000, 2010, and 2015).
Variety with time
The flood mitigation service supply to the Zhikong and Pangduo hydropower stations are shown in Figure 9. Among the 17 heavy rainstorms from 2008 to 2018, the flood mitigation service supply of the Zhikong Hydropower Station was generally higher than that of the Pangduo Hydropower Station, with averages of 5.51 × 10⁸ m3 and 4.43 × 10⁸ m3, respectively. Among them, on 28 July 2011 and 29 August 2018, the ecosystem provided the largest flood mitigation services for the Zhikong and Pangduo hydropower stations, reaching 6.63 × 10⁸ m3 and 5.09 × 10⁸ m3, respectively, which were 5.84 and 4.78 times their flood storage capacity, respectively.
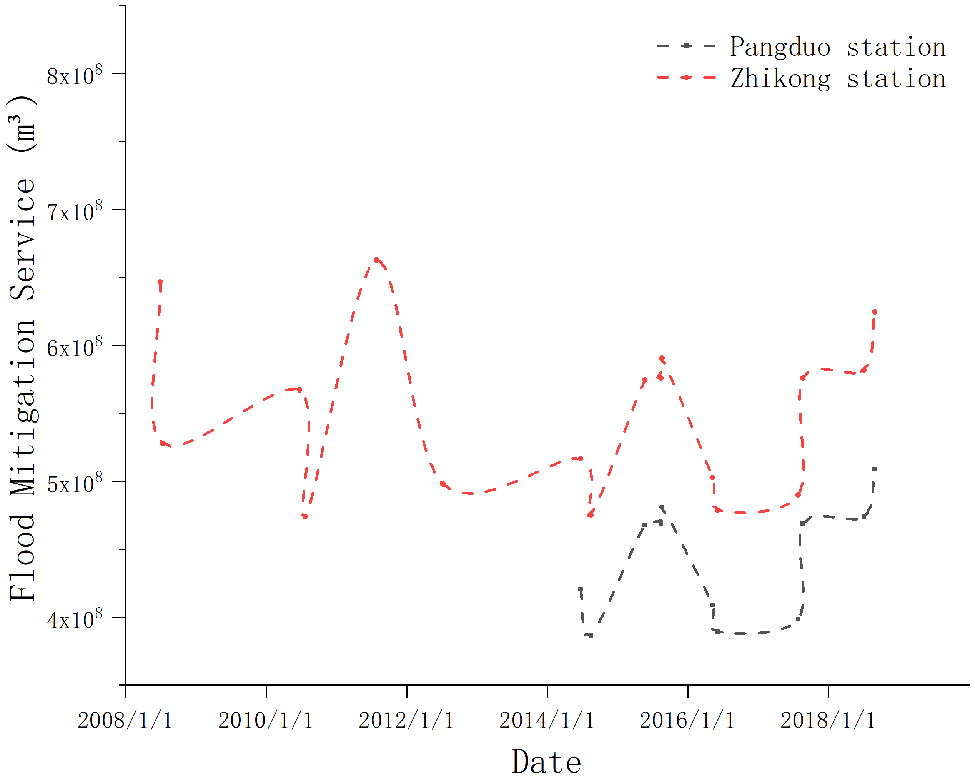
Flood mitigation services supplies of two hydropower stations.
Demand for flood mitigation
As shown in Figure 10, among the 17 rainstorms from 2008 to 2018, there were two rainstorms producing potential floods that exceeded the flood storage capacity of the Pangduo Hydropower Station. The average demand for flood mitigation services was 1.08 × 10⁸ m3, and the maximum demand for flood mitigation was 1.17 × 10⁸ m3, which was 1.09 times the flood regulation storage capacity. The potential flood volume of nine heavy rainstorms exceeded the flood control storage of Zhikong Reservoir, and the average demand for flood mitigation services was 1.27 × 10⁸ m3. The maximum demand for the potential flood volume of a single rainstorm was 1.72 × 10⁸ m3, which was 1.49 times the flood regulation storage capacity.
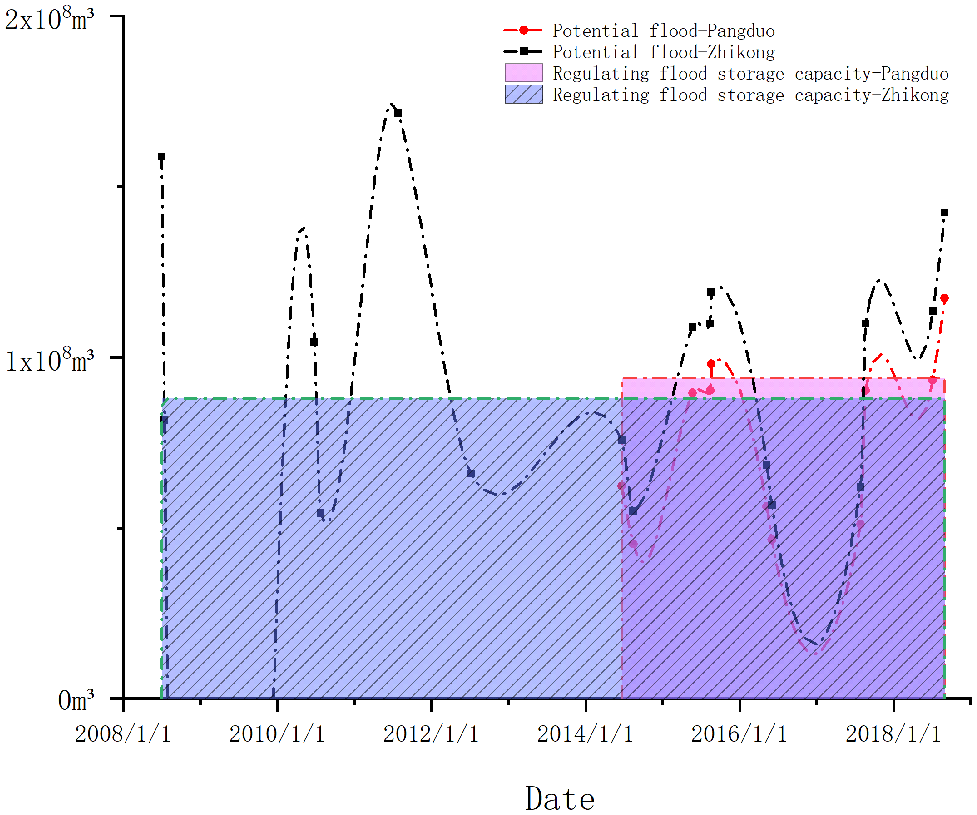
Demand of the hydropower stations for flood mitigation services.
Ecosystem supply-demand ratio index (ESSDI)
Among the 17 rainstorm events, the Pangduo Hydropower Station showed demand for the flood mitigation service in two storm events (Figure 11). The supply of the ecosystem flood mitigation service was greater than the demand in each rainstorm event. The average ESSDI was 70.18, the maximum was 118.52, and the minimum was 21.84. Among the nine rainstorm events of the Zhikong Hydropower Station, a total of nine times the supply was greater than the demand. The average ESSDI was 20.58, the maximum was 34.7, and the minimum was 7.93. Flood mitigation services in the Lhasa River Basin completely eliminated the flood risks of the Pangduo and Zhikong hydropower stations.
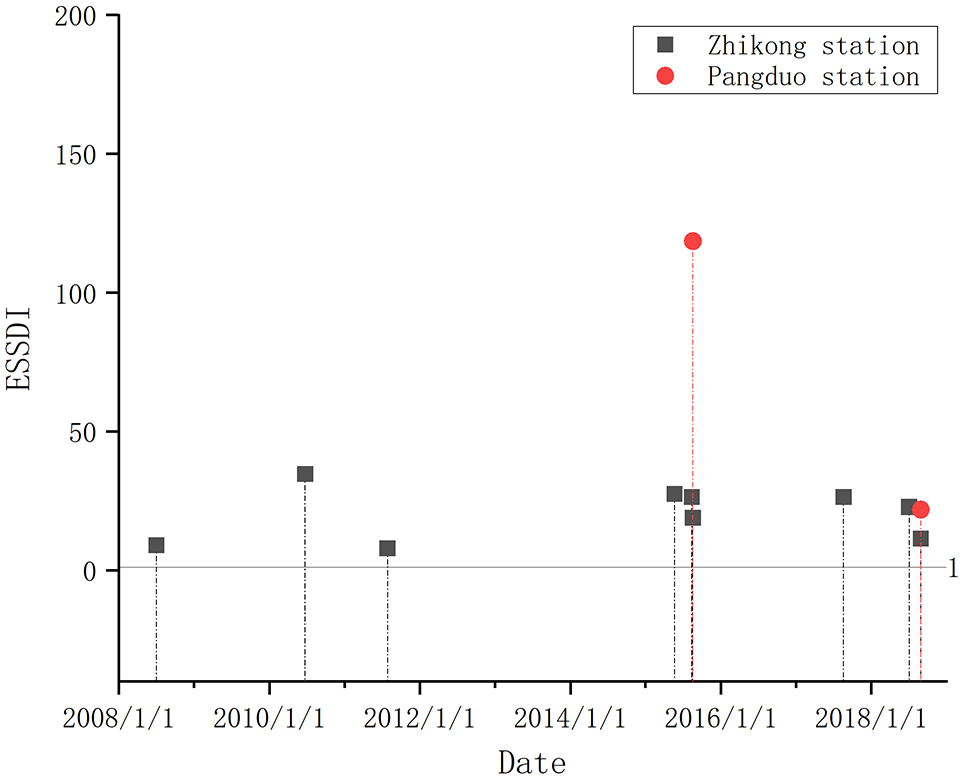
ESSDIs of flood mitigation service for two stations.
Discussion
Insights into supply and demand for ecosystem services
The relationship between the supply and demand of ecosystem services has been a popular research topic in recent years. Investigations have included subjects such as the balance of supply and demand (Burkhard et al., 2012) and the spatial distribution and gradient difference of supply and demand (Lorilla et al., 2019). This type of research that integrates supply assessments and demand assessments is not only conducive to understanding the driving force of ecosystem service changes, but also provides a basis for regulating the supply and demand relationship of ecosystem services. However, the research on the relationship between supply and demand has primarily been conducted at the regional scale (Kroll et al., 2012), which leads to a lack of clarity regarding the primary stakeholders. In addition, it is difficult to understand the formation process of the relationship between supply and demand. We found that even large hydropower plants have a large demand for flood mitigation services (Figure 10), changing our perception that flood control is primarily dependent on dams. However, determining how to consider the effect of sediment on turbines (Fang et al., 2019) and the erosion of the riparian zone in the reservoir area (Wang et al., 2018) still requires more in-depth research. In addition, in the future, it is necessary to strengthen the research on the changing characteristics of ecosystem service demand clusters, trade-offs, and synergies at different spatial scales (Shen et al., 2021) so as to coordinate the supply and demand relationships of the different types of ecosystem services in different regions and maximize the benefits of ecosystem services.
Watershed ecosystem services are critical to the sustainability of hydropower development
We found that hydropower plants were direct beneficiaries of ecosystem services. Ecosystem water yield services enable hydropower stations to continuously obtain runoff for power generation, and flood regulation and soil conservation are also key ecosystem services for hydropower dams to avoid the negative effects of sedimentation (Zhu et al., 2022). The supply and demand of ecosystem services in the Lhasa River Basin was analyzed, and the results showed a surplus state. This was consistent with the existing related research results (Xu et al., 2020). In addition, it is found that hydropower stations have great demands for ecosystem water yield services, soil conservation services, and flood mitigation services. In an entire year, the water yield service of the ecosystem was far greater than the design water demand of the hydropower station, and the supply-demand ratio curve showed obvious seasonal changes, reaching a peak in August (Figure 5). Ecosystem soil conservation services mitigated soil deposition by 91.3% and 93.2% for the Zhikong and Pangduo hydropower stations, respectively (Table 1). The watershed ecosystem mitigated 100% of the flood risks in the Pangduo and Zhikong hydropower reservoir areas (Figure 11). This has changed the past inherent understanding that hydropower stations are only influencers of the ecological environment (Huang, 2004). Ecosystems help hydropower stations reduce reservoir sedimentation and flood risks and provide stable runoff during dry seasons, greatly enhancing the sustainability of hydropower stations. Therefore, hydropower enterprises need to pay attention to the huge amount of well-being provided by the upstream ecosystem and actively participate in the ecological protection of the upper basin.
ESSDIs of the soil conservation service.
Payment for ecosystem services in hydropower development watershed
In China, the central and local governments have always been the primary stakeholders for the payment for ecosystem services (Dajie et al., 2005). Owing to the lack of research, it was impossible to clarify the relationship between the stakeholders in payments for ecosystem services (PES), which weakens their implementation. Hydropower development has provided many benefits such as power supply, flood control, water supply, and irrigation. However, the realization of these benefits depends on water conservation, soil conservation, and other services provided by the upstream ecosystem. Our results proved that hydropower stations are direct beneficiaries in watershed protection by analyzing the relationship between supply and demand. The PES for hydropower development are primarily aimed at the downstream environmental impact, and upstream protection compensation is rarely considered (Zhu and Fu, 2021). Therefore, it is extremely necessary to conduct hydropower PES that would promote the coordination of hydropower development and watershed protection.
Limitation and further research
Since the sustainable supply of water resources is very important to meet the year-round demand for hydropower production, seasonal changes in the supply and demand relationship of water conservation services can be improved by using the InVEST seasonal water production model. The supply capacity, demand intensity, and supply and demand index of ecosystem services are affected by many factors, including natural and socio-economic factors. Therefore, it is necessary to identify the key driving factors of ecosystem services, explore the influence paths, effect, and degree of influence of different driving factors on the supply and demand relationship of ecosystem services (Shen et al., 2021). In addition, there is a need to study the comprehensive action mechanism of the driving factors (Wanxu et al., 2022). This is of great significance for the sustainable utilization of regional resources, the coordination of supply and demand of ecosystem services, and the maximization of ecosystem service benefits.
Conclusions
Since there is a lack of quantitative analysis methods, it was difficult to analyze the impact of ecosystem services on hydropower development. We developed a methodology for supply and demand analysis of ecosystem services for hydropower development. This approach was based on the service supply assessment of the InVEST model and included demand identification for hydropower plants and spatial analysis of supply and demand relationships. Our results showed that ecosystems in Qinghai-Tibet Plateau can provide high-value water services, which were critical for the sustainable operation of hydropower plants. The results proved that hydropower plants were direct beneficiaries of watershed ecosystem services due to their high dependence on ecosystem services provision. Our approach was valid for revealing the supply-demand relationship of ecosystem services in the context of hydropower development. The result suggests that hydropower development companies have the responsibility to protect and restore upstream ecosystems and maintain the supply of ecosystem services.
Footnotes
Declaration of conflicting interests
The author(s) declared no potential conflicts of interest with respect to the research, authorship, and/or publication of this article.
Funding
The author(s) disclosed receipt of the following financial support for the research, authorship, and/or publication of this article: This work was supported by the Second Tibetan Plateau Scientific Expedition and Research Program (STEP) [grant numbers 2019QZKK0307]; and the ecosystem services flow based on the cascade process [grant numbers 32071664]