
Abstract
Navigating the trade-offs between ecological restoration and anthropogenic land-use is a defining challenge for fragile ecosystems like the Qinghai-Tibet Plateau (QTP). To address this challenge, this study introduces an integrated spatial modeling framework that moves beyond single-objective planning to simultaneously balance multiple ecological and economic goals. By fusing process-based models (DTVGM, MUSLE, InVEST) with advanced algorithms (NSGA-III, PLUS), we identified optimal land use configurations under three CMIP6 climate scenarios (SSP1-2.6, SSP2-4.5, and SSP5-8.5), with highly consistent results across scenarios; therefore, SSP2-4.5 is presented as the representative case in the main analysis. Our results uncover significant synergies, projecting major enhancements in water retention, soil conservation, and carbon storage alongside vast spatial restructuring of landscapes—including extensive forest gains in the Yangtze River Source Region and large-scale grassland restoration in the west QTP. Critically, the study pinpoints regions of economic trade-off, such as the pastoral areas of western Sichuan, providing transparent guidance for targeted policy intervention. This work delivers a scalable tool for aligning China’s national restoration projects with global initiatives like the UN Decade on Ecosystem Restoration.
Keywords
Introduction
Ecosystem degradation driven by global climate change and intensified anthropogenic disturbances has emerged as one of the most pressing challenges threatening sustainable development and human well-being worldwide (Liu et al., 2023a; Wang et al., 2022a). In response to this global environmental crisis, the United Nations General Assembly declared 2021-2030 as the “UN Decade on Ecosystem Restoration,” emphasizing the urgent need to prevent, halt, and reverse ecosystem degradation across all continents and oceans (UN General Assembly (73rd sess. : 2018-2019), 2019: 6). Within this global context, China has positioned ecological restoration as a cornerstone of its national strategy, implementing ambitious programs such as the Master Plan for Major National Projects to Protect and Restore Important Ecosystems (2021-2035) and establishing ecological red lines covering over 25% of the country’s territory (Fu et al., 2023; Liu et al., 2023b). Central to these efforts is the Qinghai–Tibet Plateau (QTP), often referred to as the “Third Pole” and “Water Tower of Asia,” which serves as a critical ecological barrier and freshwater supply source for over two billion people across Asia (Li et al., 2023b; Luo et al., 2022).
The Qinghai-Tibet Plateau’s (QTP) unique geographical position and extreme environmental conditions make it exceptionally vulnerable to the combined pressures of climate change and anthropogenic disturbances, resulting in accelerating degradation of critical ecosystem functions(Wang et al., 2020a; Yao et al., 2018). In recent decades, the QTP has experienced significant warming, with annual mean temperatures increasing at a rate of 0.13 °C per decade, which is approximately double the global average warming rate (Zhang et al., 2023; Zhu et al., 2023). This warming has triggered cascading environmental changes, including accelerated glacial retreat, widespread permafrost degradation across the plateau, and altered precipitation patterns that have fundamentally disrupted the region’s hydrological cycles and water retention capacity (Li et al., 2023a; Wang et al., 2022b; Zhu et al., 2024). Simultaneously, intensifying human pressures from factors like livestock overgrazing, agricultural expansion, and infrastructure development have exacerbated ecological stress, such that warm-season livestock densities in the pastoral regions of the central and eastern QTP exceed 100–200 standard sheep units per 500 m grid (Cao et al., 2019; Liu et al., 2022a; Xu et al., 2024; Zhan et al., 2023). The convergence of these climatic and anthropogenic drivers has led to widespread ecosystem service degradation, including grassland deterioration affecting the majority of pastoral areas, soil erosion rates increasing markedly in vulnerable zones, and carbon storage capacity declining substantially due to permafrost thaw and vegetation loss (Huang et al., 2024; Tian et al., 2023; Wang et al., 2020b). These pressures have created fundamental conflicts between ecological conservation needs and anthropogenic land-use demands, highlighting the urgent need for landscape-scale reconciliation approaches that harmonize ecological restoration with sustainable land-use practices.(Fu et al., 2023; Hou et al., 2024; Liu et al., 2023c).
Extensive research has investigated ecosystem services and land-use change across the QTP, contributing valuable insights into the complex relationships between human activities and ecological processes (Jia et al., 2023; Sun et al., 2020). Previous studies have predominantly focused on specific ecosystem types such as grasslands, forests, or wetlands (Hou et al., 2024; Wang et al., 2023), with particular attention to localized regions including the Three Rivers Source Area or individual river basins. (Liu et al., 2022b; Sheng et al., 2019; Su et al., 2019). Regarding specific functional types, scholars have also analyzed ecological functions on the QTP, including the ecosystem service of water retention, soil conservation, and carbon storage (Luo et al., 2022; Tang et al., 2018). Existing research has predominantly focused on historical trends and contemporary evaluations, yielding a comprehensive understanding of the spatiotemporal evolution of the QTP ecosystem and its services (Li et al., 2023; Lin et al., 2021). Nevertheless, current research still exhibits several limitations. Although studies have examined climate change impacts on Tibetan Plateau ecosystem services, systematic assessment of ecosystem multifunctionality synergies and the robustness of such synergies across multiple future climate scenarios remains limited (Luo et al., 2022; Tang et al., 2023). Furthermore, current research on optimizing ecosystem multifunctionality is often regionally confined, lacking spatial optimization frameworks applicable to the entire QTP (Xin et al., 2024).
Addressing these critical knowledge gaps is essential for evidence-based decision-making in sustainable landscape management on the QTP. This study develops an integrated spatial optimization framework for this purpose by integrating the quantification of critical ecosystem functions—including the ecosystem service of water retention, soil conservation, and carbon storage—into a multi-objective spatial optimization model. The framework systematically reconciles ecological restoration priorities with anthropogenic land-use demands under multiple future climate change scenarios to explicitly account for climate uncertainty. This study contributes significantly to holistic ecosystem management by establishing a novel landscape-scale spatial optimization framework that provides comprehensive solutions for integrated ecosystem management. The multi-objective optimization approach provides robust analytical tools for quantifying trade-offs between competing ecosystem functions and economic considerations (Manning et al., 2018). In addition, we evaluate the sensitivity of the optimized allocation to climate-scenario uncertainty by comparing solutions under multiple SSP (Shared Socioeconomic Pathway) pathways, thereby strengthening the robustness of planning recommendations. This study is anticipated to provide crucial scientific evidence for policy formulation and spatial planning initiatives across the QTP, supporting China’s ecological civilization strategies and advancing ecosystem restoration and climate change adaptation efforts.
Materials and methods
Study area
The Qinghai-Tibet Plateau (QTP), located in southwestern China (26°00′-39°47′N, 73°19′-104°47′E), is the largest and highest plateau in the world, covering approximately 2.6 million km2 with an average elevation exceeding 4,000 m (Figure 1). Known as the “Roof of the World” and the “Asian Water Tower,” the QTP features a unique plateau climate characterized by low temperatures (annual average −5 to 15.5 °C) (Liu et al., 2022), limited precipitation (annual average 486 mm) (Wang et al., 2021), and pronounced spatial heterogeneity transitioning from the warm-humid southeast to the cold-arid northwest (Wu et al., 2024a). The plateau hosts diverse ecosystems including alpine grasslands, forests, wetlands, and permafrost, providing critical ecosystem services that account for 17.68% of China’s national total (Yang et al., 2024b). However, the QTP faces escalating ecological pressures from rapid climate warming, with a heating rate of 0.35 °C per decade(Yao et al., 2019), and intensifying anthropogenic disturbances that account for approximately 33.8% of vegetation productivity variations (Wu et al., 2021). These compounded stresses threaten the stability of these fragile high-altitude ecosystems, underscoring the urgent need for sustainable land management and ecological restoration strategies.
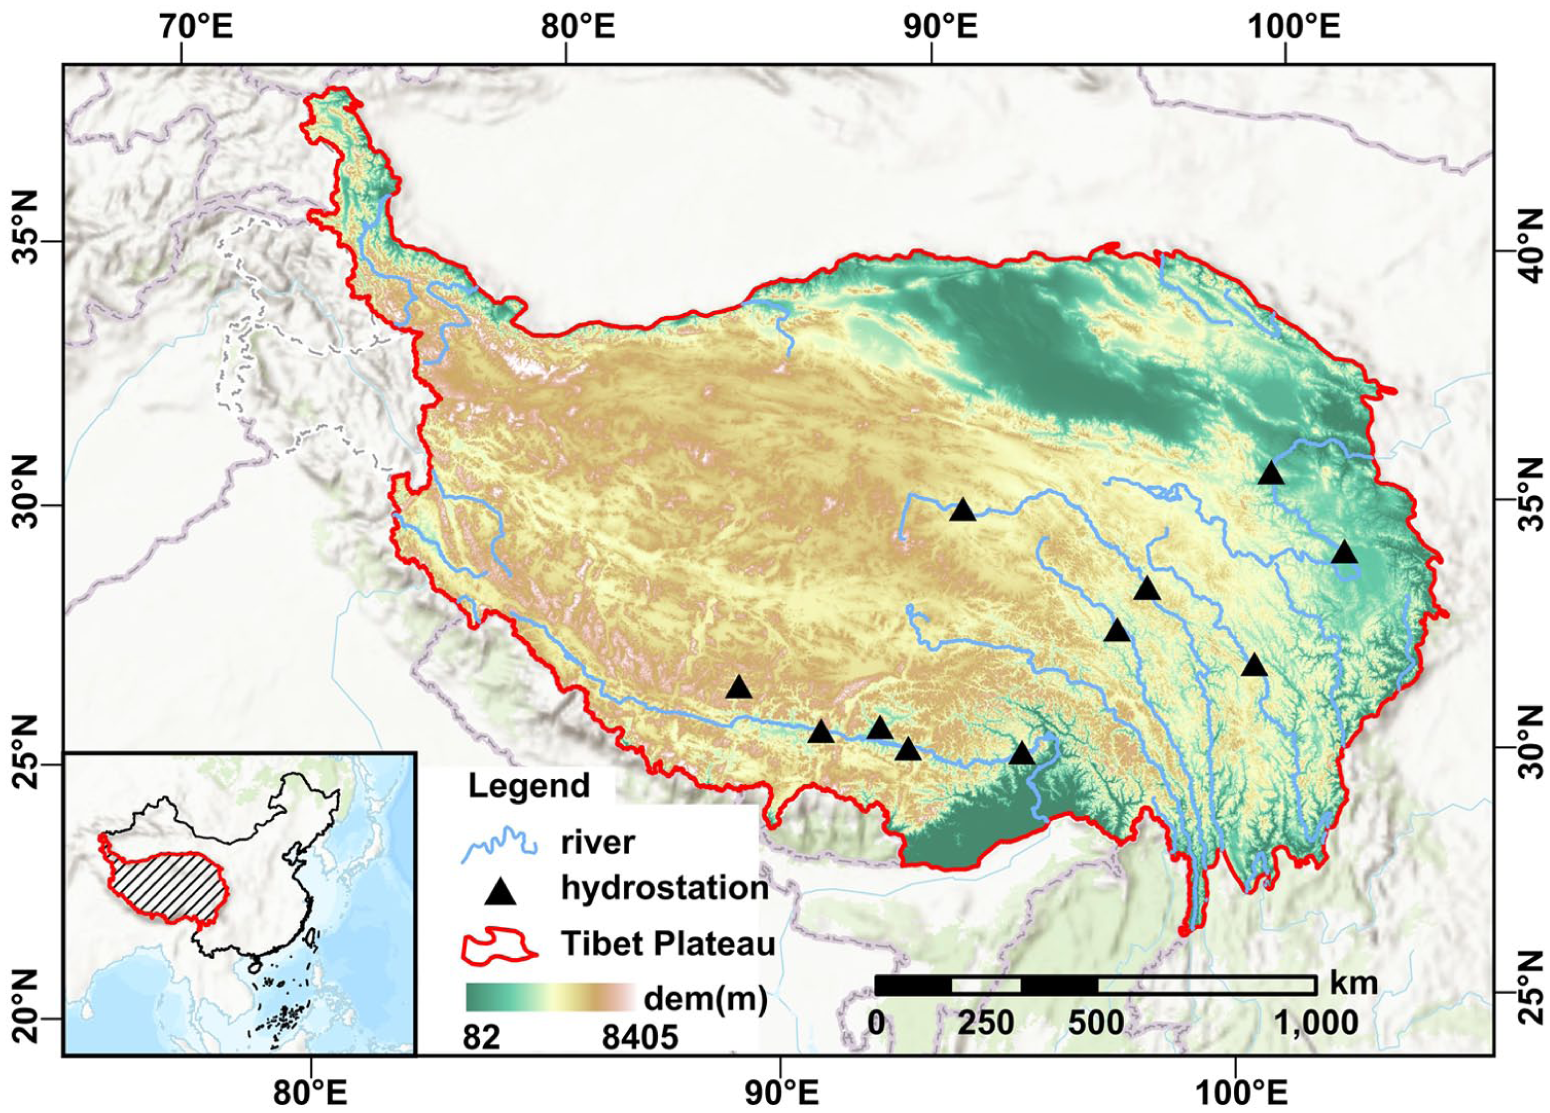
Study area overview map.
Data sources and preprocessing
We used the 2020 land-use/land-cover (LULC) data from the QTP as the optimization baseline. These data were obtained from the National Tibetan Plateau Data Center at a geospatial resolution of 30 m × 30 m and categorized into eight types. To support the integrated analysis, multi-source datasets were collected, including meteorological projections of precipitation and temperature (NetCDF, 0.25° resolution) from the National Tibetan Plateau Data Center and the China Meteorological Administration; topographic factors from HydroSHEDS (250 m); soil type, NDVI, and socio-economic layers (1 km) from the Resource and Environment Science and Data Center (RESDC); and infrastructure and statistical data from the EPS Data Platform and the National Bureau of Economic Research (NBER). All spatial datasets were harmonized to a unified 1 km grid for optimization. Categorical LULC data were resampled using the nearest-neighbor method to preserve land-cover classes, while continuous variables were aggregated or interpolated to 1 km as appropriate. For regression-based coefficient estimation, the 1 km land-use maps were aggregated to the 0.25° climate grid, and the number of 1 km land-use grid cells of each category within each 0.25° cell was calculated as explanatory variables.
Methodology
This study establishes an integrated spatial optimization framework (Figure 2) to systematically reconcile ecological conservation and economic development. This framework consists of three main stages: (1) quantitative assessment of ecosystem services and economic benefits; (2) multi-objective optimization using the NSGA-III algorithm to identify the Pareto frontier; and (3) spatial simulation using the PLUS model to map the optimal land-use configuration.
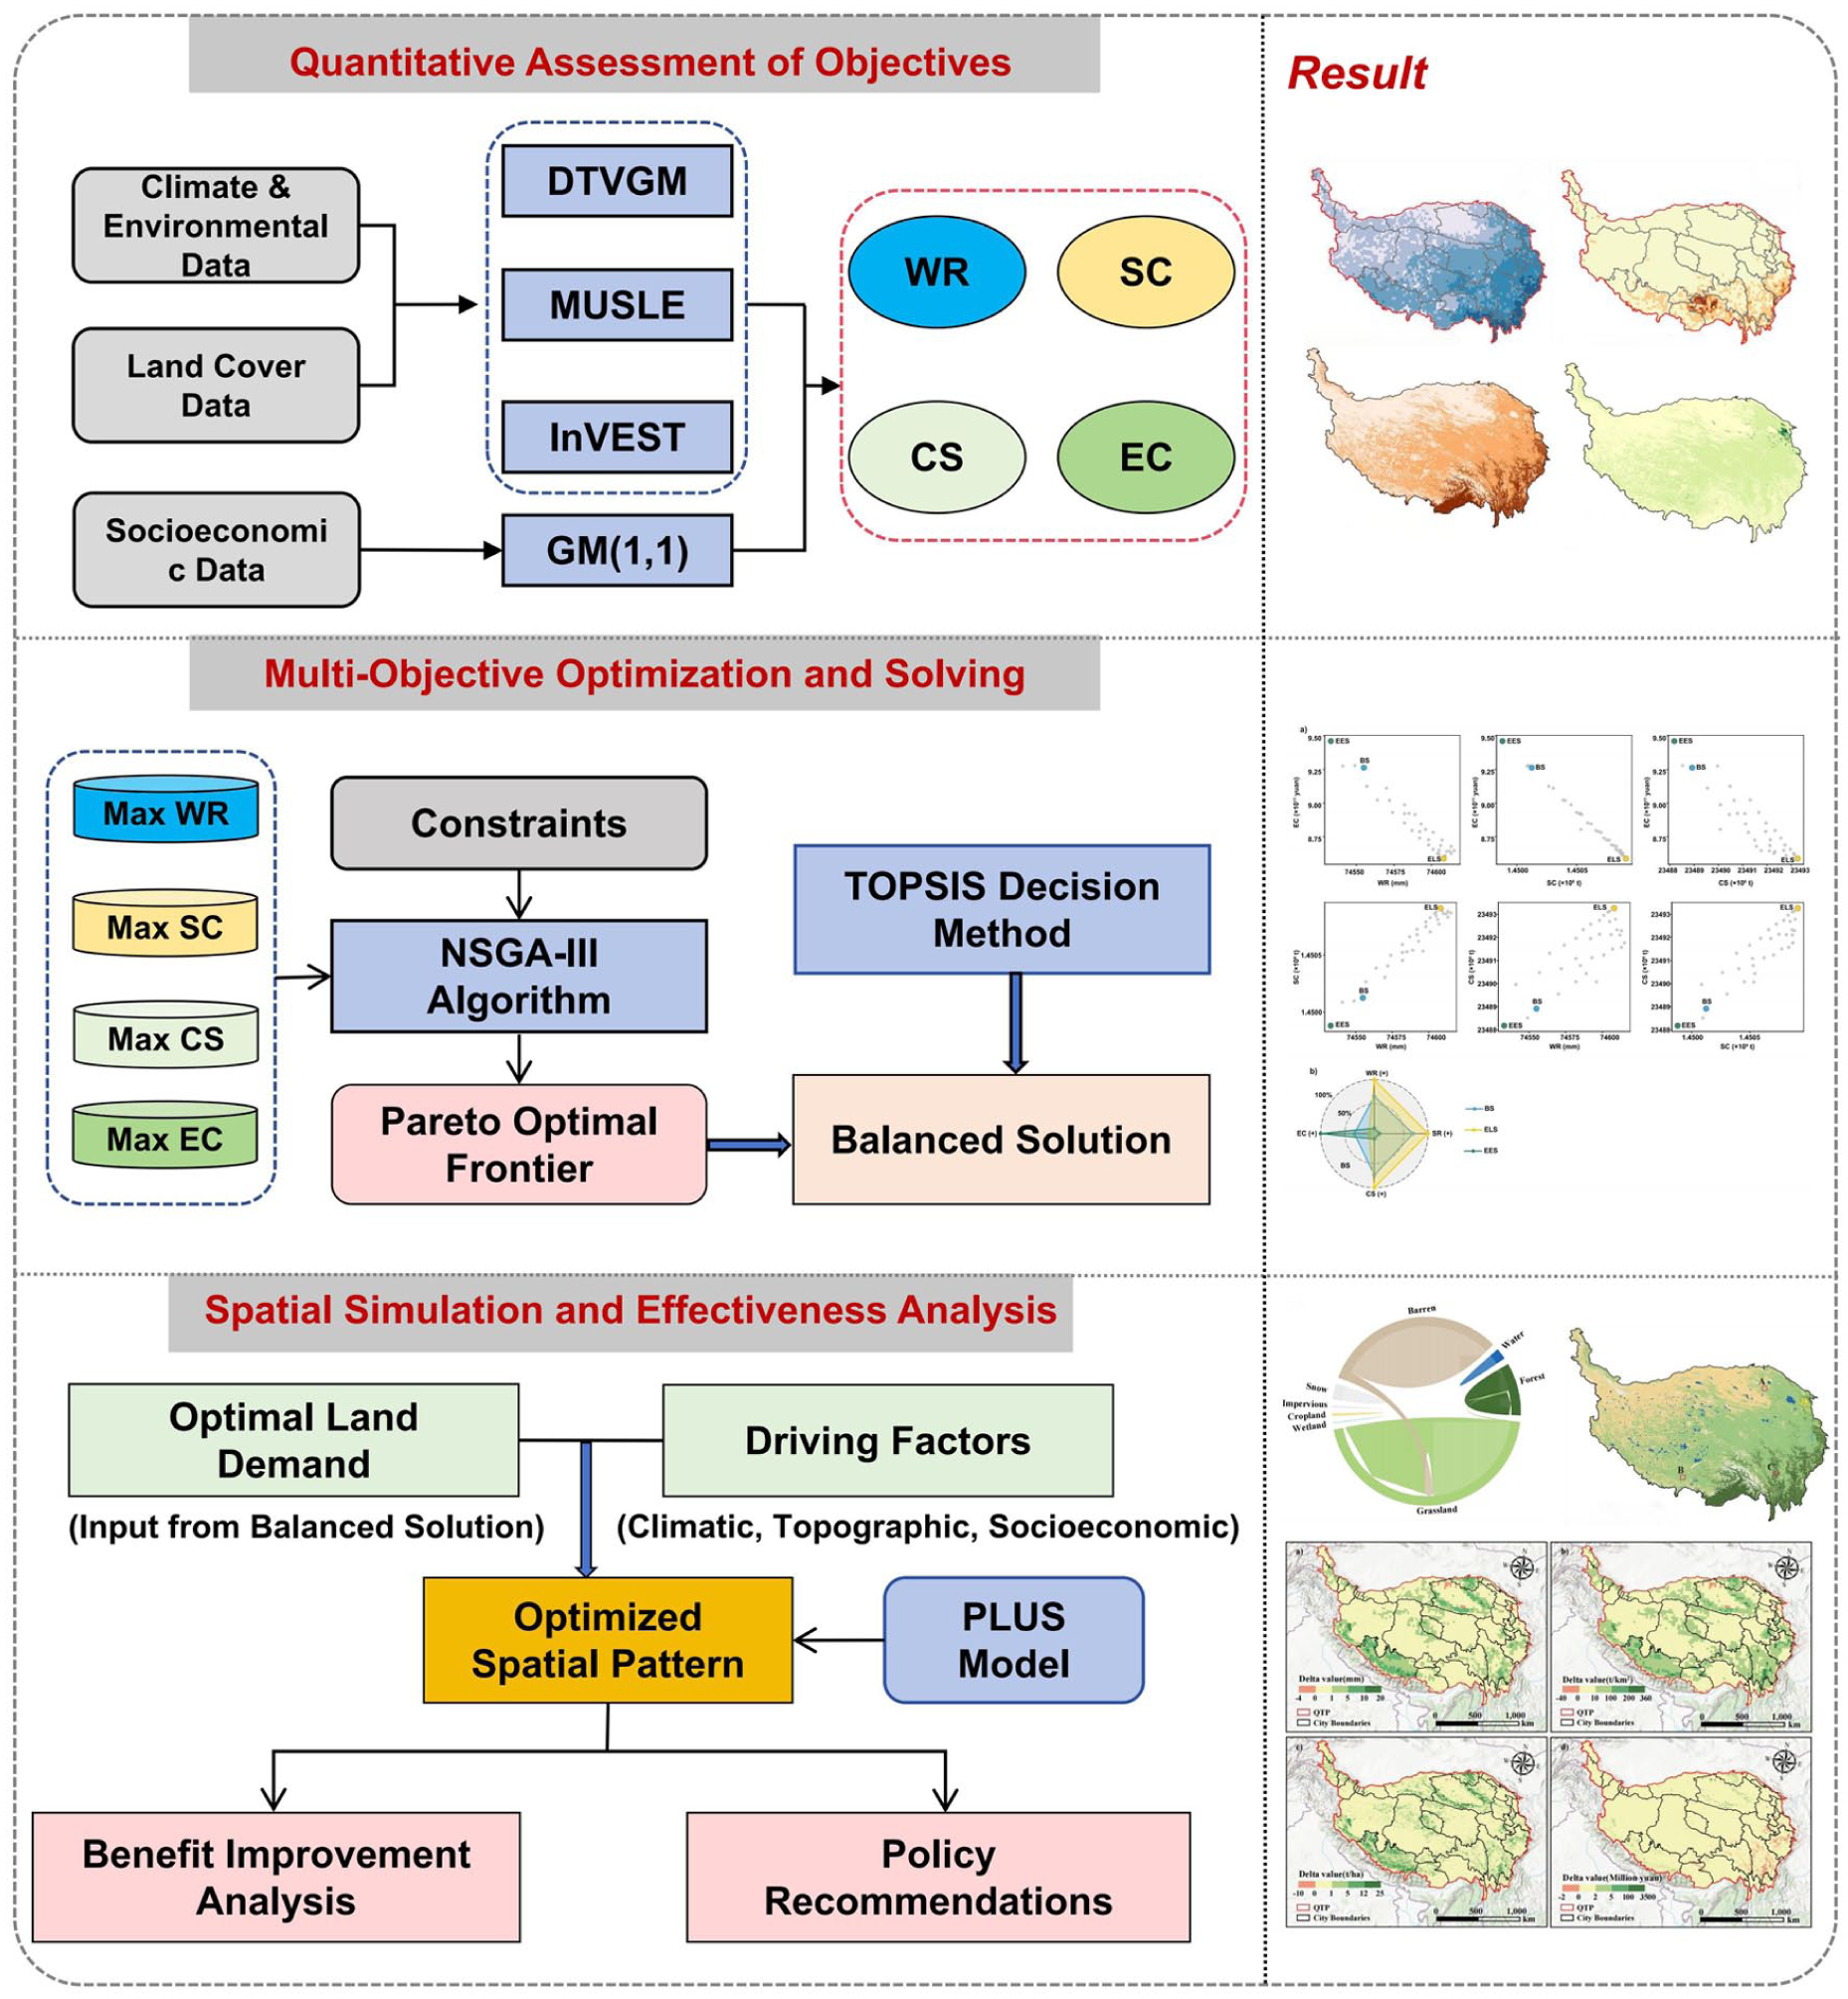
The methodological framework of this study.
Assessment of ecosystem services of water retention and soil conservation
This study utilizes the Distributed Time-Variant Gain Model (DTVGM) to simulate the water yield and soil conservation functions of the watershed. The DTVGM divides the study area into independent Hydrological Response Units (HRUs) and incorporates time-varying parameters to dynamically characterize the spatiotemporal heterogeneity of soil moisture, vegetation cover, and precipitation intensity within the watershed, significantly improving the accuracy of hydrological process simulations(Wang et al., 2023; Xia et al., 2005).
To evaluate model performance, simulated discharge was compared with observed records from 11 hydrological stations across the Qinghai–Tibet Plateau. The observations were divided into a calibration period (1960s–1990s) and a validation period (1990s–2000s), depending on data availability at each station. Model skill was assessed using Nash–Sutcliffe efficiency (NSE), Pearson’s correlation coefficient (r), and relative bias (Bias%). Overall, most stations achieved NSE ⩾ 0.70 and r > 0.80, with Bias within ±10% in both periods (Figure 3), indicating satisfactory model performance.
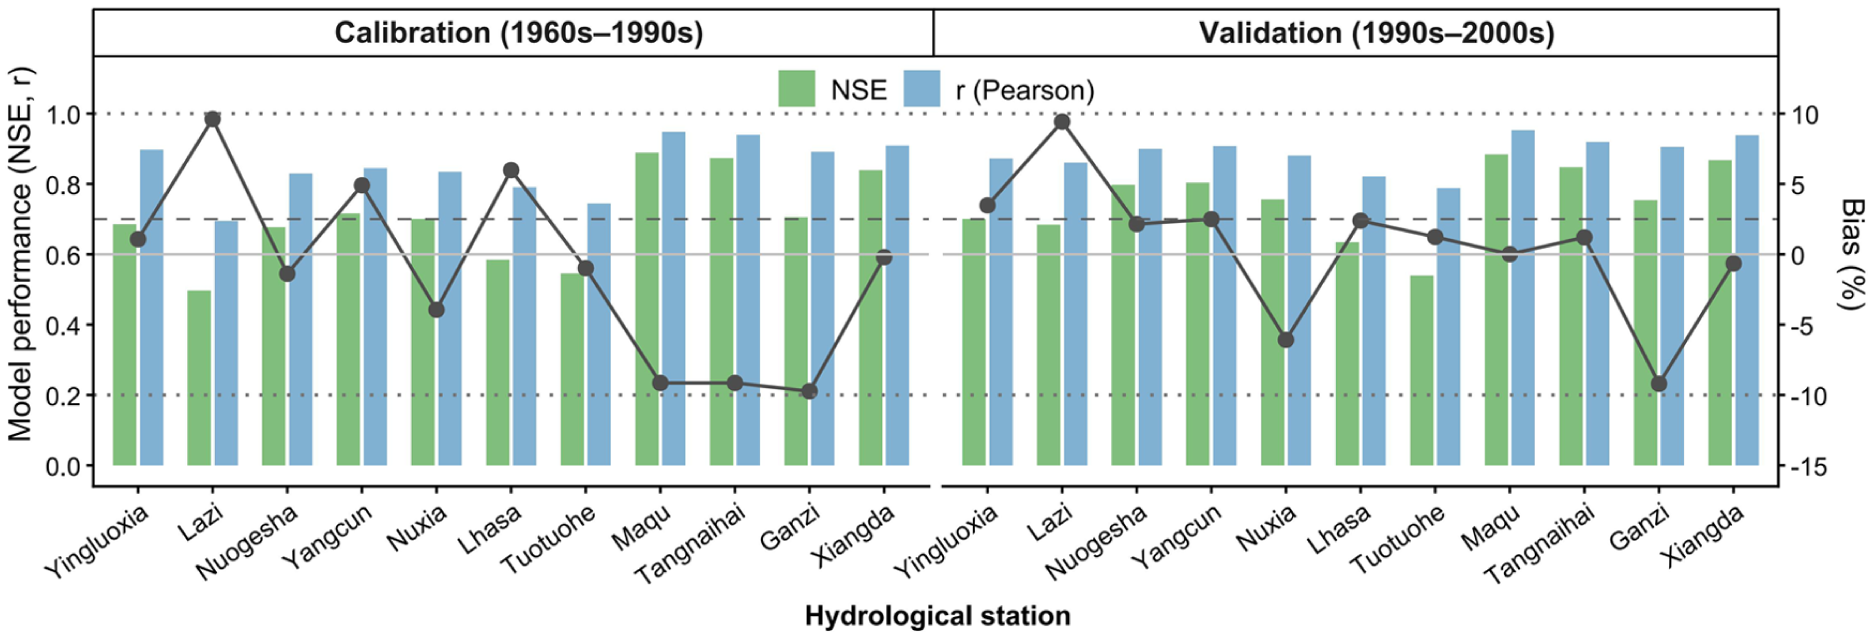
Hydrological calibration and validation of DTVGM across 11 stations, showing NSE, Pearson’s r, and Bias (%).
Water retention capacity is defined as the comprehensive ability of the vegetation-soil system within the watershed to intercept, store, and regulate water resources (Trnka et al., 2022). Based on the hydrological process simulation of the DTVGM model, water retention (WR, unit: mm) is calculated using the following formula:

In the formula, P represents the total precipitation during the study period (mm); EP is the evapotranspiration during the rainy period (mm), dynamically simulated by the DTVGM model using the Penman-Monteith equation; R is the surface runoff (mm), calculated through the distributed runoff generation module of the DTVGM model, with key parameters (such as soil saturated hydraulic conductivity and vegetation interception coefficient) calibrated based on remote sensing data and ground observations.
Soil conservation is estimated using the DTVGM model coupled with the Modified Universal Soil Loss Equation (MUSLE), referencing the soil conservation calculation method of the SWAT model (Reda et al., 2024; Xia et al., 2003):
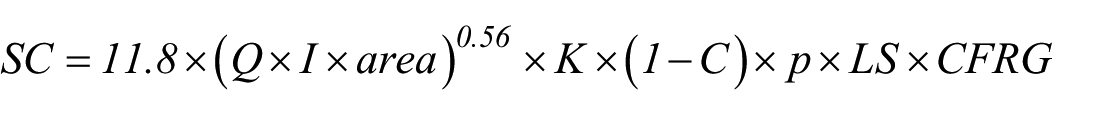
where SC represents soil conservation (t/km2), Q is surface runoff (mm), I is peak runoff (m³/s), and area refers to the area of the hydrological response unit (km2). K denotes the soil erodibility factor, C is the cover and management factor, P is the support practice factor, LS is the topographic factor, and CFRG represents the coarse fragment factor, which accounts for the influence of particle size (specifically, fragments larger than 2 mm). All of these factors are determined based on the actual conditions of the watershed.
Assessment of ecosystem carbon storage
Carbon storage is evaluated using the InVEST Carbon Storage and Sequestration model, which estimates total carbon stored in four pools (Wang et al., 2025; Zhao et al., 2019):

where C total represents total carbon storage (t·ha−1), Cabove is aboveground biomass carbon, Cbelow is belowground biomass carbon, Csoil is soil organic carbon, and Cdead is dead organic matter carbon. Carbon density values for different land-use types are parameterized based on local field measurements and literature values specific to the study region.
Assessment of economic benefits from land-use
We calculated the economic benefit coefficients per unit area for different land-use types based on statistical yearbook data for the QTP. Specifically, cropland, forest, grassland, water, and construction land were represented by agricultural output value, forestry output value, animal husbandry output value, fishery output value, and the combined output values of secondary and tertiary industries, respectively. To project the economic benefit coefficients for the target year, a GM(1,1) grey prediction model with residual correction was employed (Wang et al., 2018; Yang et al., 2024a). The grey prediction approach is suitable for socio-economic time series in the plateau region, which are relatively short and exhibit gradual monotonic growth patterns, and an AR(1)-based residual correction was applied to reduce systematic deviation and enhance predictive stability. Model performance was evaluated using mean absolute percentage error (MAPE), mean absolute error (MAE), and root mean square error (RMSE). The forecasting accuracy across different land-use categories shows satisfactory performance, with MAPE values ranging from 2.80% to 6.14% (Online Supplementary Material 1), supporting the reliability of the projected economic coefficients used in the optimization framework.
Multi-objective optimization framework
To scientifically balance ecological conservation and economic development, we constructed a spatially explicit multi-objective optimization model. This framework aims to identify optimal land-use configurations that maximize the aggregate value of key ecosystem services and economic benefits.
Objective functions
The optimization model incorporates four maximization objectives: (1) Water Retention (WR) to enhance regional hydrological security; (2) Soil Conservation (SC) to mitigate erosion-induced degradation; (3) Carbon Storage (CS) to support climate change mitigation; and (4) Economic Benefits (EC) to maintain regional economic viability. The objective functions are mathematically expressed as follows:


Where f1, f2, f3, and f4 represent the total values of water retention, soil conservation, carbon storage, and economic benefits, respectively; m and n denote the spatial dimensions (rows and columns) of the grid system; xijk is a binary decision variable for land-use allocation, defined as 1 if grid cell (i, j) is allocated to land-use type k and 0 otherwise; and elk signifies the contribution coefficient (per unit area value) of the k-th land-use type to the l-th objective.
The objective contribution coefficients are determined based on quantitative calculation results from corresponding assessment models, reflecting the supply potential of different land-use types for various service functions under specific environmental conditions. Unlike existing studies that directly use the average ecosystem service quality of each land-use type as optimization coefficients (Li et al., 2025b), considering the complex topography and climate conditions of the QTP, this study employs stepwise regression methods to obtain contribution coefficients for water retention and soil conservation, in order to decouple environmental variables; the stepwise regressions for WR and SC were fitted separately under SSP1-2.6, SSP2-4.5, and SSP5-8.5 using the corresponding climate projections (2020–2035), so that climate-scenario differences are explicitly reflected in the estimated contribution coefficients. The contribution coefficients for carbon storage adopt carbon density values of different land-use types; and the contribution coefficients for economic development are represented by the unit area economic benefits of various land-use types.
Where: Y represents the water retention or soil conservation capacity of the grid cell; β0 is the constant term; Dj denotes the number of 1 km land-use grid cells of the j-th type within each 0.25° regression cell; αj represents the regression coefficient of the j-th land-use type, corresponding to the contribution coefficients elk in the multi-objective optimization model; dem is elevation; slope is slope gradient; tmp is temperature; pre is precipitation; β1, β2, β3, β4 are the regression coefficients for corresponding environmental factors; ε is the random error term; n is the number of land-use types.
NSGA-III algorithm
The Non-dominated Sorting Genetic Algorithm III (NSGA-III) is employed as the optimization solver for the multi-objective land-use allocation problem in this study. As an evolutionary algorithm designed for many-objective optimization, NSGA-III effectively handles the complex trade-offs among the four objectives while maintaining solution diversity across the Pareto front (Li et al., 2025b). The algorithm integrates several key components including systematic population initialization, Pareto-based ranking through non-dominated sorting, and diversity preservation via reference point mechanisms (Yuan et al., 2016).
Unlike traditional multi-objective algorithms that rely on crowding distance, NSGA-III utilizes a structured set of reference points to guide the evolutionary search process, ensuring uniform distribution of solutions in the objective space. The implementation follows an iterative framework where parent populations undergo selection, crossover, and mutation operations to generate offspring, followed by environmental selection based on both dominance relationships and reference point associations. This approach enables the algorithm to efficiently explore the solution space and converge to a well-distributed Pareto optimal set, providing decision-makers with a comprehensive range of land-use allocation alternatives that balance competing objectives (Tian et al., 2017).
In the practical implementation of the algorithm, specific parameters were configured to ensure robust convergence and solution quality. The population size was set to 600, with a maximum of 10,000 iterations. The same NSGA-III settings (population size, operators, and stopping criteria) were applied consistently across SSP1-2.6, SSP2-4.5, and SSP5-8.5 to ensure comparability of optimization results. To balance the exploration and exploitation capabilities of the algorithm, the crossover probability and mutation probability were set to 0.9 and 0.2, respectively.
To ensure that the optimization results are realistic and aligned with regional land management policies, explicit constraints were imposed on land-use allocation. A total area constraint was strictly enforced to maintain spatial consistency across the QTP. In addition, area variation thresholds for specific land-use types were determined based on both historical land-use change magnitudes (2000–2020) and officially defined policy targets in national and provincial spatial planning documents. For instance, the Qinghai Provincial Territorial Spatial Plan (2021–2035) sets quantitative targets to increase forest coverage (from ⩾2.42% to ⩾2.84%) and grassland vegetation coverage (from ⩾58.5% to ⩾60%), indicating controlled but planned vegetation expansion. Meanwhile, territorial spatial planning frameworks emphasize strict control of urban development boundaries to prevent excessive construction land growth. In accordance with these planning objectives and historical trends, conservative caps were adopted in the optimization model: forest land and cropland expansion were limited to ⩽5% of their baseline areas, grassland expansion to ⩽10%, construction land expansion to ⩽20%, and barren land development to ⩽20% of its existing area. These thresholds ensure that the optimized solutions remain consistent with ecological protection priorities and development control requirements, while avoiding unrealistic large-scale land conversion.
TOPSIS decision method
The Technique for Order of Preference by Similarity to Ideal Solution (TOPSIS) is employed to select the optimal land-use allocation scheme from the Pareto solutions generated by NSGA-III. TOPSIS evaluates alternatives based on their relative distances to both the positive and negative ideal solutions, providing a systematic ranking approach for multi-criteria decision-making (Pandey et al., 2023). The method proceeds in the following steps:
(i) Construction of the weighted decision matrix
First, vector normalization is applied to the decision matrix to eliminate dimensional differences between objectives. Subsequently, weights are assigned to reflect the relative importance of each objective. In this study, to represent a balanced development scenario where ecological conservation and economic growth are considered equally important, equal weights were assigned to all four objectives (wj = 0.25 for j = 1, 2, 3, 4). The weighted normalized value (Zij) is calculated as follows:

Where xij represents the original value of the j-th objective for the i-th alternative, and wj is the weight of the j-th objective.
(ii) Calculation of distances and ranking
The Euclidean distances from each solution to the positive ideal solution (Di+) and the negative ideal solution (Di-) are calculated:

Finally, the relative closeness coefficient (Ci) is computed to rank the alternatives:

Solutions with higher Ci values indicate better overall performance across all objectives, facilitating the identification of the optimal land-use allocation scheme for implementation.
PLUS model for land-use simulation
The Patch-generating Land Use Simulation (PLUS) model is employed to implement the optimal land-use allocation scheme identified through the multi-objective optimization framework. PLUS combines rule mining and cellular automata to simulate realistic land-use change patterns while maintaining spatial contiguity and patch characteristics (Liang et al., 2021; Xin et al., 2024).
To capture the complex driving mechanisms of land-use transitions in the QTP, the model incorporates 11 driving factors categorized into natural, socio-economic, and accessibility dimensions. Natural factors include precipitation, temperature, elevation, slope, and soil type; socio-economic factors consist of GDP, night light intensity, and population density; while accessibility factors involve distances to rivers, roads, and railways. To ensure the reliability of the spatial simulation, the PLUS model was validated by simulating the land-use spatial distribution of 2020 based on the baseline data from 2000. The comparison between the simulated and actual land-use patterns yielded a Kappa coefficient of 0.82, confirming the model’s high simulation accuracy and its applicability to the complex geographical environment of the QTP. Consequently, the validated model was employed to spatially implement the optimal land-use allocation scheme.
Definition of future scenarios
To account for uncertainty in future climate forcing while ensuring consistency with regional development trajectories, three CMIP6 Shared Socio-economic Pathways (SSP1-2.6, SSP2-4.5, and SSP5-8.5) were considered. For each SSP, daily temperature and precipitation projections for the Qinghai–Tibet Plateau during 2020–2035 were obtained from 12 CMIP6 global climate models. Water retention and soil conservation services were calculated separately under each SSP, and the final ecosystem service results were derived using a multi-model ensemble mean approach.
To evaluate scenario sensitivity, the regression coefficients for the ecosystem service of water retention and soil conservation were recalculated under each SSP, and the same optimization framework was applied to obtain the corresponding land-use allocation. The optimized plateau-scale land-use compositions were highly consistent across SSP1-2.6, SSP2-4.5, and SSP5-8.5 (Online Supplementary Material 2), indicating that the optimization results are robust to plausible climate futures. Therefore, SSP2-4.5 is used as the primary scenario for presenting the main spatial patterns, as it broadly aligns with recent regional development and climate trends.
Under SSP2-4.5, the projected climate exhibits pronounced spatiotemporal heterogeneity. Regarding temperature, the annual mean temperature ranges from -7°C in the northwest to over 20°C in the southeast. Temporally, the regional mean temperature is projected to increase by 0.2°C to 0.8°C, with significant warming trends observed across most regions. Regarding precipitation, annual values display a distinct spatial gradient, with lower values in the northwest and higher values in the southeast. The regional mean precipitation fluctuates around 440 mm. Trend analysis indicates that the southeast predominantly shows increasing trends, whereas the northwest mainly exhibits decreasing trends.
Results
Trends of water retention and soil conservation
Unless otherwise stated, the results reported in the Results Section correspond to SSP2-4.5, which is used as the representative scenario given the high consistency of optimized outcomes across SSP1-2.6, SSP2-4.5, and SSP5-8.5. The ecosystem service of water retention (WR) exhibits a distinct “southeast-high, northwest-low” spatial gradient (Figure 4(g)), with annual mean values ranging from less than 50 mm in arid regions to over 480 mm in humid zones. Regarding temporal dynamics, WR demonstrates a robust upward trajectory (Figure 4(i)), projected to rise from approximately 118 mm in 2020 to nearly 130 mm by 2035. This increasing trend is statistically significant (p < 0.05) across the central and eastern QTP (Figure 4(h)). Notably, the temporal evolution of WR is highly consistent with the changing climate; its long-term increasing trend parallels the projected rise in both annual mean temperature and precipitation (Figure 4(c), (f)), and its interannual fluctuations are tightly synchronized with precipitation variability.
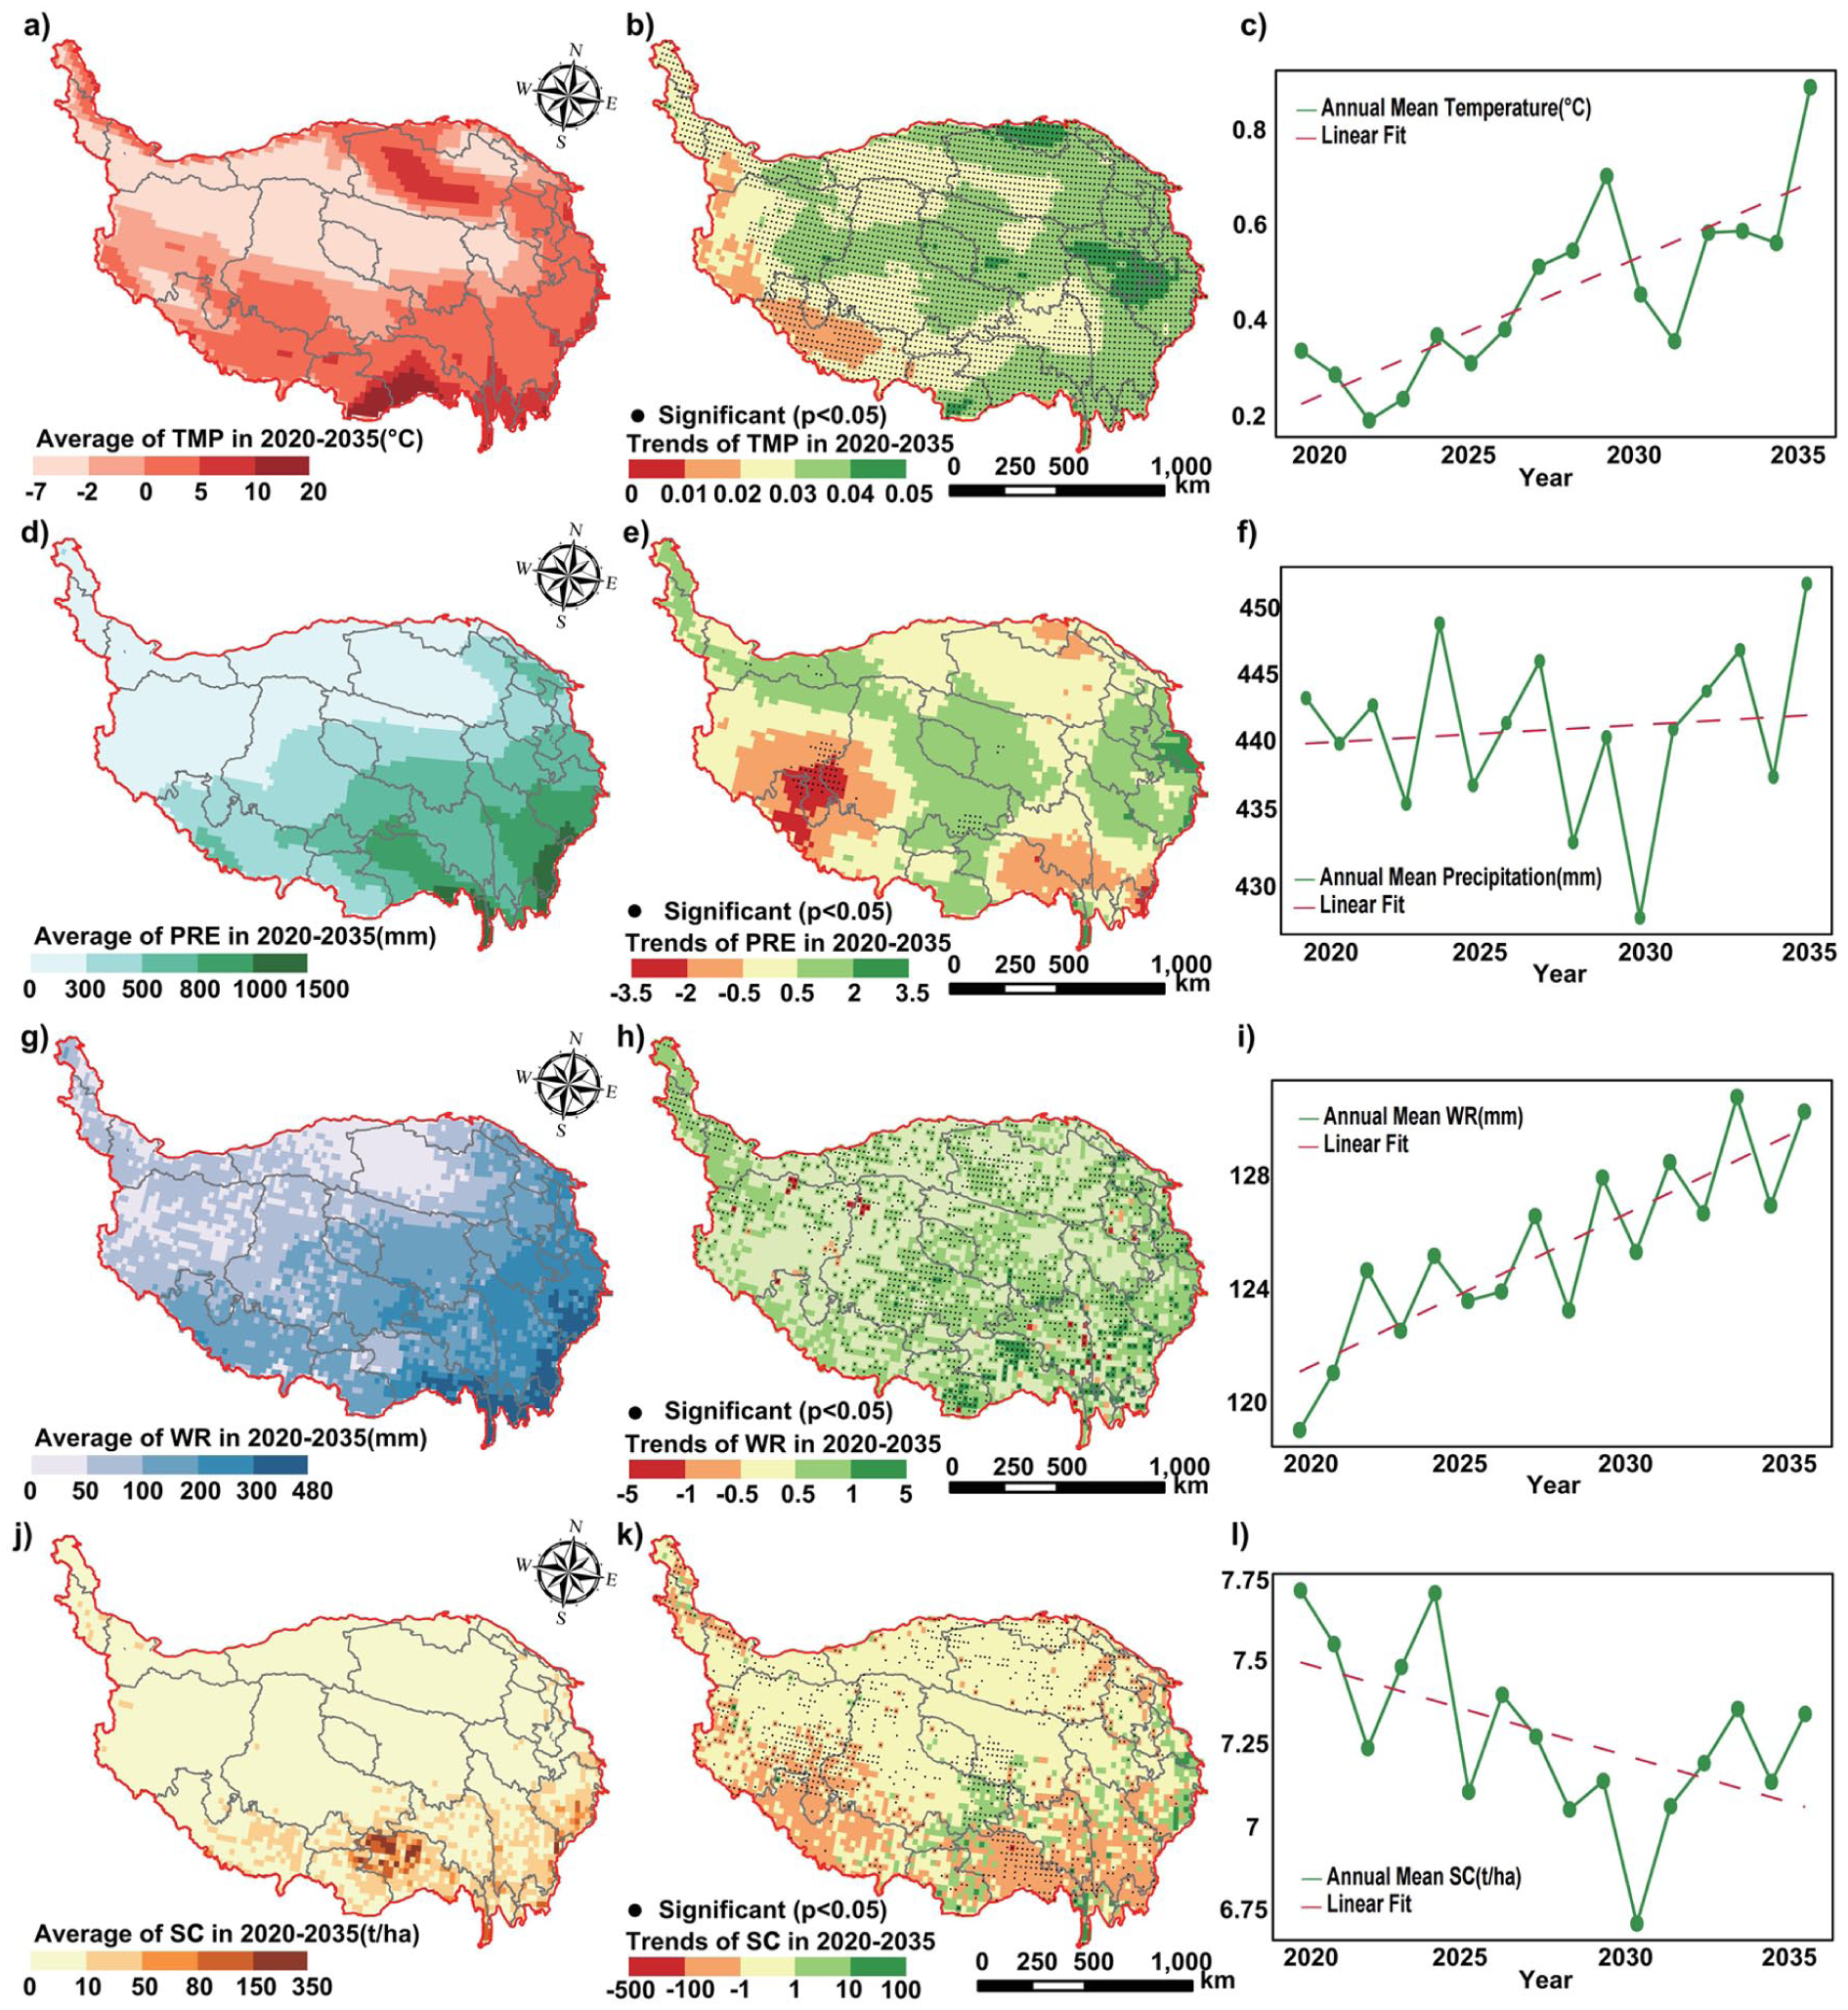
The spatial distribution and trend analysis of temperature (a–c), precipitation (d–f), water retention (g–i), and soil conservation (j–l) from 2020 to 2035 under the SSP2-4.5 scenario. Panels in each row represent mean values (left), spatial trends (middle), and temporal variations with linear fitting (right).
In contrast, while the high-value areas for soil conservation (SC) are spatially congruent with WR—concentrated mainly in the southeastern region (Figure 4(j))—their temporal trends diverge. The annual mean SC is projected to decrease from approximately 7.75 t·ha−1 to 7.25 t·ha−1 during the study period (Figure 4(l)). Spatially, this declining trend is widespread, with statistically significant decreases (p < 0.05) observed particularly in the southeastern QTP (Figure 4(k)). Although the interannual variation of SC remains consistent with precipitation fluctuations, its overall long-term trend contrasts with the increasing trend of water retention.
Trade-offs among ecosystem services
The multi-objective optimization generated a well-distributed Pareto frontier comprising 35 non-dominated solutions, revealing complex relationships among the four competing objectives. Analysis of the Pareto frontier indicates significant synergies among ecological objectives; specifically, improvements in water retention (WR) are generally accompanied by enhancements in soil conservation (SC) and carbon storage (CS). However, a pronounced trade-off exists between economic benefits (EC) and ecological functions. As illustrated in Figure 5(a) through the two-dimensional Pareto projections, the Economic-Prioritized Solution (EES) achieves the maximum potential economic output of 9.46 × 10¹¹ Yuan, but at the cost of minimizing ecosystem services to their theoretical lower bounds. Conversely, the Ecological-Prioritized Solution (ELS) maximizes environmental benefits but necessitates a substantial 9.2% reduction in economic benefits (decreasing to 8.59 × 10¹¹ Yuan), highlighting the steep opportunity cost of strict conservation.
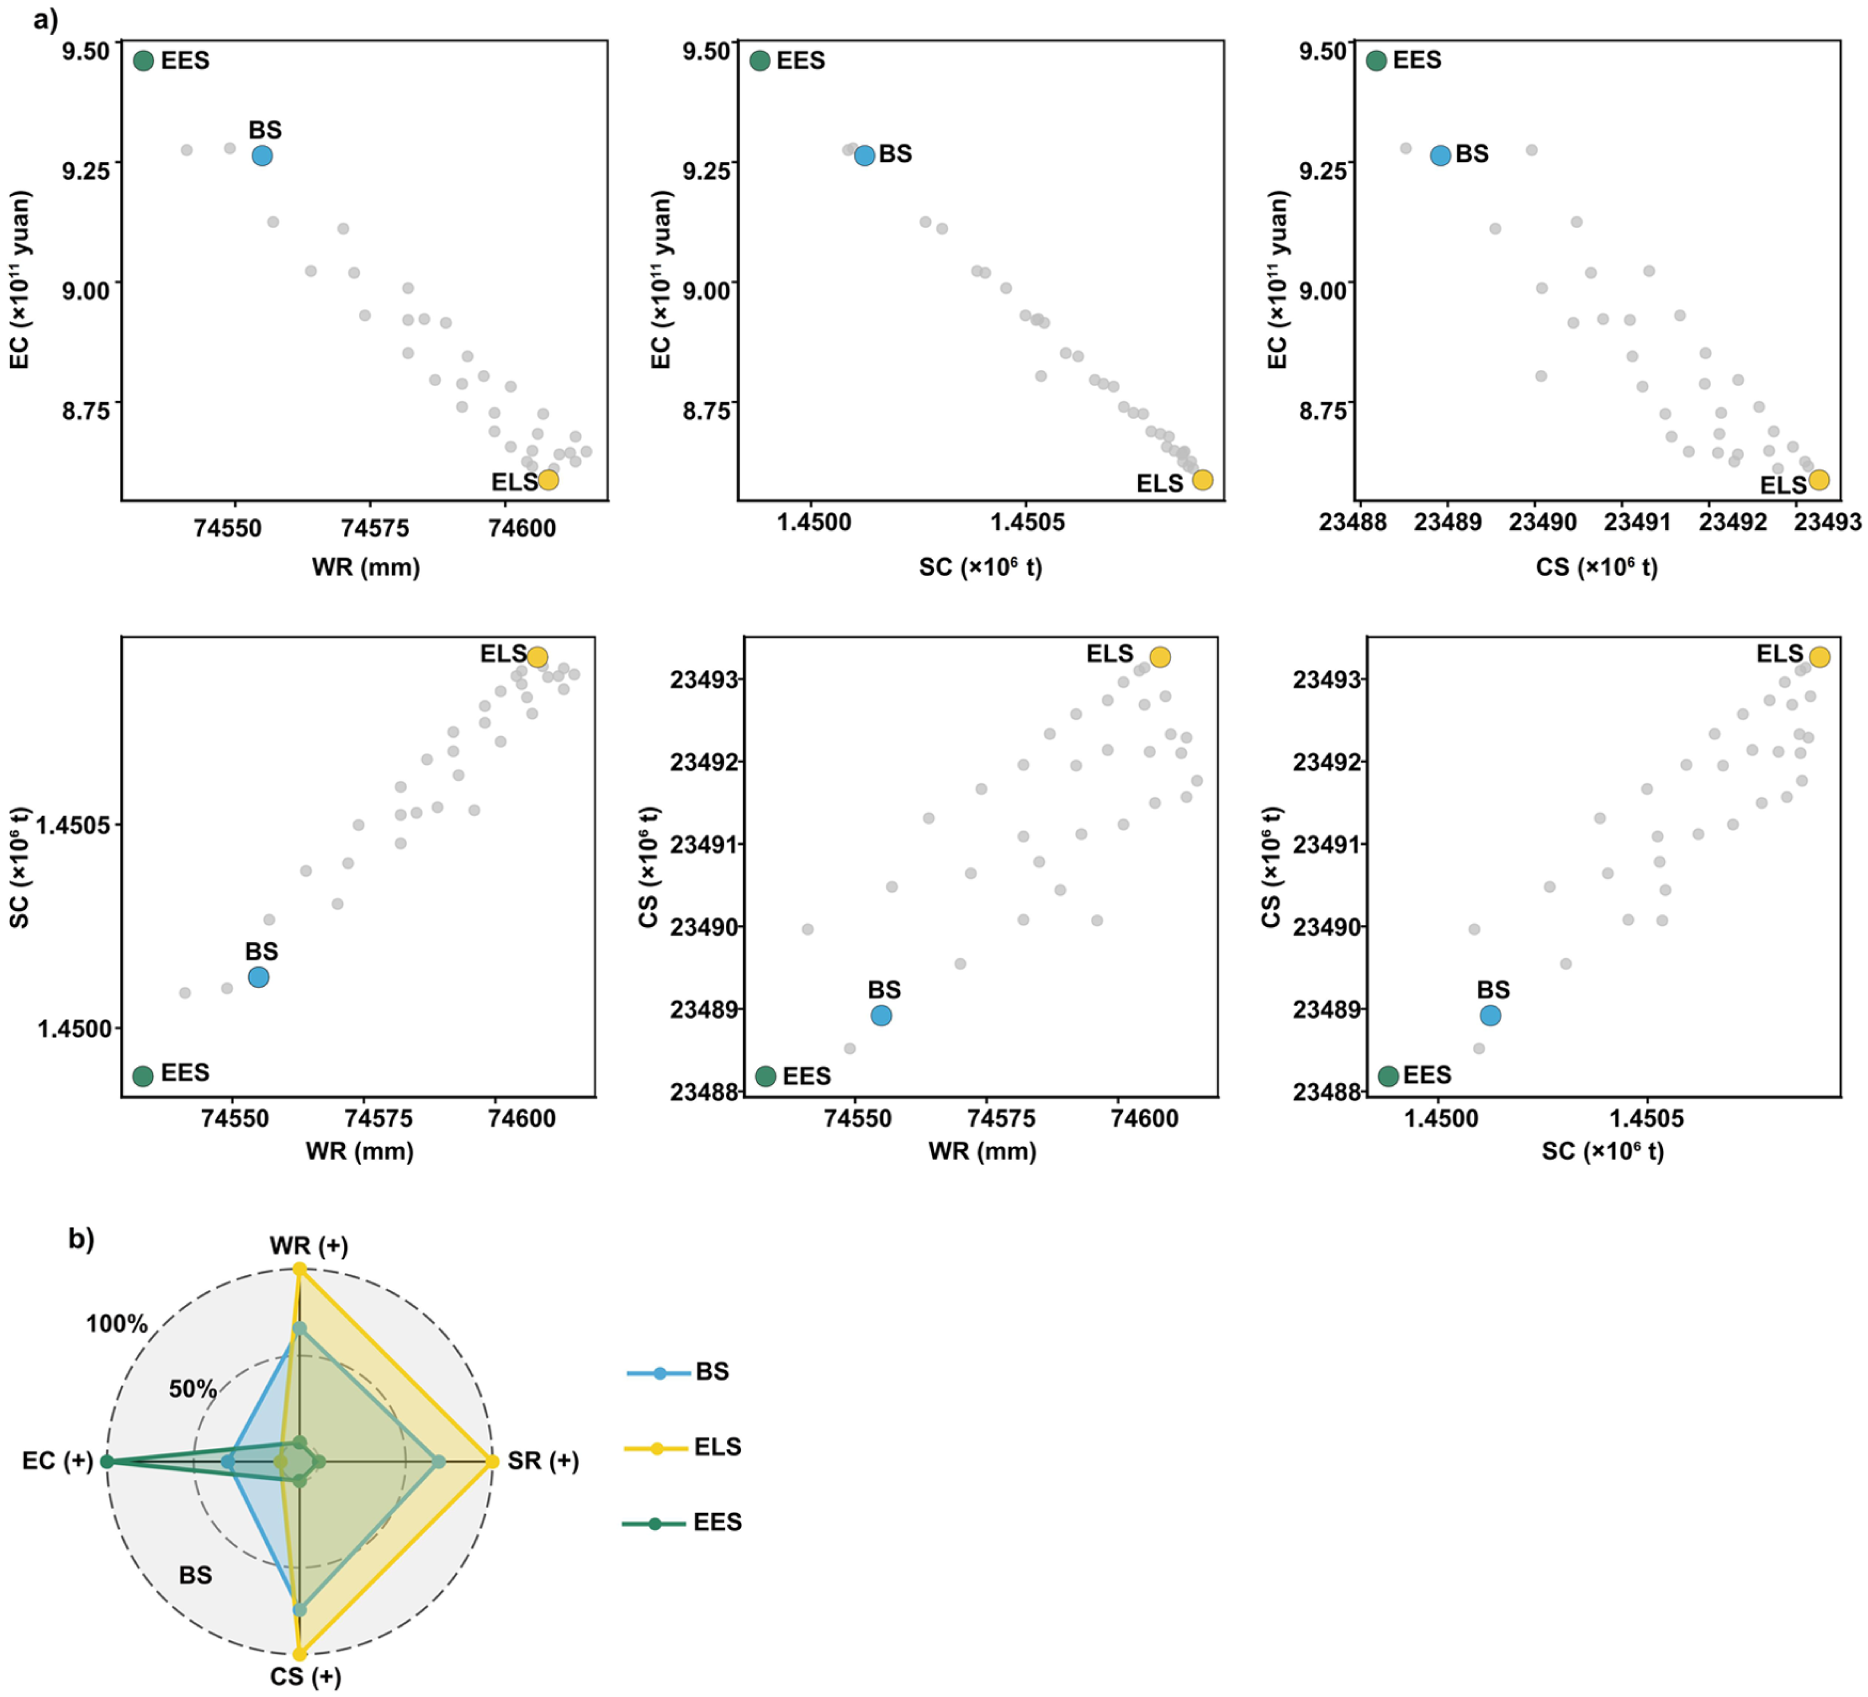
Multi-objective optimization results and optimal solution selection for the QTP. (a) Two-dimensional projections of the Pareto-optimal solutions illustrating trade-offs among water retention (WR), soil conservation (SC), carbon storage (CS), and economic benefits (EC). The grey points represent the non-dominated solutions, and the three representative solutions are highlighted and labeled: the economic-prioritized solution (EES), the ecological-prioritized solution (ELS), and the balanced solution (BS). (b) Radar chart comparing the normalized objective performance (WR, SC, CS, and EC) of EES, ELS, and BS.
To resolve these conflicts, a balanced optimal land-use scheme (BS) was identified from the Pareto set using the TOPSIS method. Unlike single-objective extreme solutions, the selected optimal scheme achieves a robust compromise with high cost-effectiveness. Compared to the Economic-Prioritized Solution, the optimal scheme incurs a moderate economic trade-off of 6.4%. However, this economic compromise yields disproportionate ecological gains, successfully capturing the majority of the potential ecological improvement range defined by the Pareto frontier. Specifically, compared to the economic-only scenario, the optimal scheme realizes 65.9% of the maximum potential gain for water retention, 69.0% for soil conservation, and 74.3% for carbon storage. Consequently, this optimal solution demonstrates greater practical feasibility by securing the majority of potential ecological gains while maintaining a robust level of regional economic development. Importantly, repeating the optimization under SSP1-2.6 and SSP5-8.5 produced highly similar land-use compositions at the plateau scale; the maximum area difference across land-use categories is 61 km2 (approximately 0.0024% of the total plateau area), indicating strong robustness of the proposed allocation framework (Online Supplementary Material 2).
Driving factors for land-use spatial differentiation
Based on the land-use suitability probability calculations derived from the PLUS model, the analysis of driving factor importance reveals distinct determinants underlying the spatial differentiation of various land-use types (Figure 6). Specifically, forest distribution is heavily influenced by climatic variables, with precipitation and temperature identified as the highest-ranking factors, while GDP also shows considerable significance in its spatial pattern. For grassland, although precipitation remains the dominant factor, the contribution rates of soil type and proximity to rivers are notably higher compared to those for other land types. Cropland, conversely, exhibits a pronounced dependence on topography, where elevation emerges as the preeminent determinant with an outstanding advantage, followed by population density. Finally, the spatial distribution of construction land is strongly governed by anthropogenic factors, with night-time light intensity emerging as the most influential variable, substantially exceeding other natural environmental factors.
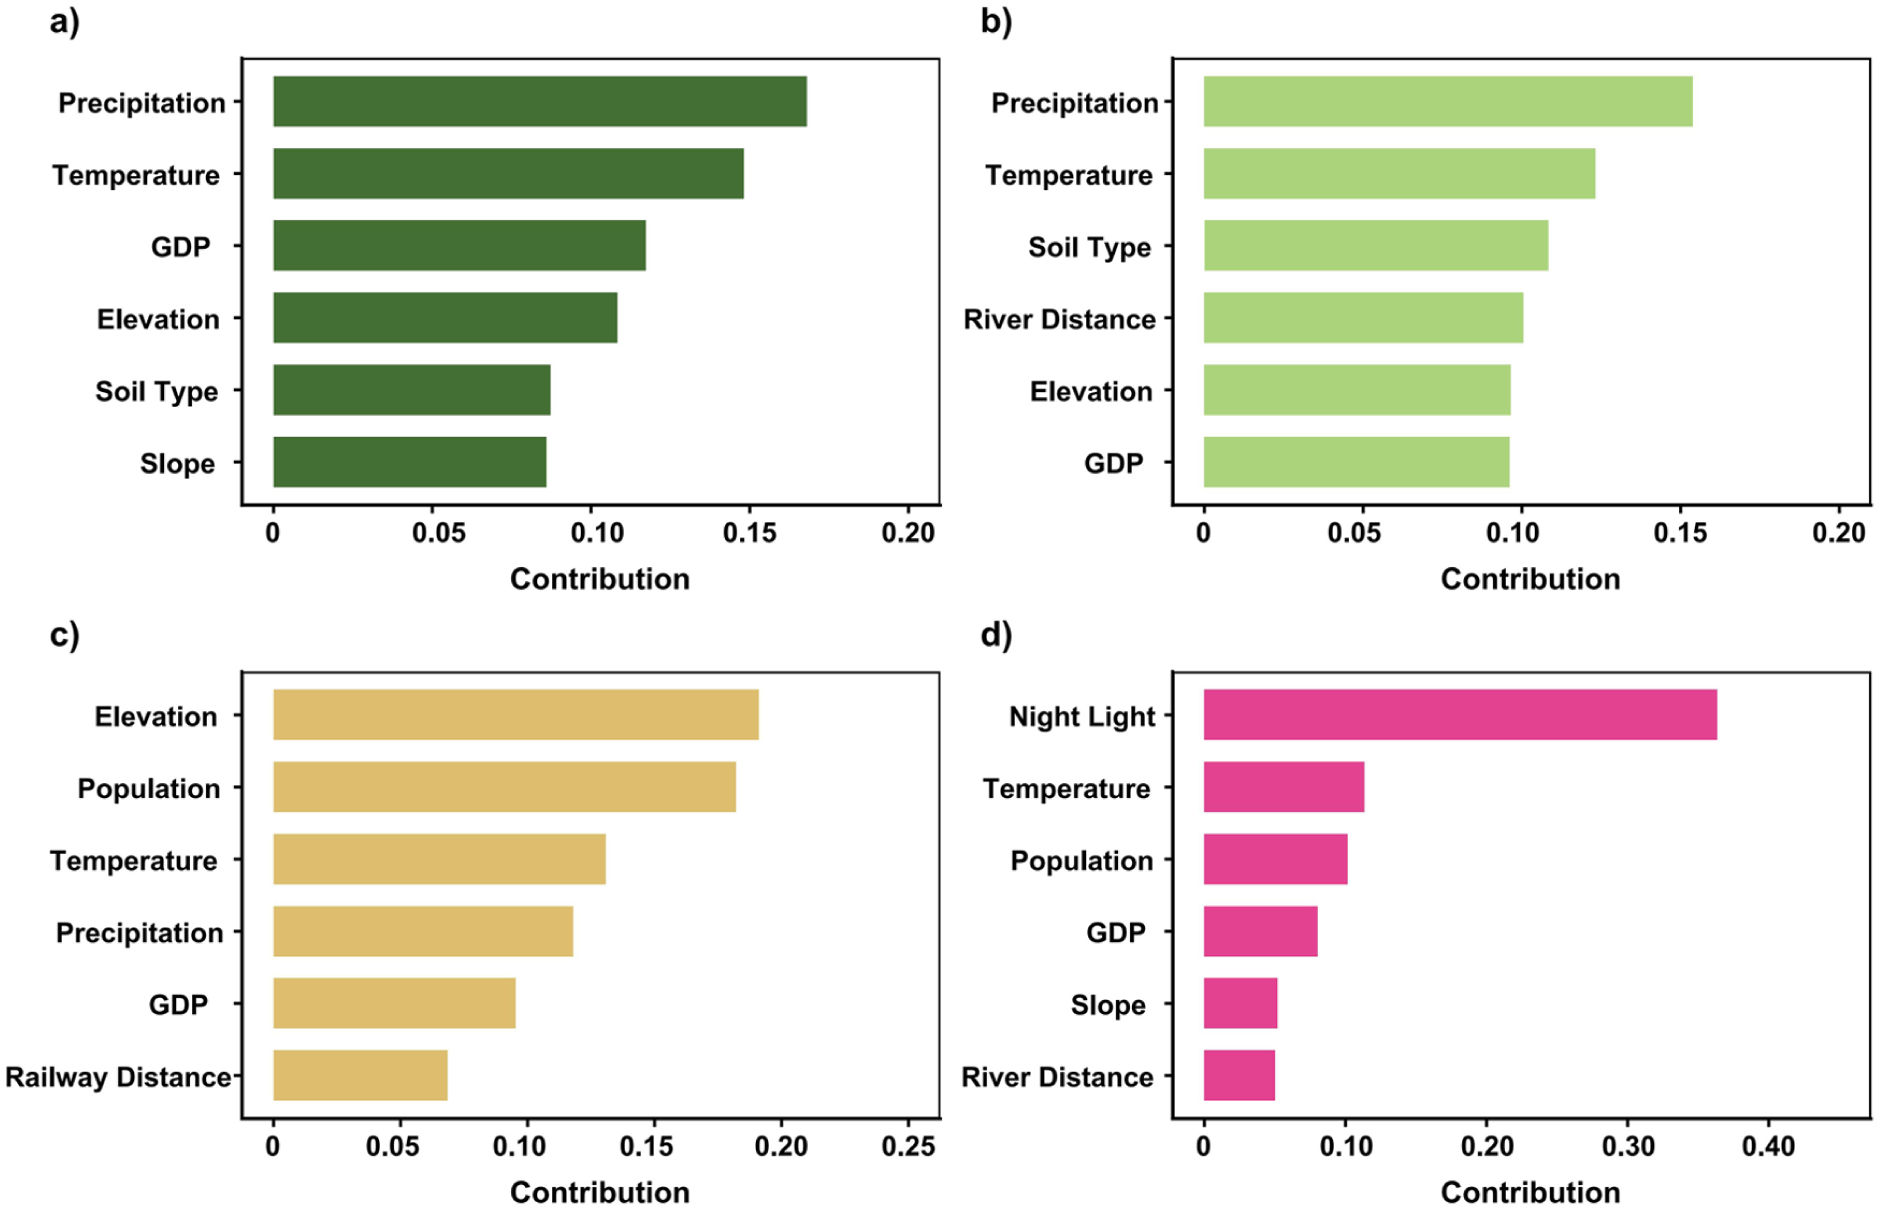
Importance analysis of driving factors for land-use types on the QTP. (a) Forest; (b) Grassland; (c) Cropland; (d) Construction.
Landscape-scale reconciliation among ecosystem services
The spatial implementation results of the optimization scheme exhibit pronounced differentiation characteristics across different scales, revealing distinct patterns of ecological restoration and development (Figure 7 and Figure 8). At the prefecture level, forest expansion is primarily concentrated in the transitional zones along the eastern margin of the QTP, with Ganzi Tibetan Autonomous Prefecture, Aba Tibetan and Qiang Autonomous Prefecture, and Chamdo City ranking as the top regions for forest increment, recording net increases of 4,902 km2, 2,145 km2, and 1,498 km2, respectively. In contrast, grassland spatial changes present a distinct “western increase and eastern decrease” distribution pattern, where significant expansion occurred in western regions such as Shigatse City, Haixi Mongol and Tibetan Autonomous Prefecture, and Ngari Prefecture, achieving substantial increments of 33,106 km2, 18,505 km2, and 9,707 km2, respectively. Conversely, the Western Sichuan Plateau regions experienced notable grassland reductions—specifically in Ganzi and Aba Prefectures—forming a clear spatial pattern of grassland-to-forest conversion. Meanwhile, changes in cropland and construction land remained relatively limited, with minor cropland growth distributed in Shannan and Nyingchi, while construction land expansion was concentrated in economically active regions with high night-time light intensity, such as Haixi Prefecture and Xining City.
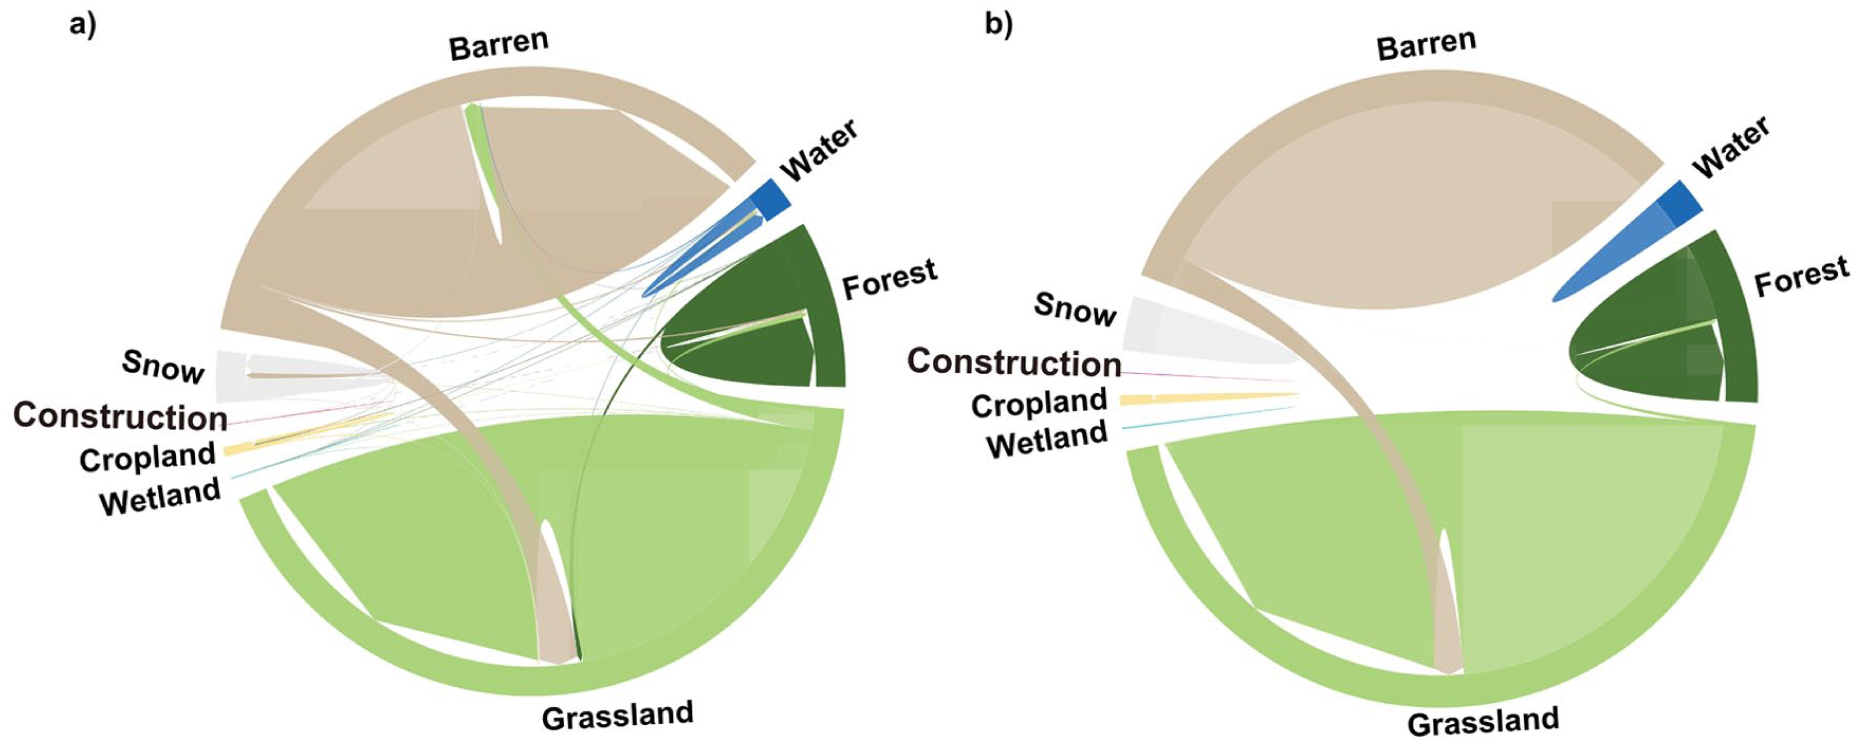
Land-use changes on the QTP. (a) Land-use changes from 2000 to 2020, (b) Land-use changes after optimization.
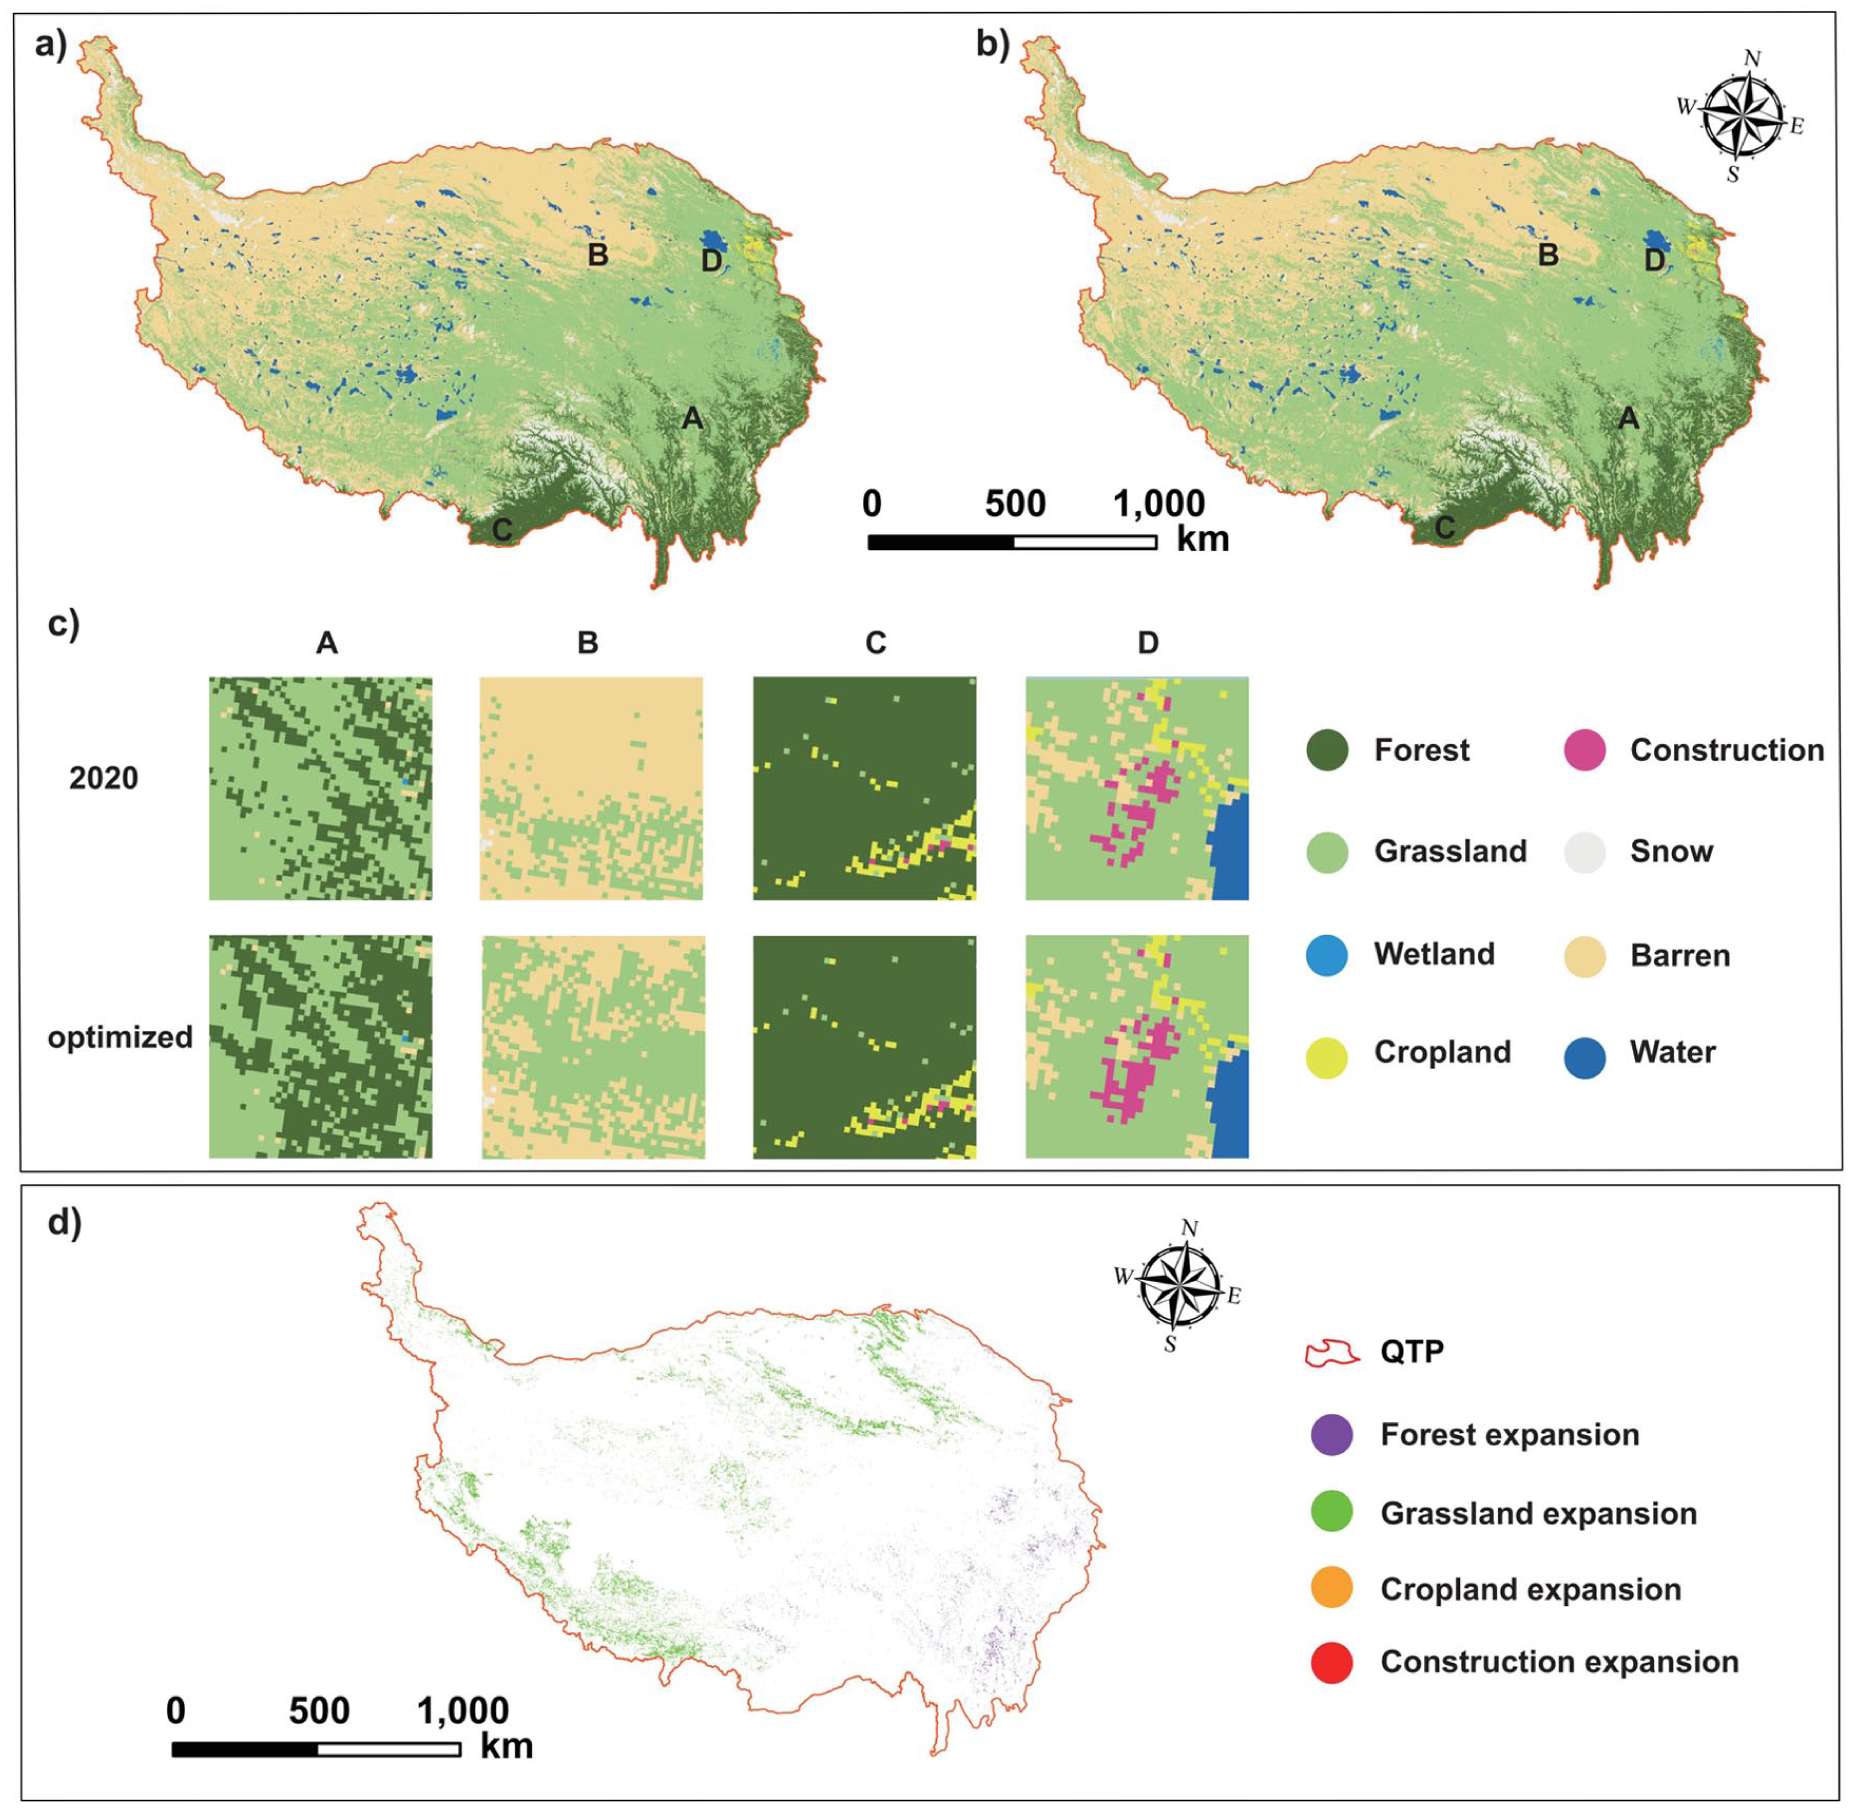
Comparison of land-use status and optimization scheme on the QTP. (a) Land-use distribution of the QTP in 2020; (b) Land-use distribution after optimization. (c) Local comparison between the two. (d) Spatial distribution of expansion for different land-use types (forest, grassland, cropland, and construction land) under the optimized scheme.
From the perspective of watershed spatial patterns, land-use changes demonstrate distinct differentiation characteristics tailored to specific ecological functions. Major outflow basins exhibited proactive ecological adjustments: the Yangtze River basin recorded a forest area increase of 7,909 km2 alongside a grassland decrease of 5,470 km2, presenting a significant trend of grassland-to-forest conversion aimed at water retention; similarly, the Yellow River basin achieved a high forest growth rate of 17.59%, while the Yarlung Tsangpo River basin experienced simultaneous expansion of both forest and grassland, representing the largest magnitude of grassland expansion among all basins. In terms of inland and transboundary systems, grassland changes in inland river basins were particularly significant, characterizing these arid regions with ecological restoration; notably, the Qaidam Basin, Inner Plateau, and Tarim and Indus basins achieved remarkable grassland growth rates of 31.98%, 7.76%, and over 25% respectively, whereas transboundary basins like the Lancang-Mekong and Salween maintained relatively stable land-use patterns. Overall, the spatial optimization results reveal a coordinated pattern where inland arid basins are characterized primarily by grassland expansion for windbreak and sand fixation, while external river basins exhibit a trend of forest-grassland optimization to enhance hydrological regulation.
Projected improvements across different scales
Statistical analysis of the optimization outcomes reveals significant spatial heterogeneity in projected ecosystem service improvements across different watershed and administrative scales, highlighting distinct hotspots of ecological restoration (Figure 9). At the watershed level, the optimization scheme generates uneven ecological benefits, with the Ganges watershed emerging as the most prominent beneficiary. It is projected to record the highest simultaneous improvements in water retention (4.71 mm), soil conservation (63.27 t/km2), and carbon storage (14.49 t/ha), indicating its critical role in the regional ecological security barrier. Similarly, the Hexi Corridor and Indus watersheds exhibit substantial potential for synergistic improvements, whereas the Salween watershed shows relatively modest enhancement, reflecting varying sensitivities to land-use optimization. Downscaling to the administrative level, multi-functional improvements are predominantly concentrated in the southern and southeastern regions. Notably, Shigatse City and Jiuquan City represent significant optimization hotspots; Shigatse is projected to achieve exceptional enhancements in water retention (4.77 mm) and soil conservation (64.08 t/km2), while Jiuquan City leads in carbon storage optimization with the highest increment of 18.04 t/ha, demonstrating superior responsiveness to the optimized allocation of ecological lands in these areas.
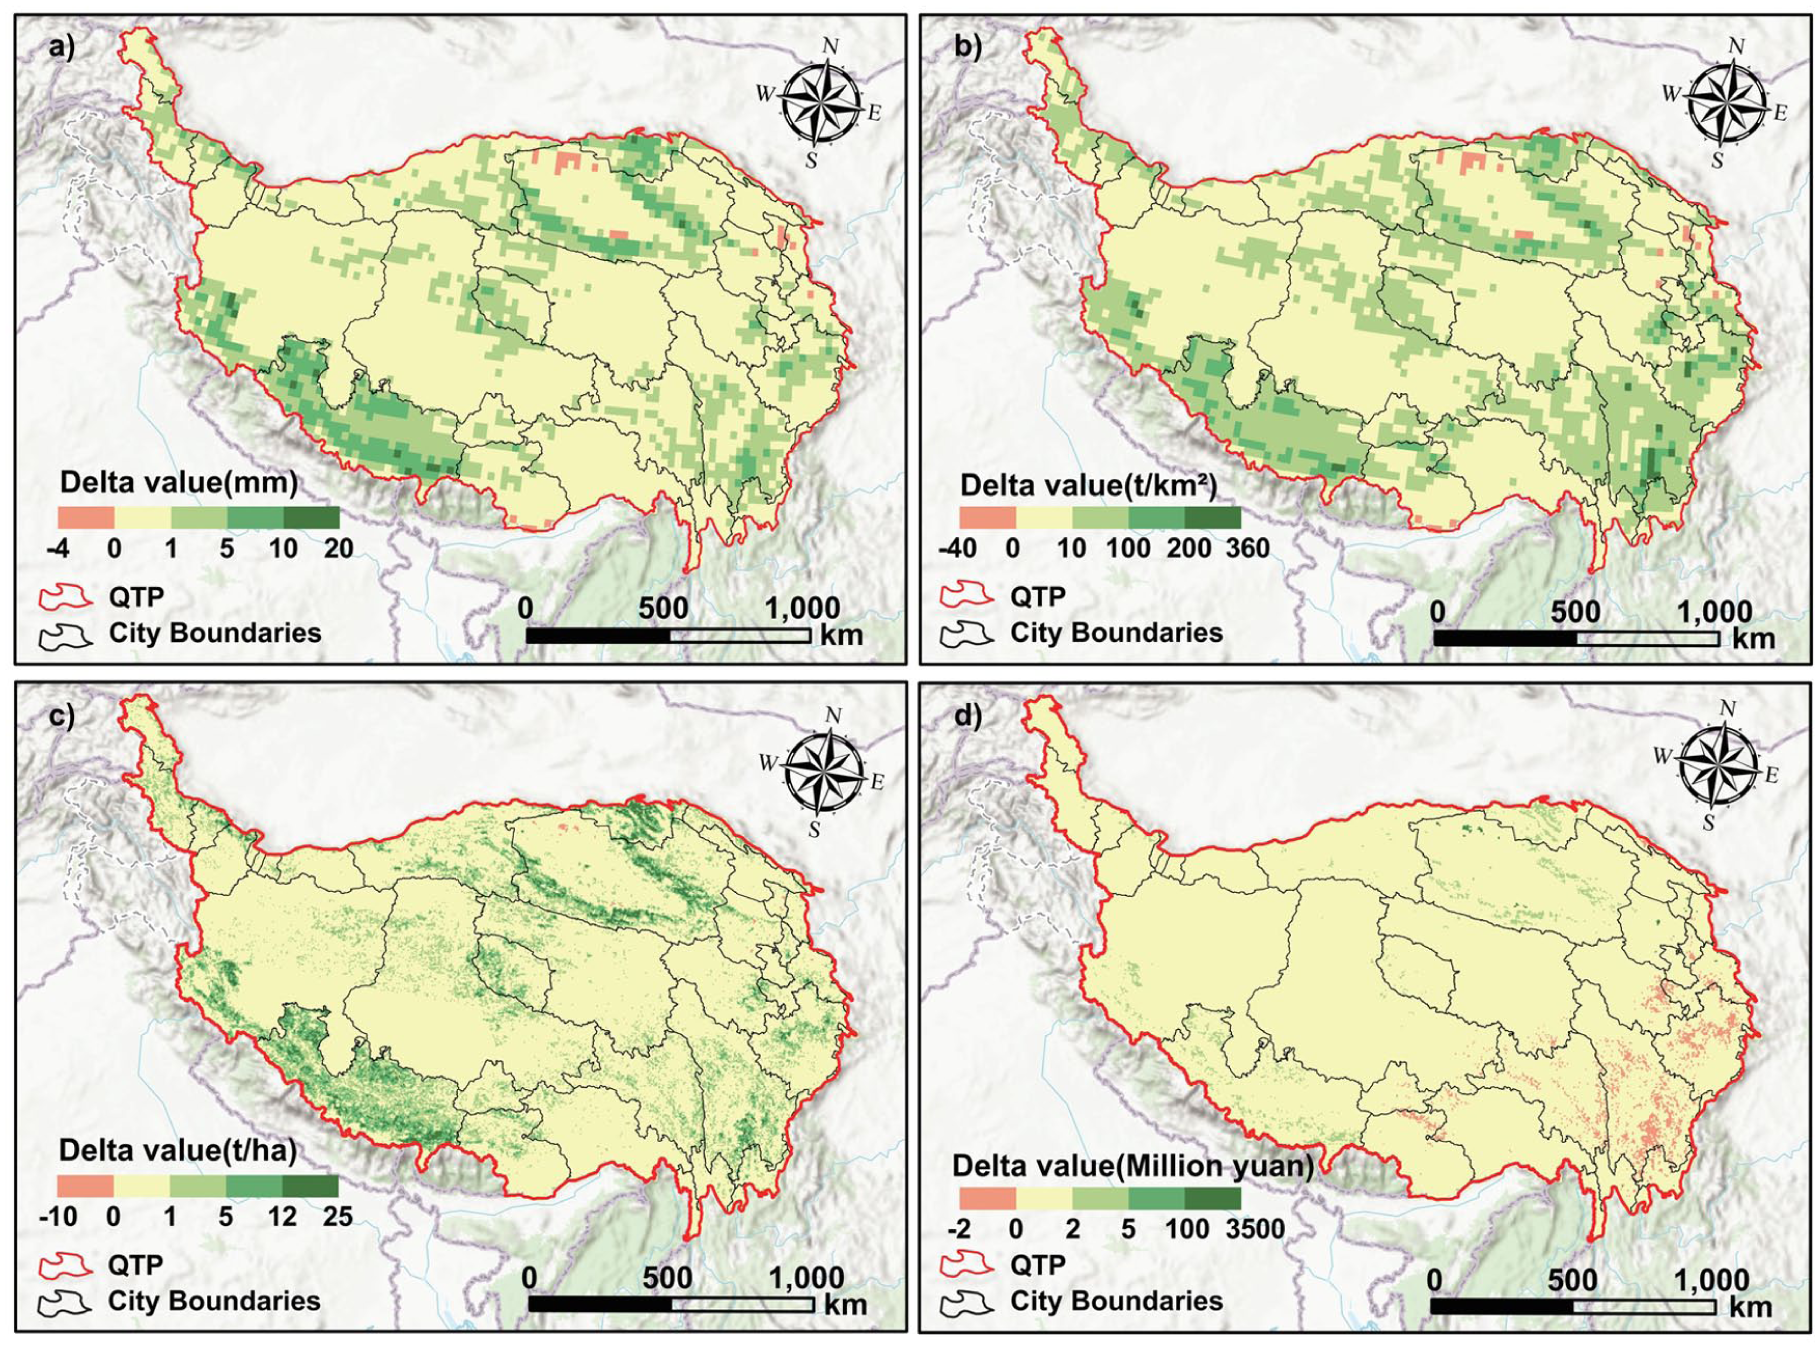
Spatial distribution of improvements for each objective after optimization: (a) Water Retention, (b) Soil Conservation, (c) Carbon Storage, and (d) Economic Benefits.
In contrast to the widespread ecological improvements, the spatial configuration of economic benefit adjustments is characterized by pronounced inter-regional trade-offs. Positive economic enhancements are primarily clustered within Qinghai Province, where urbanization-driven growth is prioritized; Xining City is projected to achieve the most substantial increment of 10.29 × 10⁴ Yuan/km2, followed by Hainan and Haixi Prefectures, while the Qaidam Basin demonstrates the highest economic enhancement potential at the watershed scale 9.18 × 10⁴ Yuan/km2. Conversely, necessary economic trade-offs are observed in the traditional pastoral territories of Western Sichuan. To accommodate large-scale ecological restoration, such as grassland-to-forest conversion, Ganzi and Aba Tibetan Autonomous Prefectures are projected to experience modest economic reductions of −0.35 × 10⁴ and −0.30 × 10⁴ Yuan/km2, respectively. This spatial divergence underscores the inevitable tension between ecological restoration priorities and immediate economic returns in specific ecologically sensitive zones, necessitating differentiated compensation mechanisms.
Discussion
Mechanisms and opportunities of landscape-scale reconciliation of ecological restoration and anthropogenic land-use
The results of this study reveal significant synergies among the ecological objectives of water retention, soil conservation, and carbon storage on the QTP, where improvements in one service often co-occur with enhancements in others (Luo et al., 2022; Zhou et al., 2025). This synergy is particularly pronounced in the southeastern regions of the QTP, where forest expansion under the optimized land-use scheme contributes to simultaneous increases in water retention and carbon sequestration, aligning with the spatial heterogeneity of precipitation patterns under the representative SSP2-4.5 scenario. Notably, the overall optimization outcomes remain consistent across SSPs, indicating robust synergies at the plateau scale. These mechanisms underscore the potential for landscape-scale restoration to leverage natural synergies, as forests not only intercept precipitation to enhance water retention but also stabilize soils against erosion and sequester carbon in biomass pools (Bonnesoeur et al., 2019; Li et al., 2024; Rodrigues et al., 2020). Comparative analyses with prior studies on the Tibetan Plateau indicate that these synergies are amplified under moderate emission scenarios, where vegetation recovery can mitigate cascading effects of permafrost thaw and altered hydrological cycles, with ecological restoration playing a crucial role in mitigating carbon loss caused by permafrost thawing on the QTP (Huang et al., 2024; Liu et al., 2023d). Coordination opportunities are thus evident in transitional zones, such as the eastern margins, where converting grasslands to forests could enhance multifunctionality while supporting China’s ecological redlines, offering a strategic window for integrated management that aligns with the UN Decade on Ecosystem Restoration (2021-2030) (Fu et al., 2023).
Challenges of landscape-scale reconciliation of ecological restoration and anthropogenic land-use
Despite the identified synergies, our optimization results highlight fundamental trade-offs between ecological restoration and economic development, particularly evident in Pareto solutions where maximizing economic benefits conflicts with soil conservation and carbon storage functions, resulting in modest economic reductions in western Sichuan pastoral areas such as Ganzi and Aba Prefectures (−0.35 and −0.30 ten thousand yuan/km2, respectively). These trade-off relationships primarily stem from the opportunity costs of land-use conversions and ecological constraints: when the optimization model converts low-productivity bare land or degraded grasslands to forests or high-quality grasslands, it enhances ecosystem service functions but limits short-term economic returns from traditional pastoral activities, particularly in high-altitude, climatically harsh western regions where the cost-effectiveness ratio of ecological restoration is relatively low (Li et al., 2022; Wang et al., 2024), similar trade-offs have been documented in other ecologically fragile regions such as the Loess Plateau, where ecological restoration scenarios improve regulating services like carbon sequestration and biodiversity conservation but reduce agricultural output by 15% (Jiang et al., 2025). Spatial heterogeneity further complicates the coordination process, as studies indicate that forest expansion in the southeastern QTP can simultaneously enhance multiple ecosystem services. In contrast, grassland restoration in regions with limited precipitation may improve water retention but could face potential challenges such as high maintenance costs and uncertain sustainability (Chen et al., 2025; Jia et al., 2023). Additionally, although SSP2-4.5 is used as the representative scenario in the main text, we conducted a multi-SSP robustness check (SSP1-2.6 and SSP5-8.5) and found only minor differences in the optimized plateau-scale land-use composition. Nevertheless, uncertainties remain due to potential climate extremes such as droughts and heatwaves, and nonlinear ecosystem responses that are not fully captured by the current modeling framework. Future research should further strengthen scenario analysis by incorporating climate extremes, longer-term horizons, and nonlinear ecosystem responses to enhance prediction reliability(Luo et al., 2022; Zhang et al., 2025). Addressing these challenges requires acknowledging socio-economic disparities and local development needs, particularly livelihood transition issues in traditional pastoral areas, with China’s grassland ecological compensation policy practices demonstrating significant positive effects on herder incomes, though requiring differentiated compensation standards and implementation strategies tailored to local conditions to ensure balance between ecological objectives and social acceptability (Hou et al., 2021; Li et al., 2021).
Land-use conversion rules and reconciliation effectiveness
The PLUS model simulations elucidate distinctive land-use conversion rules on the QTP, with forest distribution primarily driven by climatic factors such as precipitation and temperature, explaining the concentrated expansion in eastern transitional zone, while grassland changes follow balanced influences of natural and socio-economic drivers, manifesting a “western increase and eastern decrease” spatial pattern. Meanwhile, cropland distribution is predominantly controlled by topographic factors (elevation as the dominant factor), while construction land is highly dependent on accessibility conditions (nighttime light intensity), with these differentiated conversion rules ensuring spatial contiguity in the optimized configurations (Li et al., 2025a). Recent studies indicate that optimal conditions for land-use transitions in high-altitude regions include precipitation of 275-375 mm, temperature of −2 to 3°C, and elevation of 1800-2600 m, thresholds that align closely with QTP vegetation dynamics (Han et al., 2024). This pattern of “small forest patches combined with large continuous grasslands” not only reflects differentiated responses of underlying ecological processes but also enhances landscape connectivity, providing corridors for wildlife migration (Liu et al., 2023b; Wang et al., 2022a). Spatial differentiation analysis reveals that external river basins achieve forest-grassland coordinated transitions more readily than inland areas, primarily attributed to spatial heterogeneity in hydrothermal conditions (Liang et al., 2021; Wei et al., 2025; Zhang and Li, 2023). Multi-scale improvements in reconciliation effectiveness are evidenced by specific metrics including 4.71 mm increase in water retention in the Ganges watershed and 63.27 t/km2 enhancement in soil conservation, validating the framework’s capability to coordinate ecosystem services across administrative and hydrological units. Importantly, these ecological gains are most pronounced in the wetter southern and southeastern basins, whereas the colder, drier high-altitude western regions experience relatively smaller benefits (Huang et al., 2024). Overall, the optimized scheme achieves a balanced Pareto solution via TOPSIS, offering a quantifiable pathway toward sustainable land allocation while highlighting the importance of regionally tailored management strategies.
Policy implications
This study achieves organic integration of multi-objective trade-offs and spatial configuration in complex plateau environments by integrating ecological assessment models (DTVGM, MUSLE, InVEST) with the NSGA-III optimization algorithm and PLUS spatial simulation framework. The methodological innovation lies in simultaneously considering four objective functions—hydrological regulation, soil conservation, carbon storage, and economic benefits—overcoming the limitations of previous studies that mainly focused on single or dual-objective optimization, effectively avoiding the convergence difficulties of traditional genetic algorithms in high-dimensional objective spaces by maintaining solution diversity (Gao et al., 2021; Li et al., 2025b; Zhou et al., 2024). The integration of spatially explicit PLUS models further ensures the spatial realizability of optimization results, demonstrating the effectiveness of this integrated framework in handling complex terrain and multiple constraints (Wu et al., 2024b). The research results provide evidence-based spatial planning support for national initiatives such as the “Master Plan for Major National Projects to Protect and Restore Important Ecosystems (2021-2035),” particularly in prioritizing forest restoration in high-synergy areas and grassland rehabilitation in water-scarce basins, providing scientific evidence for precise management of the QTP ecological barrier area (Fu et al., 2023; Luo et al., 2022). Meanwhile, the economic trade-off phenomena revealed by the study provide important references for improving grassland ecological protection compensation policies, suggesting the establishment of differentiated ecological compensation standards to ensure coordinated development between ecological restoration and herders’ livelihoods (Hou et al., 2021; Wang et al., 2024). More importantly, this study’s methodological framework exhibits strong transferability and scalability, offering a replicable approach for other fragile ecosystems facing similar ecological-economic trade-offs. It promotes deep integration between global ecosystem restoration practices and the UN Decade on Ecosystem Restoration (2021-2030) goals by establishing standardized multi-objective optimization decision-support systems (Fu et al., 2023).
Limitations and prospects
Despite the optimization model providing mathematically optimal solutions, several key constraints must be considered in practical applications. First, the 1 km spatial resolution limits detailed characterization of the complex topography of the QTP. In particular, precipitation forcing at 0.25° may not fully capture sub-grid orographic precipitation variability on the plateau, and such smoothing can propagate into DTVGM-based hydrological estimates (e.g., water retention) and the regression-based coefficient estimation; this scaling-related uncertainty could be reduced in future work using bias-corrected/downscaled climate products or regional climate model forcing. In addition, although our multi-SSP robustness check suggests that plateau-scale optimized land-use composition is relatively insensitive to SSP choice over 2020–2035, stronger divergence may emerge over longer time horizons or at finer spatial scales, particularly under extreme climate conditions. Second, forest expansion in extremely high-altitude areas faces biophysical limitations, with challenges including low afforestation survival rates and high maintenance costs in environments above 4000 m elevation with annual average temperatures near 0°C (Fu et al., 2023; Huang et al., 2024). Meanwhile, large-scale grassland restoration is constrained by water resources, requiring substantial artificial irrigation support in arid areas with annual precipitation below 400mm. Additionally, the study does not adequately consider important dimensions such as biodiversity conservation, with optimization results reflecting theoretical potential rather than short-term achievable goals. In the future, with the development of high-resolution remote sensing technology and artificial intelligence algorithms, multi-objective optimization will become more refined, and improved social-ecological system coupling models will better handle complex human-land system interactions. It is recommended to adopt phased and regionalized progressive implementation strategies, prioritizing pilots in areas with suitable ecological conditions and high technical feasibility, establishing long-term monitoring mechanisms, and dynamically adjusting schemes based on implementation effects.
Conclusions
This study successfully developed and implemented a comprehensive multi-objective optimization framework for reconciling ecological restoration with anthropogenic land-use demands across the QTP under future climate scenarios. The optimization framework identified substantial synergistic relationships among ecological objectives, with water retention, soil conservation, and carbon storage demonstrating strong co-benefits across the study region. Across three CMIP6 climate scenarios (SSP1-2.6, SSP2-4.5, and SSP5-8.5), the optimized land-use allocation scheme produced highly consistent plateau-scale outcomes; therefore, SSP2-4.5 is presented as the representative case, under which significant improvements in ecosystem service delivery were projected, including water retention enhancements of up to 4.71 mm in the Ganges watershed, soil conservation increases reaching 63.27 t/km2 in high-priority areas, and carbon storage improvements of 14.49 t/ha in forest transition zones. The spatial implementation revealed distinct conversion patterns, with forest expansion concentrated in the southeastern transitional zones (7,909 km2 in the Yangtze River basin) and grassland restoration following a “western increase, eastern decrease” distribution pattern. However, trade-offs between ecological restoration and economic returns were observed, particularly in traditional pastoral areas of western Sichuan, where modest economic reductions (−0.30 to −0.35 × 10⁴yuan/km2) accompanied ecological improvements.
The integration of DTVGM, MUSLE, and InVEST models with NSGA-III optimization and PLUS spatial simulation advances multi-objective landscape management, overcoming prior single-objective limitations through concurrent four-objective optimization while ensuring spatial implementability. This framework shows strong transferability to fragile ecosystems facing comparable ecological-economic conflicts and supplies critical scientific evidence for China’s Master Plan for Major National Projects to Protect and Restore Important Ecosystems (2021-2035) and global restoration goals under the UN Decade (2021-2030). Identifying high-synergy restoration areas offers targeted guidance for resource allocation in plateau ecosystem management, whereas revealed economic trade-offs inform refinements to differentiated compensation policies that address regional disparities and livelihood transitions in traditional pastoral communities, laying a foundation for adaptive ecosystem management.
Supplemental Material
sj-docx-1-tee-10.1177_2754124X261434516 – Supplemental material for Landscape-scale reconciliation of ecological restoration and anthropogenic land use on the Qinghai-Tibet Plateau
Supplemental material, sj-docx-1-tee-10.1177_2754124X261434516 for Landscape-scale reconciliation of ecological restoration and anthropogenic land use on the Qinghai-Tibet Plateau by Changhao Chen, Xiaoming Feng, Xuejing Leng and Jianjun Zhang in Transactions in Earth, Environment, and Sustainability
Supplemental Material
sj-docx-2-tee-10.1177_2754124X261434516 – Supplemental material for Landscape-scale reconciliation of ecological restoration and anthropogenic land use on the Qinghai-Tibet Plateau
Supplemental material, sj-docx-2-tee-10.1177_2754124X261434516 for Landscape-scale reconciliation of ecological restoration and anthropogenic land use on the Qinghai-Tibet Plateau by Changhao Chen, Xiaoming Feng, Xuejing Leng and Jianjun Zhang in Transactions in Earth, Environment, and Sustainability
Supplemental Material
sj-jpg-3-tee-10.1177_2754124X261434516 – Supplemental material for Landscape-scale reconciliation of ecological restoration and anthropogenic land use on the Qinghai-Tibet Plateau
Supplemental material, sj-jpg-3-tee-10.1177_2754124X261434516 for Landscape-scale reconciliation of ecological restoration and anthropogenic land use on the Qinghai-Tibet Plateau by Changhao Chen, Xiaoming Feng, Xuejing Leng and Jianjun Zhang in Transactions in Earth, Environment, and Sustainability
Footnotes
Acknowledgements
We thank the National Tibetan Plateau Data Center for providing the datasets used in this study. We are also grateful to the anonymous reviewers for their constructive comments.
Funding
The authors received no financial support for the research, authorship, and/or publication of this article.
Declaration of conflicting interests
The authors declared no potential conflicts of interest with respect to the research, authorship, and/or publication of this article.
Supplemental material
Supplemental material for this article is available online.
Author biographies
References
Supplementary Material
Please find the following supplemental material available below.
For Open Access articles published under a Creative Commons License, all supplemental material carries the same license as the article it is associated with.
For non-Open Access articles published, all supplemental material carries a non-exclusive license, and permission requests for re-use of supplemental material or any part of supplemental material shall be sent directly to the copyright owner as specified in the copyright notice associated with the article.