
Abstract
During COVID-19, people needed to travel and meet as a group physically to gain benefits such as overcoming loneliness. Using multiday continuous smartcard data, we can identify intentional travel groups (ITGs) in cities. Using the 2020 smartcard data of the Hong Kong metro system, we first construct a dataset of probable ITG trips (PIGTs) where two riders swiped in and out at the same stations within one minute during weekends—we choose weekends because there are fewer co-presenting metro commuters entering and/or exiting the same station. Assuming that ITGs would have more PIGTs and smaller exit time difference than those co-presenting by coincidence, we then identified ITGs as those with at least four PIGTs in a month. To see whether and how the pandemic impacted ITGs, we geo-visualize the quantity of the identified ITGs by metro station and between metro stations on three different Sundays before and during the pandemic. The results indicate that ITGs’ distribution by metro station and between metro stations changed notably after the outbreak of COVID-19.
Physical social contacts can increase the risk of virus spread among people. Thus learning about how people gather and conduct group-based activities amid contagious pandemics like the COVID-19 can help us monitor high-risk places and virus transmission routes in cities (Benzell et al., 2020; Flaxman et al., 2020; Sullivan et al., 2021). On the one hand, people often retain some group-based activities, such as physically meeting with friends and working with colleagues, during the pandemic to overcome loneliness, sustain intimacy, and increase productivity. On the other hand, these activities might entail face-to-face interactions without wearing a mask, which increases the risk of virus spreading. When exploring such potential social contacts and activities in cities, there have been some studies utilizing data such as transit smartcard swipe records (Sun et al., 2013; Zhou et al., 2020) and cell phone signals (Calabrese et al., 2011). Most of the existing studies focused merely on the co-presence of people, which might not necessarily result in social interactions. Due to a lack of empirical group-travel data, little research, however, has truly captured group-based activities where two or more people purposefully meet and travel together.
In this research, we attempt to identify and visualize intentional travel groups (ITGs) in a metro system, which serve as a proxy for us fathom social interactions among travelers who know each other and purposefully engage in group-based activities. Hong Kong is chosen as the study area of the research. As a transit-reliant city, Hong Kong metro carries 41% of the daily trips and thus metro riders’ behaviors could well represent those of a significant portion of the population in the city.
Since the first local case was confirmed on January 23, 2020, Hong Kong suffered from four case surges during the year and implemented a series of countermeasures to mitigate virus spreading, e.g., restrictions on social gatherings. These could potentially impact how people perceived the infection risks and adjusted their physical group-based activities. Stations remained as popular destinations of ITGs, posing high risks of virus spreading. Nevertheless, the heterogeneous variations in ITGs’ quantity across stations reflect inequalities in distribution of essential opportunities and facilities for economic and social activities in the city.
Based on metro smartcard data recording hashed ID as well as entry/exit times and stations, we tried identifying ITGs in Hong Kong metro system before and during the pandemic. Each ITG consists of two riders who are considered to know each other and conduct metro trips together. To fathom out these cohorts in the metro system, we assumed that
(1) Metro riders in ITGs would synchronize in time and locations more frequently than those meeting by coincidence, especially during the weekends when there are fewer concurrent trips for regular commuting and more social activities for leisure and maintenance.
(2) The entry or exit time difference of ITG trips between two riders in the ITG would generally be smaller than that between riders traveling together by coincidence (Zhu et al., 2021).
After that, we exploited metro smartcard data of Hong Kong covering 104 Saturdays/Sundays in 2020 (Zhou et al., 2024). Specifically, we first constructed a dataset of probable intentional group trips (PIGTs) including any two riders swiping in and out the same stations within one minute. Then, considering that ITGs would have more PIGTs and smaller exit time difference than those co-presenting by chance, we conducted a KS-test for distribution of the exit time difference (0-60 seconds) between riders’ PIGTs to screen out ITGs. In this test, we assumed that rider i and j in an ITG would conduct at least β PIGTs in any month. The KS-tests were adopted for various potential β, and for an ideal β, riders with at least β PIGTs and those following a higher threshold should follow the same distribution in exit (or enter) time difference of trips. Based on the KS-test results, we finally defined β = 4, which means an ITG includes two riders with at least four PIGTs in a month.
Figure 1 shows the numbers of incoming ITGs by station and the top 100 station pairs that saw the most ITGs traveling between them on three Sundays in 2020. The three Sundays are: one before outbroke of the pandemic (January 12, 2020), one during the second case surge (March 29, 2020), and one during the third case surge (July 26, 2020). In the figure, each red point on the maps represents a metro station. The larger and darker a point is, the more incoming ITGs the metro station had. On the other hand, each curve describes the ITGs traveling between pairs of stations. The line’s width represents the relative volumes of ITGs. The panel to the left highlights the locally notable COVID-related events.
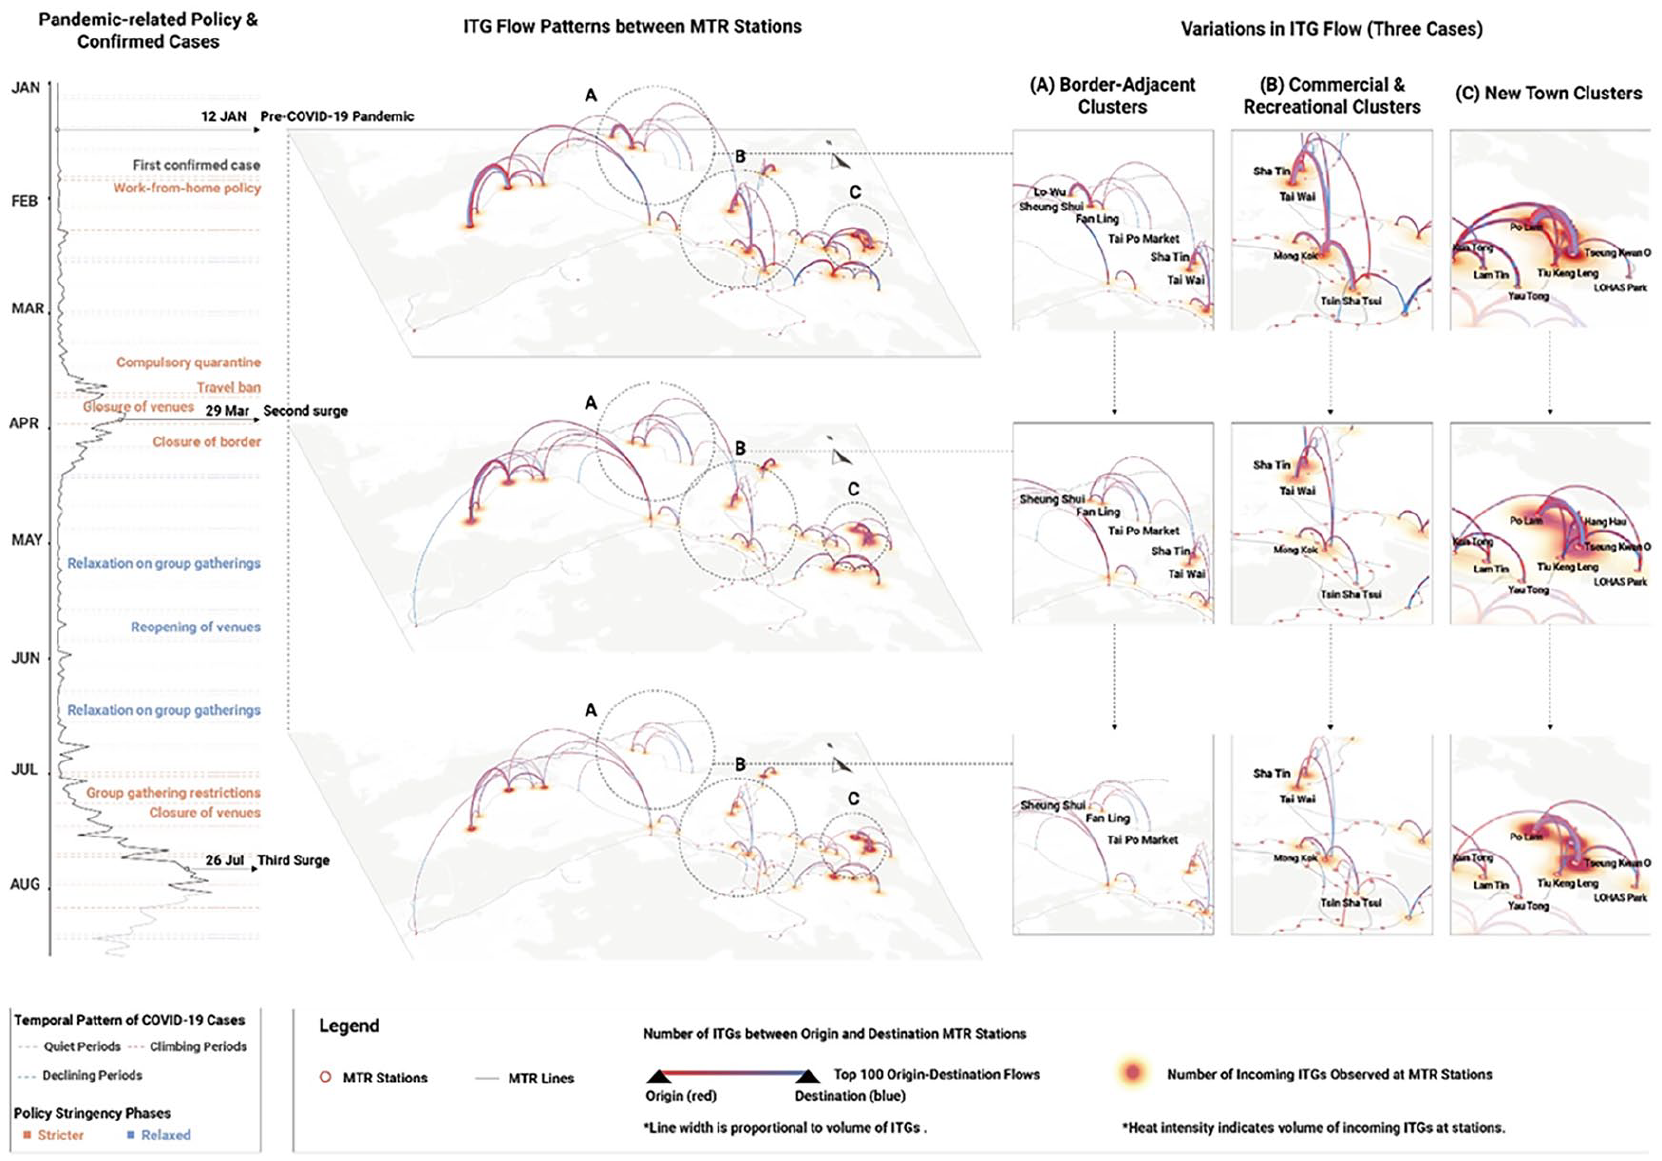
ITG distribution by and between station(s) before and during the pandemic.
The figure allows us to detect the following ITG patterns and their changes during the pandemic. First, the numbers of incoming ITGs varied across stations and two types of stations were found to be popular destinations before the local pandemic outbroke. One type is the local commercial and recreational center, for instance, Mong Kok and Tsin Sha Tsui. The other serves new town centers, such as Tseung Kwan O and Sha Tin, where large areas of residences and mixed land functions exist.
Second, ITGs generally decreased after the pandemic outbroke whereas the sizes of the change were heterogeneous across space and time. Overall, ITG sizes were compressed more in the third surge compared to the second surge, when increased COVID-19 cases emerged and related countermeasures were implemented. Stations at the northern area and those serving the citywide commercial and recreational centers, for instance Tsin Sha Tsui and Mong Kok, suffered more ITGs than other parts of the city. During the pandemic, the closure of cross-border checking points, those linking Hong Kong and Mainland China, located in the northern area, and suspension of non-essential businesses might have particularly decreased ITGs in the north part and commercial centers that normally attract incoming group-based visiting and activities. Comparably, new-town stations such as Tseung Kwan O continuously had comparable numbers of incoming ITGs despite the increased caseloads and more stringent restrictions on social gathering.
Third, more ITGs could be observed between stations next to each other. These stations often supplement each other functionally. For instance, the large quantity of ITG flows could be found between Tai Wai, where most of the land uses are residences, and Sha Tin, where there are large-scale shopping malls and versatile entertainment facilities. Fourth, a notable number of long-distance ITG flows disappeared after the local pandemic outbroke and most ITG flows between neighboring stations remained highly visible.
Footnotes
Declaration of conflicting interests
The author(s) declared no potential conflicts of interest with respect to the research, authorship, and/or publication of this article.
Funding
The author(s) received no financial support for the research, authorship, and/or publication of this article.