
Abstract
Over the past decades, shared micromobility services (SMSs) have experienced ever-fast growth around the world. Such increment has raised issues such as how to improve the efficiency of the service operation and regulation. To address these issues, it is essential to understand how and why these SMSs are used. This research aims to infer trip purposes of two types of dockless SMSs, i.e., dockless shared bikes and e-bikes, and make a comparison between them, mainly using a Latent Dirichlet Allocation (LDA)-based analytical framework. The proposed framework was applied in Ningbo, China by combining a large-scale bike-sharing trip dataset and a Points of Interest (POIs) dataset. In our case study, we successfully revealed seven typical trip purposes, i.e., transport, work, lodging, eating, shopping, education, and others. The results showed that eating is the most prevalent trip purpose for both bike and e-bike users. Surprisingly, the proportions of transport-related trips were insignificant compared to previous observations, for both shared bikes and e-bikes. Moreover, the shared bike played a more significant role than the shared e-bike in daily trips related to lodging and education, indicating that the role of the shared e-bike in these trips might have been overestimated previously. This study provides insight into the trip purposes of SMSs and gives targeted planning and operation suggestions, which can promote sustainable development of the urban micromobility systems.
Introduction
Intensive urbanization is taking place around the world and has caused various urban issues like traffic congestion, air pollution and public health crises (Han et al., 2018; Wang, 2018). One of the remedies to these urban problems is to make urban transport shift toward low-carbon mobility forms. By facing this background, a comparatively new concept has appeared in the transport realm: shared micromobility services (SMSs). SMSs often refer to shared, light-weight, low-speed, eco-friendly transport modes, represented by bike-sharing systems, which have been proven to have various benefits including addressing first and last-mile problems, decreasing carbon emissions by discouraging the use of private cars, as well as increasing physical activities of urban dwellers, therefore contributing to tackling urban issues (Milakis et al., 2020; Pettersson et al., 2016; Zhang and Mi, 2018). The first bike-sharing system “White Bicycle” was adopted in Amsterdam, the Netherlands in 1965 and, since then, bike-sharing systems have experienced steep growth worldwide, especially in the past decade. More recently, electric bikes (e-bikes) and electric scooters (e-scooters) sharing systems have also grown and these services have become critical components of urban transport systems, facilitating the daily socioeconomic activities for residents.
The huge growth of SMSs has raised a series of issues regarding urban planning regulation, its influence on the whole urban transport system, and its socioeconomic and environmental impact (Abduljabbar et al., 2021; Madapur et al., 2020). An important prerequisite for responding to these issues is understanding the mobility patterns of SMSs, as the SMSs’ impacts to a large extent are reflected by their role in reshaping the mobility patterns of cities. Recently, it has been pointed out that urban mobility patterns can be regarded in essence as the massive interaction between urban dwellers and complicated traffic patterns with different trip purposes (e.g., commuting, cultural, and recreational activities) (Rodrigue, 2020). Therefore, the investigation into trip purposes of micromobility can help us depict and understand urban mobility more comprehensively, while it can also contribute to resolving various SMSs planning and regulation issues like bike-sharing demand prediction under different scenarios, for supporting the development of urban micromobility transport systems.
Despite there being several studies dedicated to mobility patterns, especially spatiotemporal characteristics of SMSs (Bieliński and Ważna, 2020; Li et al., 2022a), there is limited research investigating trip purposes of SMSs (Bao et al., 2017; Li et al., 2022b; Ross-Perez et al., 2022; Xing et al., 2020). Recently, the emergence of dockless SMSs provides us with an unprecedented data source (passively collected large-scale trajectory data) to comprehend mobility patterns, especially trip purposes of SMSs at a finer spatiotemporal granularity than ever before. Their dockless nature provides users with enough flexibility to get as close as possible to destinations. Such door-to-door services have led to a more precise understanding of trip purposes which can be revealed by massive trip data mining. By combining travel data, especially the locations and timestamps of origins/destinations, and other auxiliary data such as Points of Interest (POIs), land use and land cover maps, using various methods such as the Bayesian rule-based method, the Markov chain model, and random forests (Alsger et al., 2018; Han and Sohn, 2016), the trip purposes of SMSs can be inferred.
Undeniably, the existing work on the trip purpose inference of SMSs has some limitations. Firstly, although many studies are devoted to the trip purpose imputation of SMSs, they are not consistent with each other in their findings. Furthermore, current studies mainly focus on only one mode of SMSs at a time, and a trip purpose comparison of various SMSs is still absent. Such comparative analyses are obviously significant for fully portraying the usage of SMSs and providing targeted planning and operation strategies for different types of micromobility. Consequently, given the research gaps faced by existing studies, it is necessary to scrutinize the trip purposes of SMSs and make comparisons between different SMSs types via emerging data mining methods.
This study aims to infer and compare trip purposes for two types of SMSs, namely, shared bikes and shared e-bikes. Specifically, a Latent Dirichlet Allocation (LDA)-based analytical framework will be used. Trip purposes will be inferred by combining structured travel patterns extracted by the LDA model and ancillary data POIs. The main contribution of this study is three-fold. Firstly, an LDA-based analytical framework is proposed to extract the latent travel patterns and reveal trip purposes of dockless shared bikes and e-bikes in Ningbo. Secondly, this is the first study that systematically compares trip purposes between different SMSs, namely shared bikes and e-bikes at an aggregated level. Thirdly, planning and operation recommendations are provided for different trip purposes and scenarios for shared bikes and e-bikes, respectively, aiming to support the sustainable development of the dockless micromobility systems in the city.
The rest of the paper is organized as follows. The first section reviews the relevant literature on SMSs and trip purpose inference for SMSs. The next section elaborates on the detailed process of trip purpose inference, including the datasets and the LDA-based analytical framework. The following section presents our analytical results. The discussion and conclusions are provided in the final section.
Literature review
The booming development of SMSs around the world has attracted increasing academic attention. The vast majority of existing studies on SMSs have concentrated on four main areas: the description and profiling of the spatial-temporal characteristics (Chicco and Diana, 2022; Kou and Cai, 2019), the exploration of factors impacting the SMSs’ usage (Li et al., 2020b; Shaer et al., 2021), the planning and operation problems, including fleet scheduling, geofencing area planning (Chen et al., 2022; Zhang et al., 2019b), and the substitution, competition, complementarity between different shared micromobility types, and between these types and other transport modes like car-hailing and public transport (Bieliński et al., 2021; Kroesen, 2017). Furthermore, there is a paucity of studies focused on the issues such as the inequity issue of SMSs (Caspi, 2022), carbon emissions and environmental effects (Liu, 2022), and users’ safety (Li et al., 2022c).
Controversy and limitations of current studies
Technically, the study on the trip purposes inference of SMSs falls in the category of describing the usage of SMSs, and this theme has gained growing attention recently. However, there is little consensus in the current literature. For instance, Bao et al. (2017) investigated trip purposes of docked shared bikes by exploring the smart card dataset from Citi Bike in New York City. They found that dining out is the most popular reason for bike-sharing trips, followed by transport and shopping. Parallel results were obtained by Xing et al. (2020), who adopted K-means clustering to reveal dockless bike-sharing patterns and trip purposes in Shanghai, yet limitations were present, as clustering analysis cannot determine the real purpose when the cyclist’s destination is a POI with many possible activities (e.g., integrated locations, commercial complex). Li et al. (2020a) addressed this limitation to an extent, by applying a Dirichlet multinomial regression topic model to impute destination activities of dockless bike-sharing in Shanghai and more accurate trip purposes were obtained. Nevertheless, their results slightly diverged from Xing et al. (2020), showing the most popular purpose for dockless shared bikes is commuting, followed by dining out.
The trip purpose inference of e-bikes and e-scooters sharing has also caught scholars’ attention. Guidon et al. (2019) analysed eight months of transaction data from a dockless e-bike sharing system in Zurich, Switzerland, and showed that the primary trip purpose was commuting. However, He et al. (2019) investigated the historical travel data from the Summit Bike Share system in Park City, Utah, concluding that e-bike sharing is mainly done for recreation by casual users. Moreover, dockless e-scooter trips occurring in Washington, DC were shown to be highly related to recreation, according to McKenzie (2019). While e-scooters in Singapore were mainly adopted by college students who travel between metro stations and their campuses (Zhu et al., 2020). Overall, there is little consensus in the current literature about the trip purposes of SMSs. The contradictions may be caused by the distinctly different urban geographical contexts and the rapid development of SMSs.
Aside from disputes over their findings, most existing studies have only investigated the trip purposes for the users using a single type of micromobility, but comparisons of trip purposes between various micromobility types are lacking. Such comparison is important for the refined and targeted governance of different SMSs under different purpose scenarios. Specifically, current comparative studies between different SMSs mainly focus on travel patterns and characteristics (Almannaa et al., 2021), user profiles (Bieliński and Ważna, 2020), level of services (Kazemzadeh and Ronchi, 2022), and safety risks (Li et al., 2022c), while trip purposes comparison is ignored. More recently, Reck et al. (2021) conducted a comparative analysis of four different shared micromobility services in Zurich, Switzerland, and examined the micromobility mode choice in scenarios with different purposes and destinations. Results indicated that the mode choice was dominated by trip distance and time of day and docked modes are preferred for commuting trips. In a word, their research provides a good starting reference in this area.
The methods used to infer trip purposes
Considerable effort has been made on developing the methods to infer the trip purposes of SMSs. Traditionally, scholars mainly use questionnaire surveys to study trip purposes. For example, Shaheen et al. (2012) investigated the usage of bike-sharing systems in North America through an online survey. Their finding suggested that most people ride shared bikes for the purpose of commuting to work or study. Weis et al. (2021) analysed survey data derived from the Mobility and Transport Microcensus (MTMC) in Switzerland, concluding that there was a correlation between the choice of routines, urban mobility modes and trip purposes. However, critics pointed out such conventional surveys are expensive, time-consuming, and may even involve a degree of subjectivity, causing a relatively high cost but low accuracy (Krause and Zhang, 2019).
With the rapid development of big data technology, scholars have an opportunity to reveal trip purposes in a cost-efficient way, by developing various data mining methods. A series of rule-based methods have been proposed, underpinned by the basic concept that trip purposes are restrained by a series of soft constraints like space, time, and sequence of activities. An example is Zou et al.’s (2018) study, wherein trip purposes were identified based on the internal spatiotemporal relationship within multi-day smart card transaction data from Beijing’s subway. Additionally, Zhang et al. (2018) distinguished trips, trip chains, and transition activities by using a 5-month bike-sharing trip data in Zhongshan (China) and showed that most cyclists ride to commute. The trip purposes inference not only relies on spatial and temporal constraints, but can also be achieved with the support of auxiliary data sources like POIs, land use and land cover maps, and mobile signalling data (Sari Aslam et al., 2021; Ying et al., 2014). For example, Gong et al. (2016) developed a Bayesian rule-based model and combined this model with a Monte Carlo simulation to estimate the probability of visiting different POIs for taxi trips. Drawing on Gong’s method, Ross-Perez et al. (2022) uncovered the trip purposes of dockless bike-sharing trips in Manchester, and they found that the trips to residential areas are predominant.
Recently, to adapt to the ever-growing complexity of rules used in the studies of trip purpose inference, scholars have attempted to apply sophisticated machine learning methods which can automatically identify potential features in large-scale datasets. These methods can be divided into supervised and unsupervised. The former generally need to be trained with the assistance of auxiliary datasets (e.g., travel surveys). For instance, Ermagun et al. (2017) developed a trip purposes prediction model based on nested logit and random forest algorithms. In this model, trip information was incorporated with Google Places API to deduce trip purposes. Meanwhile, Alsger et al. (2018) developed a model to investigate passengers’ trip purposes using smart card fare data from Brisbane, Queensland. Their model was calibrated and validated using multivariate data including Household Travel Surveys, and land use data. Compared to the supervised machine learning model which needs to be trained with the support of auxiliary datasets with predefined recognition labels, diverse unsupervised machine learning methods are regarded as more cost-efficient, and therefore are increasingly used in the field of trip purpose inference, such as K-means clustering (Xing et al., 2020), and the hidden Markov model (Han and Sohn, 2016). Among the unsupervised machine learning methods, the topic modelling represented by Latent Dirichlet Allocation (LDA) has been gaining popularity since it can effectively extract latent spatiotemporal dynamics on activity without predefined keywords and grammar logic (Blei et al., 2003), which has unique advantages compared to previous methods. For instance, previously utilized methods such as Monte Carlo simulations (Ross-Perez et al., 2022) and hidden Markov chain models (Han and Sohn, 2016), which mainly rely on probabilities to infer trip purposes. However, these methods may result in convergence in the purposes of trips arriving at close destinations, since travellers are more likely to choose the place with the highest probability as their destination. Additionally, studies utilizing K-means clustering (Xing et al., 2020) to compute trip purposes only considered origin and destination separately, failing to provide a comprehensive analysis of structured travel patterns with the integration of origin-destination pairs. In contrast, LDA-related methods can be utilized to synthesize origin-destination pairs and extract comprehensive structured travel patterns from numerous shared micromobility records. For example, Bao et al. (2017) adopted the LDA algorithm to analyse structured travel patterns and disclose the trip purposes of Citi Bike users in New York, while Li et al. (2022b) used such methodology to infer the underly purposes of dockless e-scooter trips in Washington, DC. These studies, to some extent, bridged the methodological gap and demonstrated the potential and value of LDA-based topic modelling on trip purpose inference for SMSs.
Enlightened by existing studies, it can be summarized that, despite huge efforts dedicated to understanding SMSs, works related to trip purpose inference and comparison of purposes between different micromobility services are still limited. LDA, a topic modelling method, has been demonstrated to be useful in efficiently inferring trip purposes. Based on these, this study aims to apply an LDA-based analytical framework to infer trip purposes of two types of dockless SMSs: dockless shared bikes and e-bikes.
Methodology
Study area
Ningbo is a megacity located in the northeast of Zhejiang Province, China. Our study area was limited to the central area of Ningbo, including five administrative districts, i.e., Zhenhai, Beilun, Haishu, Jiangbei, and Yinzhou (Figure 1). According to the Ningbo statistical yearbook (China Statistic Press, 2020), these five districts had a total population of nearly one million and a total gross domestic product of 269 million in 2019, being the most densely populated and urbanized areas in Ningbo. This area has witnessed an explosion in the number of dockless shared vehicles and their ever-growing influence on urban transport since 2016 (Han, 2020). Such a close connection between Ningbo and SMSs provided us with an opportunity to gain deep insight into the role of micromobility in the city.
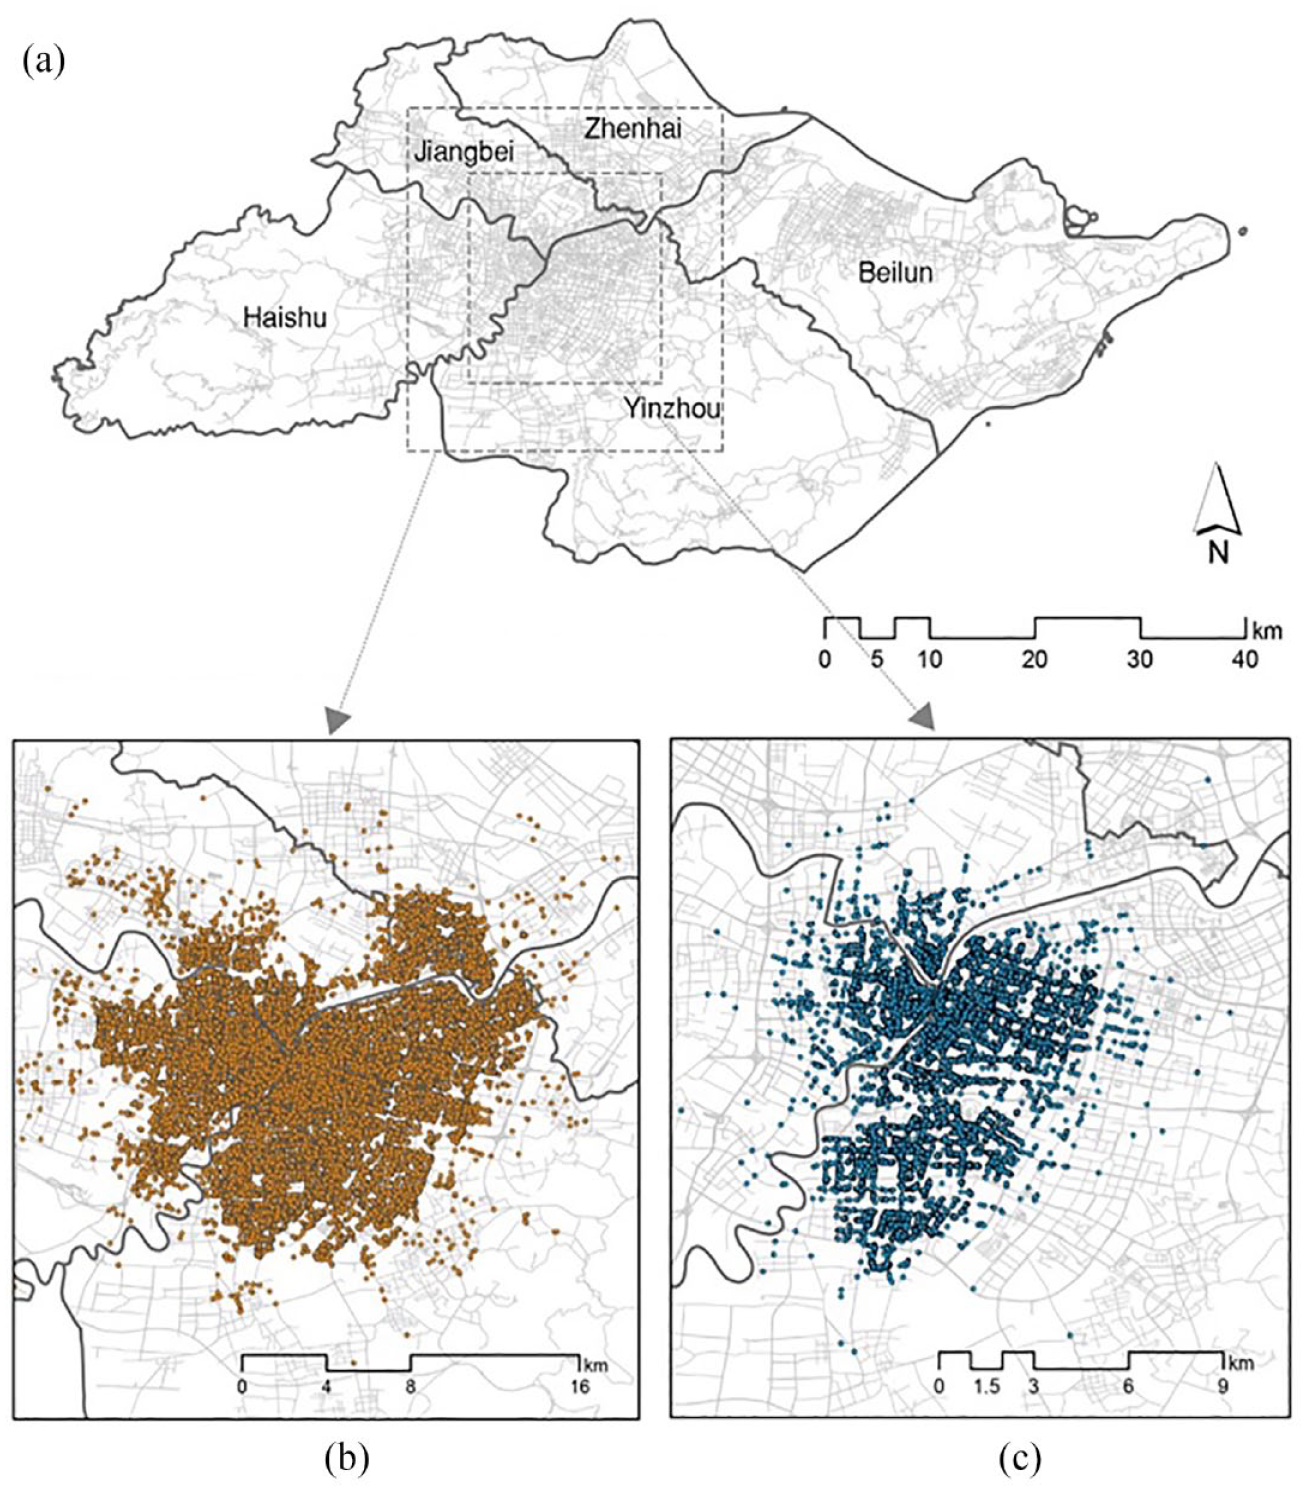
Study area. (a) The central area of Ningbo, Zhejiang Province. (b) The concentration area of shared bikes. (c) The concentration area of shared e-bikes.
Data
Two main datasets were used in this study: a dockless bike-sharing travel dataset and a Points of Interest (POIs) dataset. The dockless bike-sharing (including shared bikes and e-bikes) travel dataset was provided by Hellobike, 1 one of the largest internet technology companies focusing on the operation of bike-sharing systems in China. The dataset contains 616,638 trips generated in Ningbo, covering a time period from 14th to 20th September 2020. Each trip record has the attributes of order ID, bike ID, anonymous user ID, bike type, the latitudes and longitudes of the pick-up/drop-off points, and pick-up/drop-off time. In the dataset, the trips with a duration of less than 1 min or more than 2 hours were excluded, via referring to some existing studies (Zhang et al., 2019a). After this preprocessing, a total of 598,431 trips were eventually selected as our study sample. Figure 1 clearly shows that bike-sharing trips were mainly generated around the urban centre rather than scattered around the city. To clearly illustrate the travel characteristics of the two types, the following analyses will be focused on their own concentration areas.
The POIs data was obtained using application programming interfaces (APIs) provided by AutoNavi (also called Gaode Map 2 ), a leading navigation company in China. This dataset contains 391,571 POIs in the central area of Ningbo with related information including names, geographical coordinates, and official categories of their functions (e.g., residential buildings). However, the official POIs classification is somewhat cumbersome for trip purpose inference. Generally, travel purposes include recurrent activities like commuting, and schooling as well as casual activities such as shopping, eating, and seeking services. Combining the common travel purposes in the existing literature and the official POIs classification provided by AutoNavi, the POIs were recategorized into 11 types including some common urban functions like residential, shopping, eating, etc. (Figure 2).
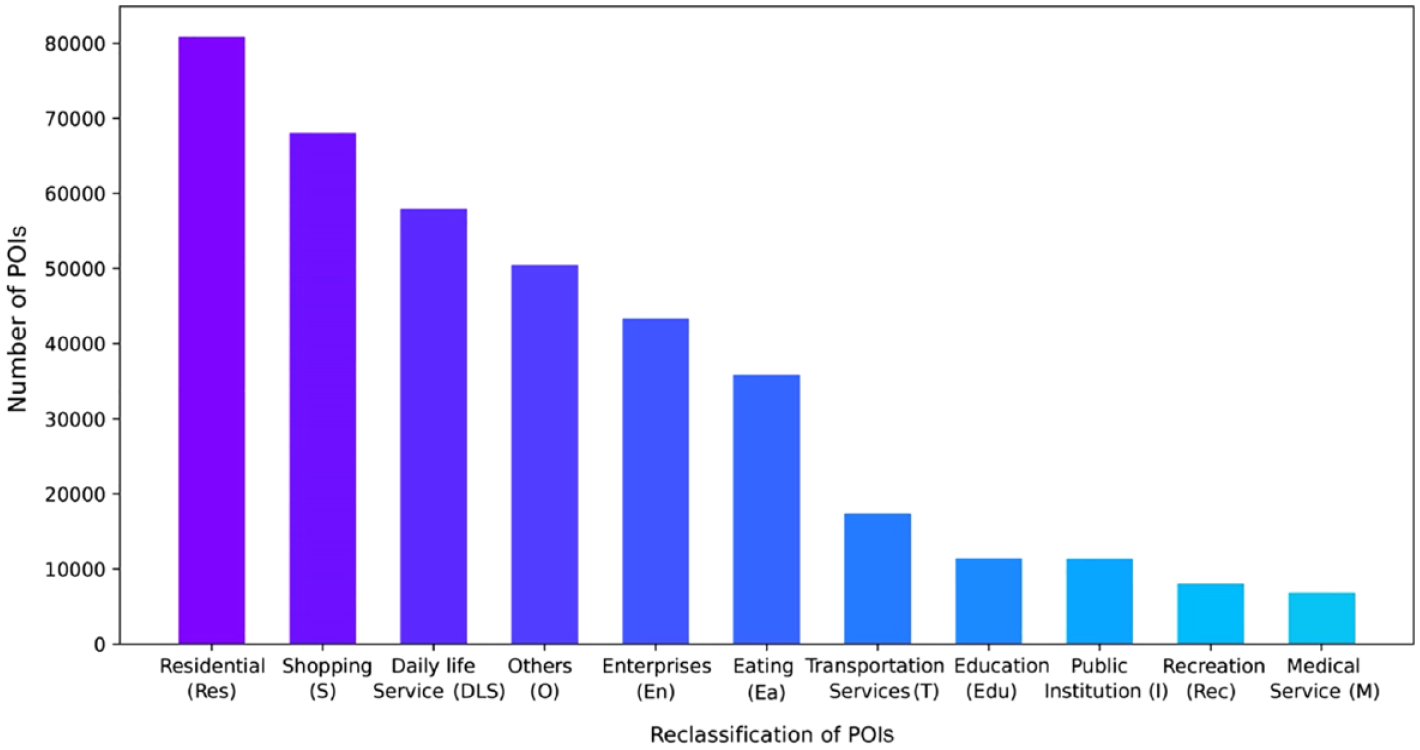
Reclassification of POIs.
An LDA-based analytic framework to infer trip purposes
Inspired by existing studies, we proposed an analytical framework to infer the trip purposes of cyclists (Figure 3). It mainly consists of two steps, namely trip annotation and the LDA model, where the first step involves three sub-steps including destination area definition, POI feature vectors calculation, and bike-sharing trips categorizations via K-means clustering algorithm. The framework will be discussed step by step in the following sections.
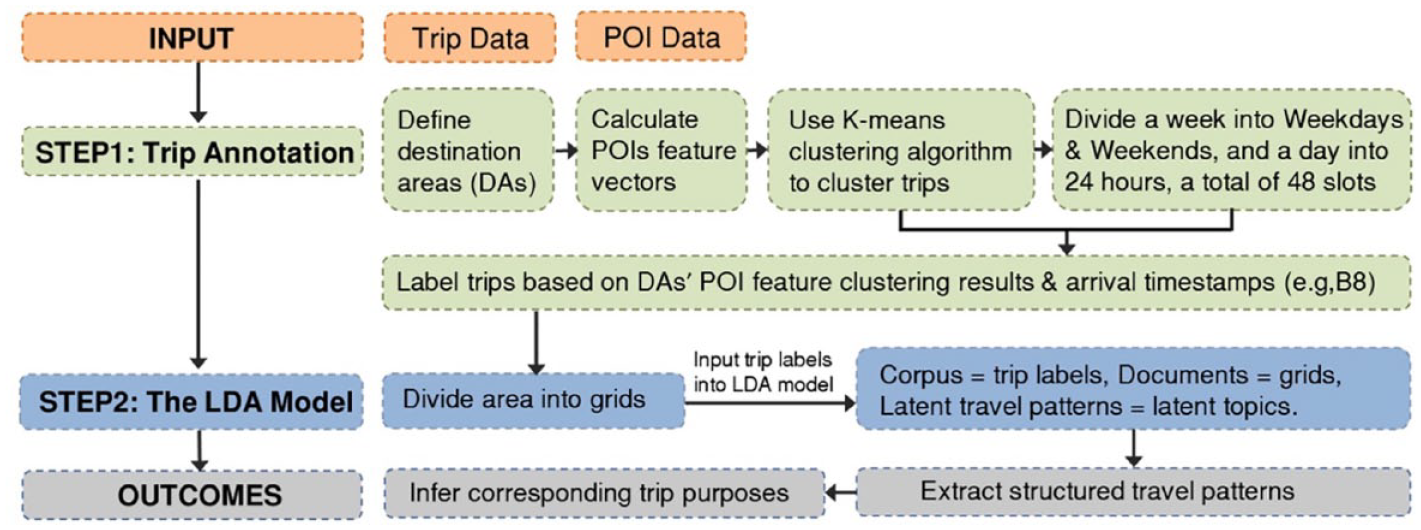
Analytical framework.
Define destination areas
In this study, we assumed that dockless bike-sharing users prefer to park bikes as close to their destinations as possible. Finding the connection between drop-off points and destinations is the key to trip purpose inference. The geo-coordinates of drop-off points cannot be directly used as the cyclists’ destinations for two reasons. Firstly, there is a location deviation between the potential destination and drop-off point, as users usually park their dockless shared bikes in defined parking areas (such as geofencing) and then walk to their destination. Secondly, due to technical reasons, GPS errors often exist, i.e., the geo-coordinates of origins and destinations recorded by the equipment are likely to offset from actual coordinates to some extent (Li et al., 2020a).
Considering the above reasons, to accurately establish the connection between the drop-off point and the intended destination, this study defined a destination area for each trip using a buffer (Figure 4). The different radii δ of the buffer (from 10 m to 100 m, 10 m as a step) were examined. The percentages of buffers covering at least one POI were calculated according to the method proposed by Gong et al. (2016). We found that the percentage remained stable at 96% when δ reaches 50 m. Thus, δ = 50 m was determined as the distance threshold and 574,603 trips were kept as our trip samples.
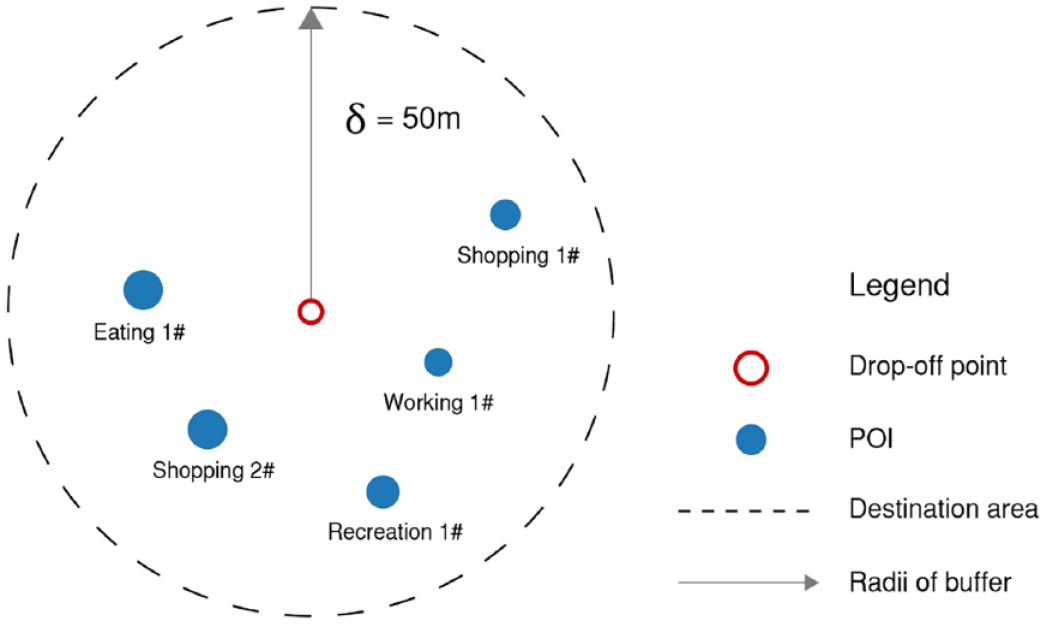
Destination area.
Calculate feature vectors for POIs’ distribution
After defining the destination area, the surrounding POIs’ distribution characteristics of the trip’s drop-off point can be calculated. Each trip was denoted with a POI feature vector. For example, the proportion of 11 types of POIs within the 50 m buffer of the drop-off point can be represented with
Categorize bike-sharing trips
The POI feature vectors obtained in the previous subsection were input into the K-means clustering model to categorize trips. K-means clustering is an efficient unsupervised machine learning algorithm that has been frequently applied to divide a set of data into specified K clusters by minimizing the intra-cluster distance and maximizing the inter-cluster distance (Macqueen, 1967). Besides, the algorithm can give clustering centres, each of which is a central point that can most accurately represent the cluster and show its characteristics. Therefore, in this paper, K-means clustering was used to categorize bike-sharing trips based on their POIs feature vectors. Specifically, trips with similar POIs distribution feature vectors in the destinations were grouped into the same cluster.
The key point of acquiring an ideal clustering result is to determine a proper K value, which controls the number of clusters. The silhouette coefficient is adopted here to find the optimal K value, and is calculated as follows:

where
Annotate trip with labels
In this subsection, we annotated the trips with trip labels, which are discrete variables and can be input into the LDA model. First, trips were annotated according to the clustering results obtained in the previous subsection. The logic is that trips with the same purpose tend to have destinations with similar properties. Second, the arrival timestamps were considered, as the trip purposes may vary by arrival time. For example, those who visit a commercial area around noon are more likely to be going for food rather than working there. For example, if the K-means clustering method grouped trips with different destinations into three categories, they are correspondingly labelled with A, B, C. If a cyclist arrives at a destination with the feature of type B POI distribution at 8:00 am on Monday, this trip will be annotated with “B8”.
Extract travel patterns via LDA
The LDA model is a topic model that is widely employed in natural language processing areas. It has often been used to extract latent topics from a large volume of documents based on the concept that documents in a corpus are a combination of topics and each word appears in the documents supporting the specific topics (Blei et al., 2003). The LDA model is trained to count the term frequencies, allowing the extraction of the latent topics in a document, and finally the output of two probability distribution matrices of documents-topics and topics-words.
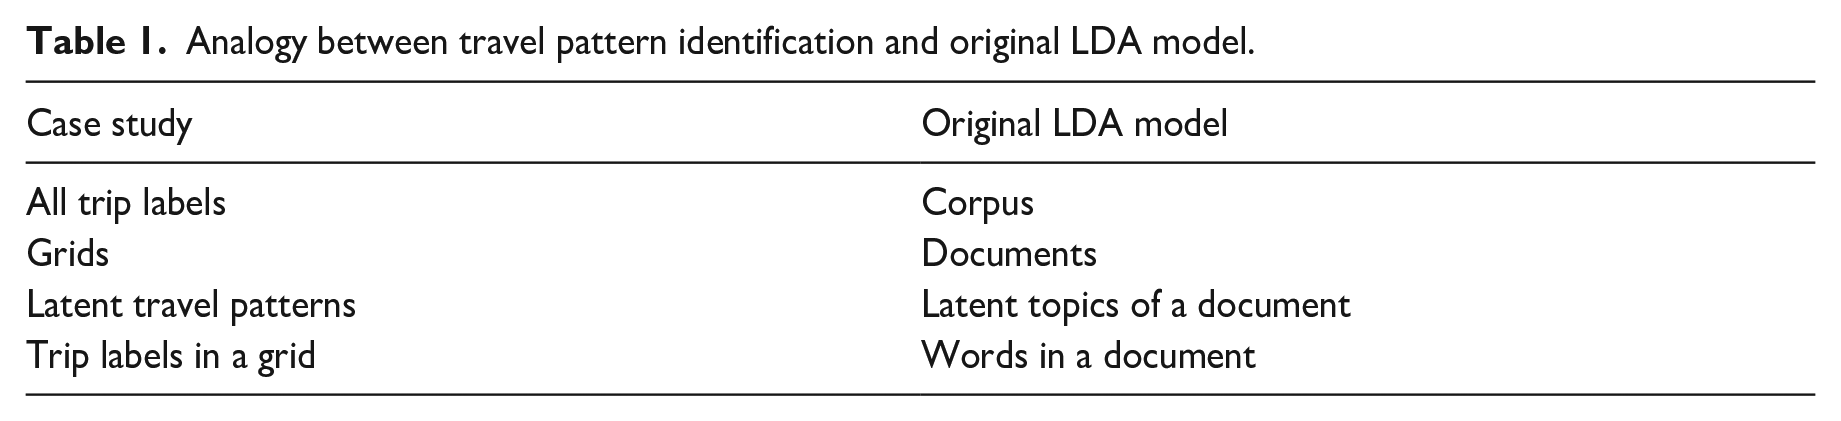
In this paper, the LDA model drew an analogy between extracting latent topics behind documents and revealing hidden trip patterns behind trip records. We divided the study area into grids with a length/width of 500 m, referring to Chang et al.’s (2020) research. Naturally, each grid contained several trips and their trip labels. Grids, bike-sharing travel patterns, and trip labels were served as documents, topics, and words respectively. We display the details for the analogy in Table 1.
Analogy between travel pattern identification and original LDA model.
The general process of the LDA model is:
(1) For each grid Gd ϵ {G1, G2,…,GD}, we draw a travel pattern distribution parameter vector θd ~ Dirichlet(α).
(2) For each latent travel pattern kn ϵ {k1, k2,…,kN}, we draw a trip label distribution parameter vector ∅ k ~ Dirichlet(η).
(3) For each travel label ⅈ in Grid Gd :
a. Draw a travel pattern zd,i ~ Multinomial (θd);
b. Draw a trip label ω d,i ~ Multinomial (∅ Z d,i )
where D is the number of grids, N is the number of latent bike-sharing travel patterns, θ and
In this model, three parameters need to be pre-specified: K (the number of topics), α and η (the hyper-parameters of two Dirichlet distribution matrices). The Variational Expectation-Maximization (VEM) algorithm, which can automatically initialize the hyper-parameters of the model based on sufficient statistics (Blei et al., 2003), was adopted to obtain optimal α and η . In addition, the number of topics, K, for this study, that is the number of latent travel patterns, is a significant input which greatly impacts the LDA’s performance. This study computed the perplexity to determine the optimal K value, calculated as follows:

where D represents the corpus of trip labels, M is the number of grids, N(d) is the number of trip labels in each grid, and pw(d) means the produce probability of trip label w(d) in grids.
Results
Exploratory analysis
Figures 5a and 5b display the temporal distribution of bike-sharing trips on weekdays and weekends, respectively. Both shared bike and e-bike trips show obvious arrival peaks in the morning and evening peaking times, and a volume bottom at 3 am. When it comes to the proportion of shared bikes and e-bikes usage at the hour level (Figure 5c), shared bikes account for most trips most of the time, but e-bikes are dominant between 3 am and 5 am, indicating the importance of e-bikes for night-time travel.
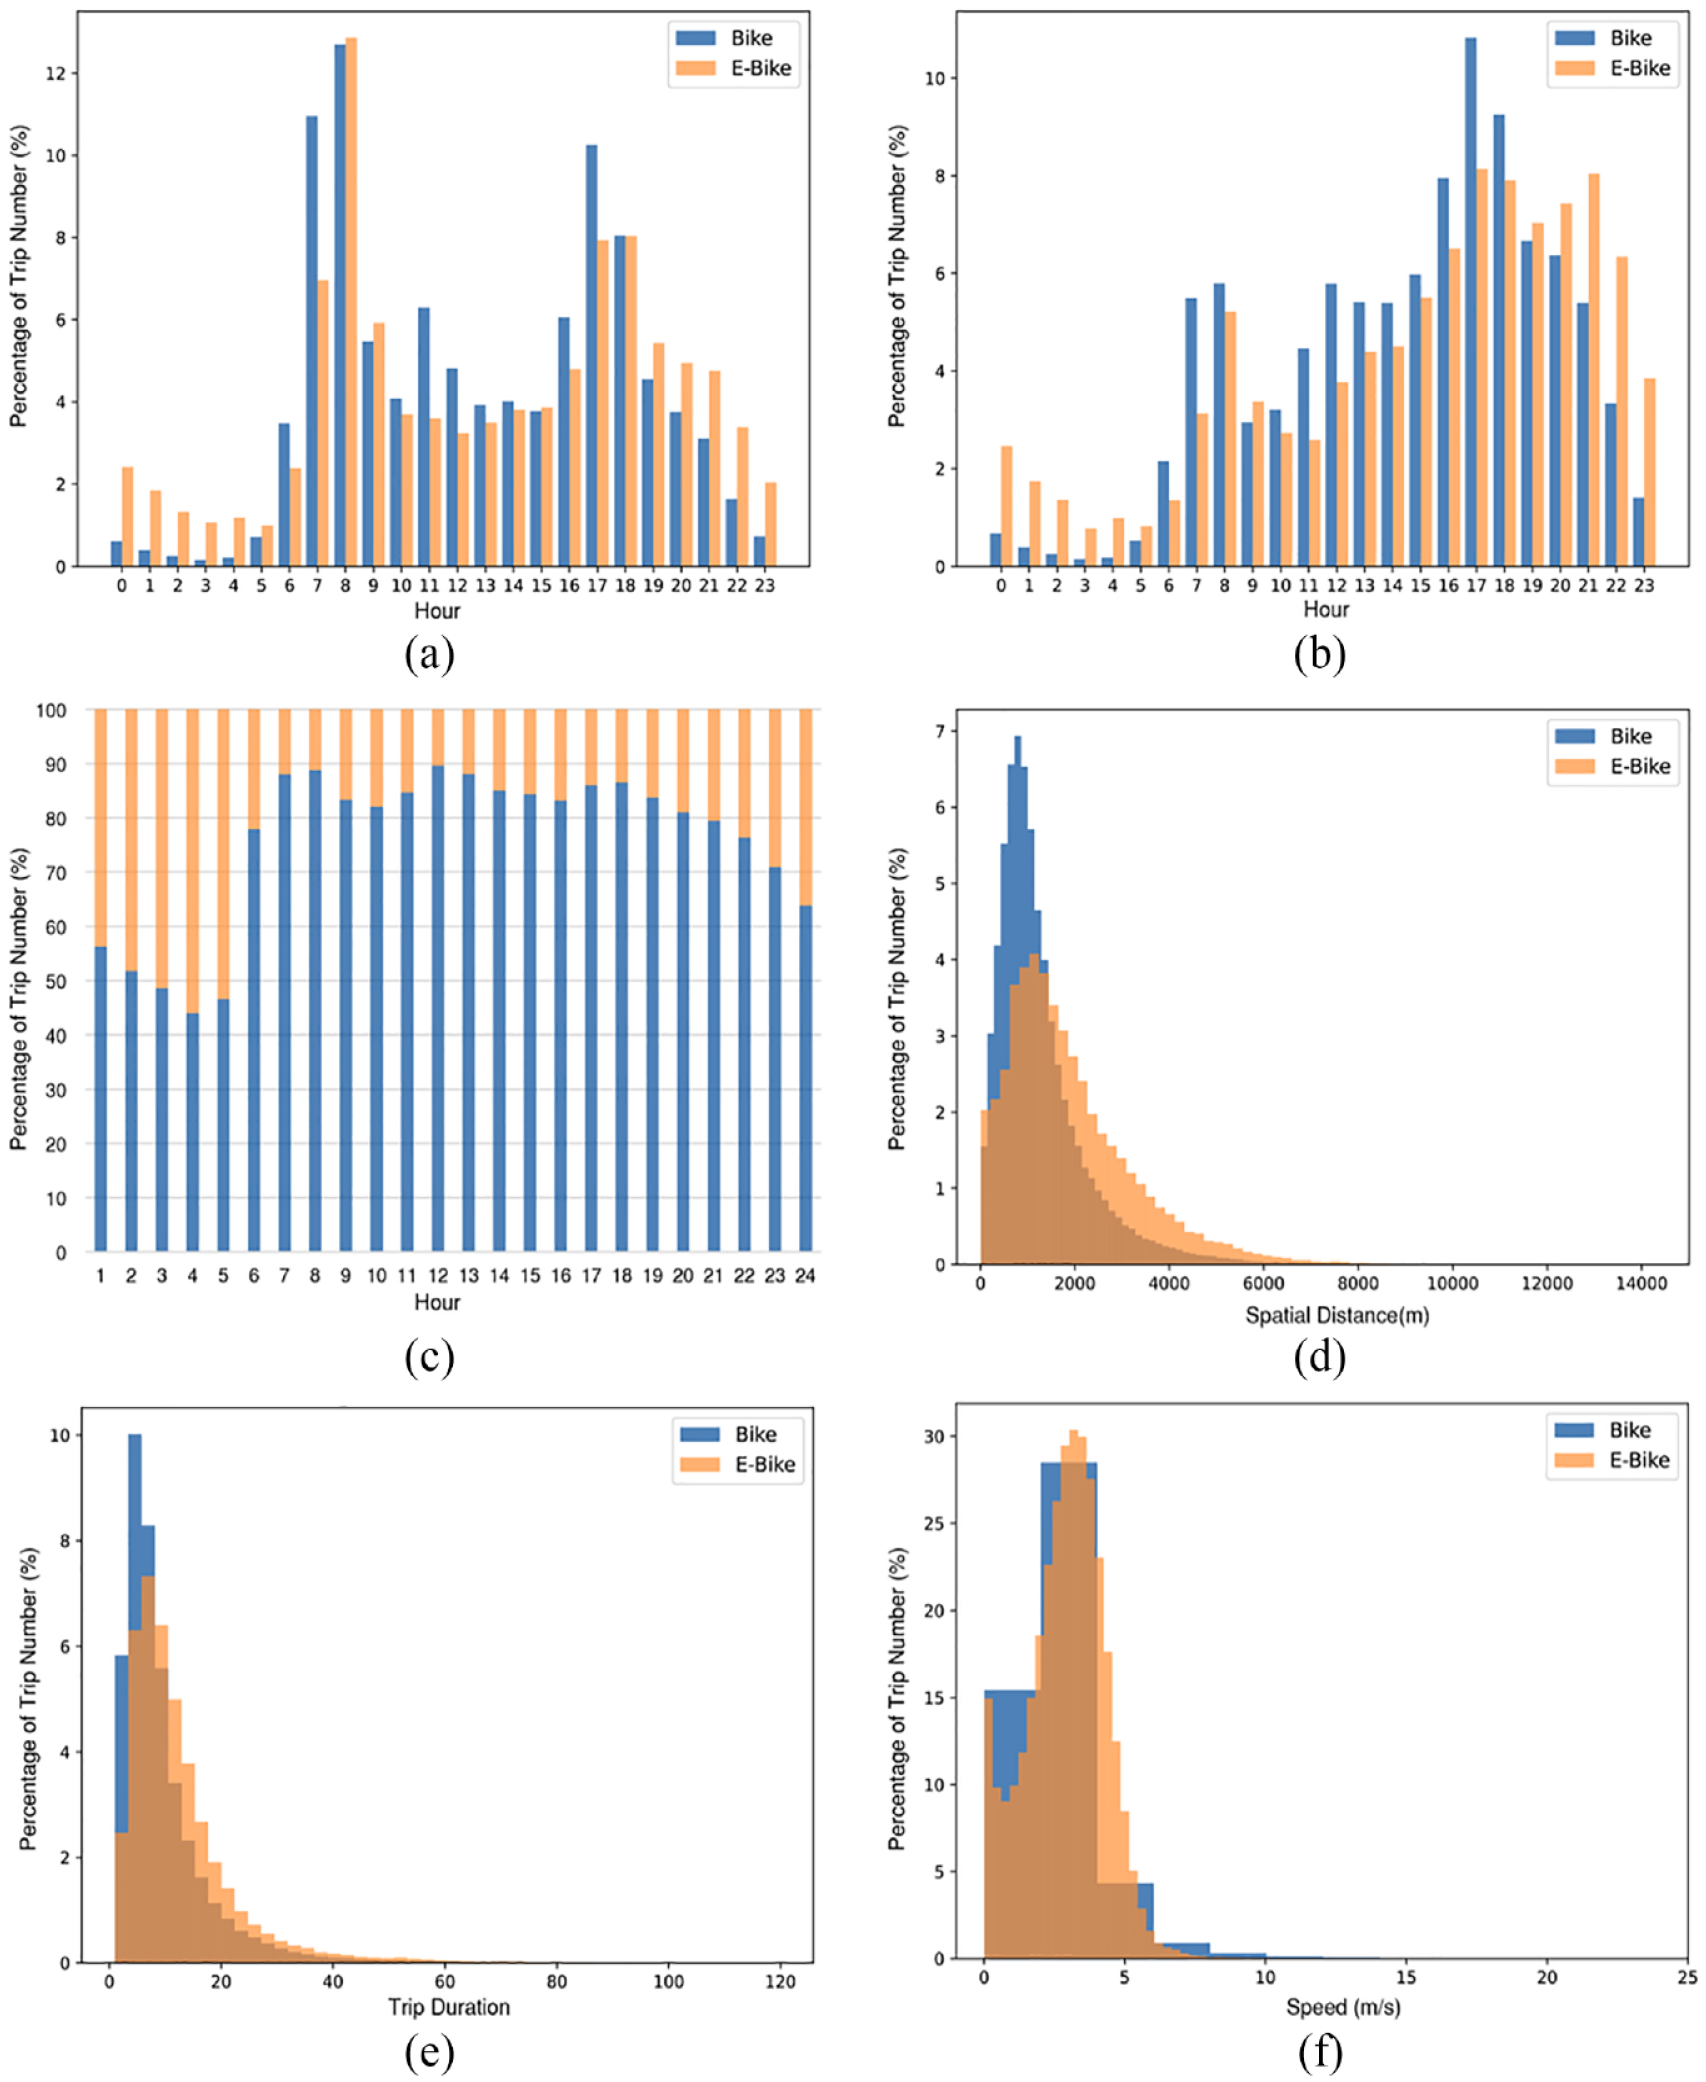
Exploratory analysis of trip data. (a) Temporal distribution of bike-sharing trips on weekdays. (b) Temporal distribution of bike-sharing trips on weekends. (c) The proportion of two modes varied by hour. (d) Spatial distance distribution of bike-sharing trips. (e) Trip duration distribution of bike-sharing trips. (f) Speed distribution of bike-sharing trips.
Figure 5d shows that the majority of shared bike trips are shorter than 2 km, while most e-bike trips are between 1.5 km and 3 km. Figure 5e suggests most shared bikes and e-bike trips are less than 30 minutes, accounting for 96% and 94% of all bike and e-bike trips, respectively. However, the histogram of e-bikes is more left-skewed than that of bikes, suggesting the average trip duration and distance of e-bike trips are longer than those of bikes.
Figure 5f shows the speed distribution of the shared bike and e-bike trips. Overall, the speed difference between these two types is not obvious. The average speed of a bike is 2.7 m/s, while that of an e-bike is 2.91 m/s. An interesting finding shown in the histogram is that the speed distribution of bikes is more concentrated, while that of e-bikes shows abundant variation. This may be because people tend to have a fixed rhythm for energy-saving when riding regular bikes. By contrast, the speed of e-bikes is more varied as users can adjust this by controlling the electric power system.
Bike-sharing trips categorizations
We used the K-means clustering algorithm to categorize bike-sharing trips according to the POI feature vector of their drop-off points. To obtain the optimal K value, we tested K ranges from 2 to 7. Corresponding silhouette coefficients were calculated. The result demonstrates the clustering algorithm has the best performance when K = 5, thus all bike-sharing trips are divided into five types.
Table 2 shows the clustering centres of five categories, which illustrate the POIs’ distribution characteristics of the destination of different types of trips. The destinations of type A trips are highly related to residential areas. Type B trips end at areas with shopping, eating, and services POIs. Type C trips are transport-related. Type D trips are relevant to “others” POIs. Type E trips have the destinations surrounded by educational POIs. Figure 6 displays the spatial distribution of five trip categories.
The clustering centres of five trip categories.
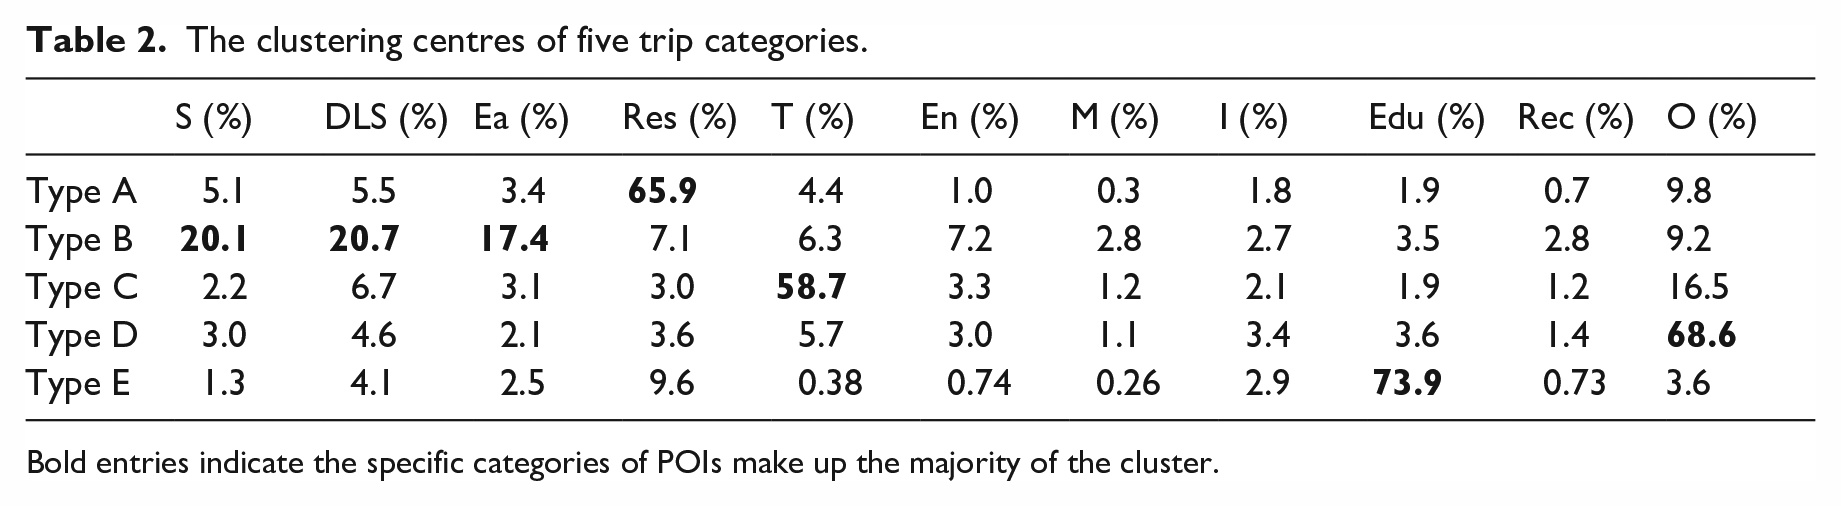
Bold entries indicate the specific categories of POIs make up the majority of the cluster.
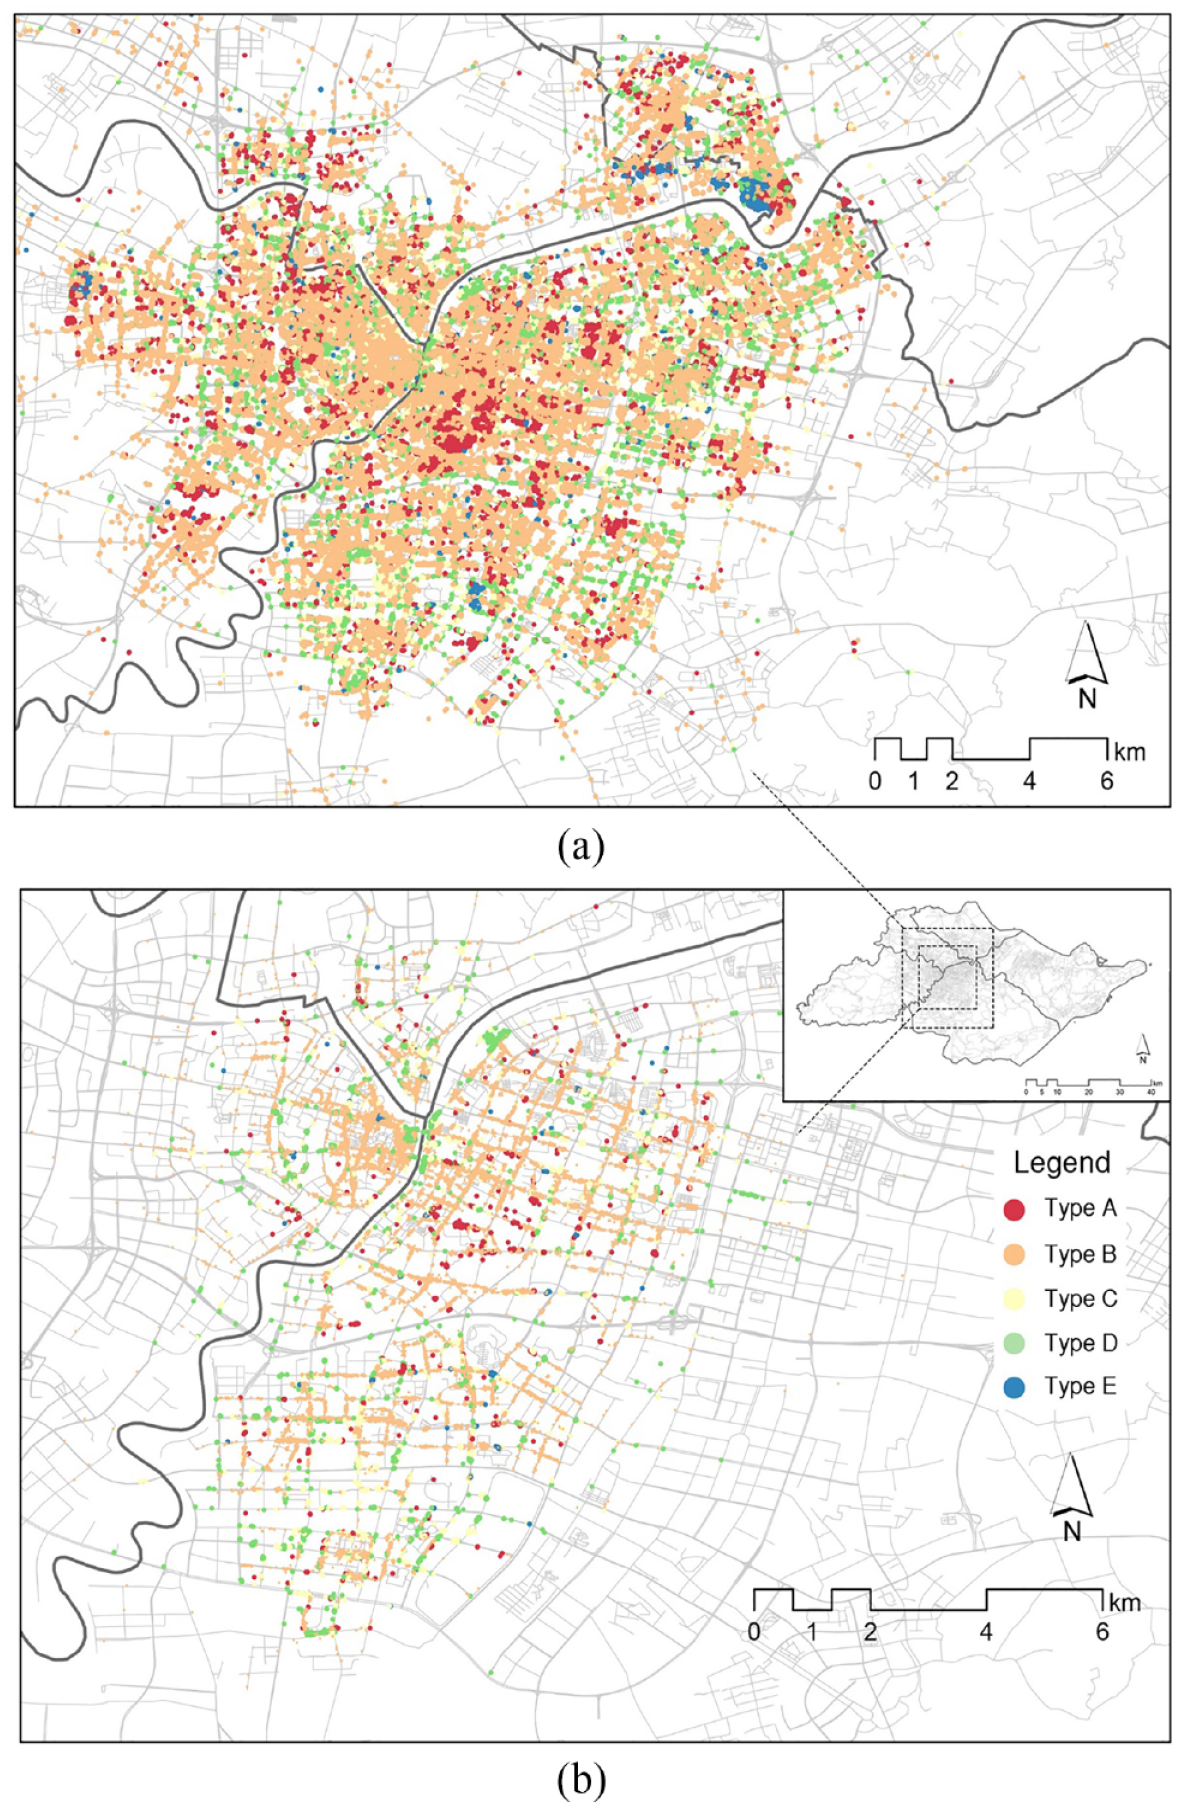
Spatial distribution of five categories of trips. (a) Trip annotation for shared bikes. (b) Trip annotation for shared e-bikes.
To check the reliability of the clustering result, a comparison between the trip clustering result and the Gaode satellite map was conducted. Several typical areas were selected and compared with the satellite map shown in Figure 7. One of the gathering points of type A trips was verified as the residential Oriole New Village. One of the largest commercial complexes “Tianyi Square” was surrounded by type B trips but without any trip records within the square boundary since it was positioned as a pedestrian plaza. The trips in type C generally arrived at the intersection or the side of the road, where the metro station and bus stops were commonly located. The figure shows some D-type trips ended around parks. A possible reason is that the relatively small number of park POIs make themselves hard to be identified by K-means clustering, eventually being labelled as “other”. Some trips on the campus of Ningbo University were accurately clustered as Type E trips. Surprisingly, the trips that end in the student’s dormitory were classified as Type A, while the trips with destinations around the dining hall and book stores were categorized as Type B, testifying to the reliability of the K-means clustering method.
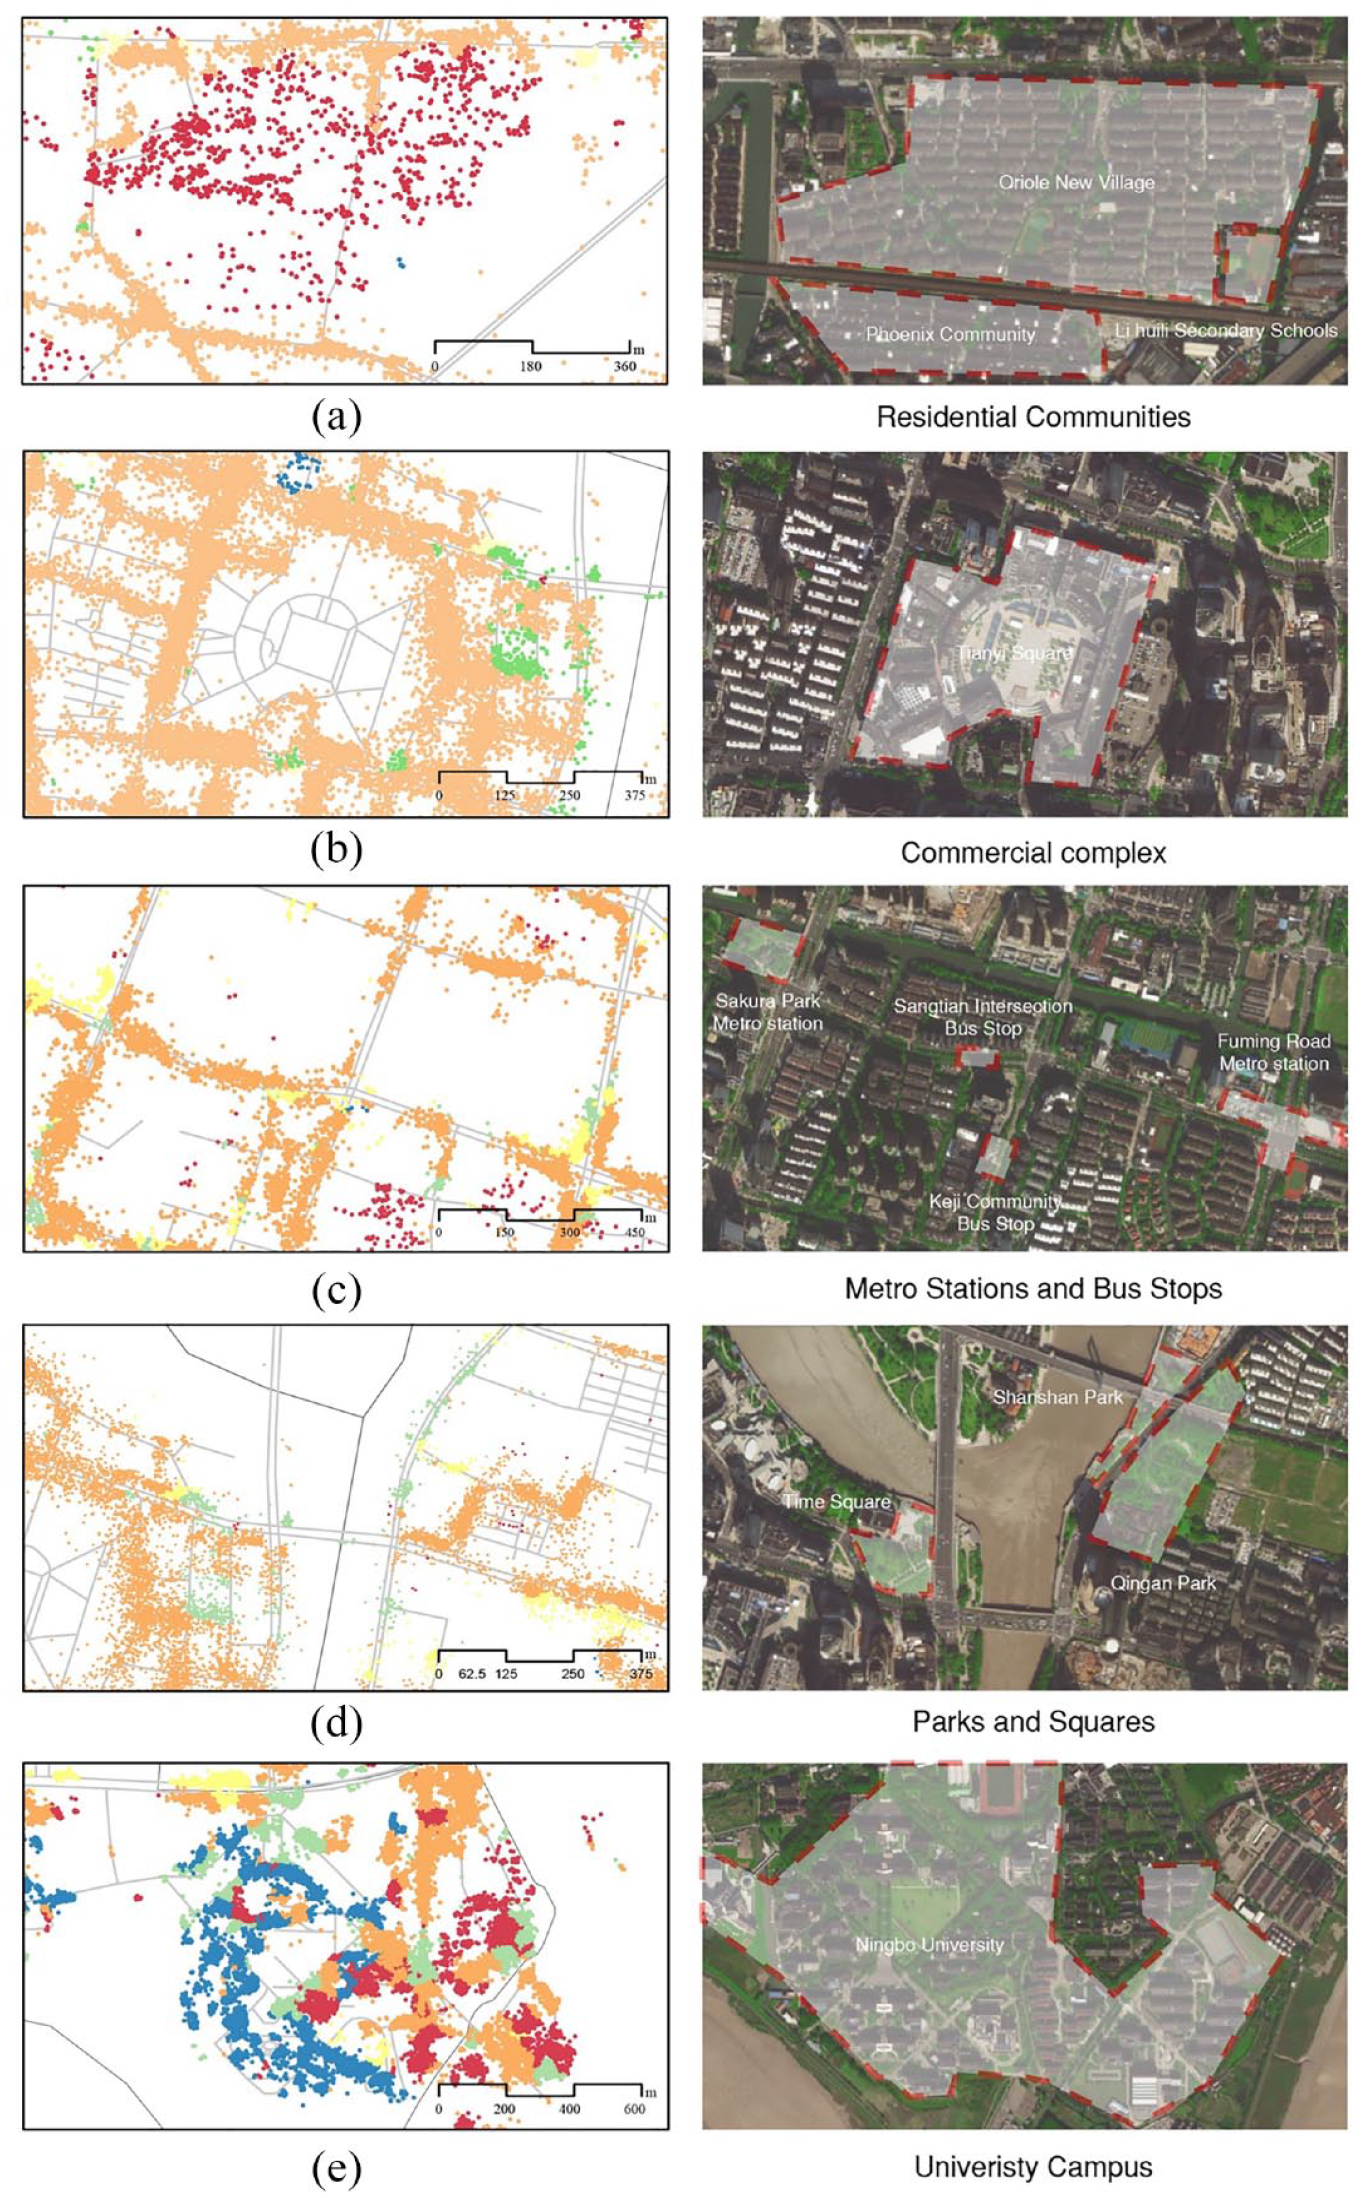
Compare trip clustering results with Gaode satellite map. (a) Type A. (b) Type B. (c) Type C. (d) Type D. (e) Type E.
Travel patterns and corresponding trip purposes
We split the corpus of trip labels into four sub-datasets: (a) bike trips on weekdays, (b) bike trips on weekends, (c) e-bike trips on weekdays and (d) e-bike trips on weekends. We began by calculating the perplexity score for each sub-dataset (see Figure 8). Generally, a lower perplexity score indicates a better fit LDA model that can effectively identify and extract the underlying structure of the corpus. However, an excessively low perplexity score can result from overfitting the model when the value of K is higher than a threshold. The appropriate value of K commonly occurs at the turning point of the topic-perplexity chart. Based on the chart, we selected the optimum values of K for each sub-dataset, being 6, 8, 9, and 5. Since the LDA model relies on word-frequency statistics, a higher K value may result in duplications between travel patterns, while a lower K value may cause ignorance of relatively low-frequency travel patterns. By adopting distinct K value for each dataset, we can observe how people present different travel patterns in different micromobility scenarios.
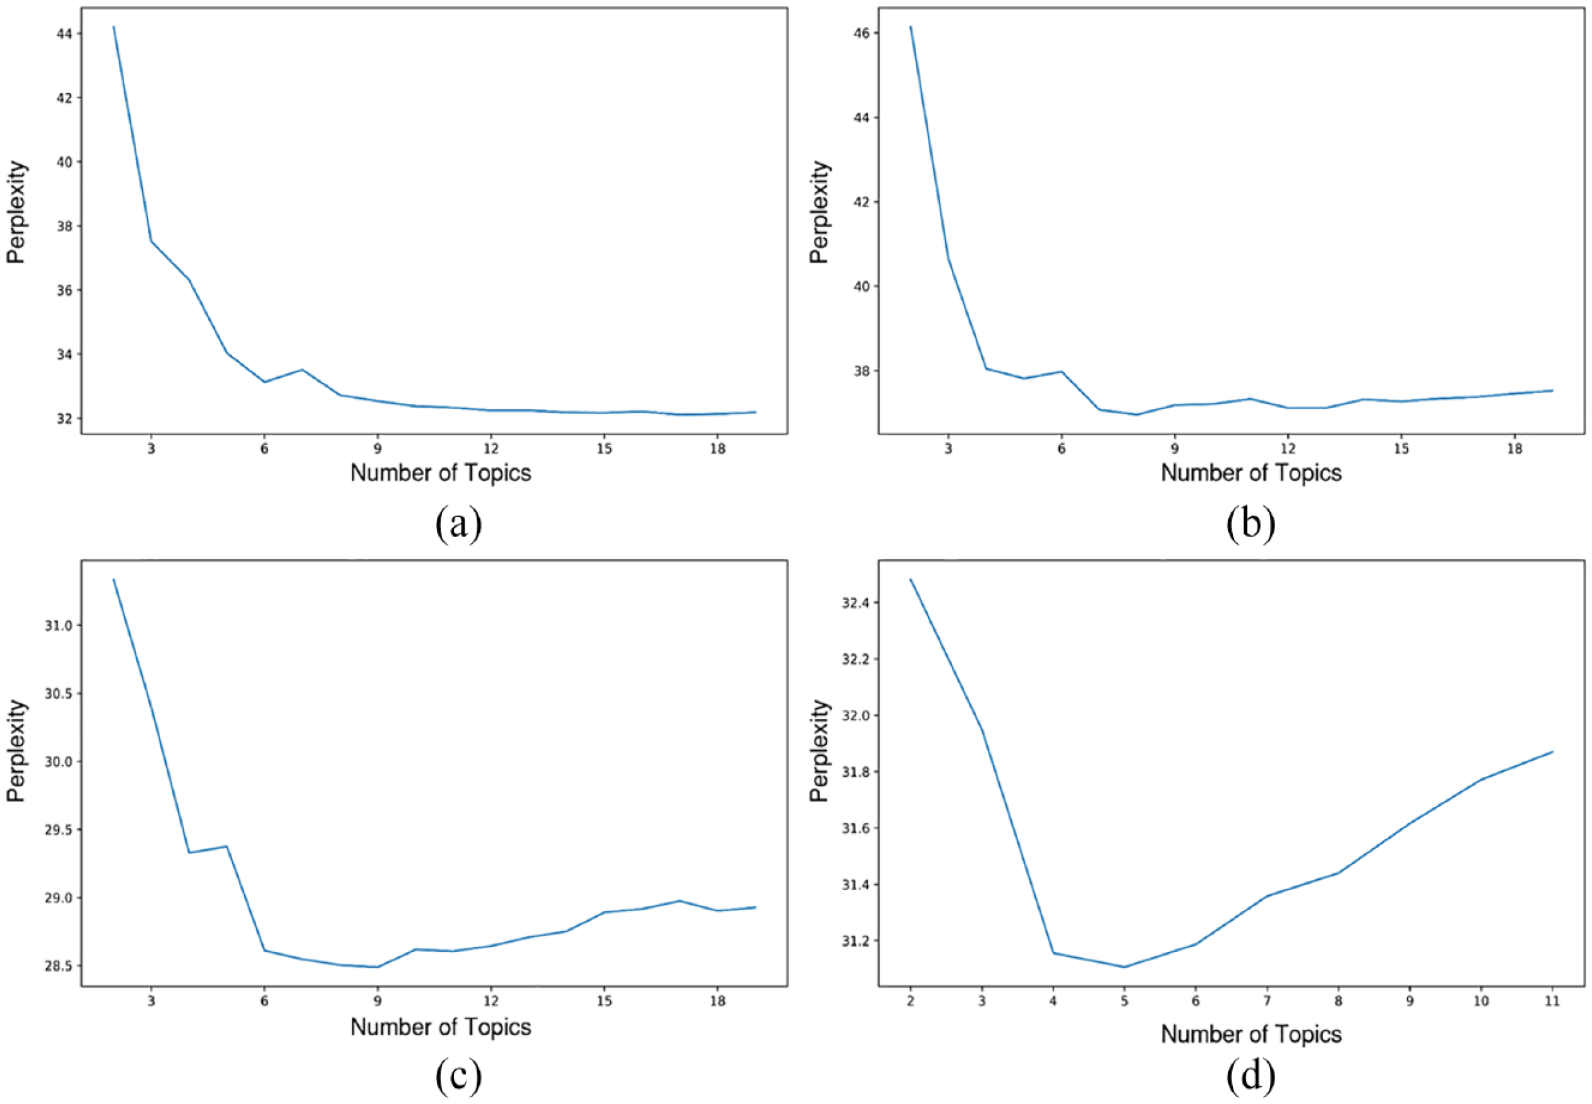
Perplexities for the four sub-datasets. (a) Bike trips on weekdays. (b) Bike trips on weekends. (c) E-bikes trips on weekdays. (d) E-bikes trips on weekends.
Bike travel patterns
Fourteen structured travel patterns were extracted from regular bike trips, with travel patterns 1–6 being weekdays, and patterns 7–14 being weekends, as shown in Figure 9. Here, some representative patterns will be discussed.
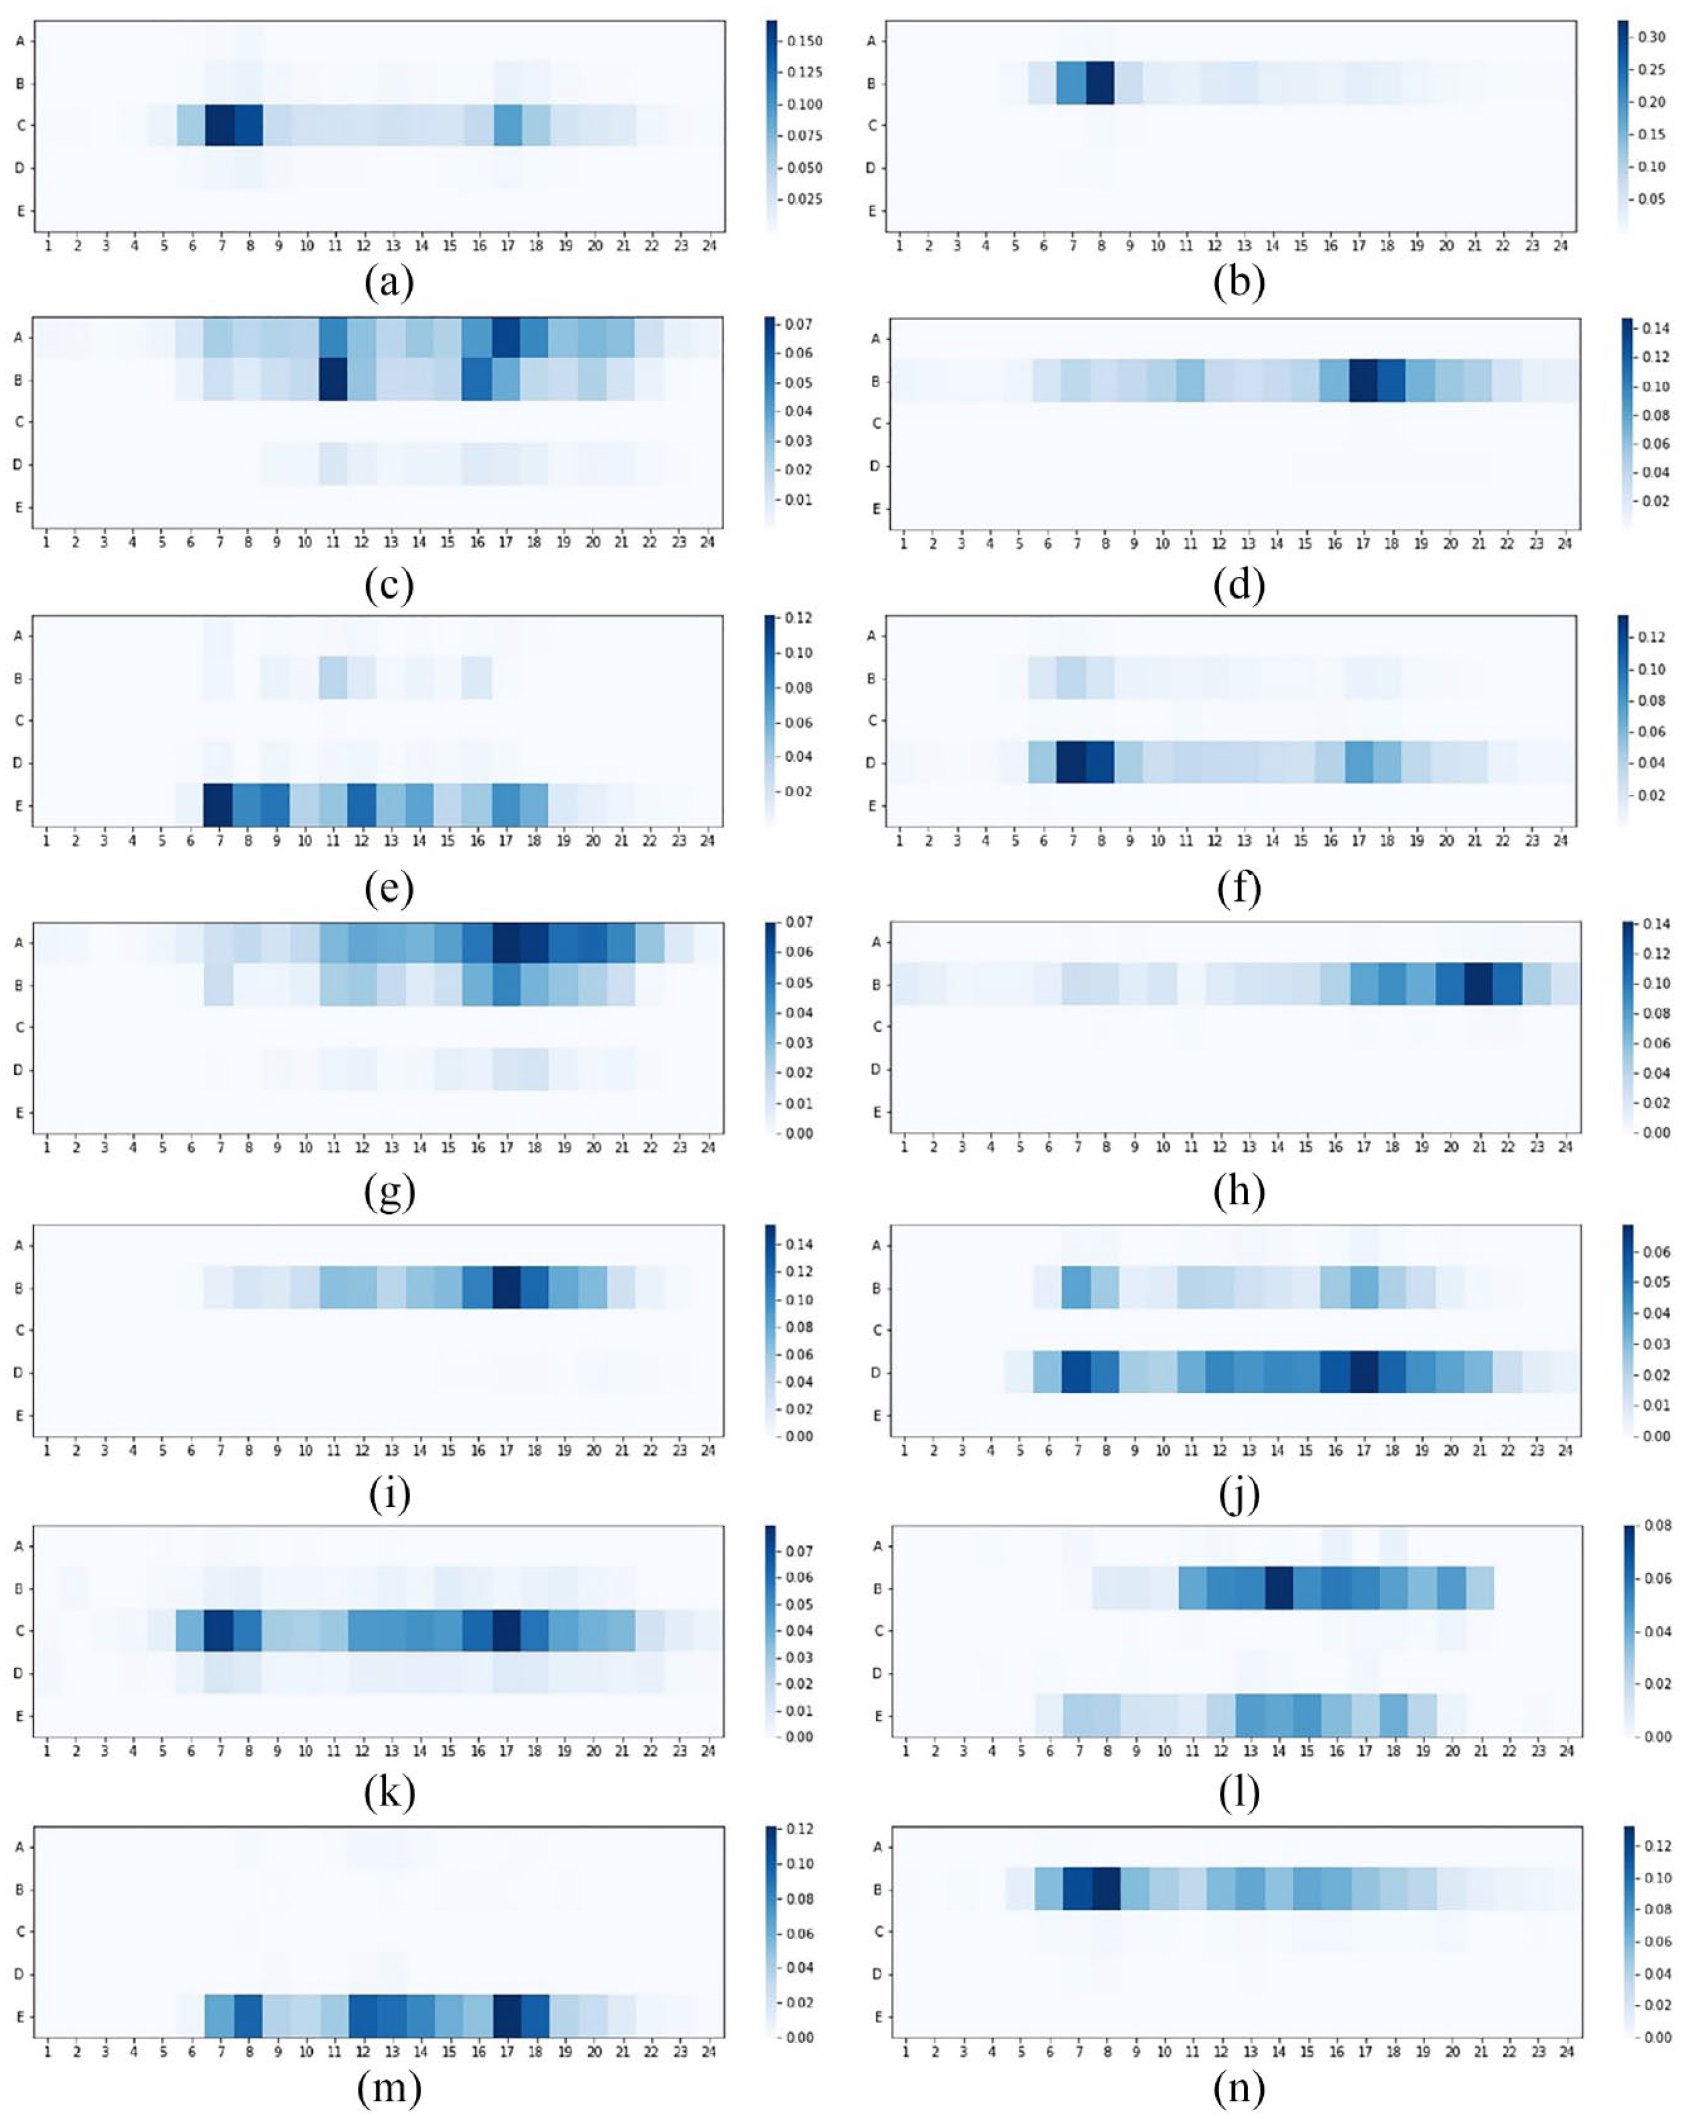
Travel patterns of shared bike trips. (a) Pattern 1. (b) Pattern 2. (c) Pattern 3. (d) Pattern 4. (e) Pattern 5. (f) Pattern 6. (g) Pattern 7. (h) Pattern 8. (i) Pattern 9. (j) Pattern 10. (k) Pattern 11. (l) Pattern 12. (m) Pattern 13. (n) Pattern 14.
Bike travel patterns on weekdays
Pattern 1 shows that residents tend to go to transport-related POIs at 7 and 8 am, and at 5 pm and 6 pm. Parking lots, metro stations, and bus stops are among the transport-related POIs with the highest visiting frequency, indicating that shared bikes are often necessary for users to access their desired transport modes for their commute. This accords with earlier observations, which showed that shared bikes can serve as a feeder mode for commuting by public transport and solve the last-mile problem (Yang et al., 2018). However, parking lots also positively impact the usage of shared bikes, which is a feature often ignored by previous studies. Another result is that more transport-related bike trips were made in the morning peak than the evening peak, supported by Ma et al. (2020), who claimed that travellers tend to choose shared bikes to avoid traffic jams and save time during the morning rush hours.
Patterns 2 and 4 show plenty of bike trips to services, eating, and shopping POIs are made around 8 am and 5 pm. According to
Pattern 3 reflects the fact that cyclists usually head to residential POIs at 11 am and between 4 pm and 6 pm. This finding corroborates the research of Xing et al. (2020), who suggested that bike-sharing trips to residential areas have two rush hours: the midday mini-peak and the evening peak.
Pattern 5 always occurs in areas with educational POIs, like Ningbo University, and the University of Nottingham Ningbo. The hourly distribution of trips is relatively even during the day, reaching three peaks at the breakfast and morning classes (7 am–9 am), lunch (12 pm), and dinner (6 pm). This is in line with Chicco and Diana’s (2022) study that found the temporal usage peak of bike-sharing trips occurring by the university most likely corresponds to the students’ schedule on campus.
Pattern 6 frequently happens on main roads with huge traffic volumes. Its temporal distribution coincides with the commuting routine, having conventional morning and evening peaks. Specific purposes are hard to ascertain as (1) the destination POIs of these trips like parks are insignificant in numbers, therefore, being hard to identify by the K-means clustering algorithm or (2) the 50 m destination buffer is relatively small for these trips to deduce the real trip purposes. Finally, the purpose of this type of pattern is classified as “other”.
Bike travel patterns on weekends
Travel patterns of bikes on weekends are somewhat similar to those on weekdays, however, several discrepancies are worth exploring. Pattern 7 conforms to pattern 3, which can be deduced as the purpose of lodging. But there are two differences. First, the midday peak existing on weekdays disappears on weekends. Second, the evening arrival peak on weekends is longer and later than that on weekdays. Such a change in temporal distribution captures reality, indicating that people do not have to ride bikes home for lunch or a noon break which could have helped them refresh on working days, and they are inclined to hang out later on weekends.
Pattern 11 is similar to pattern 1, both related to the transport purpose. The single observation to emerge is that the evening peak is higher than the morning peak on weekends, while the reverse is true on weekdays. This is because, on weekends, the majority of people do not commute in the morning and they tend to go out for dinner and leisure in the evening.
Pattern 12 is a fresh pattern that takes place in areas with education POIs, surrounded by shopping, eating, and services POIs. This pattern shows bike users prefer to go to the shops and obtain services around 2 pm on weekends, which might involve the students’ recreational activities on weekend afternoons.
E-bike travel patterns
A total of 14 travel patterns for dockless e-bikes were recognized, as shown in Figure 10. Nine of these are for weekdays and five for weekends.
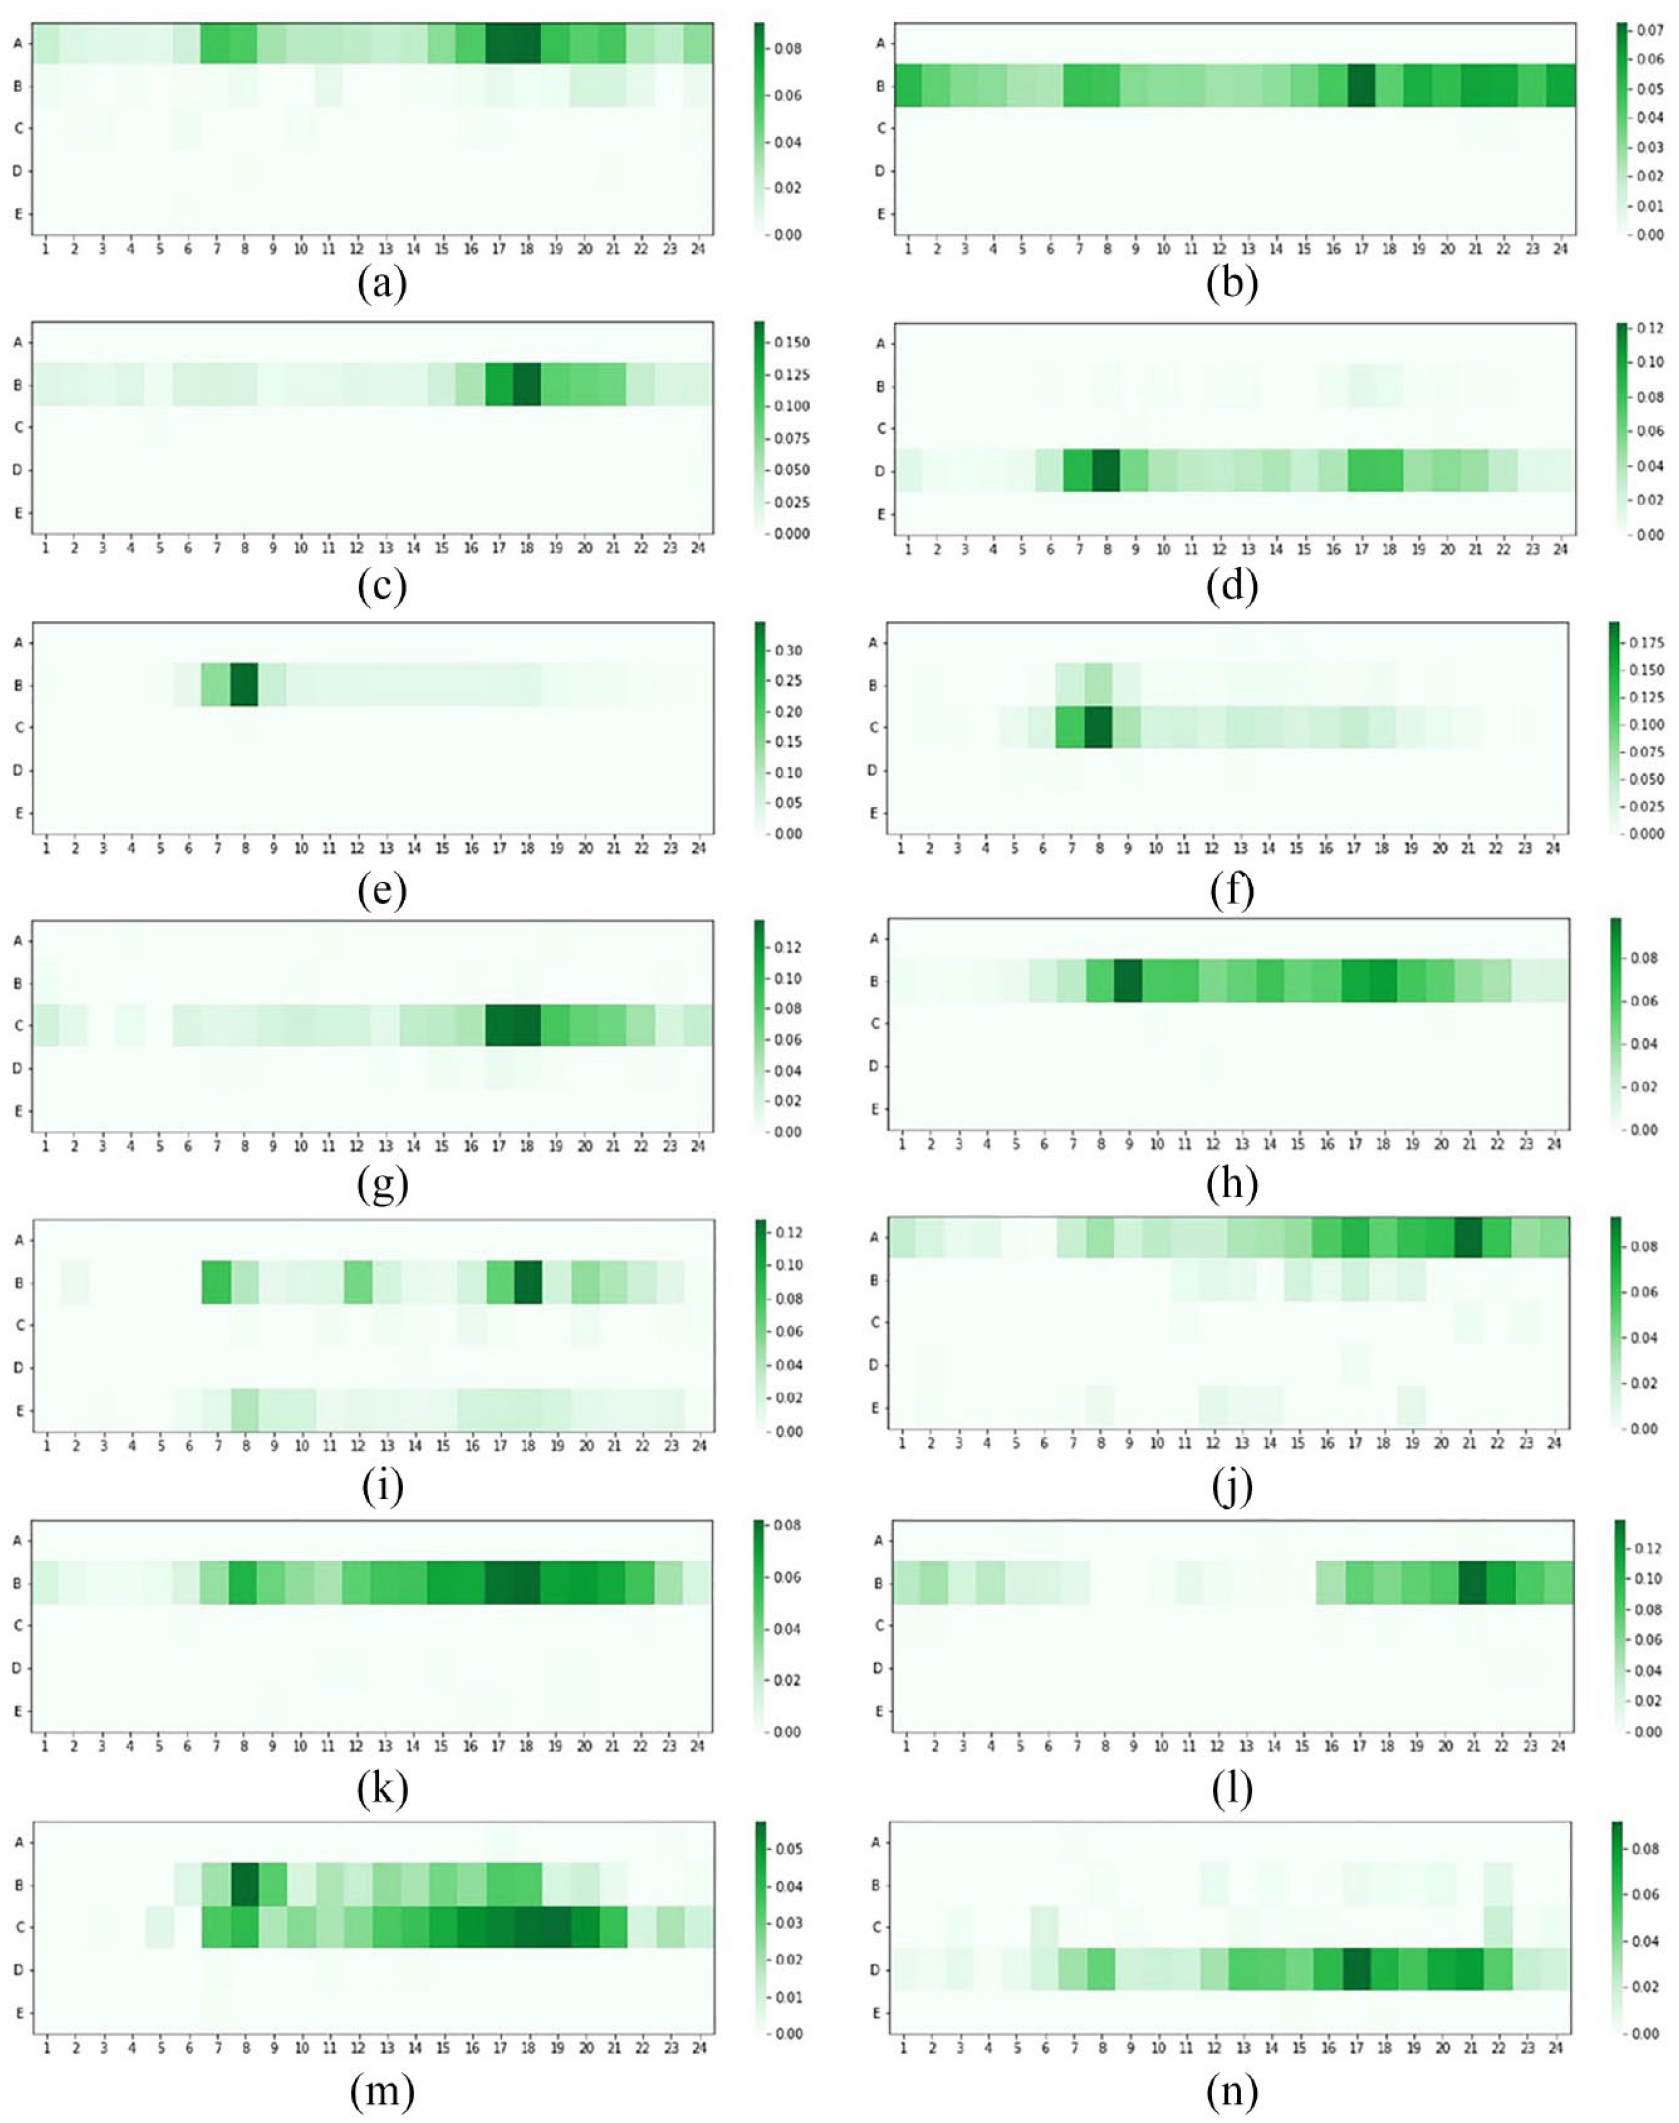
Travel patterns of shared e-bike trips. (a) Pattern 1. (b) Pattern 2. (c) Pattern 3. (d) Pattern 4. (e) Pattern 5. (f) Pattern 6. (g) Pattern 7. (h) Pattern 8. (i) Pattern 9. (j) Pattern 10. (k) Pattern 11. (l) Pattern 12. (m) Pattern 13. (n) Pattern 14.
E-bike travel patterns on weekdays
Pattern 2 displays that the peak arrival of e-bikes at POIs of type B is around 5 pm, which is strongly related to the purpose of dining and shopping. A number of e-bike users make trips from 7 pm to 12 pm, indicating e-bikes are a popular form of transport during the night. This correspondent with the study conducted by Almannaa et al. (2021). They found that there exists consistent, low-speed e-bike usage between 12 midnight to 11 am in the City of Austin. This also confirms the aforementioned findings from the 2020 Travel Watch Report on Shared E-bikes (Meng et al., 2020), which has shown that the role of e-bikes is more dominant than bikes in night-time travel. A possible explanation is that compared to bikes, e-bikes have a relatively higher speed that enables users to get to destinations quickly and alleviates users’ concerns about the travel safety issue at night.
Patterns 6 and 7 show that people ride e-bikes to transport facilities like public transport nodes during the morning rush hour and the evening peak. There are consistent e-bike trips occurring at midnight, in contrast to a few bike trips made then. This temporal pattern justifies the significance of e-bikes to night travel again.
Pattern 9 is comparably faint compared to other patterns. This pattern appears in areas with POIs related to education, shopping, eating, and services. Although individuals ride e-bikes to catering places like dining halls near educational institutions at around 6 pm, the number of trips falling into this pattern is low compared to that of shared bike trips. One of the possible reasons is that the operation of e-bikes is not encouraged on campus due to students’ safety concerns, while shared bikes are predominant in student life. Recently, Jiageng et al. (2022) pointed out that the prevalence of e-bikes on campus requires coordination among diverse stakeholders including students, school officials, and micromobility operators.
E-Bike travel patterns on weekends
The e-bike travel pattern of weekends is similar to that of weekdays except for some small nuances. Pattern 10 is likely to be observed in residential areas. However, its evening peak (9 pm) is later than the general evening peak of weekdays as people tend to hang out and go home later on weekends. When compared to bike trips on weekends, it can be found that bike trips with the purpose of lodging are concentrated between 4 pm and 7 pm, while e-bike trips reach a volume peak at 9 pm, demonstrating the importance of e-bikes for night-time travel again.
Patterns 11 and 12 illustrate that residents routinely travel to places for eating and shopping in the evening, with two peaks at dinner time (5 pm to 6 pm) and 9 pm, suggesting a prosperous night-time economy in Ningbo.
Patterns 13 and 14 are inferred to have purposes of transport and others, respectively. Compared to the patterns with the same purpose on weekdays, e-bike trips on weekends are concentrated in later hours. This is in line with the weekend routine of dwellers, who prefer to go out in the afternoon and evening.
Aggregated comparison of the trip purposes
Trip purposes can be inferred from the structured travel patterns. Finally, seven typical trip purposes of SMSs were inferred: transport, work, lodging, eating, shopping, education, and others, which were summarized in Table 3. It can be concluded from the table that eating is the most prevalent trip purpose for dockless bikes and e-bikes, accounting for 26.9% and 35.0% of all trips, respectively. This finding matches that observed in earlier studies (Bao et al., 2017; Li et al., 2020a; Xing et al., 2020). Working is the second most popular purpose for shared bikes, accounting for 17.5% of all trips, which is closely followed by shopping, taking up nearly 16.7% of trips. However, for e-bike trips, shopping makes up 35.0% of all e-bike trips, and work makes up 17.3%. This shows that a large number of people ride e-bikes for shopping, while this purpose is relatively subordinate to regular bike users. This may be because of the differences in the construction of shared micromobility infrastructure, specifically, the operation boundary of e-bikes may be more closed to commercial areas involving catering, and shopping POIs in contrast to that of bikes.
Percentage of different trip purposes for shared bikes and e-bikes.
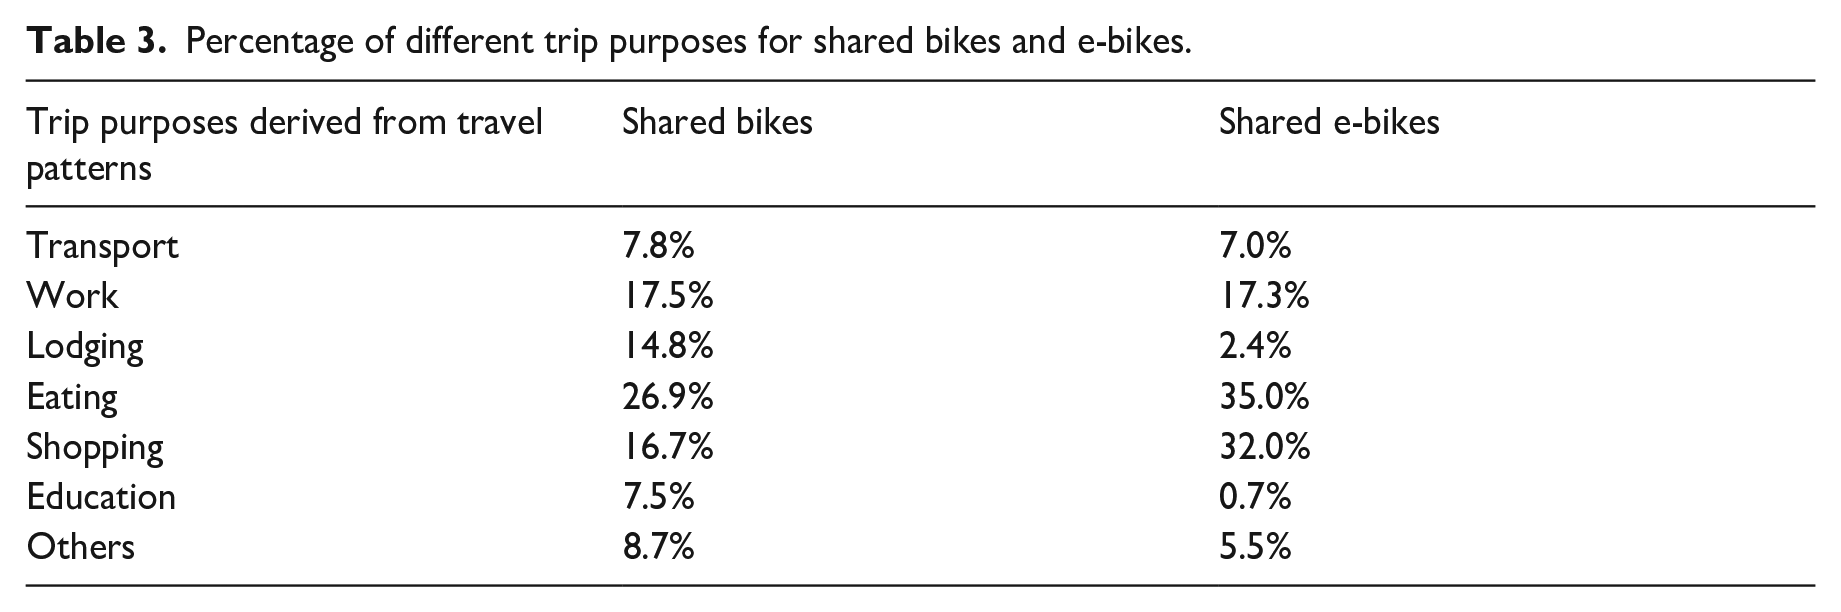
Lodging is a significant purpose of bike trips, accounting for approximately 14.8% of trips, however, only 2.4% of trips on e-bikes are associated with accommodation. This striking finding means the role of shared e-bikes in travelling to and from home may be overstated in the previous research. A possible explanation might be that e-bikes are not as convenient as shared bikes for getting home as they need to be parked within an area limited by an electronic geofence. This is because the regulations for e-bike parking are stricter than for regular bikes due to power management problems. A relatively small number of electronic fences leads to the fact that shared e-bikes are not widely used around residential communities.
Bike and e-bike trips with the purpose of transport account for 7.8% and 7.0% of all trips respectively, suggesting a number of residents rely on the bike-sharing system as a feeder mode to transfer to the public transit system or access parking lots to get their private cars (Chicco and Diana, 2022; Zhou et al., 2022). The proportion of transport-related trips is lower than the figure estimated by Xing et al. (2020), who conjectured that nearly 19.58% of dockless bike trips are related to transport in Shanghai, China. This discrepancy could be attributed to differences in the city scale of the two cities. Shanghai is a world-class megalopolis where people more rely on the metro for long-distance commuting, as opposed to Ningbo, where commuters have more diverse commuting options due to its relatively small city scale, resulting in relatively few transport-related trips made by bike-sharing.
Bike-sharing trips relating to educational facilities have been verified in previous studies (Aliari et al., 2020; Jiageng et al., 2022). Trips with the purpose of education account for 7.5% of all bike trips, while only accounting for 0.7% of all e-bike trips. This may be because the operation of e-bikes is strongly restricted on campus considering the traffic safety of students. In contrast, other countries like America, Singapore, and Italy appear to have fewer restrictions on electric SMSs on university campuses. Since studies show that there is heavy e-scooter traffic happening in/around university campus areas in these countries (Bai and Jiao, 2020; Chicco and Diana, 2022; Zhu et al., 2020).
Spatial distribution of trip purposes
Figure 11 demonstrates the spatial distribution of different travel purposes. In terms of shared bike trips, the purpose of lodging is aggregating in some grids. Combined with the POIs dataset it can be found there are large residential communities in these grids, such as “Green Lotus Court” and “Oriole New Village”, indicating the shared bike infrastructure is relatively complete around these communities and residents rely on the bike-sharing system to commute. Concerning e-bike trips, the number of lodging-related trips is limited. Only several residential areas like “Ningdong Home” and “Ruyi Water Bay” witness e-bike trips relating to lodging purposes, suggesting the infrastructure of e-bikes are accessible to residents in these residential areas. Other residential communities without coverage of shared e-bike services should be focused on in future e-bike planning for its expansion.
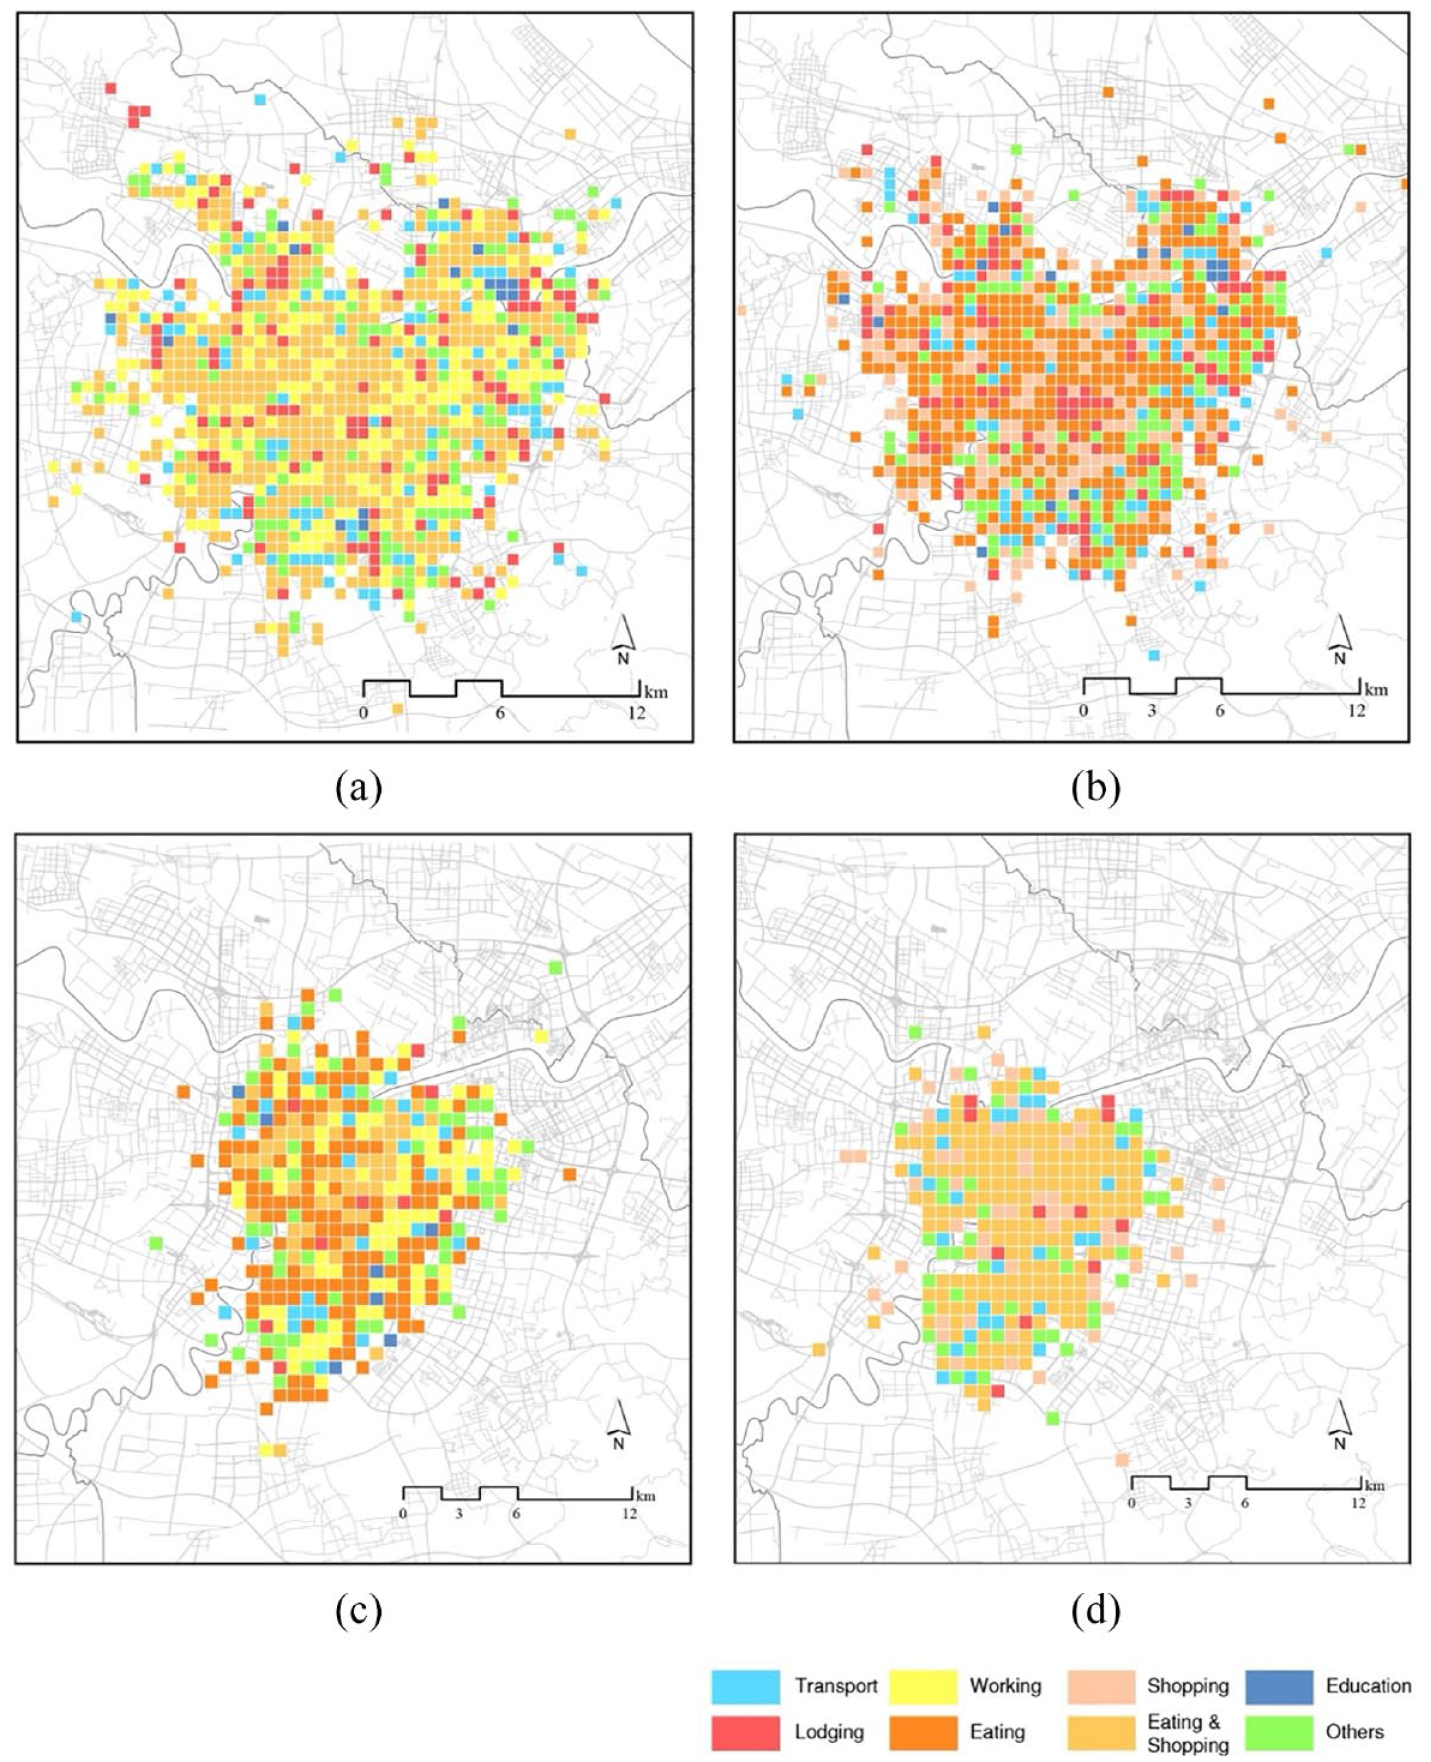
Spatial visualization of trip purposes. (a) Bike trips on weekdays. (b) Bike trips on weekends. (c) E-bikes trips on weekdays. (d) E-bike trips on weekends.
Bike trips with the purpose of education can be seen on some university campuses including Ningbo University and The University of Nottingham Ningbo. While e-bike trips with educational purposes often occur around primary and secondary schools like Depei Primary school, this may be because parents usually use e-bikes to save time and drop off their children at school (Zhou et al., 2022).
The hotspots of work-related bike and e-bike trips are largely consistent. These hotspots often attract enterprises, industrial parks, and commercial complexes to agglomerate, which are potential workplaces for residents. Work-related trips are not identified on weekends as we follow an assumption that people do not work on weekends. This could be a potential future direction since there are a number of people who may keep working on weekends.
The distribution of trips relevant to transport is in line with the distribution of public transport hubs – such as metro stations, bus stops, as well as parking lots, both for shared bikes and e-bikes. In addition, trips with the purpose of eating and shopping are scattered around Ningbo, while trips with other purposes can be found on roads with huge traffic volumes, parks, as well as open spaces.
Conclusion and discussion
Main conclusions
This paper extracts structured travel patterns of two types of dockless bike-sharing systems (i.e., shared bikes and e-bikes) using an LDA-based framework, to infer and compare the trip purposes between them. Several conclusions can be drawn from our analysis. First, the significance of shared bikes and e-bikes to short-distance travel, as well as their respective traits, were confirmed by exploring their trip characteristics. The average trip duration and distance of e-bike trips are longer than those of bikes. Although the average speed difference between these two types is not significant, interestingly, the speed distribution of bikes is more concentrated, with a slightly left-skewed trend, while that of e-bikes shows abundant variation, indicating the e-bike users receive more support for physical energy-saving from the electric power system. Second, the extracted travel patterns were similar to the findings of the existing studies. We observed conventional morning and evening rush hours on weekdays, and travel volume peaks in the afternoon and evening on weekends. However, the patterns also showed that shared e-bikes take a dominant role in night-time travel compared to pedal-powered bikes. Third, based on the extracted travel patterns, seven typical trip purposes were inferred, i.e., transport, work, lodging, eating, shopping, education, and others. And finally, some similarities and differences were observed in the trip purposes of two types of micromobility. For instance, eating is the most prevalent trip purpose for both shared bikes and e-bikes. However, the proportion of transport-related trips was not significant as expected for either type. Notably, the trips with lodging and educational purposes account for a relatively small number of e-bike trips, while these purposes are more common in pedal-powered bike trips.
Implications for urban and transport planning practices
Based on the findings, some targeted planning and regulation suggestions can be given.
For the SMSs’ operators, they can adopt appropriate SMSs operation strategies:
(1) Surplus bikes and e-bikes should be retrieved in commercial areas in the evening. In light of the fact that eating and shopping are relatively popular trip purposes for SMSs, a large number of fleets are left in commercial areas after recreation in the evening, especially on weekends. Therefore, some commercial areas like Tianyi Square are ideal places for operators to retrieve the fleets. These surplus fleets can be reallocated to nearby residential areas, which are the origins of most daily trip chains.
(2) The supply of shared bikes and e-bikes should be increased, and more parking areas for e-bikes should be provided around residential areas. Bike-sharing companies may consider allocating more shared bikes around such residential communities before the morning peak. As for shared e-bikes, the proportion of home-related e-bike trip is insignificant, perhaps due to insufficient delimitated geofencing areas that allow e-bikes to be parked. Therefore, more parking areas for e-bikes should be planned around residential communities.
(3) Dynamic rebalancing strategies should be applied to reposit bikes and e-bikes around transport-related POIs. SMSs are frequently used as commuter feeder modes to access public transport to address the first and last-mile problem. In the morning, commuters tend to ride them from home to public transport stations or from public transport stations to workplaces, leading to surplus bike fleets in stations around residential communities while insufficient bike fleets are found in stations around workplaces. In the evening peak hour, the same problem also exists, except that the direction of commuting flows has changed. Operators should achieve a demand-supply balance of bike fleets near metro and bus stations by transferring fleets during peak hours. In addition, parking lots are easily overlooked during the process of fleets rescheduling. The same rebalancing strategies could be also used for parking lots.
(4) Supporting facilities and equipment should be provided to promote the use of shared e-bikes on campus. While college students are among the main users of SMSs, the number of shared e-bike trips related to educational institutions is limited compared to shared bike trips. However, numerous universities in the countries like Netherlands (Plazier et al., 2017) and China (Jiageng et al., 2022) witness the growth of usage of private electric e-bikes, as e-bikes have become a preferred mode of transport due to the relatively long-distance travel on large university campuses. The lagging development of shared e-bike infrastructure and safety concerns about e-bike usage have hindered the prevalence of shared e-bikes on university campuses. Recently, an investigation conducted in Queensland, Australia, shows that students who have more shared mobility experience are more positive about using e-bike sharing (Eccarius et al., 2021). Therefore, campuses with developed bike-sharing infrastructure have huge potential for the growth of shared e-bikes usages. Operators could deploy more shared e-bikes on campuses to cater to students’ transport needs. Also, operators could provide cycling helmets, install speed limiters on e-bikes to ease safety concerns, and promote the use of shared e-bikes on university campuses.
For the government, it can implement appropriate urban and transport planning strategies to efficiently utilize the SMSs in Ningbo:
(1) Develop rational land use planning based on extracted SMSs travel patterns to achieve effective integration and utilization of SMSs infrastructure. For example, commercial areas have a high concentration of idle SMSs fleets at night, and these surplus fleets need to be reallocated to nearby residential areas. Against this background, planning high-density mixed commercial and residential land use in new construction areas of Ningbo can reduce the cost of rescheduling shared micromobility fleets that would otherwise have to be rescheduled between different urban functional zones. This can lead to an internal cycle of supply and demand for SMSs infrastructure within a certain area.
(2) Encourage multimodal transport by integrating SMSs into the current public transport landscape. Although studies have shown that SMSs, especially shared e-bikes, may compete with and substitute public transport, the government can encourage the deployment and operation of SMSs to complement transport services in areas not covered by buses or metros, thereby meeting the transport needs of residents in the whole region. Additionally, SMSs can serve as feeder modes of public transport to solve the first/last-mile problem. Therefore, the government can promote the integration of SMSs and public transport by planning more cycling road networks and SMSs parking areas next to bus or metro stations to spur the prosperity of multimodal transport in the city.
Limitations and future directions
There are still some limitations in this paper which should be tackled in future works. First, the methodology of trip annotation could be further optimized. In this study, trips were attached with labels derived from the K-means clustering algorithm based on the POI feature vectors. In this case, the number of POIs might have affected the final imputation of trip purposes. The inferred purposes were often related to those functions associated with a larger number of POIs, while some niche travel reasons like medical purposes were difficult to identify. Therefore, future work could improve the trip annotation method to consider those functions only represented by a small number of POIs. Second, limitations may also exist in used datasets. The limited time span of the travel dataset (only one week) may lead to a conclusion that is not universal and robust enough. Further, the trip dataset was only derived from the operator Hellobike, and there are some other small micromobility operators in Ningbo. The used operational data derived only from the leading operator may be incomplete. Future works, therefore, are encouraged to extend the dataset by including a longer temporal period and more micromobility operators.
This work also can provide several directional implications for future studies. The first direction is to extend the research objects. Specifically, we only investigated trip purposes of shared bikes and e-bikes due to the limitations of the dataset. Future work could select a city with various SMSs like New York to incorporate other SMSs like shared e-scooters and skateboards and produce a more holistic picture of the use of SMSs. In a different direction, the pick-up point of every trip could be considered in the trip annotation. By incorporating information on pick-up and drop-off points into trip labels, the LDA model could extract structural travel patterns between different origin-destination pairs. These trip chains would be helpful to better understand the travel demand between specific origin-destination pairs. New research can also be done on the deep logic of trip purpose differences between different SMSs. Factors impacting the use of SMSs like built environment can also be tested in research. For example, by investigating the characteristics of hotspots of lodging-related trips, it may be found that the lack of bike lanes or insufficient parking areas results in a low number of lodging-related trips, consequently, urban planners and operators could make corresponding enhancements to the urban environment and shared infrastructure planning around residential communities.
Footnotes
Acknowledgements
The authors would like to thank the data support from the company Hello Inc. We also thank the reviewers for their constructive remarks, which greatly help us improve the manuscript.
Declaration of conflicting interests
The author(s) declared no potential conflicts of interest with respect to the research, authorship, and/or publication of this article.
Funding
The author(s) disclosed receipt of the following financial support for the research, authorship, and/or publication of this article: This research is supported by the Fundamental Research Funds for the Central Universities (S20230013), Zhejiang University and Artificial Intelligence Key Technologies R & D Program of Hangzhou (2022AIZD0057) (Future City Being Construction and AI SuperBrain Key Technology Research for City Governance).