
Abstract
Densification is a key measure to improve public health in many low-density countries. However, empirical studies show that population density has mixed results on health in different contexts. A possible hypothesis is that the relationship between population density and unhealthiness is a U-shaped curve. This study tested the U-shaped relationship between population density and body mass index (BMI). It employed fixed effects models with longitudinal and nationwide data in China collected between 2012 and 2014, comprising 3,423 observations from 1,984 respondents. After controlling for individuals’ socioeconomic characteristics and other built environmental elements, the results support the hypothesis of the U-shaped association between population density and BMI. Specifically, when population density is low, it is negatively related to BMI. However, when population density is high, it has positive effects on BMI. We further discuss the possible mechanisms and thresholds of the U-shaped effects of population density. The U-shaped relationship between densification and obesity encourages planners to consider local contexts and adopt a moderate population density when planning healthy cities.
Introduction
Improving people’s health status is a key goal of the 2030 Agenda for Sustainable Development (Dietler et al., 2019). However, an increasing number of people are facing growing health risks from both a pandemic and noncommunicable chronic diseases (NCDs). One NCD, obesity, is a major risk factor for many other NCDs and for infection with Covid-19 (Cai et al., 2020; Yang et al., 2018). Compared to other countries worldwide, China has the second-largest population of obese adults, which is only smaller than that of the United States (Pan et al., 2021). Considering the severe burden of obesity and its health consequences, preventing and controlling the obesity epidemic has become one of the most important goals of the Healthy China 2030 Plan. Hence, we use obesity as an example of health outcomes in the empirical analysis.
Improving individuals’ body function through medical care is not enough to ensure health status, and hence, it is necessary to create a health-promoting environment (Buck, 1986). The environment is an upstream determinant of health. It not only directly influences health outcomes (e.g., obesity and depression) but also has indirect effects on health by shaping health-related behaviors (e.g., active travel and food intake) and pollution (e.g., air and noise pollution) (Lakerveld and Mackenbach, 2017).
Planners usually pay attention to the built environment, which refers to the human-made environment, including population density, land use, street design, and destination and transit accessibility (Ewing and Cervero, 2010; Yin et al., 2022a). Among these factors, population density plays an important role in shaping health. A high population density is synonymous with mixed land use, high street connectivity, and short distances to destinations and transit (Sarkar et al., 2017; Yin et al., 2020). People living in neighborhoods with higher population densities usually travel by active modes and have higher levels of physical activity, resulting in a lower likelihood of obesity and a higher level of health (Stevenson et al., 2016). This argument is supported by many studies conducted in developed countries (Lopez, 2007; Pouliou and Elliott, 2010). Therefore, policymakers and planners in developed countries recommend densification to shape healthy cities and improve people’s health (Stevenson et al., 2016). However, a high population density is also related to impoverished areas, congestion, and air pollution (Frank and Engelke, 2005), which are the main causes of obesity and other diseases. Therefore, Chinese planners have wondered whether densification, which is recommended by many developed countries to improve residents’ health, will be an effective intervention in China.
There are several gaps in the literature on the relationship between population density and health. First, major studies are based on low-density contexts (e.g., North America), lacking evidence from high-density contexts, particularly from China as a whole (Sun and Yin, 2018). Second, most studies assume that the association between population density and health is linearity instead of nonlinearity, which may not fit the real world situation (Galster, 2018). Third, many studies are cross-sectional and thus fail to identify causal relationships (Feng et al., 2010). To bridge these gaps, this study aims to explore how population density is associated with health by using obesity as an example. In particular, we apply fixed effects models to identify the U-shaped association between population density and obesity in China using nationwide longitudinal data between 2012 and 2014.
This study contributes to the literature in the following aspects. First, it constructs a new theoretic framework, arguing that the general law of the association between neighborhood population density and individuals’ unhealthiness is a U-shaped curve. Taking obesity as an example, the results show a U-shaped association between population density and weight status, in line with the theoretical framework. Second, this study provides empirical evidence from China, which is a high-density and developing country. The U-shaped association informs Chinese planners that although the densification strategy can improve residents’ health in low-density neighborhoods, it is not appropriate for high-density neighborhoods. Third, this study uses a longitudinal design and fixed effects models to examine the association between population density and obesity, providing more accurate estimations by eliminating the effects of time-invariant variables.
Literature review and conceptual framework
Literature review and research gaps
Population density refers to the population size within a certain area and is an important built environmental factor affecting health. Many studies conducted in low-density contexts (i.e., North America, Europe, and Australia) have found that a higher population density is positively associated with self-reported health (Lankila et al., 2012) and is negatively related to obesity (Rundle et al., 2007), other NCDs (Malambo et al., 2016), and coronavirus-related mortality rates (Hamidi et al., 2020). In the low-density context, on the one hand, a higher population density usually indicates higher accessibility to high-quality health care services, which plays an important role in improving people’s health (Hamidi et al., 2020). On the other hand, higher population density promotes health by facilitating health-related behaviors. First, it encourages active travel and curbs driving by shortening the distance to daily activity destinations (Ewing and Cervero, 2010), and active travel is a key contributor to health. Second, dense neighborhoods usually have more sports facilities and high-quality green spaces, which can encourage people to exercise and improve their health (Sallis et al., 2020). Third, a higher population density increases the availability of healthy and fresh food, resulting in lower risks of obesity and its related diseases (Lake and Townshend, 2006). Fourth, a higher population density facilitates social interactions and support because people may encounter their neighbors and have other types of informal contact (Leyden, 2003), which play an important role in promoting health.
However, a few studies have explored the association between population density and health in a high-density context (e.g., China and the Philippines) and have found results totally different from those obtained in a low-density context. In particular, a higher population density has positive relationships with obesity (Yin et al., 2022b) and stroke (Xie et al., 2019). Potential explanations for these relationships are as follows. First, in the high-density context, a higher population density corresponds to more severe air pollution (Han and Sun, 2019), which is a main cause of many diseases. Moreover, compared to people living in medium-density neighborhoods in Hong Kong, people living in high-density neighborhoods do not walk more and participate in less leisure walking (Lu et al., 2017). Studies have also found that a higher population density has a positive relationship with physical inactivity (Xu et al., 2010) due to a lack of open space and fewer sports facilities per capita (Yin and Sun, 2020). Additionally, during the pandemic period in Hong Kong, residents in high-density neighborhoods have been less likely to exercise to reduce exposure to crowds (Wang et al., 2021a). Therefore, a higher population density could increase obesity by reducing physical activity (Wang et al., 2019).
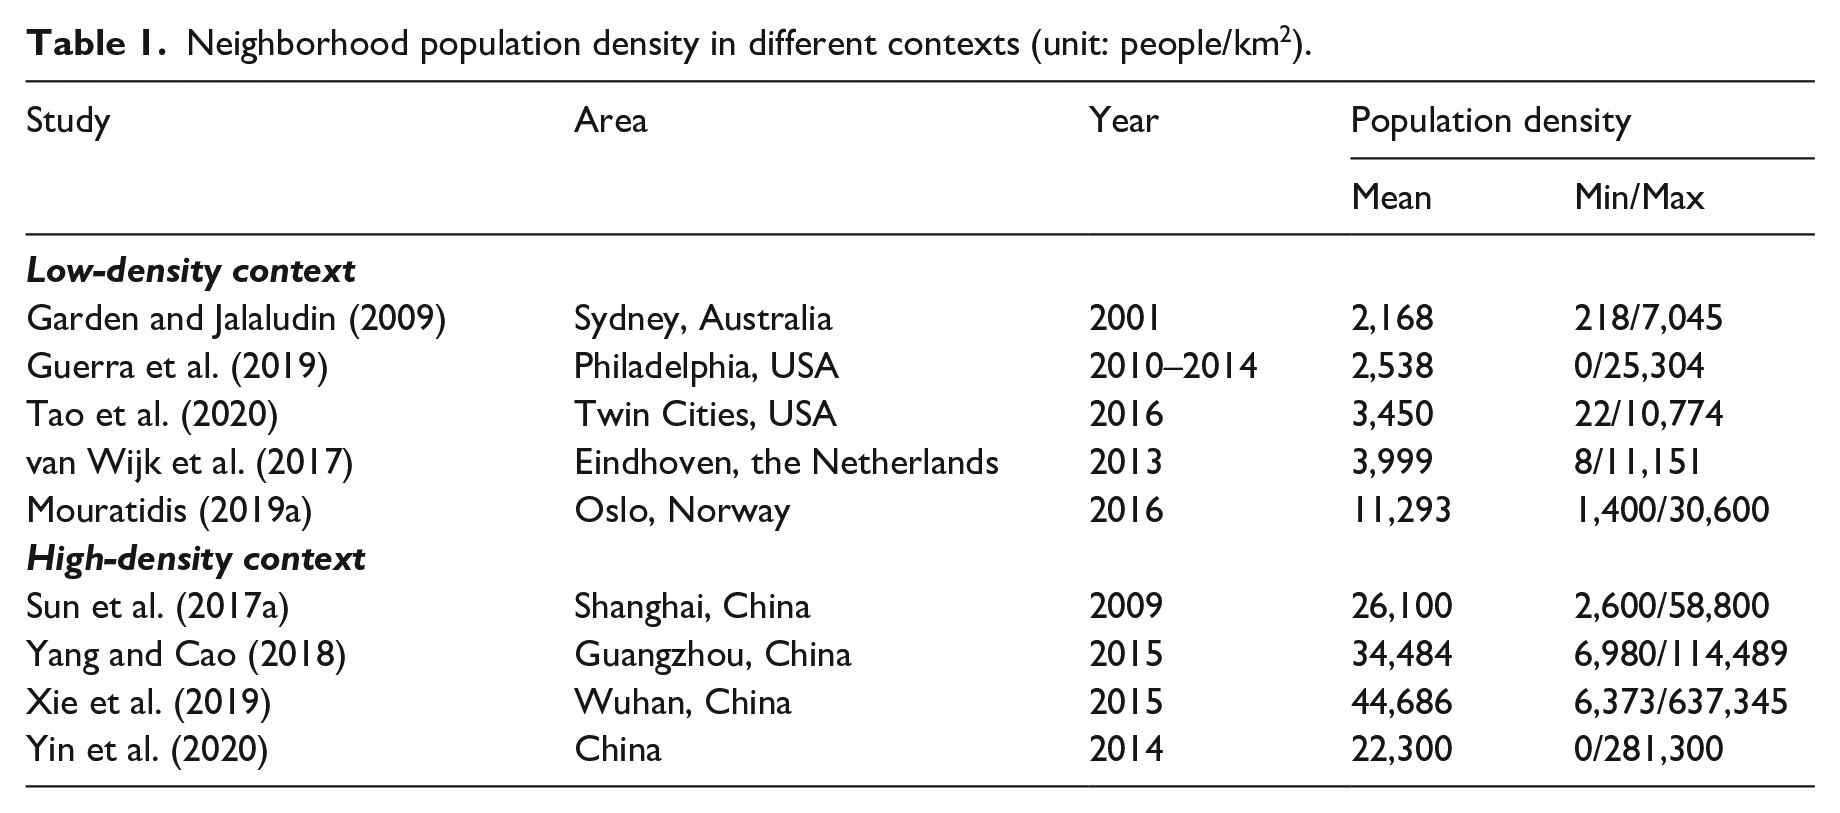
The mixed results regarding the association between population density and health can be attributed to the local context, the assumption of a linear relationship, or the use of a cross-sectional design. Table 1 summarizes neighborhood population density in different contexts. The mean population density is relatively low in North America, Europe, and Australia, and only a very small share of neighborhoods have high population densities. Hence, scholars may not observe the effect of high population density due to missing information. In contrast, most neighborhoods are high density in Chinese megacities, which may only show the effects of high population density. However, except for megacities, other Chinese cities have many low-density neighborhoods (Chen et al., 2008), which may be used to observe the effect of low population density. Therefore, a nationwide sample from China provides a good example to understand the relationship between population density and health, but the literature lacks related studies.
Neighborhood population density in different contexts (unit: people/km2).
Moreover, previous studies have usually assumed the existence of a linear association between population density and health, which is too ideal and questionable. This is because built environmental elements usually have nonlinear and threshold effects (Galster, 2018). Several recent empirical studies have relaxed the linearity assumption to examine the potential nonlinear associations of population density with health-related behaviors and health outcomes. For example, population density has an inverse U-shaped association with leisure walking (Lu et al., 2017) and transport-related walking (Christiansen et al., 2016). However, the nonlinear association between population density and obesity is still unclear. Sarkar et al. (2017) found that population density has an inverse U-shaped relationship with obesity in the UK, whereas Yin et al. (2020) found the association to be a U-shaped curve.
Furthermore, a number of studies have used cross-sectional designs to explore the relationship between population density and health, but the cross-sectional design may misestimate the association because of omitted variables and self-selection problems (i.e., people choose residences based on their preference for improving health). Therefore, to inform a causal relationship instead of a correlation, scholars recommend adopting a longitudinal design. On the one hand, a longitudinal design reduces the bias caused by omitted variables by controlling for the effects of time-invariant variables. On the other hand, this design relieves the self-selection problem by assuming that residential preferences are stable. Compared to studies using a specific sample (e.g., residents living in resettlement housing) to exclude self-selection effects (Li et al., 2018), a longitudinal design has better external validity. However, only a few studies have used longitudinal designs to explore the association between population density and health (Yin and Sun, 2020).
Conceptual framework
Arousal theory indicates that with increasing population density in the low-density context, people tend to have higher levels of arousal and tend to become more excited, improving mental health. However, when the population density is high, continuing to increase the population density will cause anxiety and nervousness (Berlyne, 1960). Moreover, the theory regarding the economies and diseconomies of agglomeration indicates that when the population density is low, increasing the population density can promote population health. A higher population density saves costs associated with constructing and maintaining infrastructure and health-related facilities, and hence, more people can obtain health care services. However, when the population density is high, increasing the population density may be harmful to population health. This is because its benefits tend to be marginal and are overwhelmed by its negative effects, such as traffic congestion and environmental pollution (Sarkar and Webster, 2017).
These theories guide us in building a conceptual framework to understand the association between population density and individual health, using obesity as an example (Figure 1). In particular, we hypothesize that both low and high population densities are harmful to health and curb health-related behaviors. When the population density is low, increasing the population density will reduce unhealthiness (i.e., obesity) because it can promote active travel and leisure physical activity, improve access to healthy food, and enhance social interactions. However, when the population density is high, increasing the population density tends to increase the likelihood of unhealthiness because it may reduce active travel and leisure physical activity, worsen the food environment (e.g., more fast food restaurants), cause air and noise pollution, and produce higher levels of stress. That is, population density has a U-shaped relationship with unhealthiness.
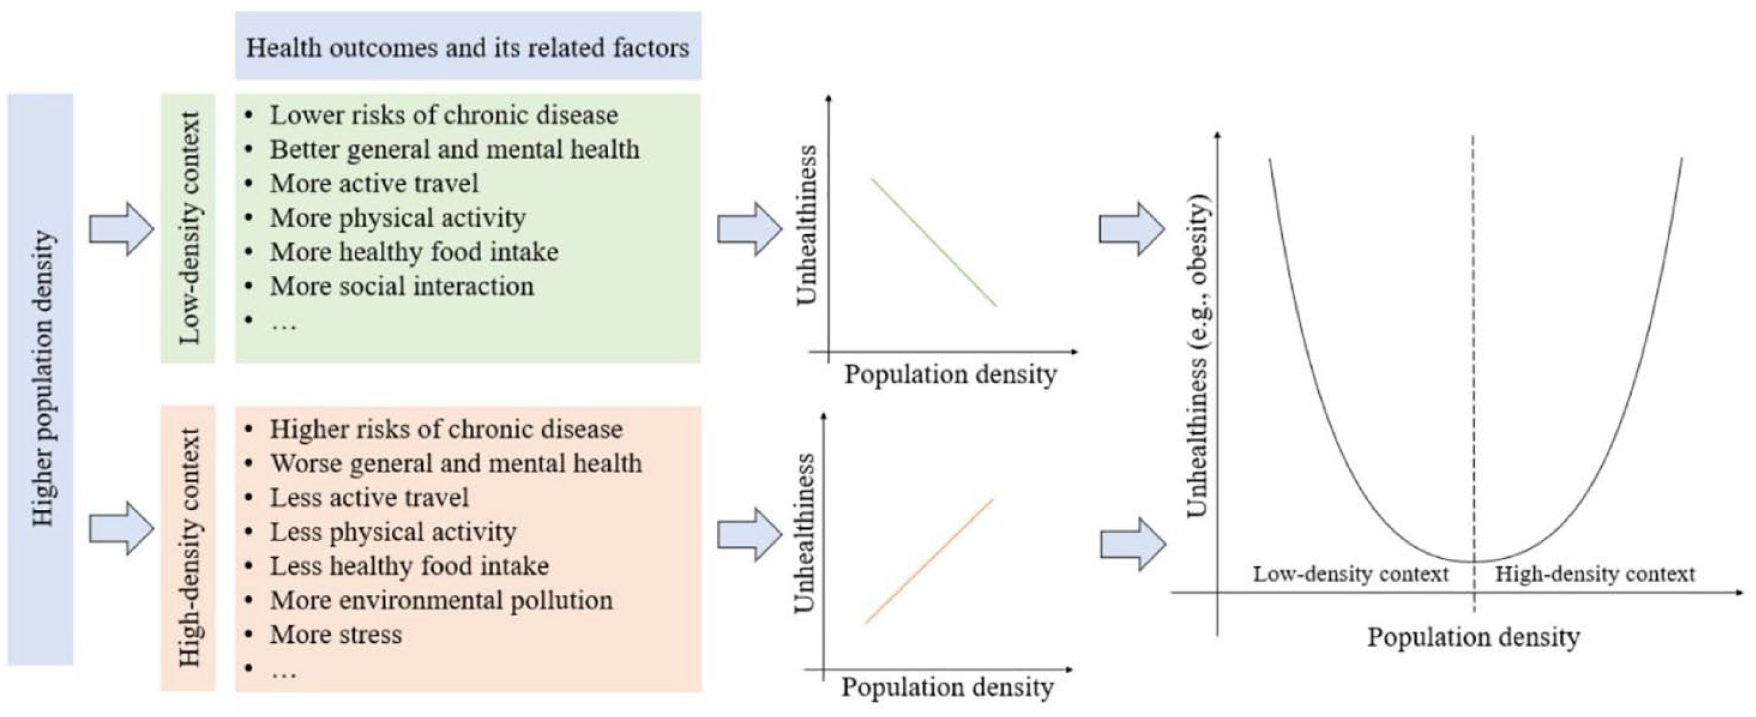
The conceptual framework.
This study focuses on examining the U-shaped relationship between population density and obesity, but it does not test the mediators of this association due to data unavailability. Using a Chinese sample, we relax the linearity assumption and consider the nonlinear association between population density and obesity. We hypothesize that with the increase in population density, people are more likely to have a lower risk of obesity. However, when the population density exceeds certain thresholds, a higher population density tends to increase obesity.
Method
Data
The data were obtained from the nationwide China Labor-force Dynamics Survey (CLDS) administered by the Center for Social Survey at Sun Yat-sen University. This survey aimed to investigate the labor force population over 16 years of age in China. A multistage clustered, stratified, probability proportional to size sampling approach was applied to collect data. Because separate survey sampling frameworks were designed for cities and counties, the respondents from cities represented people living in urban areas. First, mainland China was divided into 29 province-level divisions (excluding Hainan Province and the Tibet Autonomous Region) based on administrative divisions. Second, the 29 province-level divisions were divided into six groups based on the sizes of their populations and labor forces. Third, administrative districts within each group were randomly selected according to their GDP rankings using a systematic sampling approach. Fourth, neighborhoods within each selected administrative district were randomly selected based on the sizes of their labor forces. Finally, households within each selected neighborhood were randomly selected, and all labor force members of the households were interviewed (Yin and Sun, 2018; Wang et al., 2017).
This survey followed a longitudinal design, with the same respondents interviewed every two years starting in 2012. The Center for Social Survey has collected four waves of data (2012, 2014, 2016, and 2018) but only published the dataset collected between 2012 and 2014. A total of 2,677 urban respondents were interviewed in both waves. After the removal of observations with missing values, the final sample used for this study included 3,423 observations from 1,984 respondents aged between 18 and 65 years. Notably, the results of t tests showed that most variables, particularly obesity and population density, did not significantly differ between the final and original samples, suggesting that the removal of observations with missing values should not have biased the estimation in this study. Additionally, although we removed elderly people over 65 years of age because obesity differs by age (Feng et al., 2010), retired adults younger than 65 years of age were included in the final sample.
Variables
Table 2 presents the variables in this study. The dependent variable was body mass index (BMI), which is measured by weight in kilograms divided by height in meters squared. In this study, the mean BMI was 23 kg/m2, and 7% of observations were obese (BMI ⩾ 28 kg/m2).
The definition, mean, standard deviation, and extrema of the variables.
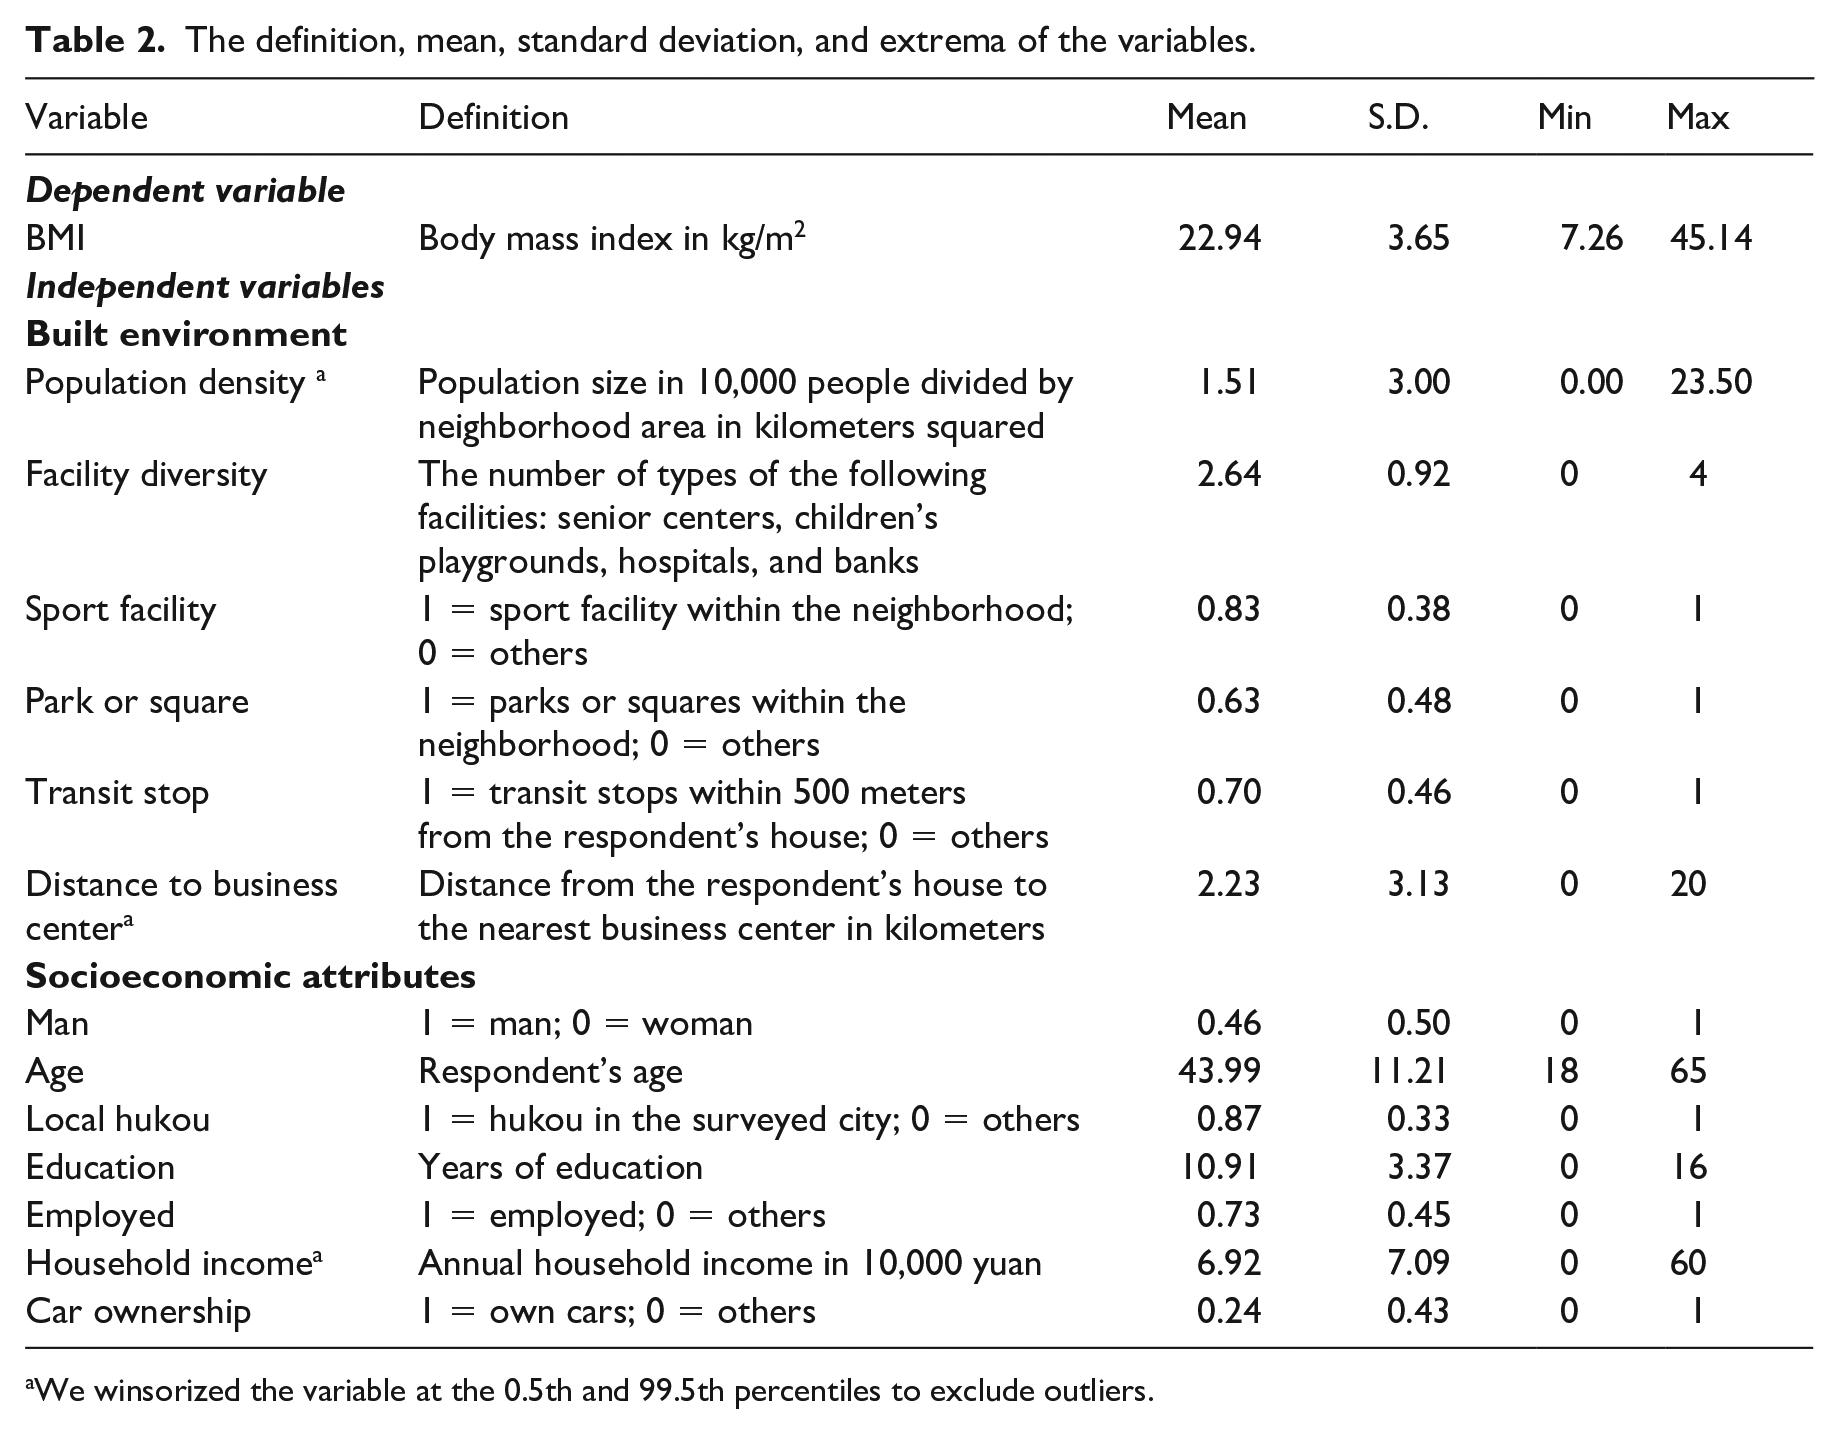
We winsorized the variable at the 0.5th and 99.5th percentiles to exclude outliers.
The analytical spatial units of this study were neighborhoods, which referred to resident committees (Ju-wei-hui). They are the smallest urban administrative units in China (Qin and Zhang, 2014), and the median neighborhood area was 1.5 km2 in this study. The key independent variable was population density, which was defined as the neighborhood population size divided by the neighborhood area. Population density is a more accurate measure than other population-related density measures (e.g., building density and household density) because it considers household size and vacancy status. The population density was lower than 50,000 people/km2 in most neighborhoods. Only a few neighborhoods had population densities above 80,000 people/km2 (approximately 5% of observations), but the densest neighborhood had approximately 235,000 people/km2. The mean population density was approximately 15,000 people/km2. Figure 2 presents the correlation between population density and aggregated BMI at the neighborhood level unadjusted by confounding variables. As the population density increased, the mean BMI decreased first and then increased, which was consistent with our research hypothesis. Therefore, we put a quadratic term of population density into the empirical model to test the nonlinear association.
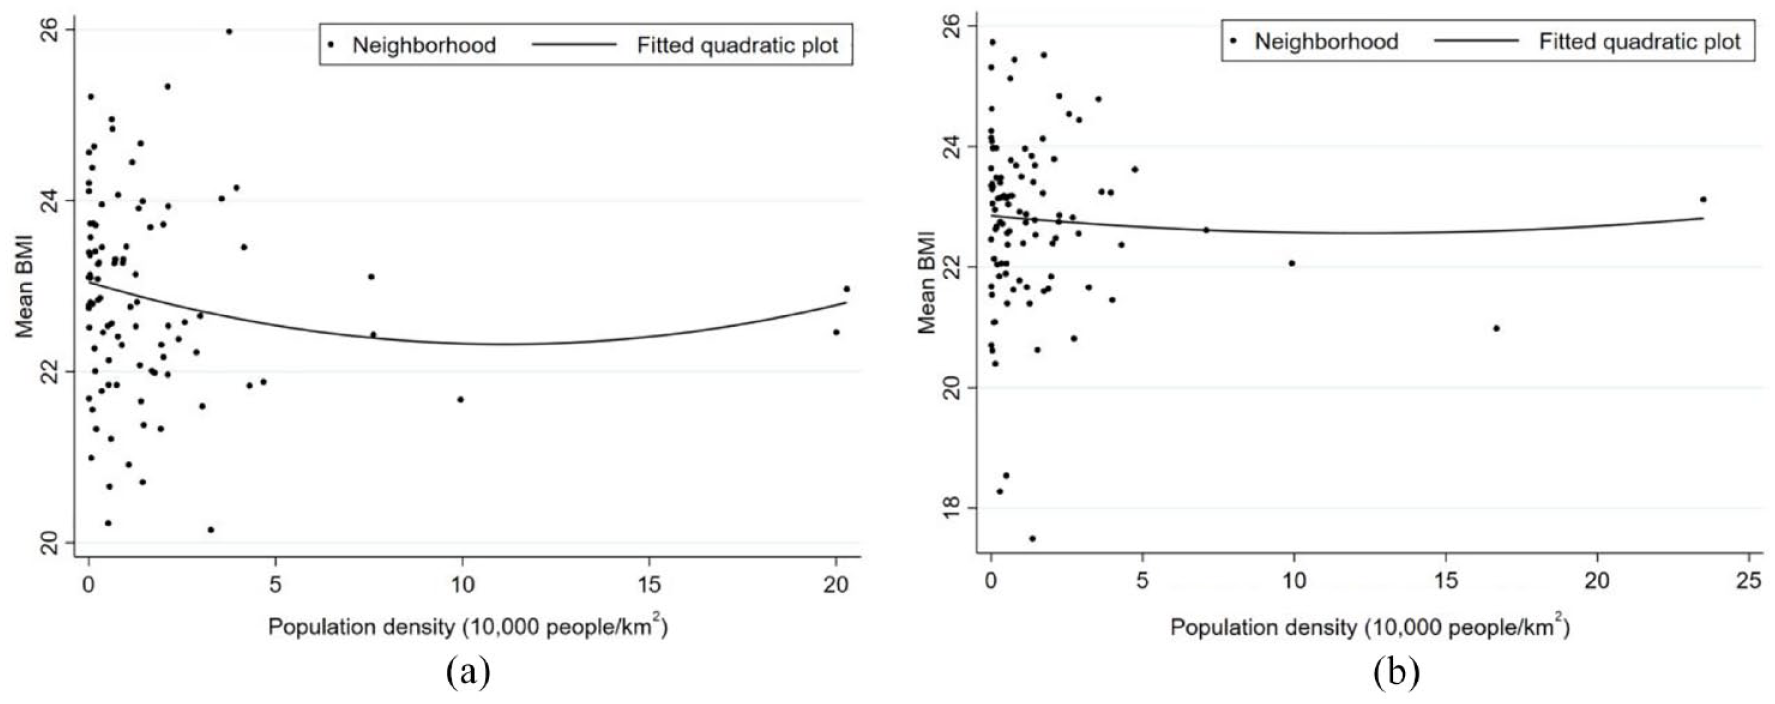
Scatter plots and fitted quadratic curves of population density.
Other built environmental elements included neighborhood facility diversity, the presence of destinations related to reducing obesity risks (i.e., sports facilities, parks or squares, and transit stops), and the distance to the nearest business center. Different from population density, which emphasizes the agglomeration of people, facility diversity is a proxy of mixed land use, which may provide more travel destinations and encourage active travel, leading to a lower risk of obesity (Stevenson et al., 2016). The presence of sports facilities and the presence of parks or squares are proxies of the exercising environment, which may encourage residents to exercise, resulting in a lower risk of obesity (Sallis et al., 2020). The presence of transit stops may reduce obesity by promoting walking or cycling to transit stops (Rundle et al., 2007). Similarly, shorter distances to the nearest business center may improve job accessibility and have negative effects on obesity by reducing sedentary time spent in cars (Mouratidis, 2019b). In this study, approximately three types of facilities were located within neighborhoods on average. 83% of observations lived in neighborhoods with sports facilities, which was a slightly higher proportion than that in the original sample (82%). A total of 63% of observations lived in neighborhoods with parks or squares. 70% of observations could reach transit stops within a 500-m distance, which was a slightly lower proportion than that in the original sample (72%). The distance to the nearest business center was approximately 2.23 km on average.
Socioeconomic attributes included sex, age, age squared, hukou status, education level, employment status, household income, and car ownership. Previous studies have found that men and older people are more likely to be obese (Wang et al., 2020). Hukou status may affect obesity because it is related to local public services and welfare benefits (Song, 2014). People who have higher education levels and are employed tend to have a lower risk of obesity (Xiao et al., 2020). A higher household income and car ownership are positively associated with obesity in China (Pan et al., 2021). In this study, 46% of observations were men, and the mean age was approximately 44 years old. 87% of observations had a local hukou, which was a slightly lower proportion than that in the original sample (88%). 73% were employed, which was a slightly higher proportion than that in the original sample (71%). On average, they had received 11 years of education, and their annual household income was approximately 70,000 yuan. 24% of observations owned cars.
Models
We employed fixed effects linear models to examine the association between population density and BMI because the data were longitudinal. We set the baseline model as follows:

where BMIit indicates respondent i’s body mass index in survey year t. D is population density, and we included its quadratic term to examine its nonlinear effects. BE represents the built environmental elements excluding population density. X indicates respondents’ socioeconomic attributes. T is a dummy variable to control for year effects, and γ is used to control for individual effects. Hence, sex was removed from the model because it does not change over time. ε is the error term, and β is the regression coefficient. We used cluster standard errors to adjust the estimation bias resulting from the nested data structure (Heisig et al., 2017).
Fixed effects models remove the effects of time-invariant variables by subtracting the mean from observations across years for every respondent (Rabe-Hesketh and Skrondal, 2008). The equation is equivalent to Equation (1) and is as follows:

Moreover, we performed several robustness checks. First, we removed the observations with a BMI below 18.5 kg/m2 to reduce the bias from thin respondents (robustness check 1). Second, we re-estimated the association by replacing BMI with obesity (robustness check 2) to reduce the measurement errors of weight status. We used fixed effects logit models because obesity was a dummy variable indicating whether BMI was larger than or equal to 28 kg/m2. Third, we re-estimated the relationship between population density and obesity by using the subsample of people with a BMI above 18.5 kg/m2 (robustness check 3).
Results and discussion
Results
Table 3 presents the results of the fixed effects models. Population density had a U-shaped relationship with BMI, supporting the research hypothesis. In particular, population density had a negative association with BMI, and the quadratic term of population density was positively related to BMI. That is, with the increase in population density, BMI decreased first and then increased. The U-shaped association was stable in all robustness checks.
Results of the fixed effects models.
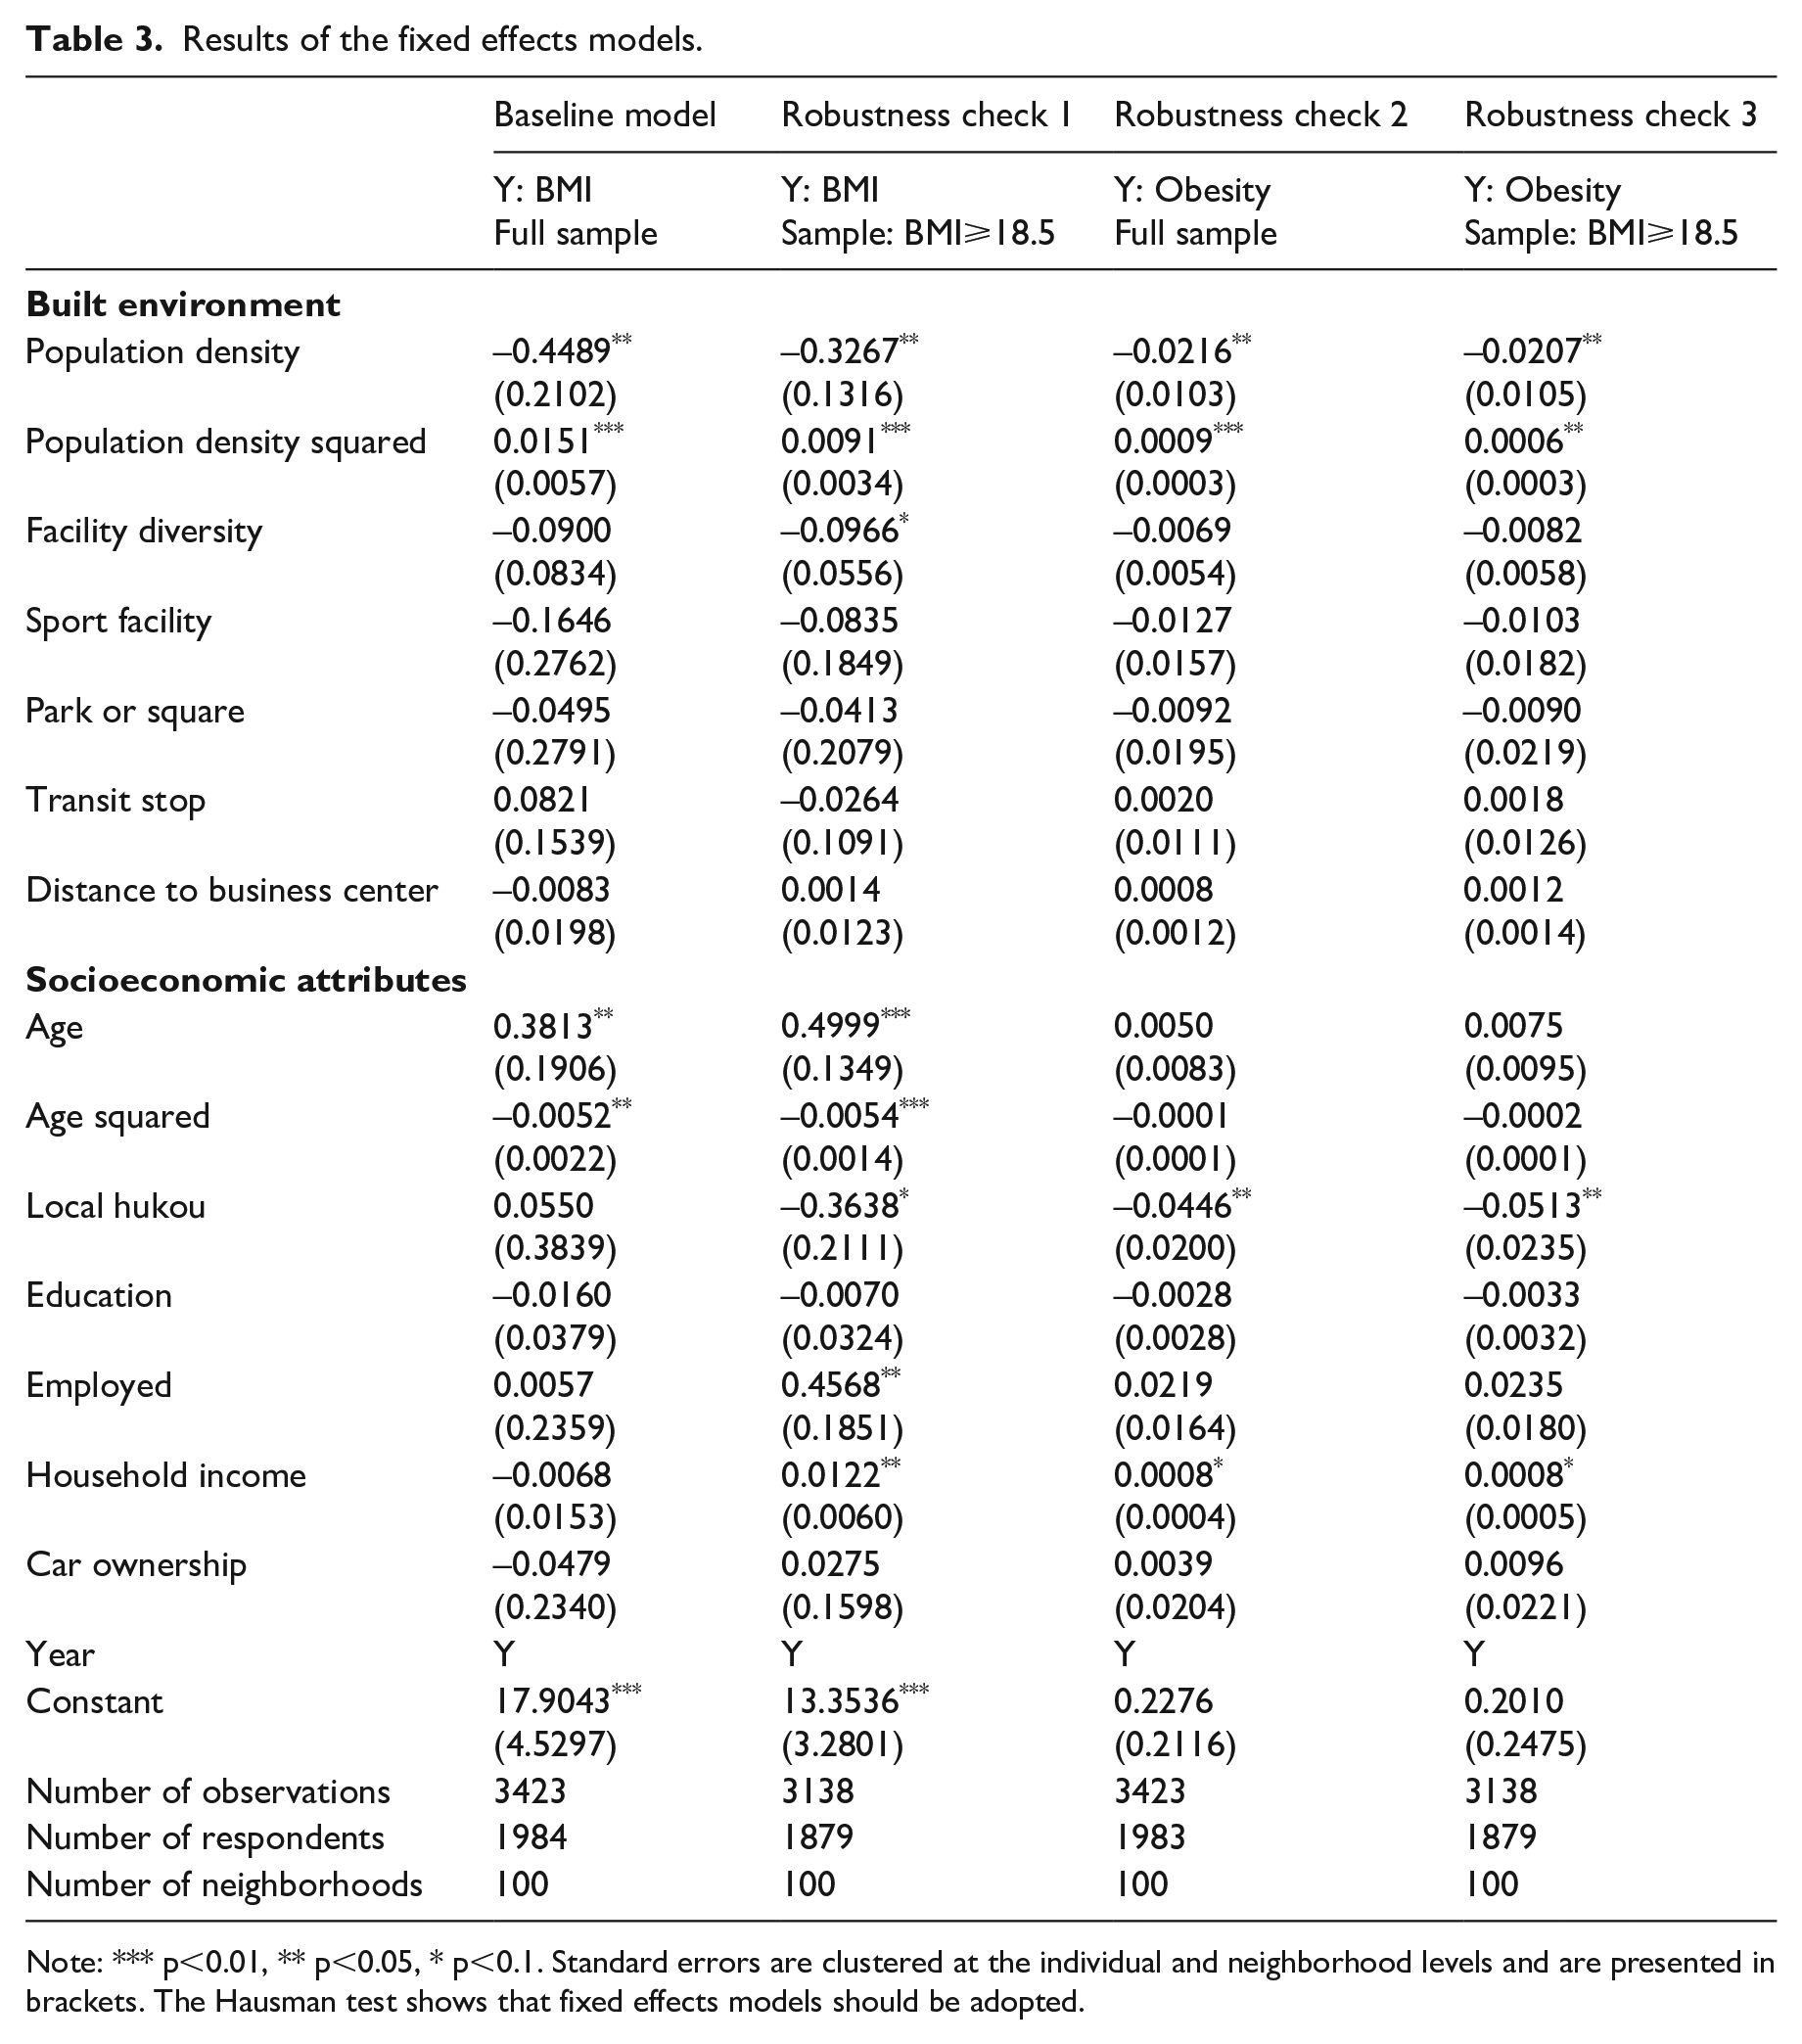
Note: *** p<0.01, ** p<0.05, * p<0.1. Standard errors are clustered at the individual and neighborhood levels and are presented in brackets. The Hausman test shows that fixed effects models should be adopted.
We did not observe significant associations between other built environmental variables and BMI in the baseline model. The possible reasons are as follows. First, compared to population density, the changes in other built environmental elements over a two-year period were relatively small. Longer-term panel data are needed to observe these minor changes and their effects. Second, residents’ daily activities may not be limited to neighborhoods, and hence, these built environmental elements had only limited influence. Facility diversity was marginally negatively associated with BMI in the robustness check 1 model, suggesting that mixed land use helped to reduce the weight status of people with BMI values greater than 18.5 kg/m2.
Age had an inverted U-shaped relationship with BMI, which was in line with the literature (Xu et al., 2015). BMI increased with age from 18 to 37 years. A possible reason is that young adults usually have busy lives, spend less time engaged in physical activity, and experience greater stress. However, BMI decreased as age increased from 37 to 65 years. This is probably because middle-aged adults usually pay more attention to their health, leading to a lower BMI. In the robust models, residents who had a local hukou tended to have a lower BMI. This may be because migrants from rural areas usually have lower levels of health literacy. Household income was positively related to BMI. A higher household income implies that people can afford more food, leading to greater food intake and higher BMI values (French and Crabbe, 2010). Employed residents had a higher BMI than unemployed residents. A possible explanation is that workers often experience more pressure and have more sedentary behaviors, leading to higher BMI values (Yamada et al., 2002).
Understanding the U-shaped association between population density and BMI
Figure 3a shows the thresholds of the U-shaped association between population density and BMI based on the results of the baseline model. A population density below 80,000 people/km2 was negatively associated with BMI, consistent with studies from developed countries, such as America (Lopez, 2007) and Canada (Pouliou and Elliott, 2010). This is because developed countries have relatively low population density. For example, the maximum population density in a neighborhood is lower than 20,000 people/km2 in northern Finland (Näyhä et al., 2013). In fact, most Chinese neighborhoods also have relatively low population density and the mean population density was 15,100 people/km2 in this study. Hence, we infer that a higher population density is negatively related to BMI in low-density contexts. On the one hand, a higher population density improves the accessibility of healthy food stores (e.g., fruit and vegetable stores, supermarkets) (Wilde et al., 2014), encouraging healthy diets and reducing BMI (Morland et al., 2006). On the other hand, a higher population density promotes active travel modes by shortening travel distances (Flint and Cummins, 2016) and encourages moderate to vigorous physical activity by improving the street connectivity and accessibility of sport-related facilities (e.g., gyms) (Troped et al., 2010). Higher physical activity levels increase people’s energy consumption and contribute to reducing BMI (Hill et al., 2012).
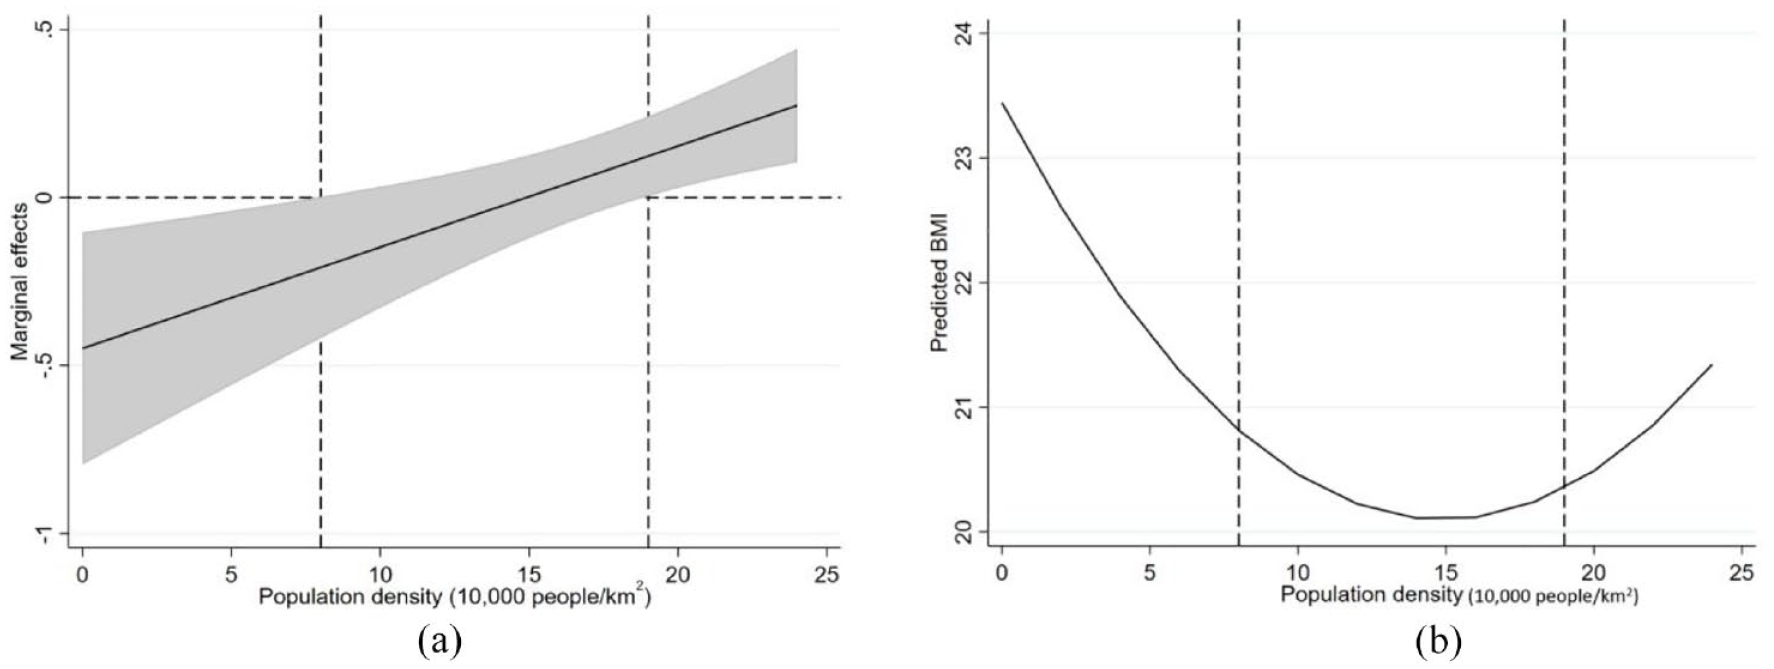
The U-shaped relationship between population density and BMI.
A population density above 190,000 people/km2 was positively associated with BMI. This finding is supported by studies from East Asian countries, such as China (Sun et al., 2017b) and the Philippines (Arantxa Colchero and Bishai, 2008). Considering that the population density in East Asia is much higher than that in other areas, the positive association is probably due to the following reasons. First, a higher population density increases obesity risks by reducing levels of physical activity. On the one hand, population density has only marginal effects on the shift in travel modes in overly dense neighborhoods (Sun et al., 2017b). That is, the negative effects of population density on obesity are limited. On the other hand, a higher population density curbs physical activity by reducing the number of per capita public spaces and sports facilities, leading to higher BMI values (Yin and Sun, 2020). Second, residents living in overly dense neighborhoods are surrounded by food swamps, which are characterized by numerous high-energy and low-nutrition food stores and are a major cause of obesity (Cooksey-Stowers et al., 2017). Third, a higher population density tends to increase mental illness (Ghazali et al., 2020) because of higher stress levels and worse sleep, leading to weight gain (Geiker et al., 2018). Last, a high population density is positively related to air and noise pollution (Han and Sun, 2019), which contributes to higher BMI values (Wei et al., 2016).
When the population density was between 80,000 and 190,000 people/km2, its marginal effects were nonsignificant, as most positive and negative effects cancelled each other out. This finding suggests that people have the lowest obesity risk if they live in neighborhoods with a population density in this range, all else being equal.
The inverse U-shaped association between population density and health
The results showed a U-shaped association between population density and BMI, suggesting that population density has an inverse U-shaped association with health, which is also supported by the recent Chinese literature (Table 4). To enhance the comparability of the results, we focused on obesity and its possible influencing behavioral factors and limited the research area to China. We assumed that the thresholds of population density regarding obesity, active travel, and physical activity would have some commonalities. In particular, below the threshold, a higher population density promotes active travel and physical activity, leading to a lower risk of obesity. Beyond the threshold, a higher population density reduces active travel and physical activity, and hence, its association with obesity is changed.
Selected studies of the nonlinear associations between neighborhood population density and health and its related factors in China.
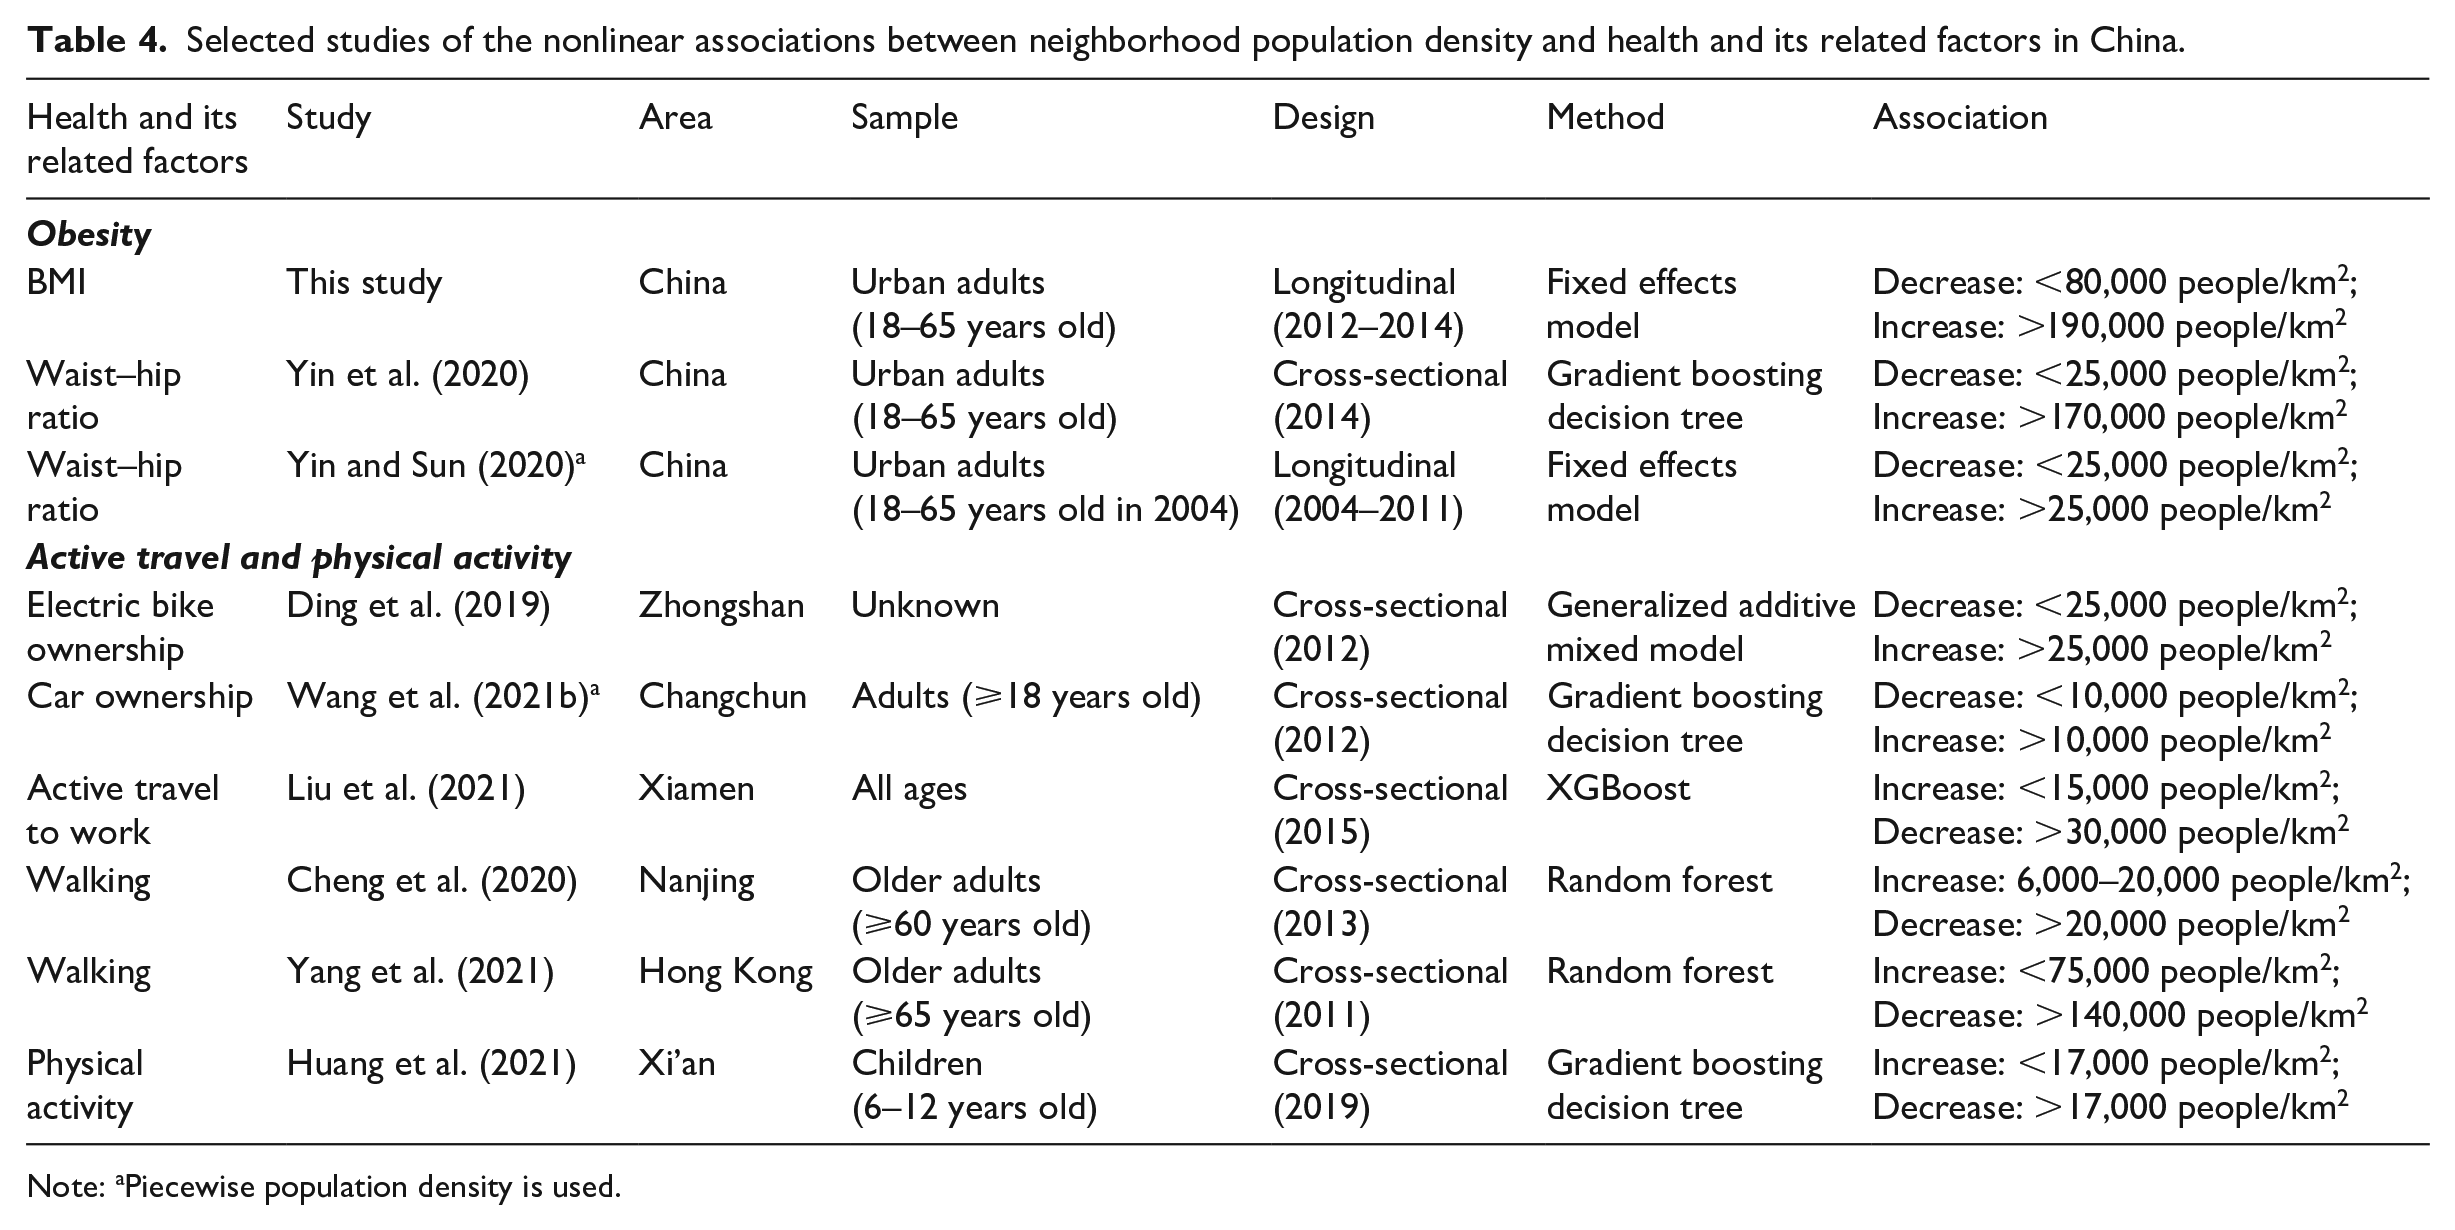
Note: aPiecewise population density is used.
Several studies have found that neighborhood population density has a U-shaped relationship with waist-to-hip ratio (Yin et al., 2020; Yin and Sun, 2020), and that city population density also has a U-shaped association with BMI (Sun and Yin, 2018). Moreover, a higher population density reduces vehicle ownership and encourages active travel and physical activity, but increases vehicle ownership and physical inactivity when it exceeds certain thresholds (Ding et al., 2019; Huang et al., 2021; Liu et al., 2021).
There are two potential thresholds of the inverse U-shaped association between population density and health: 25,000 and 80,000 people/km2.
When the population density is below 25,000 people/km2 (Figure 4a), a higher population density improves people’s health. Residents living in this type of neighborhoods are less likely to own electric bikes (Ding et al., 2019) and have lower obesity risks (Yin and Sun, 2020). Noting that this threshold might be smaller for children and older adults. When the population density is below 17,000 people/km2, it promotes children’s physical activity (Huang et al., 2021). When the population density is below 20,000 people/km2, it encourages older adults’ walking (Cheng et al., 2020).
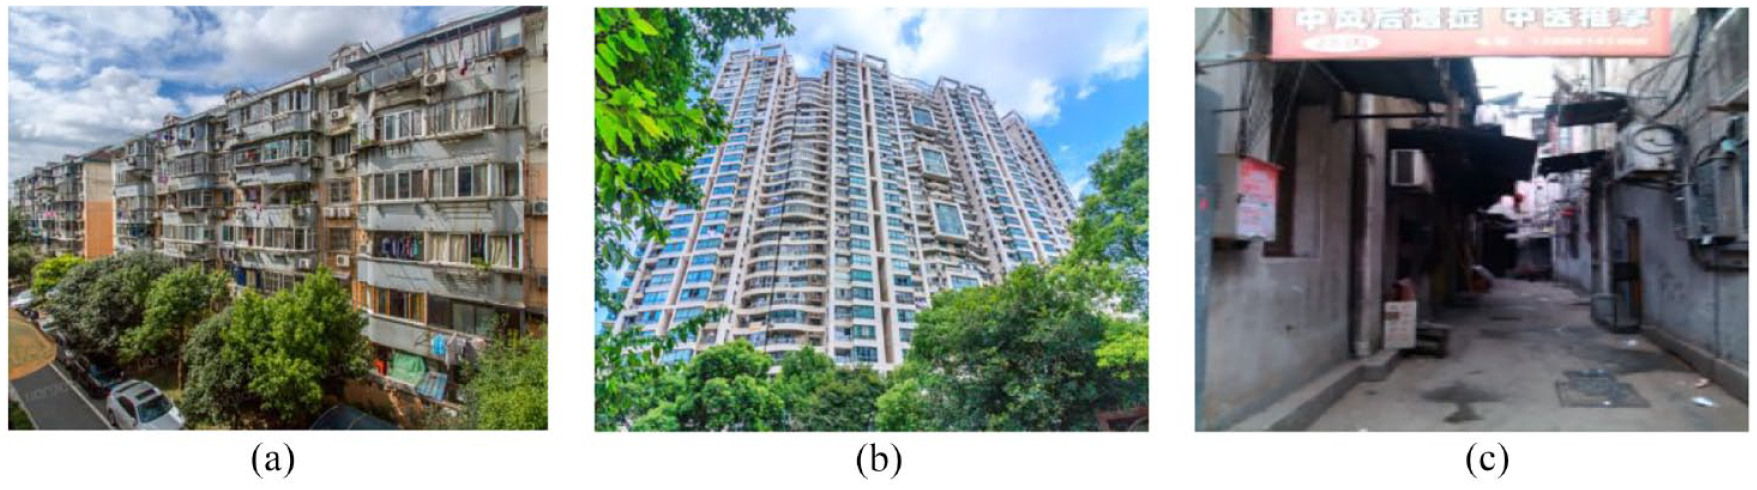
Typical Chinese neighborhoods at the threshold of population density.
When the population density is between 25,000 and 80,000 people/km2 (Figure 4b), the literature shows mixed findings on the association between population density and health-related behaviors and outcomes. First, a population density in this range is harmful to health. People living in these types of neighborhoods tend to own electric bikes (Ding et al., 2019), reduce active travel (Liu et al., 2021), and have a higher risk of obesity (Yin and Sun, 2020). Second, a population density in this range has null effects on health based on an obesity study (Yin et al., 2020). Third, a population density in this range continues to improve health. The present study shows that a population density below 80,000 people/km2 has a negative association with BMI. Another study showed that a population density below 75,000 people/km2 encourages older adults’ walking behaviors (Yang et al., 2021).
These mixed findings can be explained by the following reasons. First, the effects of population density differ by local contexts and sample characteristics, and hence, the threshold from a certain context and sample might not be appropriate for other contexts. Second, population density has synergistic effects with other built environmental elements (Ding et al., 2018), which may change the thresholds. Third, the effects of population density may differ in terms of health-related behaviors and outcomes considering that health outcomes depend on the complex effects of population density on multiple health-related behaviors.
A population density above 80,000 people/km2 has null or negative effects on health (Figure 4c). That is, when neighborhoods are overly dense, increasing the population density provides no additional benefits to health and decreases the level of health, as this type of neighborhood is usually overcrowded and has several types of pollution.
Conclusion
Population density is a fundamental built environmental element and plays an important role in individual health, but previous studies have found mixed associations between population density and health. Hence, this study proposed that population density has a U-shaped association with unhealthiness. To examine the hypothesis, we used fixed effects models to identify the nonlinear association between population density and BMI using Chinese nationwide panel data between 2012 and 2014. The results show that population density has a U-shaped effect on BMI after controlling for other built environmental elements and socioeconomic attributes. In particular, on the left side of the U-shaped curve, increasing the population density tended to reduce BMI and unhealthiness, which was in line with findings in developed countries. On the right side of the U-shaped curve, a higher population density increased BMI and unhealthiness, which was consistent with most studies from Chinese megacities.
The U-shaped pattern of the effect of population density on obesity sheds some light on healthy city and neighborhood planning. Densification guidelines from developed countries may only be applicable in the low-density context. Generalizing these densification strategies to developing countries with high density is risky. Therefore, policymakers should avoid adopting a ‘one policy fits all’ strategy. Instead, they should pay more attention to the neighborhood context and adopt different planning strategies for low-, medium-, and high-density neighborhoods. Although many contributors to neighborhood density are not easy to intervene in (e.g., levels of economic development, climates, neighborhood locations, the construction year, local policies on buildings, etc.), planners can still focus on those easily adjustable factors (e.g., accessibility, land use, housing affordability, etc.). First, considering that many neighborhoods (e.g., neighborhoods in new towns) in China have low population densities, it is necessary to adopt a densified strategy to improve residents’ health. In particular, Chinese planners can enhance population attraction in low-density neighborhoods by optimizing built environmental elements (e.g., mixed land use). Second, for neighborhoods with high population densities (i.e., urban villages), urban renewal and the establishment of density limitations could help reduce the population density to prevent resident exposure to unhealthy environments. Additionally, providing more affordable housing for migrants and poor individuals may also relieve the high population density in urban villages. Third, in terms of neighborhoods with moderate density, planners should maximize the benefits of increasing population density (e.g., improving accessibility to health-promoting facilities) while minimizing the disadvantages of high population density (e.g., improving air quality).
Notably, our findings indicate that a moderate neighborhood density is 80,000 people/km2. This threshold is very close to the Chinese guideline for complete neighborhoods (Wan-zheng-she-qv), which recommends a maximum neighborhood density of 75,000 people/km2 (12,000 people living in a 0.16 km2 neighborhood). The difference may be because this study focuses on adults’ health outcomes, particularly obesity, but the guideline for complete neighborhoods considers many other aspects in addition to adults’ health outcomes (e.g., education and travel behavior). Moreover, the difference in these thresholds also reminds policymakers to devote more attention to local neighborhood contexts and to avoid a ‘one policy fits all’ approach.
This study has several limitations. First, our findings are more likely to indicate a correlation because fixed effects models cannot control for the effects of omitted variables that change over time (e.g., metabolic capability). However, compared to cross-sectional studies, this study provides more accurate estimations, and the results more closely indicate causality. Second, the longitudinal dataset has only two waves, which may not show small variances in the built environment. If more waves of data were available, we may have been able to observe the effects of other built environmental elements. Third, this study does not empirically test the mediators of the relationship between population density and obesity because of data unavailability. It is necessary to provide empirical evidence regarding the influential paths from population density to health outcomes based on longitudinal designs in future studies if data are available. Fourth, our findings based on the labor force aged between 18 and 65 years may not be generalizable to other subpopulations (e.g., teenagers). Future studies can explore whether the U-shaped relationship between population density and obesity exists in other subpopulations.
Footnotes
Declaration of conflicting interests
The author(s) declared no potential conflicts of interest with respect to the research, authorship, and/or publication of this article.
Funding
The author(s) disclosed receipt of the following financial support for the research, authorship, and/or publication of this article: This research was supported by the National Natural Science Foundation of China (No. 42101184 and No. 42071210), the Major Program of National Social Science Foundation of China (No. 17ZDA068), the China Postdoctoral Science Foundation (No. 2020M681227), the Fundamental Research Funds for the Central Universities (No. 2022ECNU-XWK-XK001; No. 2022ECNU-XWK-ZX02), and the Shanghai Post-doctoral Excellence Program (No. 2020161).