
Abstract
An effective pain management strategy requires understanding of the epidemiology of pain in the population of interest and accurate measurement upon which to base quality improvement plans. The aims of this study were to estimate the incidence of pain in the prehospital setting and to explore features that impact on (1) documentation of pain; (2) severity of pain reported by patients. This retrospective cohort study included 212,401 care episodes attended by National Ambulance Service practitioners during 2020. Descriptive analysis of patient and care episode characteristics and regression analyses for the outcomes pain recorded and severity of pain were performed. We also used text pattern-matching of the notes field to estimate the proportion of patients in pain for whom a pain score assessment had not been documented. Sixty-five percent of all patients had a pain score documented and 29.5% were in pain (11% in severe pain). Likelihood of pain being recorded was most strongly associated with: Glasgow Coma Scale (GCS) Score, working diagnosis of the patient, location of the incident, and patient age. Likelihood of pain severity was most strongly associated with: transport status of patient, GCS score, and patient age. We treated missing data as a separate category and found consistent associations between the outcomes and missing data. We also found that pain was a symptom in approximately 15% of cases where no formal pain score assessment was documented. The data showed associations between routinely collected variables and the likelihood of pain recording and pain severity. Our findings also demonstrate the impact of missing data. To mitigate missing data impact, we suggest that EMS agencies consider making pain score assessment a mandatory requirement of their reporting for every patient. We also recommend that services report the extent and impact of missing data when measuring clinical performance.
Introduction
Access to pain management has been accepted as a fundamental human right by the United Nations and regional human rights bodies. 1 Acute pain that is not managed properly can have negative consequences for a patient's quality of life and increase the patients risk of developing chronic pain 2 and other conditions. 3 Despite this the literature indicates that pain is not particularly well managed across various treatment settings. 2 This includes the prehospital setting where under treatment of pain, also referred to as oligoanalgesia appears to be common,4–6 although the phenomenon itself is not well understood. 3
Studies using the results of pain score assessments to estimate the incidence and severity of pain in prehospital patients have produced wide ranging estimates. 3 At least some of the variation in estimates could be due to differences between studies in their inclusion criteria for age and complaint type. To attempt to provide a more accurate estimate of the overall incidence of pain in prehospital patients, this study used all available cases attended by NAS practitioners during the calendar year 2020.
A clinically significant reduction of pain can and should be the aim for prehospital practitioners caring for patients who require emergency prehospital care.7–12 The starting point of the pain management process is the assessment of pain 13 which informs subsequent decision making. 14 Appropriate pain assessment is therefore an essential step in the provision of pain management. 15 Research indicates that improvements in how pain is assessed in both the prehospital and emergency department settings results in improved pain management.16,17
Our study aimed to contribute to the existing research literature by describing the incidence of pain in the Irish prehospital setting and by examining features that may impact on documentation and assessment of pain by prehospital practitioners. We also investigated whether these features impact on the severity of pain.
In order to inform the choice of variables for inclusion in our study, a literature review was performed. This review indicated that common variables showing an association with pain assessment completion and/or severity of pain include age of patient,18–24 sex of patient,25–29 diagnosis of the patient,20,30,31 time of day of call,20,21 transport duration,20,21 scene time, 21 and measures of cognitive functioning such as GCS score.16,32
Method
Study design
This was a descriptive cohort study using a retrospective analysis of electronic patient care records (ePCRs). Records included all episodes of care recorded electronically by prehospital practitioners in NAS from the 1st January 2020 to 31st December 2020, 2020 being the first full calendar year for which electronic patient care records were available from all NAS stations.
The study was approved by the Clinical Research Ethics Committee, University College Cork (reference number: ECM 02/2022 PUB).
Setting
The National Ambulance Service of Ireland (NAS) is the statutory provider of emergency medical services (EMS) in the Republic of Ireland. In Dublin city and county, EMS is provided by NAS and the Dublin Fire Brigade. In the rest of the country, EMS is provided by NAS only. In 2020, NAS received over 260,000 emergency calls. The NAS is primarily a paramedic-provided service with a staff of approximately 2,000 and has much in common with models of delivery of emergency medical care used in the United Kingdom, Australia, and New Zealand. NAS provides a tiered clinical response including Emergency Medical Technicians (EMTs) whose predominant role is patient transfer and Paramedic or Advanced Paramedic who primarily provide emergency response. Analgesic options for all practitioners include oral paracetamol and ibuprofen, and inhaled doses of nitrous oxide and methoxyflurane. In cases of suspected cardiac chest pain, all practitioners can also administer glyceryl trinitrate (GTN). Advanced Paramedics may also administer further analgesics via intravenous, intraosseous, intranasal, and intramuscular routes. These may include morphine, fentanyl, and ketamine. Lidocaine can be administered for local anesthetic during intraosseous infusions.
Participants and data collected
For each episode of care, NAS practitioners complete an electronic patient care report (ePCR). Data collected using the ePCR is uploaded and stored in a data warehouse. Data extracted for this study included the time, location (longitude and latitude), response priority, patient age, patient sex, working diagnosis category (clinical impression of the presenting illness or injury), Glasgow Coma Scale score, highest attending practitioner level, practitioner notes, transport outcome of the call and the highest documented pain score. Where available, the on-scene duration and transport duration of the call were also extracted.
Outcomes of interest
The primary outcomes of interest were whether a pain score for the patient was documented by the practitioner in the appropriate section of the ePCR and the category of pain severity recorded.
During the study period, assessment of pain was guided by the PHECC Clinical Practice Guidelines (CPGs). 33 For patients aged eight years or older, CPGs state that pain should be assessed in accordance with a visual or analogue pain scale modelled on the World Health Organisation ladder for pain relief. 34 The CPGs further state that the Wong Baker FACES® Scale should be used for children aged five to seven years, and that the Face, Legs, Activity, Cry, Consolability Behavioural (FLACC) pain scale should be used for children aged less than five. 35 Results of both these assessments can be converted into a score ranging between 0 and 10. Where a pain assessment is carried out, the practitioner is expected to document the result in the appropriate place in the electronic record.
Pain scores were categorized as: pain score of 0—“no pain”; 1-3—“mild pain”; 4-6—“moderate pain” and; 7-10—“severe pain.” Where more than one pain score was documented, the highest pain score recorded for that episode of care was used to categorize pain severity. It should be noted that a pain score assessment is not expected to be carried out by the practitioner in every case but should be carried out in cases where pain is suspected by the practitioner or described by the patient. We included all cases in our review so that we could estimate the incidence of pain in prehospital patients.
We also pattern matched the text in the clinical notes for the word “pain” in all records where the pain score assessment field was empty. We carried out a secondary analysis on any matching records to check whether the notes indicated the patient was in pain, despite the absence of a pain score.
Data analysis
All records for 2020 were extracted from the data warehouse. For the main analysis, all continuous variables were categorized including missing data as an extra category where applicable. We considered imputation as an alternative to categorization but were not confident that the data was missing at random and therefore did not use imputation. Logistic regression was used to test the associations between the feature variables and the outcome variables. Full details of data analysis are in the supplementary material.
Results
Patient and episode of care characteristics
A total of 233,043 records were extracted for the period 1st January to 31st December 2020. Excluded records included calls where the resource was stood down before reaching the scene, calls where the electronic record had not been signed off by the practitioner, calls where the patient was deceased, calls where the patient declined treatment and calls where the patient was being transported from one health facility to another (inter-facility transfers) since these patients are generally not assessed or treated. Following exclusions, there were a total of 212,401 qualifying records (see Figure 1 below).
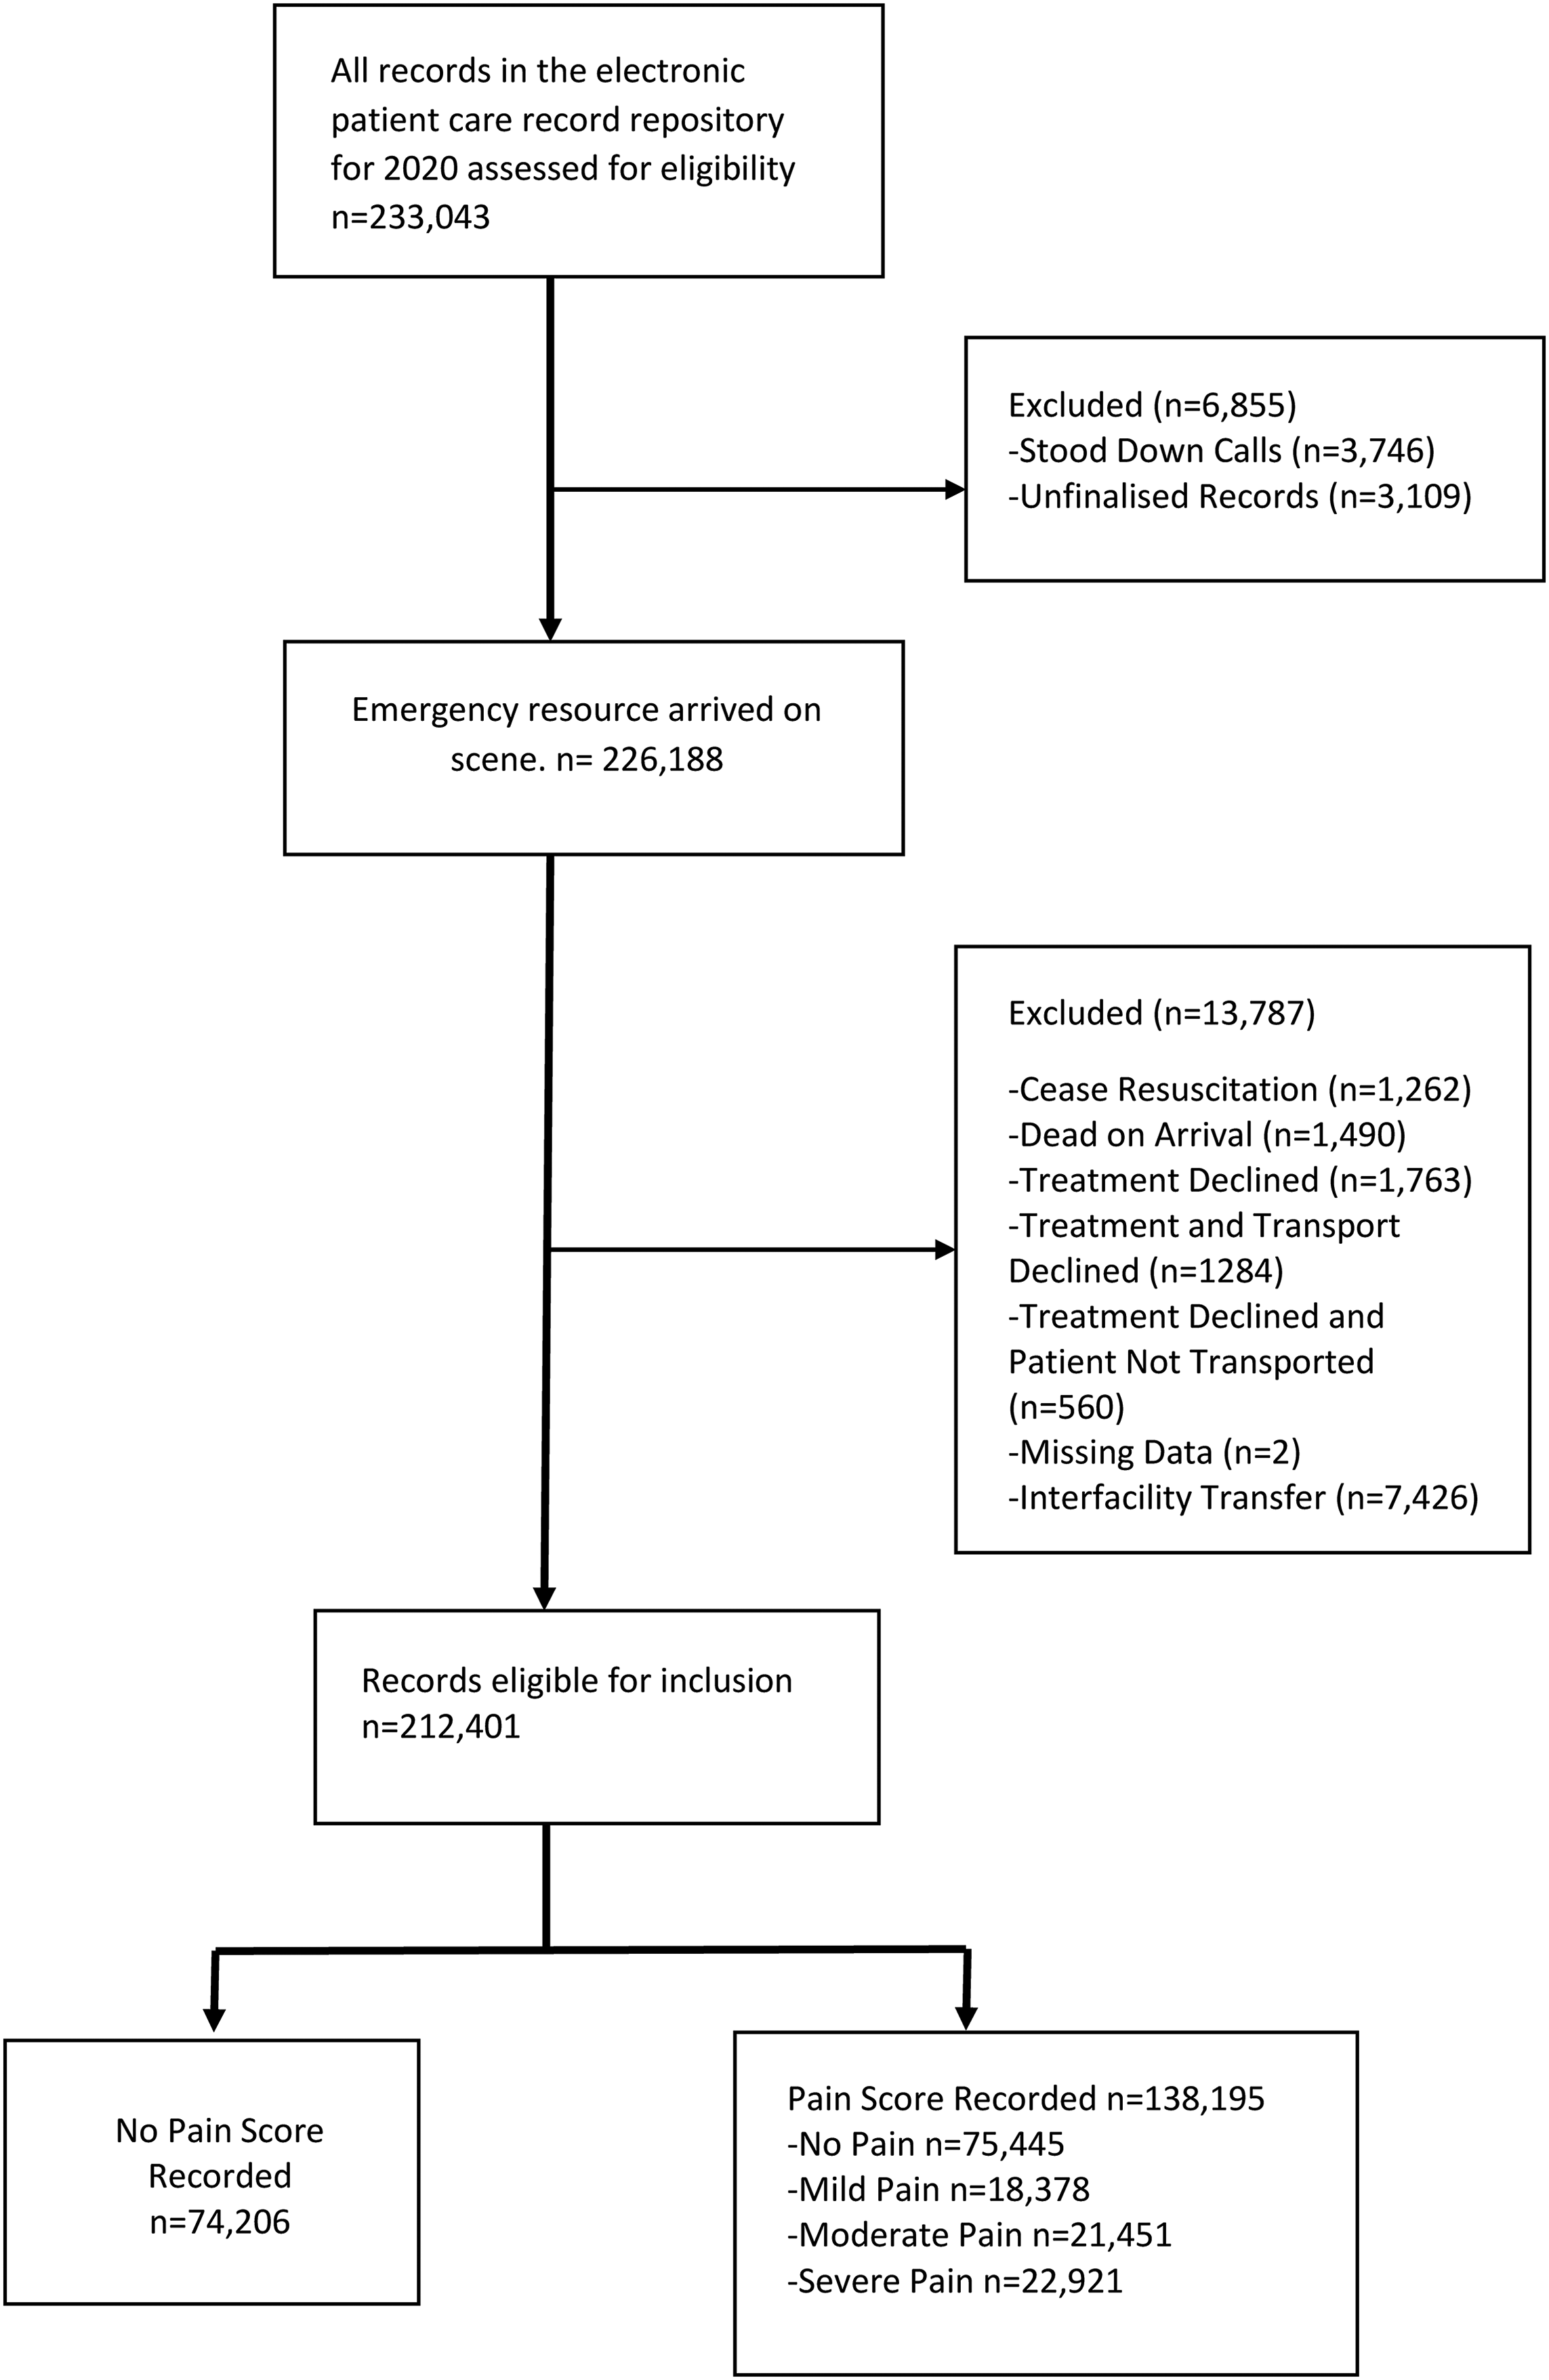
Inclusion criteria for the dataset.
Of the 212,401 patient care episodes analyzed, 138,195 (65%) records included a pain score. Of these, 75,445 patients were reported to not be in pain (pain score 0), 18,378 patients in mild pain (score 1–3), 21,451 in moderate pain (score 4–6), and 22,921 in severe pain (score 7–10). Details of patient and episode of care characteristics are presented in Table S1 (supplementary file).
The incidence of pain in this cohort was therefore 29.5% (62,750 patients with at least one non-zero pain score recorded in the appropriate section of the ePCR).
Likelihood of pain score being recorded
In figure 2, higher odds ratios are indicative of a higher likelihood of a pain score being recorded (i.e., higher likelihood of pain assessment carried out). As shown in Figure 2, the likelihood of pain being recorded was statistically significantly associated with each of the independent variables included in the multivariable binomial logistic regression model. Detailed description of model 1 results is presented in Table S2 (supplementary file).
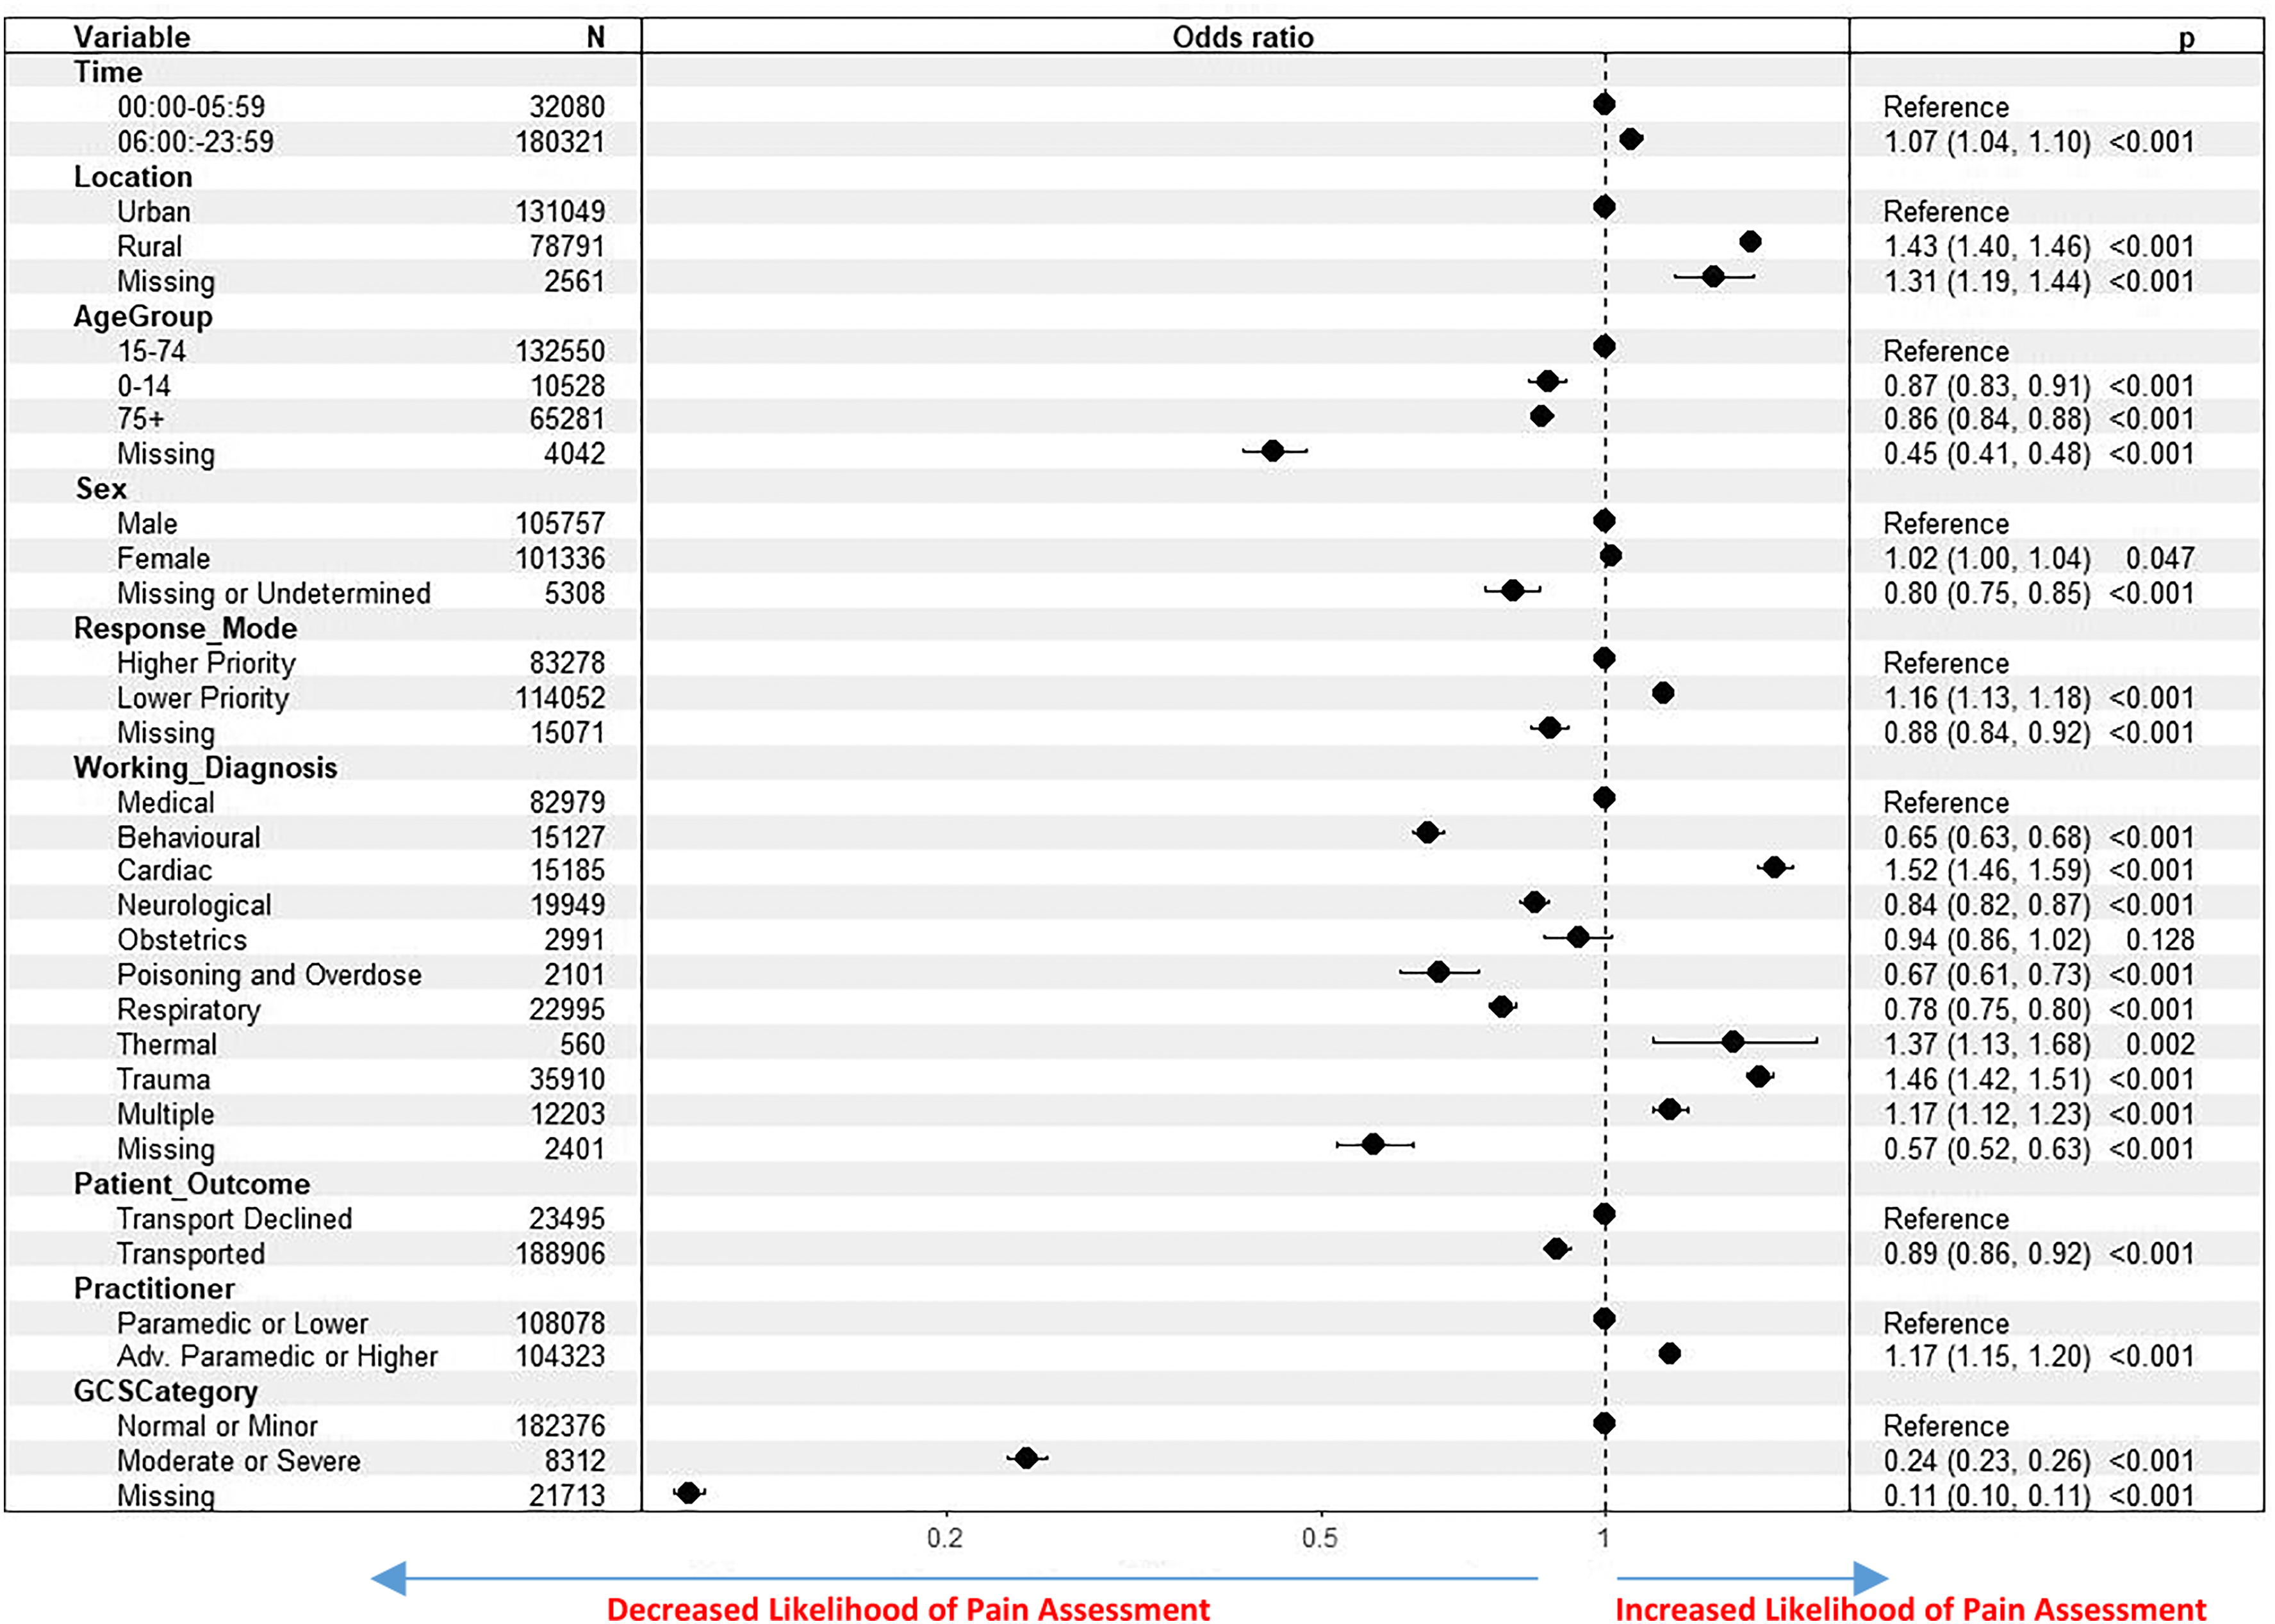
Results of binomial logistic regression for pain score recorded.
Outside of missing data, the variables most strongly associated with the dependent variable were GCS category, the working diagnosis assigned to the patient, location of incident and age of patient.
When compared with patients aged 15–74, patients aged under 15, 75, or older, or with a missing age value were all less likely to have a pain score recorded. The lowest rates of pain score recorded for any ages were for children aged 0–4 years. Patients in a rural location or missing a location value were similarly more likely to have a pain score recorded than patients in an urban area. Female patients were slightly more likely to have a pain score recorded than males.
Patients were more likely to have a pain score recorded if attended by an advanced paramedic or higher. Patients who were transported were less likely to have a pain score recorded than patients who declined transport, as were patients on calls occurring between midnight and 6am.
Severity of pain and associated patient and episode characteristics
In Figure 3, higher odds ratios are indicative of a higher likelihood of the patient being in greater pain (i.e., increased likelihood of patient being in a category indicative of greater pain). As shown in Figure 3, there was a statistically significant association between all the independent variables and severity of pain.
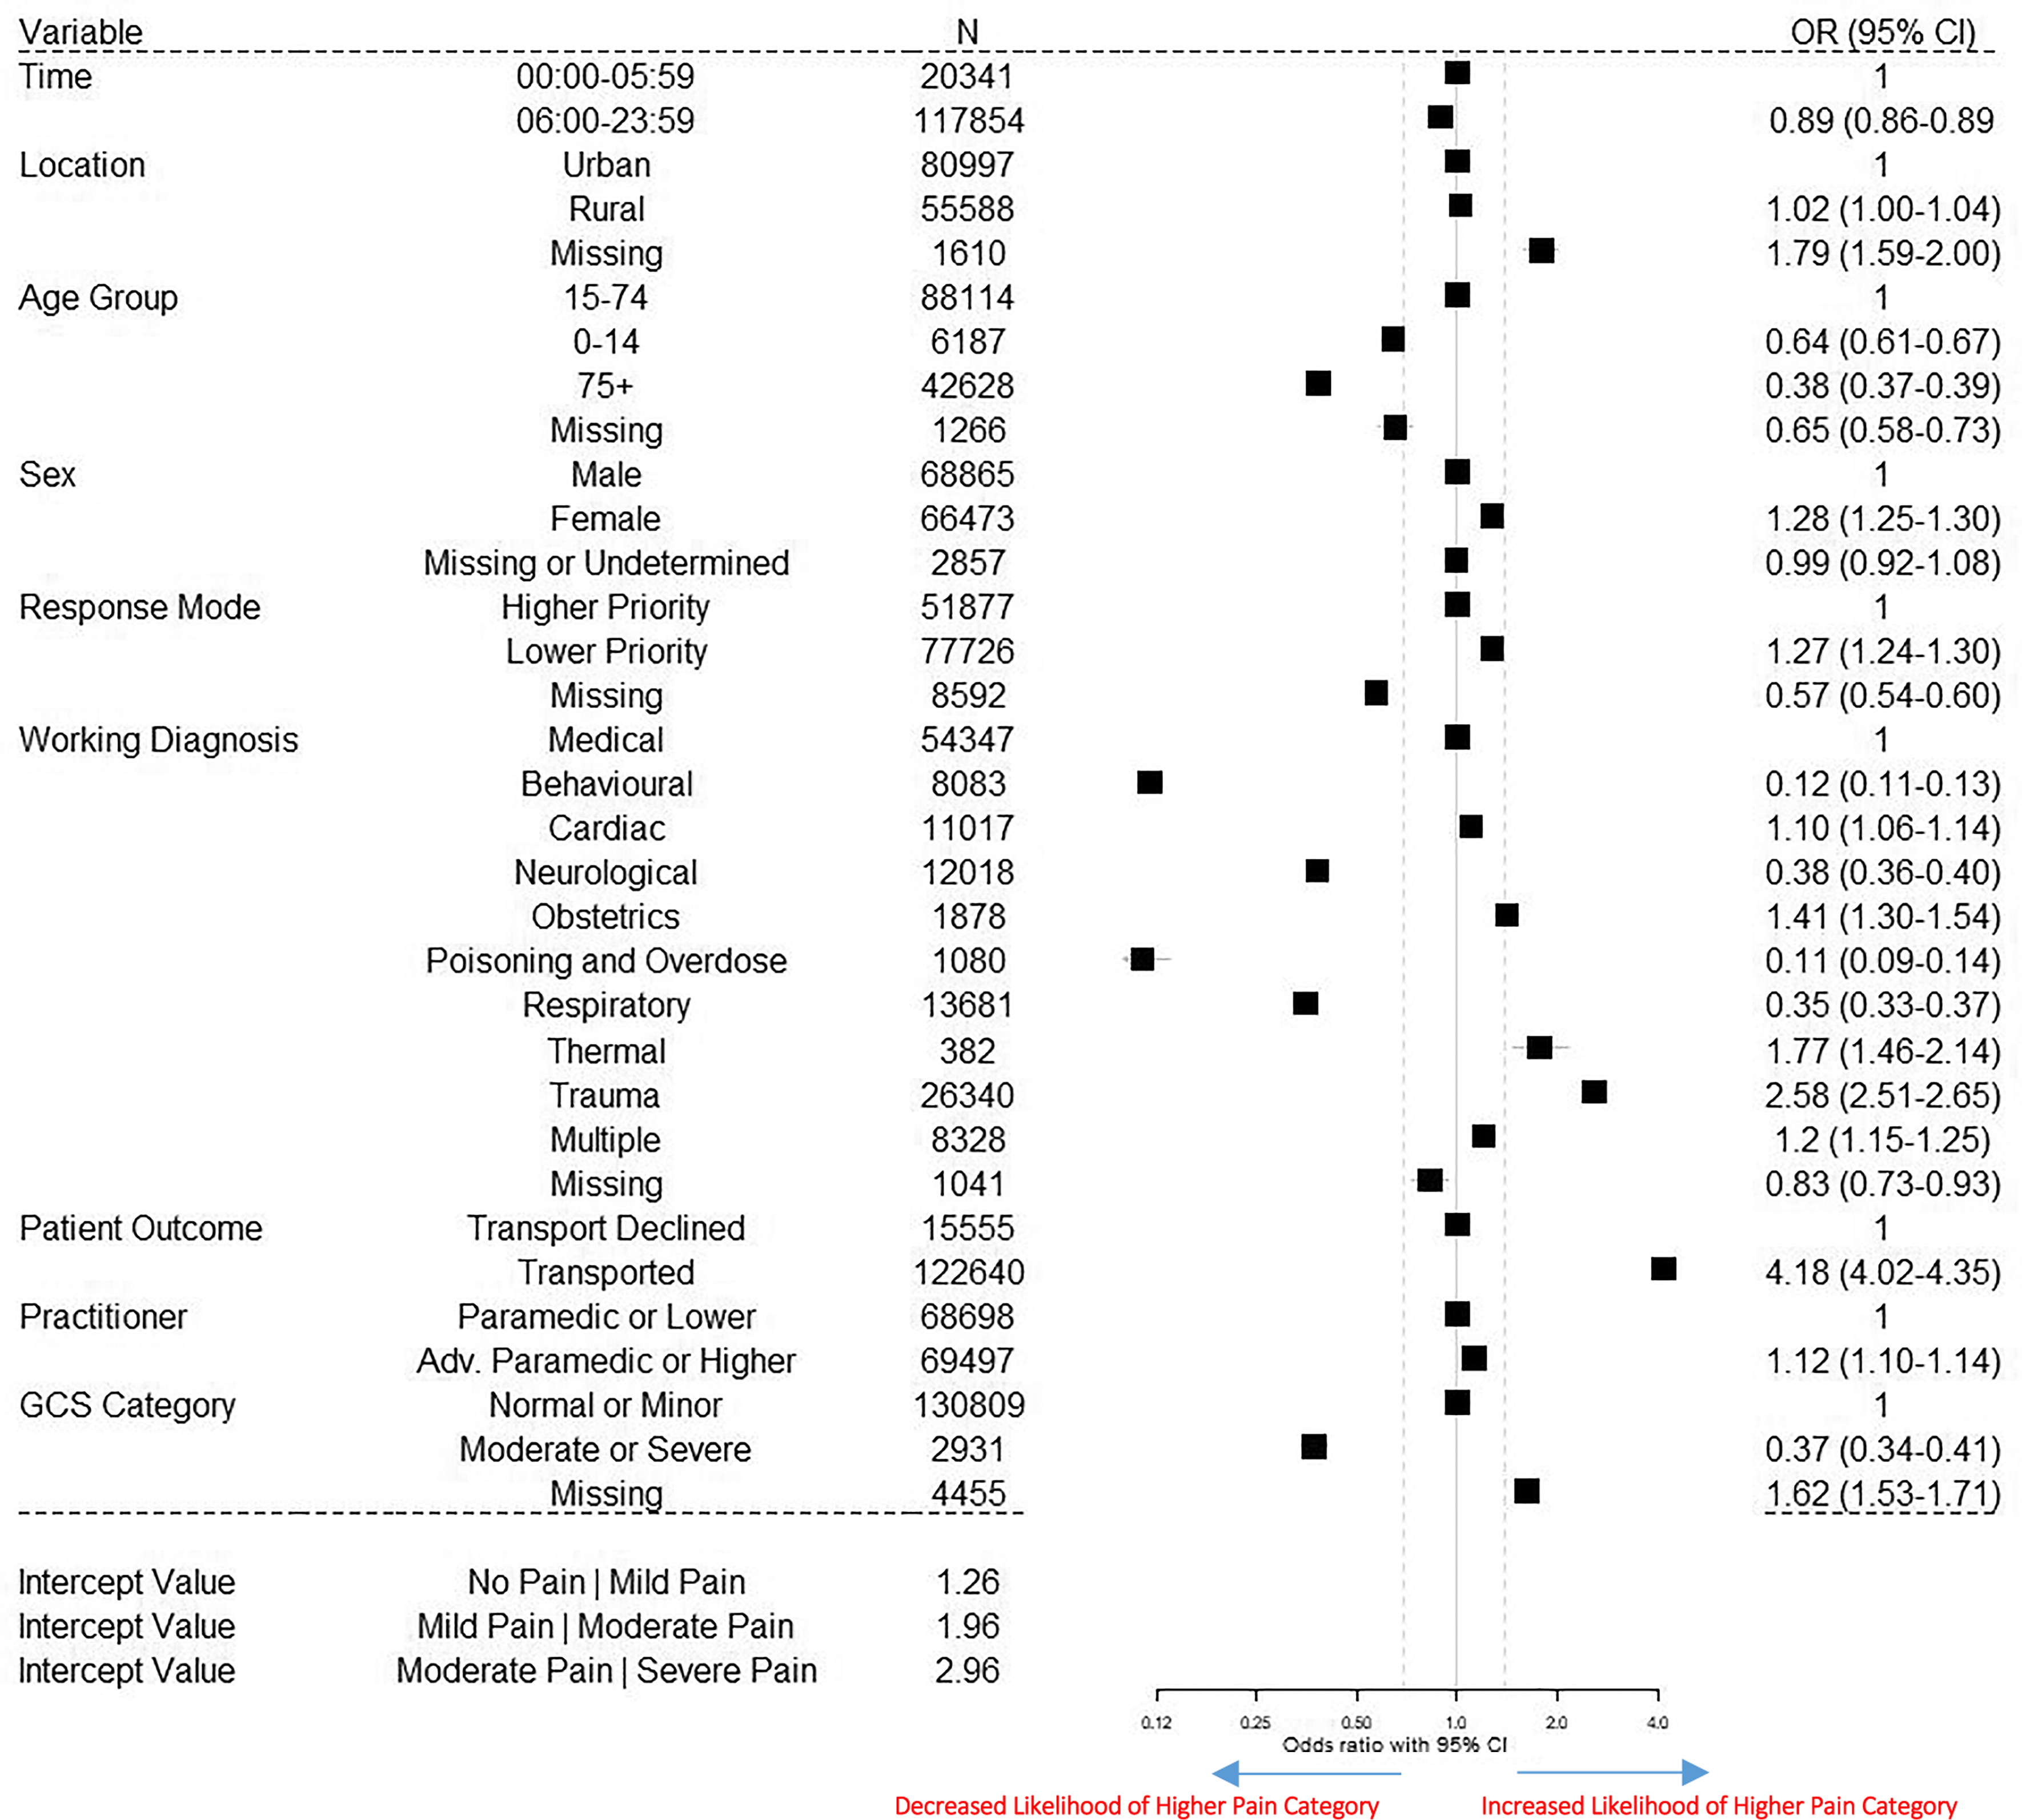
Results of multinomial ordinal logistic regression for pain severity.
Outside of missing data, the variables showing the strongest association with pain severity were patient transport outcome, GCS category, working diagnosis of the patient, and age of the patient.
Patients who were transported were more likely to be in greater pain than patients who declined transport. Patients in the GCS category indicating moderate or severe impairment of consciousness were less likely to be in greater pain than in the normal GCS category. Patients aged 15–74 were more likely to be in a higher pain category than patients aged 75 or older, aged under 15, or missing an age value. A detailed description of model 2 results is presented in Table S3.
Impact of scene and transport duration on likelihood of pain score being recorded and pain severity
In the subgroup of cases that were transported, as shown in Table S4, calls with longer transport duration or where more time was spent on scene were statistically more likely to have a pain score recorded than calls with shorter duration or less time spent on scene. When compared to a transport duration of 10 min or less the likelihood of pain being recorded increased as the transport duration increased (11–30 min, OR1.21[95%CI1.18-1.25]; 31–60 min, OR1.74[95%CI1.68-1.79]; 61+min, OR2.11[95%CI1.98-2.24]). A similar, but weaker, association was observed as on-scene duration increased.
With regard to pain severity, as shown in Table S5, patients on calls with a transport duration exceeding ten minutes were likely to report increasing pain severity (11–30 min, OR1.15[95%CI1.09-1.21]; 31–60 min, OR1.43[95%CI1.35-1.51]; 61+mins, OR1.75[95%CI1.59-1.92]), while calls with a longer on-scene duration showed an increase in patients in severe pain only (0–10 min, 14.7%; 11–30 min, 16.8%; 31–60 min, 21.9%; 61+min 29.3%).
Secondary analysis
In addition to the analyses presented above, a secondary analysis was conducted for patients without a pain score to determine how many had pain documented as a symptom in the practitioner notes. Of the 74,206 records without a pain score 17,773 (24%) contained the word “pain” somewhere in the notes. A random sample of approximately 10% (n = 1700) of these was generated using the unique identifier and the sample function in R. For each of these 1,700 records the context in which the word pain occurred was checked by reading through the notes for each record and noting whether the word “pain” occurred in the context of the patient being in pain. In 1090 (64%), the word “pain” occurred in the context of the patient being in pain. This indicates that pain was a symptom in approximately 15% (n = 11130) of cases where no formal pain score assessment was documented. This figure does not include cases where the patient was in pain and no formal pain score assessment or reference to pain was recorded.
Discussion
In this study investigating the recording and assessment of pain in the prehospital setting, almost two thirds of patients (65%) had the result of a pain score assessment recorded. A documented pain score assessment rate of 65% of the entire patient population is at the high end of the range when compared to documented pain assessment rates in prehospital settings in other countries.18,23–25,29,30,36,37 In more than half of the cases with a pain score, the practitioner was documenting that the patient was not in pain.
This study found that 29.5% of patients had a documented pain score assessment indicating they were in some amount of pain and that almost 11% of all patients were in severe pain. This is an underestimate of the incidence of pain in the prehospital setting, as the secondary analysis found that many patients who did not have the result of a pain assessment documented were described elsewhere in the ePCR as having pain as a symptom (approximately 15% of those with no pain score, or 5.2% of the total patient cohort). Studies from other countries have found similar inconsistencies in how pain is assessed.36,37 This is problematic since pain assessment is considered a fundamental first step in providing good pain management. It is also the case that in the absence of good quality data on rates of pain assessment it is difficult to determine whether oligoanalgesia is in fact occurring at the rates indicated in the literature or whether poor record keeping is a factor in the perception that it is.
The results of regression modeling showed a statistically significant association between all independent variables and both of the outcome variables. By using the ORs to approximate effect sizes, it is apparent for most variables that the strength of association (effect size) with the outcome variables is small. Although the effect sizes for most variables are small, our findings in many cases broadly replicate those of other researchers. We found age differences indicating that children and older adults (75 + years) are less likely to have a pain score assessment documented than younger adults. This may be because it is more difficult to assess pain in these groups. We found that children and older adults who are in pain are less likely to be in a higher pain category than younger adults. This difference is particularly evident for older adults (75 + years). Our study also found sex differences in the incidence of pain with females slightly more likely to be in pain than males and also more likely to be in greater pain than males. While previous studies that looked at the influence of sex on acute pain in the prehospital setting have produced mixed findings, reviews of studies of qualitative sex differences in pain processing indicates support for the hypothesis that females are more sensitive to acute pain than males 38 and our findings are consistent with this.
Advanced paramedics can administer certain controlled drugs for severe pain that are not available to paramedics and hence may be more likely to attend patients in severe pain and are likely to be more motivated to record pain when they observe it. Findings with regard to the call outcome and pain severity indicated that patients who were transported were much more likely to be in greater pain than non-transported patients. However there was an increased likelihood of a pain assessment being carried out with non-transported patients when compared to transported patients even though the non-transported group may have also included some patients who refused assessment or treatment. As indicated in Figure 2, more than half of all patients who were not transported had a pain score of 0. It appears that practitioners are more likely to document the result of a pain score assessment for non-transported patients who are not in pain, than they are for transported patients who are not in pain.
There were some differences, mainly in the likelihood of a pain score being recorded, between patients in calls occurring within the boundaries of an urban settlement and patients in calls outside of any settlement boundary (rural) or within the boundaries of a rural settlement, indicating that there are proportionately less calls where pain is a symptom originating in urban areas compared to rural areas.
As shown in Figure 2, we also found a time of day effect similar to that found by other researchers, with patients on calls between midnight and 6am being less likely to have a pain score documented than patients on calls later in the day. It is unclear why this is the case but the same effect has been found in at least two other studies. For patients who had the results of a pain assessment documented, those seen on calls occurring between midnight and 6am are more likely to be in severe pain than patients on calls occurring later in the day.
The finding that lower priority calls are associated with a greater likelihood of a pain score being recorded, and with the patient being in greater pain than higher priority calls was somewhat unexpected. However, research with trauma patients indicates that patient acuity greatly impacts the ability to manage pain in the prehospital setting and that patients who are physiologically unstable appear much less likely to receive a pain assessment or pain treatment. 16 Also higher priority calls are more time-critical and our research indicates that shorter transport and on-scene times are associated with a lower likelihood of a pain score being recorded. This is likely to be because more time spent with the patient provides more opportunities for a pain score assessment to occur.
The cases in this retrospective review represent a national sample, containing almost all calls attended by NAS staff countrywide during the 2020 calendar year. While the effect sizes found for most variables are modest, at population level, small changes in practice are likely to have a significant impact. This means that the results from this study can be used to inform the organizational approach to improve recording of pain scores and to identify patient types and circumstances where pain may be more severe.
Our finding that approximately 15% of patients with no formal pain score assessment recorded had pain symptoms raises the question whether EMS should mandate pain scoring for all patients including patients with no pain to ensure accuracy of pain assessment. This “pertinent negative” has an impact on services understanding the incidence and severity of pain in the patient population and subsequent impact on overall assessment of practitioners’ clinical performance.
The limitations of our study are similar to those of other retrospective reviews. Firstly, the data used in the study was collected by practitioners during their day-to-day work and some items are missing or incomplete for various reasons. For most variables, the missing data category was associated with a lower likelihood of a pain score assessment being recorded indicating there may be common factors contributing to missing data across different variables. This finding suggests that services should report the extent and impact of missing data when reporting on clinical performance. Secondly our results may not be generalizable to other services. However, a number of our findings do replicate those of other researchers using different populations. Thirdly the research is descriptive and correlational and does not provide information about causality. Fourthly, data for patients attended by community paramedics or who are managed via alternative care pathways including Pathfinder, 39 or the Alternative Pre-hospital Pathway team, 40 were not available for this study. Fifthly the data for this study was recorded in 2020 during the COVID-19 pandemic. Studies have documented changes in health-seeking behavior and in EMS trends as a result of the pandemic. 41 Taken together these limitations indicate that the study findings should be interpreted with caution.
Conclusion
Our study, using real-world EMS data from a national database estimated the incidence of pain in the prehospital patient population at almost 30% with approximately 11% in severe pain. The data showed associations between routinely collected variables and the likelihood of pain recording and pain severity. We suggest that EMS agencies report the extent and impact of missing data when measuring clinical performance. In order to increase data accuracy, we further recommend that EMS agencies consider making the pain score assessment a mandatory requirement of their reporting for every patient.
Supplemental Material
sj-docx-1-pam-10.1177_27536386231162609 - Supplemental material for Factors associated with pain reporting and severity of pain in the prehospital setting
Supplemental material, sj-docx-1-pam-10.1177_27536386231162609 for Factors associated with pain reporting and severity of pain in the prehospital setting by Rory J Quinn, Siobhan Masterson, David Willis, David Hennelly, Conor Deasy and Cathal O'Donnell in Paramedicine
Footnotes
Declaration of Conflicting Interests
The author(s) declared no potential conflicts of interest with respect to the research, authorship, and/or publication of this article.
Funding
The author(s) received no financial support for the research, authorship, and/or publication of this article.
Supplemental material
Supplemental material for this article is available online.
References
Supplementary Material
Please find the following supplemental material available below.
For Open Access articles published under a Creative Commons License, all supplemental material carries the same license as the article it is associated with.
For non-Open Access articles published, all supplemental material carries a non-exclusive license, and permission requests for re-use of supplemental material or any part of supplemental material shall be sent directly to the copyright owner as specified in the copyright notice associated with the article.