
Abstract
Objective
Stroke is a devastating condition with significant societal and personal costs. Attempts to improve outcomes have increasingly focussed on improvements in prehospital care of these patients. This study aims to provide an epidemiologic profile of stroke presentations to an ambulance service.
Methods
A descriptive quantitative analysis of linked administrative and clinical patient data across prehospital, hospital, and death records from a two-year period (2016–2017), was used to profile the acute stroke cohort transported by ambulance in Queensland, Australia. The epidemiologic profile of patients and sub-type of stroke is presented.
Results
There were 17,603 presentations of suspected acute stroke in Queensland during the study period amongst 2,078,140 ambulance responses. A total of 11,578 patients had a confirmed diagnosis of stroke at the time of their final discharge. Of this population 49.8% suffered an Acute Ischaemic Stroke, 12.9% had intracerebral haemorrhage, 4.5% had subarachnoid haemorrhage and 32.8% were transient ischaemic attack. Of those with acute ischaemic stroke (AIS) 9.2% were due to a large vessel occlusion. The three-month stroke related fatality rate was 10%.
Conclusion
This study demonstrated a lower annual presentation rate of stroke, to an emergency ambulance service, than would be expected based on population studies while the overall mortality rate amongst this population was higher. The reasons for these differences warrant further investigation.
Introduction
Stroke has major global health and economic impacts and exhibits significant epidemiological variations across the world.1–5 The advent of new and emerging time-critical treatments for stroke6–10 have highlighted the importance of rapid and efficient paramedic involvement in the hyperacute phase of stroke care. Stroke incidence, prevalence, and mortality rates vary by region and are influenced by diverse factors such as age, sex, ethnicity, and socioeconomic status.
Stroke is defined as a neurologic deficit attributable to an acute focal injury of the central nervous system (CNS) secondary to a vascular event and includes cerebral infarction, intracerebral haemorrhage (ICH) and subarachnoid haemorrhage (SAH). 11 Stroke is typically divided into Haemorrhagic stroke (HS), which includes ICH and SAH and Acute Ischaemic Stroke (AIS) with the vast majority being ischaemic. AIS can involve occlusion to both large and small cerebral vessels. Transient ischaemic attack (TIA) is a transient neurologic deficit caused by focal ischaemia of the brain without acute infarction that typically resolve within 24 h. 12 Acute stroke requires urgent treatment with reperfusion interventions (thrombolysis and endovascular thrombectomy) recommended to occur within hours of symptoms onset and therefore population studies must include TIA. 13
Occlusions to large cerebral vessels are common (5%-30% of AIS) and are of specific interest for acute interventions.14–18 The most common sites of anterior circulation occlusion are unilateral middle cerebral artery (MCA) (49.8%), unilateral internal carotid artery (ICA) (24.1%) and tandem ICA/MCA (12.7%);. 19 In the posterior circulation most occlusive events occurred in the vertebral arteries followed by the basilar artery and posterior cerebral artery. 20 Paramedic assessment will be the first opportunity for large vessel occlusion (LVO) to be suspected and for patients to be triaged to a site capable of diagnosing and treating LVO with endovascular thrombectomy.
Globally, there is a higher incidence and noted poorer outcomes for stroke patient presenting in rural versus urban areas,21–23 for example, regional Australians were 19% more likely to suffer a stroke than those in metropolitan areas 21 and in a Canadian study there were noted increases in mortality when treated in rural versus urban facilities. 24
There are also differences in stroke prevalence based on socioeconomic status (SES) with a higher incidence seen amongst wealthier persons.25,26 An Australian study found however, that the rate of stroke amongst males in Australia is 1.21 times greater in low SES areas than in high SES areas and 1.27 times greater amongst females in those areas. 27 This disparity has been associated with poor management of modifiable risk factors (i.e., hypertension, diabetes, obesity, smoking, air pollution, alcohol use) which is likely due to poor clinical management and limited access to health care. In the last 30 years there has been a 11.3% decline in age-standardised stroke incidence rates worldwide with a more prominent reduction in stroke death rate of 34% amongst wealthier countries. 28
In Australia, stroke represents a significant but declining contributor to mortality. As of the latest available data, the age-standardized death rate from stroke was approximately 30 per 100,000 population. This decline in stroke mortality can be attributed to improved management strategies, including timely access to stroke units, advancements in thrombolytic therapies, and enhanced public awareness regarding risk factors. However, stroke remains a substantial cause of death and disability. Ongoing efforts in stroke prevention, early intervention, and rehabilitation are crucial to further reducing its mortality rate in the Australian context and align with the broader global initiative to combat the impact of this cerebrovascular condition.
The objective of this study was to describe the epidemiologic characteristics of stroke patients that enter the Queensland health system following paramedic care. Given the time critical nature of stroke care, paramedics play a pivotal role in their early intervention. It is critical that a population level understanding of the profile of stroke patients is taken in system and policy development.
Method
A retrospective review of all stroke presentations to a state-wide emergency ambulance service in Queensland, Australia between January 2016 to December 2017 was performed.
Setting
Queensland, Australia, is the second-largest state by area in the country. It covers approximately 1,852,642 square kilometres (714,686 square miles). Its vast size encompasses a wide range of landscapes, from coastal regions to arid outback areas, making it one of the most geographically diverse states in Australia. The Queensland health system is a complex and comprehensive healthcare network responsible for providing medical services to all residents of Queensland, Australia. It consists of a mix of public and private healthcare providers including a statewide emergency medical service. The Queensland Ambulance service (QAS) provides emergency response services, specialised transport and coordination of aeromedical services across the state. QAS has 290 response locations with approximately 4500 staff employed in various clinical and support roles.
Population/case selection
Subjects were included if they were over 18 years, had had a stroke or Transient Ischaemic Attack (TIA) and had been transported to any public hospital in Queensland, Australia by an ambulance. Stroke was determined by the International Classification of Disease version 10 Australian Modification (ICD CODES – I60-I69) discharge coding from the admitted patient record. This therefore includes Subarachnoid Haemorrhage (SAH), Ischaemic Stroke (IS) and Intracerebral Haemorrhage (ICH). TIA was defined using ICD Code G45. Patients were excluded if their stroke or TIA occurred during hospital admission.
Data sources
Data were extracted from routinely collected administrative data sets. Data sets underwent linkage, to follow the patient journey from ambulance contact through to discharge. Data sets included were the QAS electronic Ambulance Report Form (eARF), Queensland Hospital Admitted in-Patient Data Collection (QHAPDC), and the Queensland death registry. The following sections provide descriptions of these datasets.
Queensland ambulance service patient electronic ambulance report form
Statewide demographic and clinical information was retrieved from the eARF, which is the primary clinical record of ambulance care in Queensland.
Queensland hospital admitted in patient data collection
The Queensland Hospital Admitted in Patient Data Collection (QHAPDC) is a database of demographic data and clinical information about all patients who have been admitted as in-patients of any public Queensland Health Facility (n = 127), or a licensed private health facility (n = 49), or a private day surgery. The data set is primarily used to meet local, state, and federal reporting requirements. Information is coded by trained administrative staff using the standardised ICD-10-AM codes.
Death registry
Data were collected from the statewide register of all deaths in Queensland, which records the cause, date, and place of all deaths. The register is held by the Queensland Registrar-General.
Bias
Selection bias was minimised by the methodology of the study, which sourced clinical information from multiple record sources, and had statewide scope. Participants were included in the study if they fit the inclusion criteria and had none of the exclusion criteria. Sampling was sequential over the study period and was performed by the Statistical Services Branch (SSB) of Queensland Health.
Observation bias was minimised, as participant selection was via sequential sampling within the study period and was not performed by the authors.
Data linkage
The SSB of Queensland Health performed data linkage. Data linkage allows existing data to be more efficiently used to inform public health and clinical research. The SSB collects, processes, analyses, and disseminates the statistics that describe the health of the Queensland population and their use of health services. The Data Linkage Unit (DLU) is responsible for the governance and processing of all data linkage requests. Individual data linkage involves probabilistic matching using a combination of patient identifiers to link records within or across data sets. The linkage process used identifiable data, such as names, addresses, dates of birth, and admission details, for the sole purpose of linking. Once linkage was completed, the individuals and records were assigned a unique study identifier that was then provided to the researchers with the requested data set. This procedure ensured patients’ privacy and confidentiality.
Defining geographic Location
Location of presentations have been described using the Australian Bureau of statistics remoteness areas classification. The “Accessibility Remoteness Index of Australia” (ARIA) is a geographical index that is used to describe the difficulty of accessing services for people outside metropolitan areas. Remoteness is measured in terms of road network access in relation to five categories of service centres and 11,000 associated localities. The more remote an area is, the less access it has to service centres and, therefore, the higher its index of remoteness. This index then allocates locations to 5 remoteness areas – Major cities, inner regional, outer regional, remote and very remote. 29
Defining socioeconomic status
The “Socio-Economic Indicator for Areas” (SEIFA) ranks areas across Australia in terms of their various socioeconomic factors and is a method of measuring the social and economic wellbeing of a regions’ population. 29 It should be noted that SEIFA is a relative measure, meaning that a region is only disadvantaged relative to other areas. SEIFA has four indexes; the index of relative socioeconomic advantage and disadvantage (IRSAD) has been used for this analysis. There are 21 measures used to determine an IRSAD value, including income, internet connection, education and occupation, marital status, and disability requiring care. A low score indicates a relatively greater disadvantage (many households with low incomes, or many people in unskilled occupations), while a high score indicates relatively greater advantage (many households with a high income or many people with skilled occupations). In this study SEIFA was determined based on the postcode of incident location.
Analysis
Descriptive analysis of the linked data was undertaken to profile the epidemiologic characteristics of patients attended by ambulance paramedics for acute ischaemic stroke, haemorrhagic stroke and subarachnoid haemorrhage (e.g., age, sex, geographic location, socioeconomic status etc.).
Crude and age-adjusted incidence rates of stroke, stroke type and mortality were calculated for the full cohort and by gender. Mortality was reported up to 3 months post hospital discharge. Sex and age-specific incident rates across the two-year study period (per 100,000 population) were calculated using population data from the Australian Bureau of Statistics (ABS) census and predictions.
Univariate analysis was performed to determine relationships amongst variables and unless otherwise stated a p < 0.05 was considered significant. SPSS version 26 was used for analysis (version 26; IBM, New York, NY, USA).
Ethics
Ethics approval was provided by the Royal Brisbane and Women's Human Research Ethics Committee (RBWH HREC/17/QRBW/682). A waiver of consent was requested for the study, in line with the provisions of Guideline 2.3.10 of the National Statement of Ethical Conduct of Human Research (2007). This waiver of consent was considered justified by the RBWH HREC. Public Health Act approval was granted to access potentially re-identifiable health records for the purposes of this research (approval no. RD007275).
Missing data
Missing data was minimised during the linkage process or was expected to be missing at random. In cases of missing data related to age and gender, individual data sets were cross referenced to gain consensus on a true value, which was based on obtaining a matching value in two or more of the data sets. Table 1 describes the missing data across the variables in the study.
Missing data.
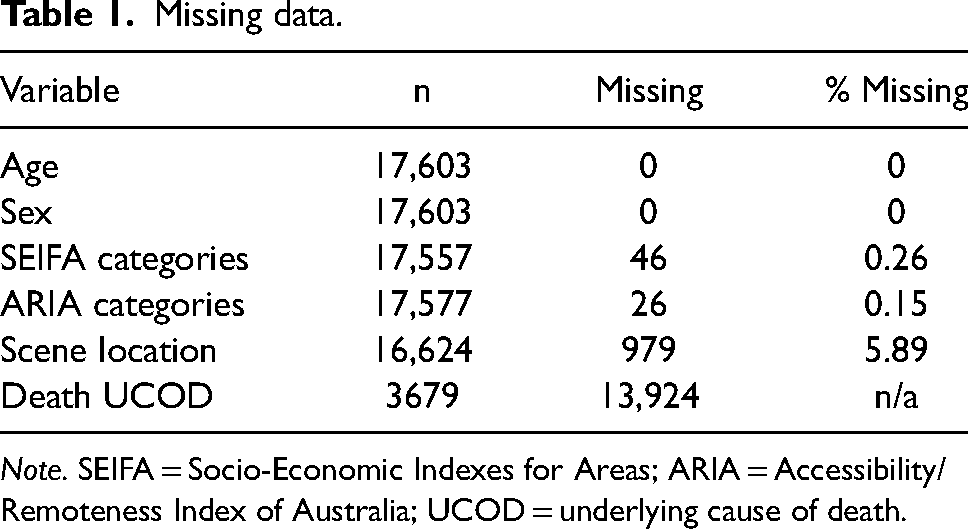
Note. SEIFA = Socio-Economic Indexes for Areas; ARIA = Accessibility/Remoteness Index of Australia; UCOD = underlying cause of death.
Results
Between 1st January 2016 and 31st December 2017 there were a total of 17,603 presentations of suspected stroke that were assessed and transported by paramedics in Queensland amongst a total of 2,078,140 ambulance responses. At hospital discharge a total of 11,578 from this group had a confirmed stroke or transient ischaemic stroke (TIA). The incidence of stroke sub-type was 49.8% (n = 5761) AIS, 12.9% (n = 1499) ICH, 4.5% (n = 526) SAH and 32.8% (n = 3792) TIA (Figure 1).
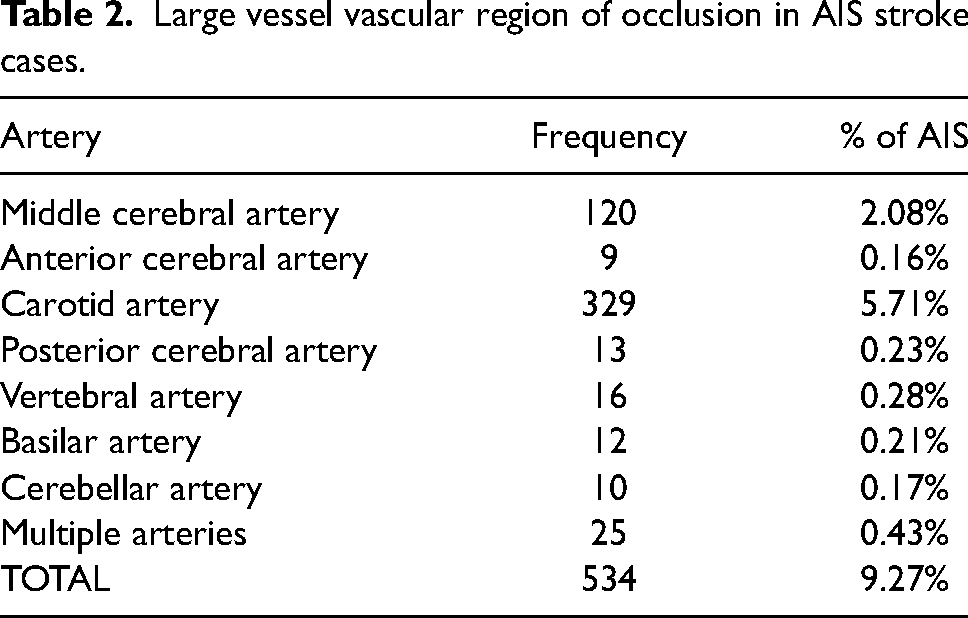
Data related to vessel imaging was available in 534 AIS patients (9.3%). The most common site of occlusion was the carotid arteries (5.71%) followed by the middle cerebral artery (2.08%). Occlusions to posterior large vessels (vertebral and basilar and arteries) occurred in just 0.49% (n = 28) of AIS (Table 2).
Large vessel vascular region of occlusion in AIS stroke cases.
Age and sex
The mean age in this cohort was 75 years (SD ± 12.73). Stroke incidence increased with age and males had a higher age standardised incidence rate across most age groups apart from the 35-39 (χ2 [1, N = 416] = 4.36, p = .039) and 40–44-year (χ2 [1, N = 416] = 4.636, p = .03) groups where a higher incidence was noted amongst females. Figure 2 shows the distribution of stroke cases by age and sex while table 3 describes the stroke sub-type across age groups.
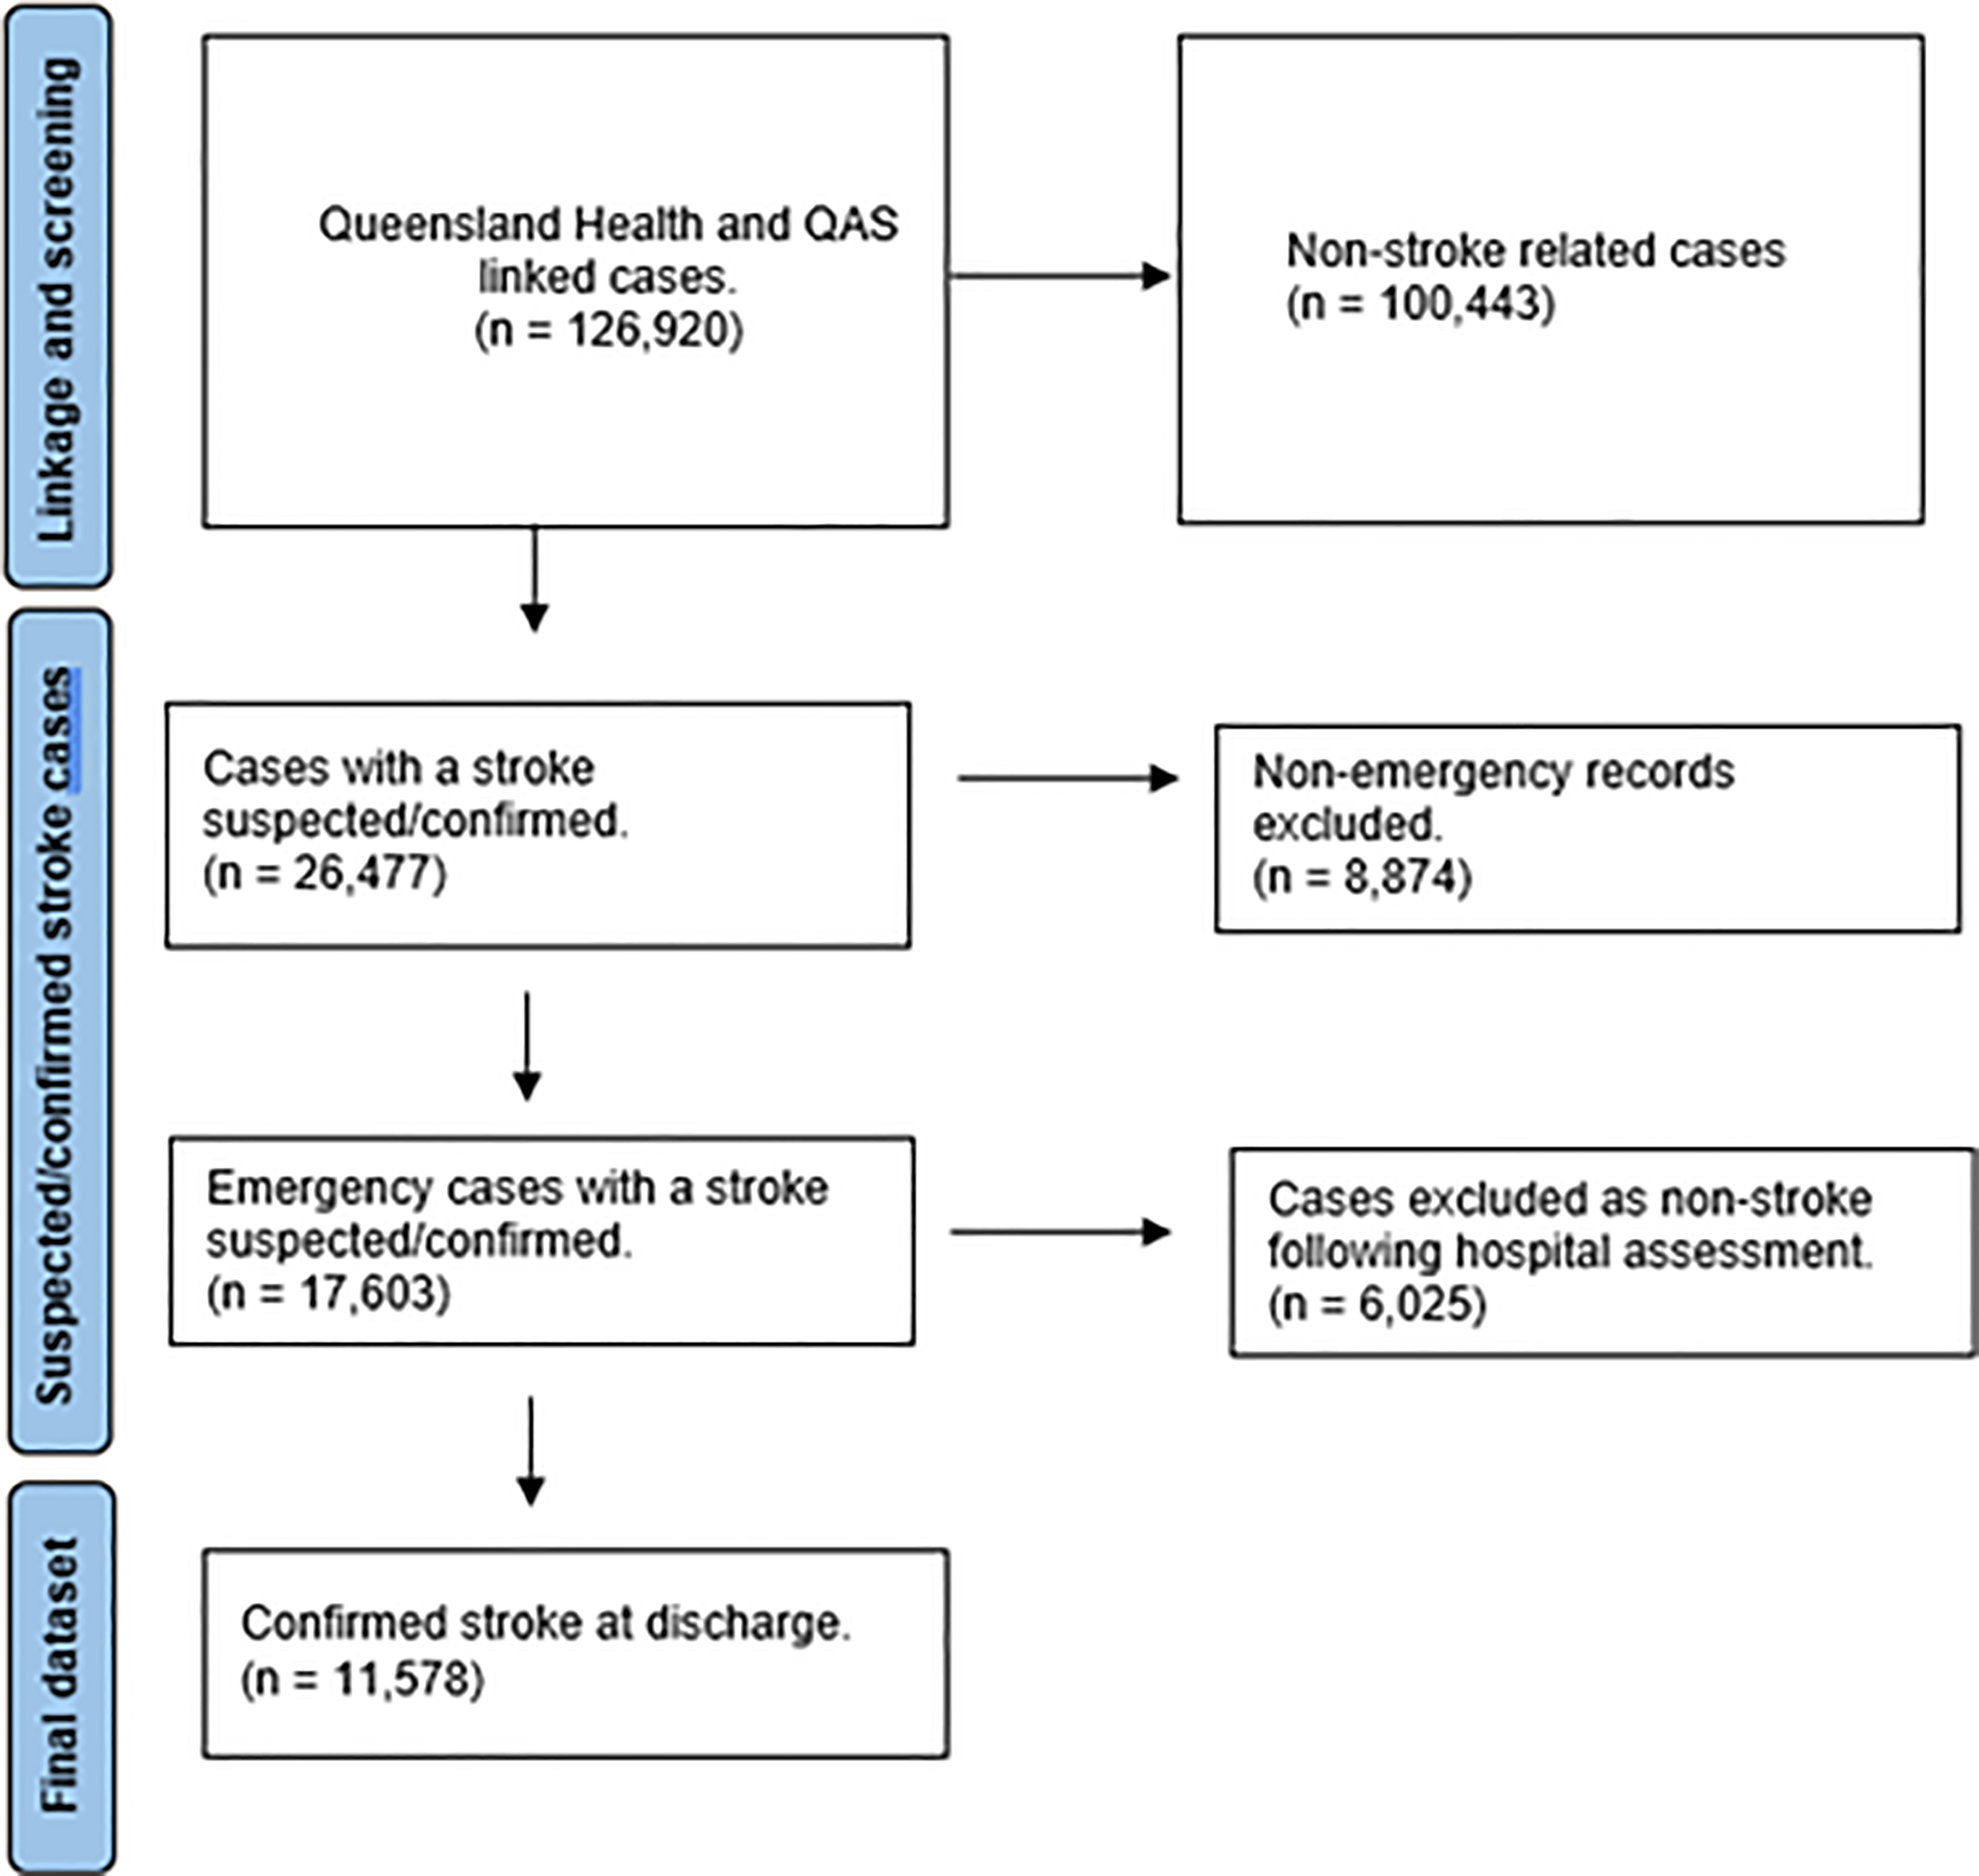
Case flow chart
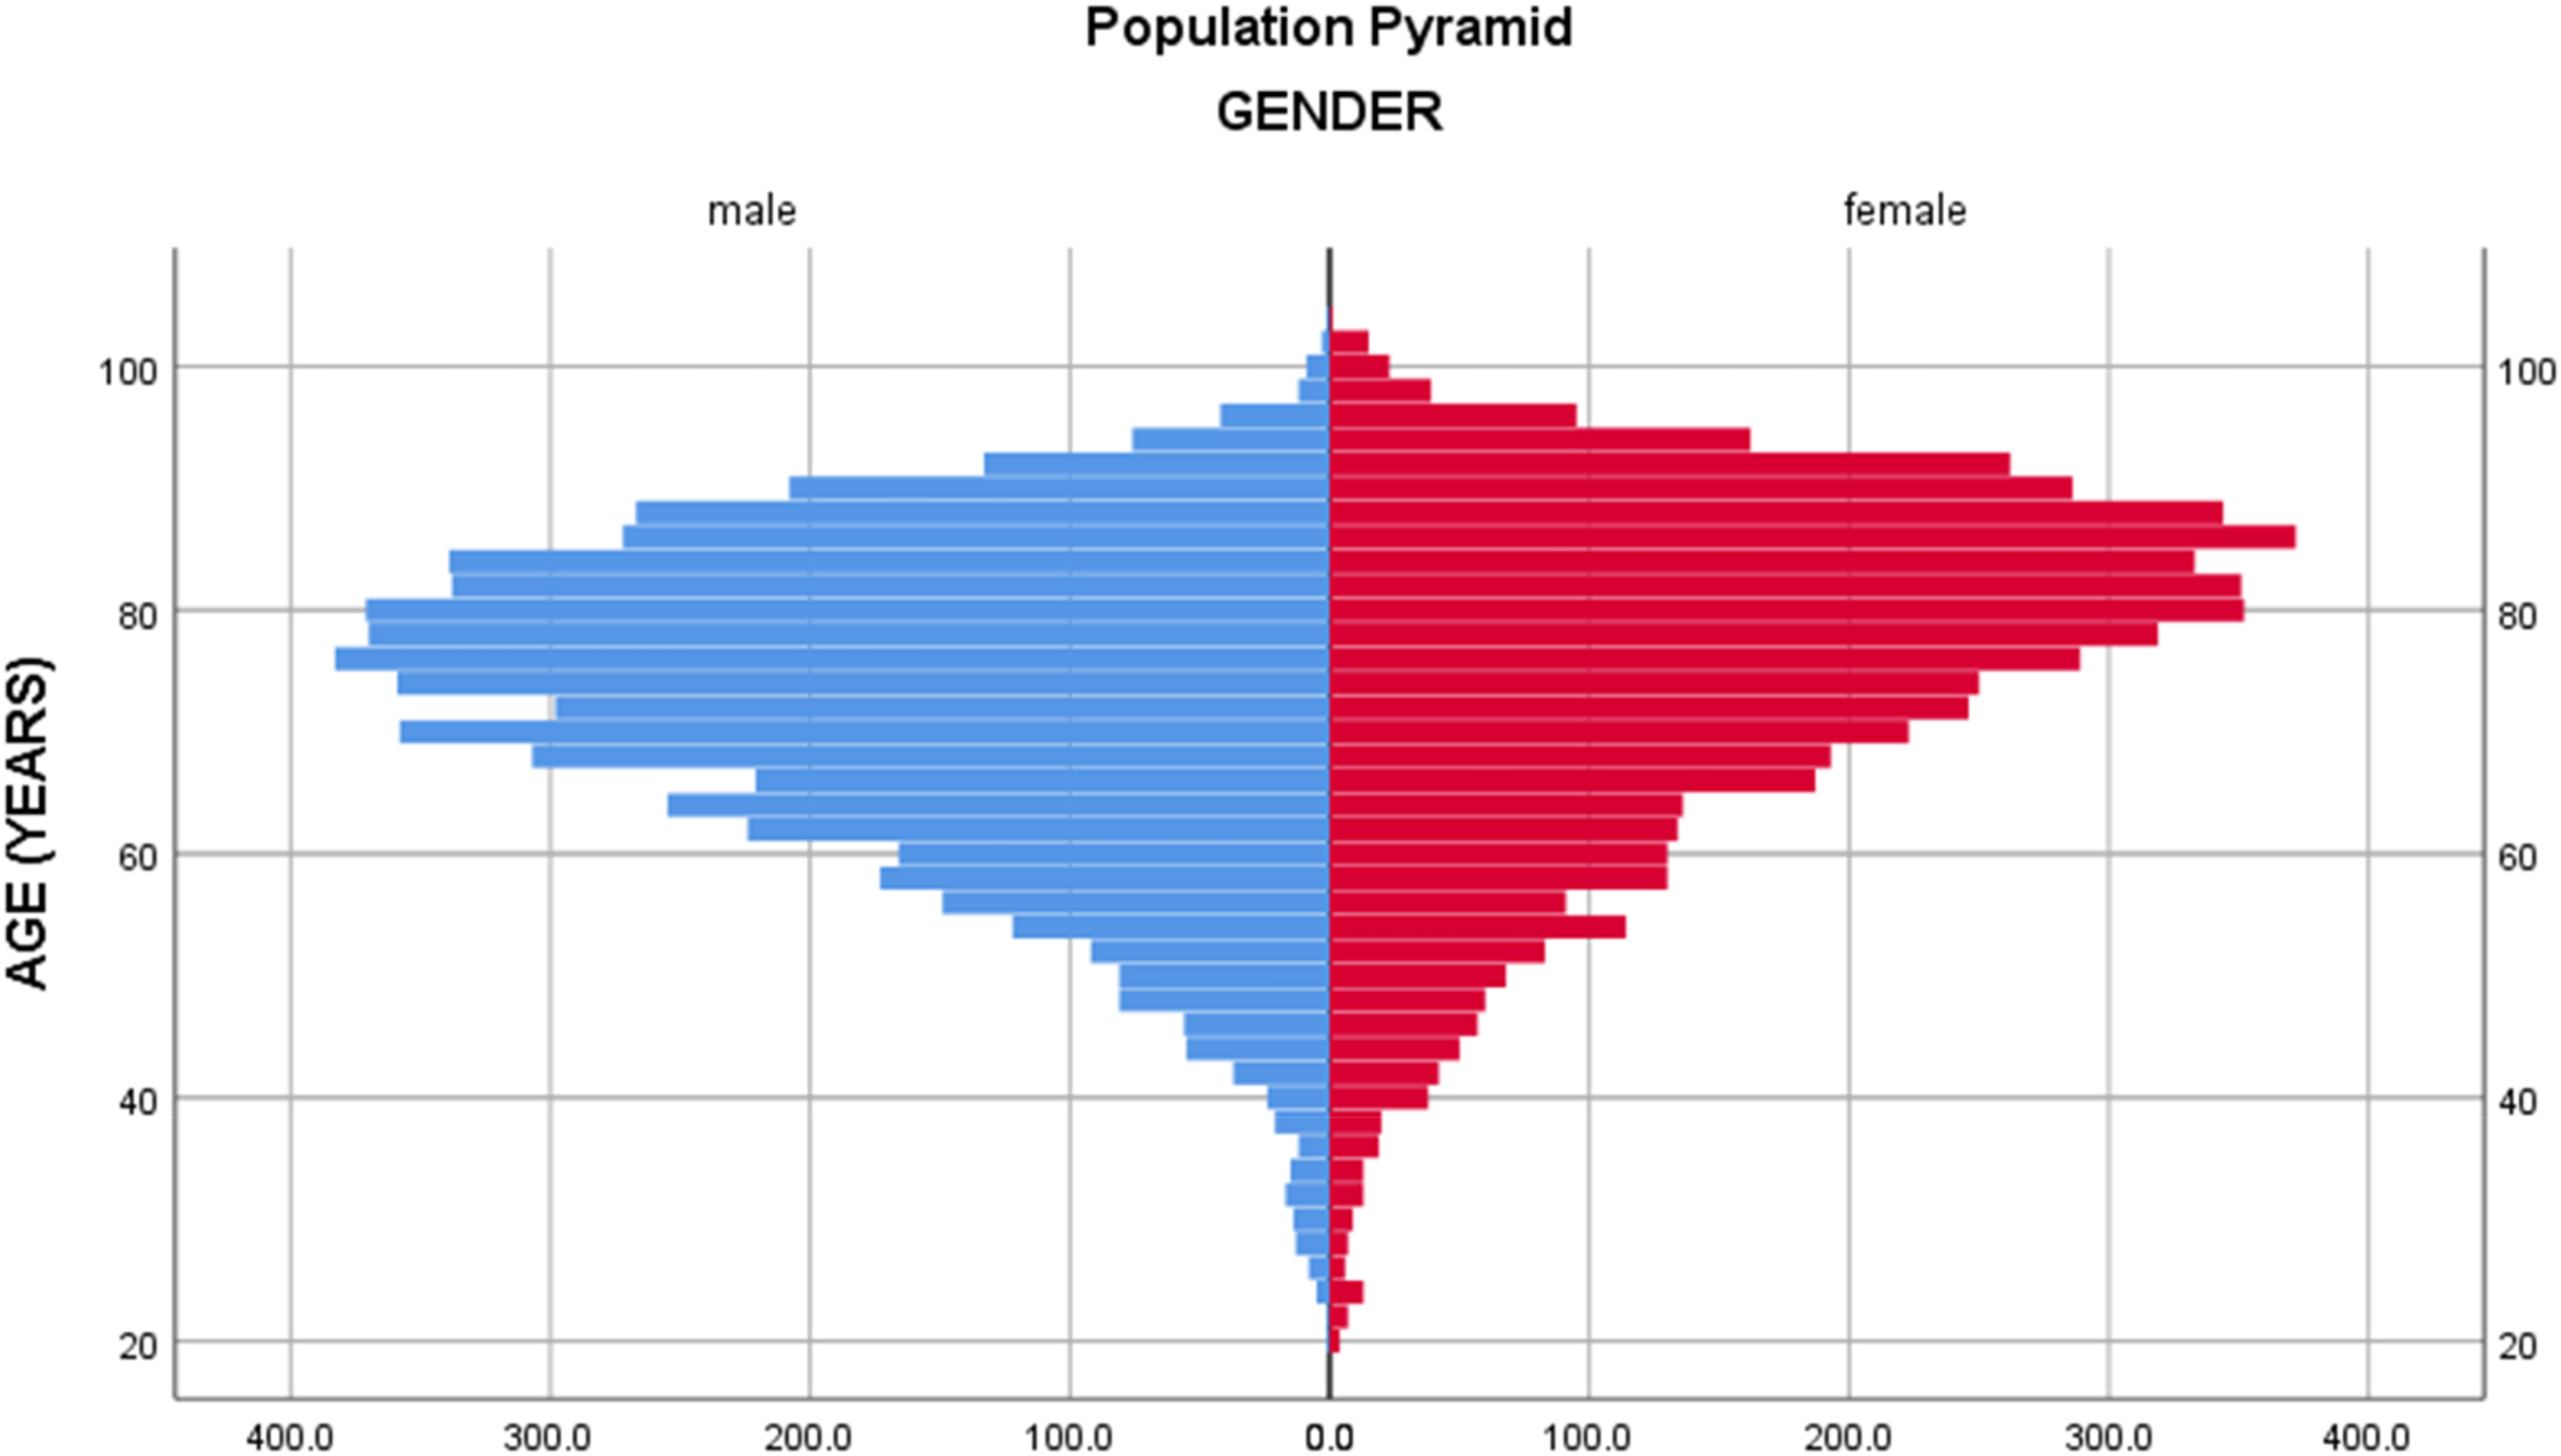
Distribution of stroke cases by age and gender
Incidence rates for stroke subtypes by age and sex.
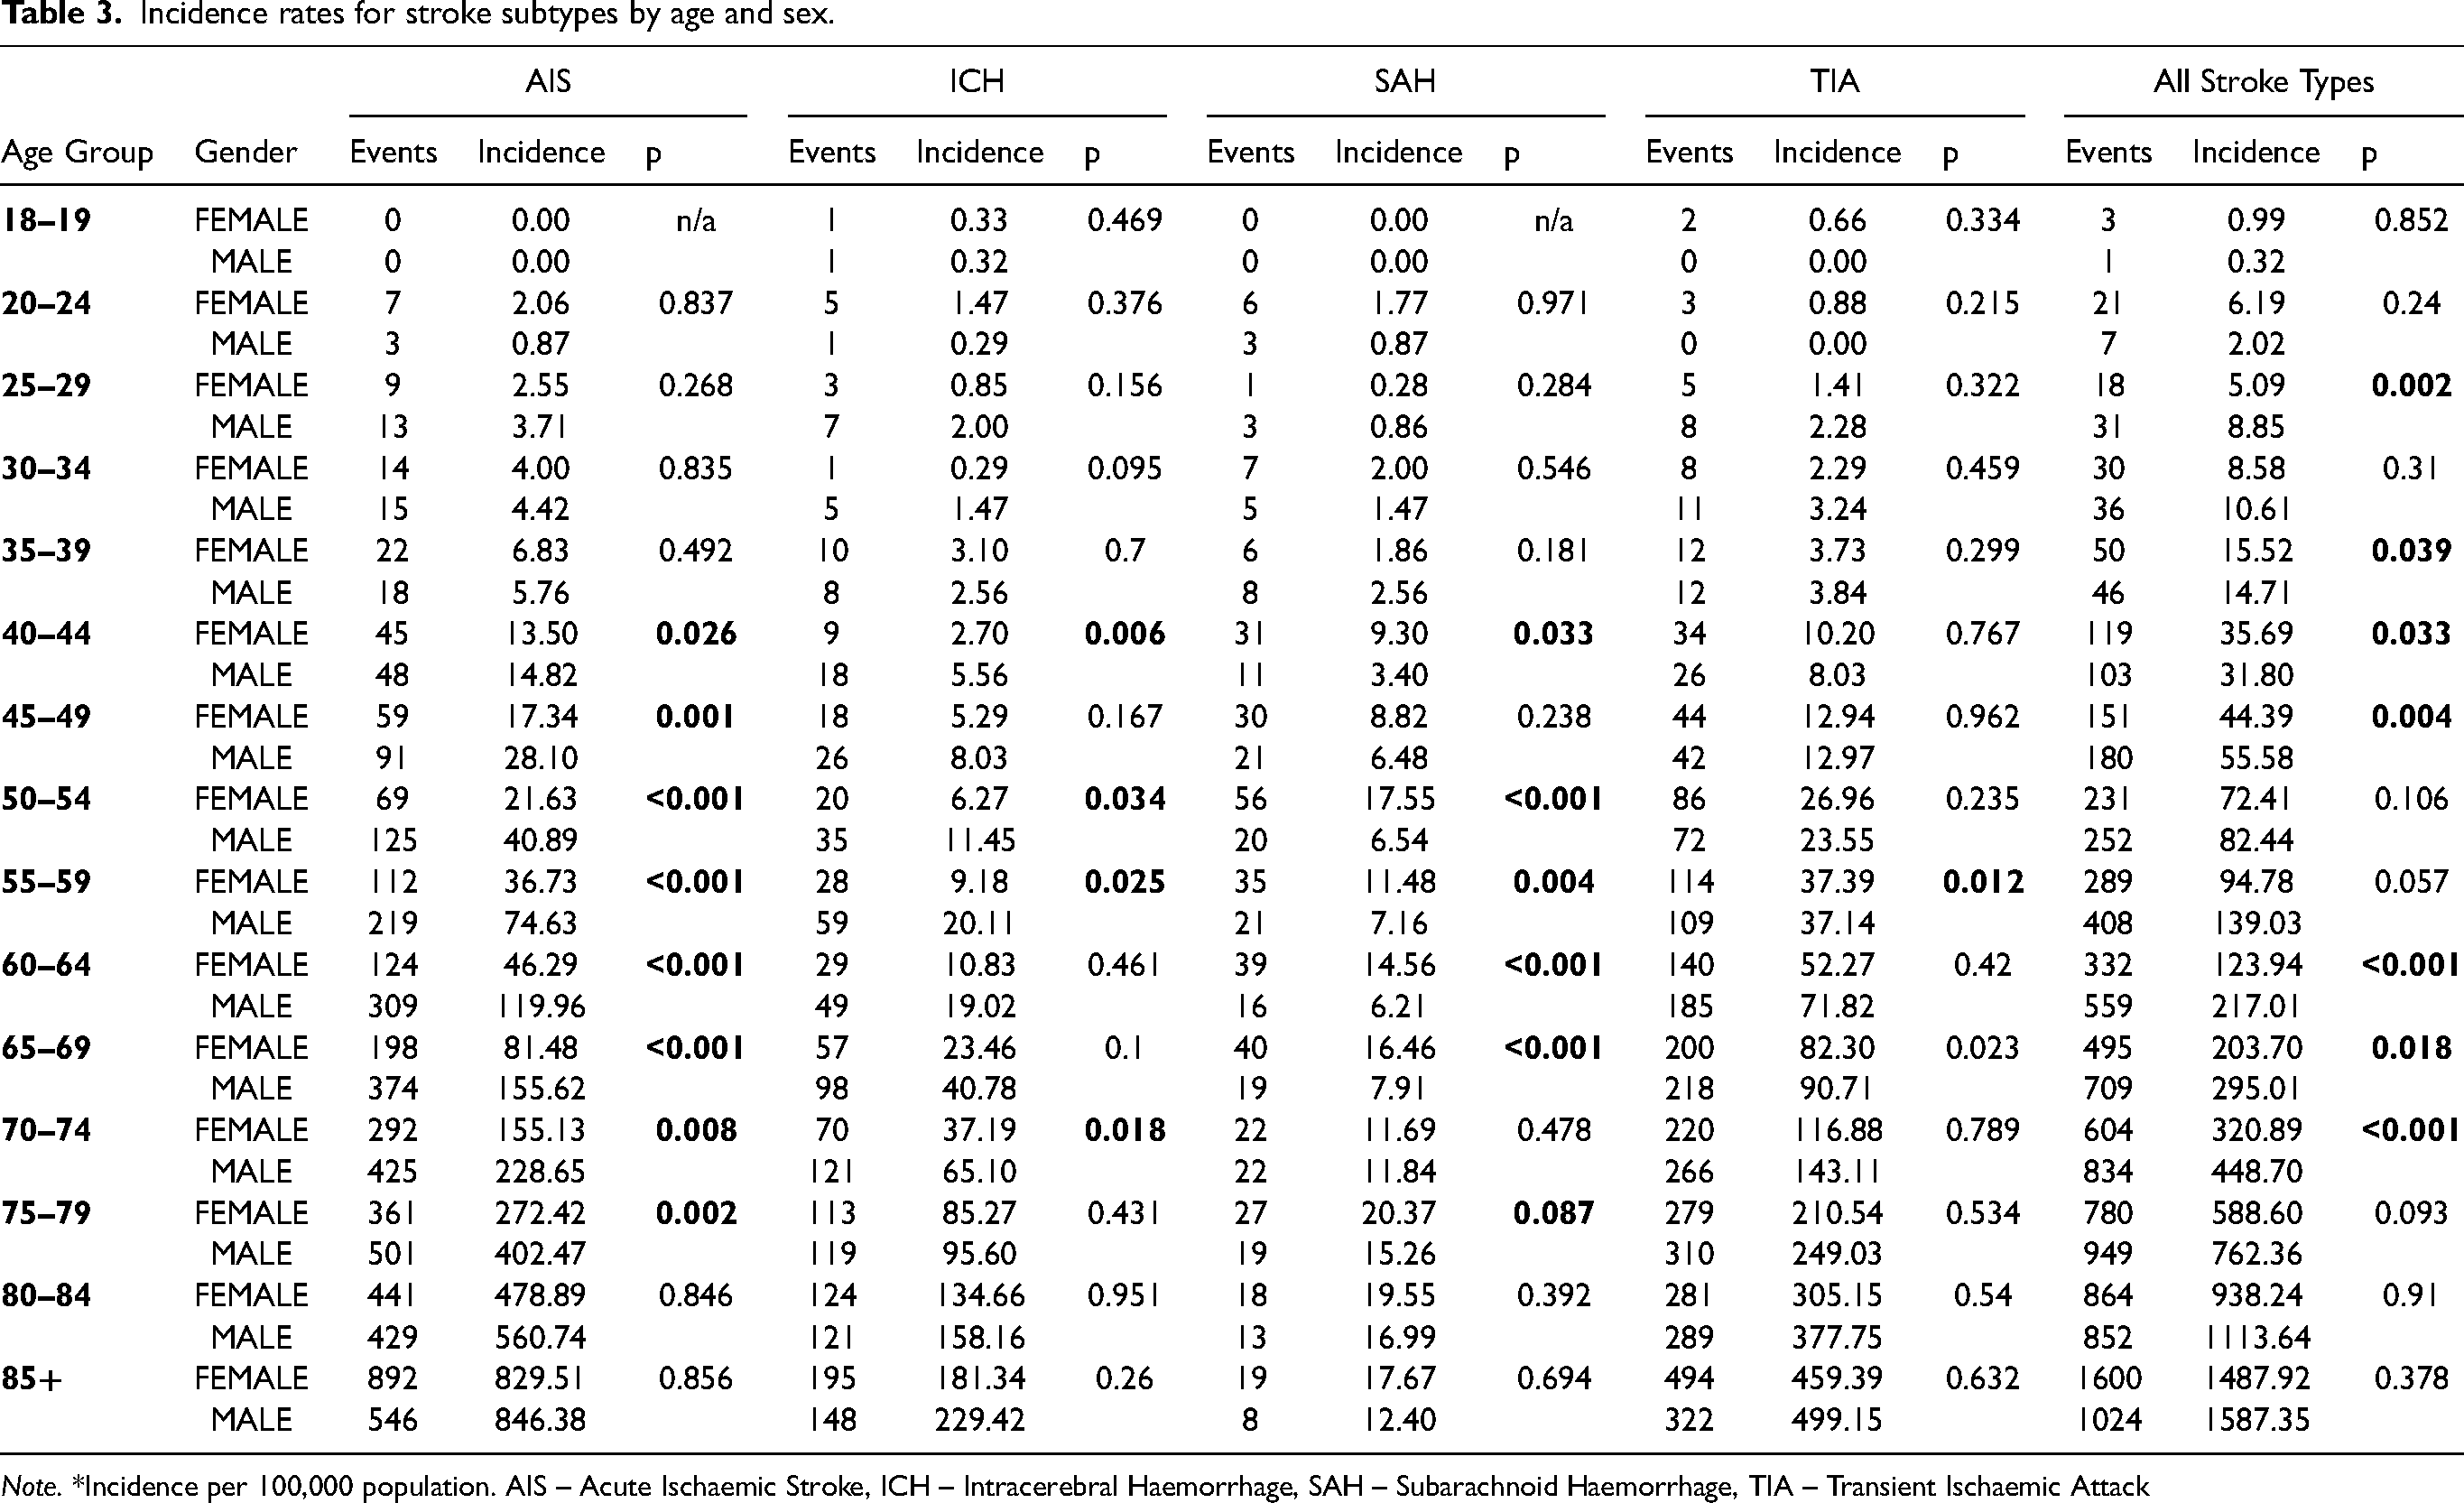
Note. *Incidence per 100,000 population. AIS – Acute Ischaemic Stroke, ICH – Intracerebral Haemorrhage, SAH – Subarachnoid Haemorrhage, TIA – Transient Ischaemic Attack
Socioeconomic status and geographic location
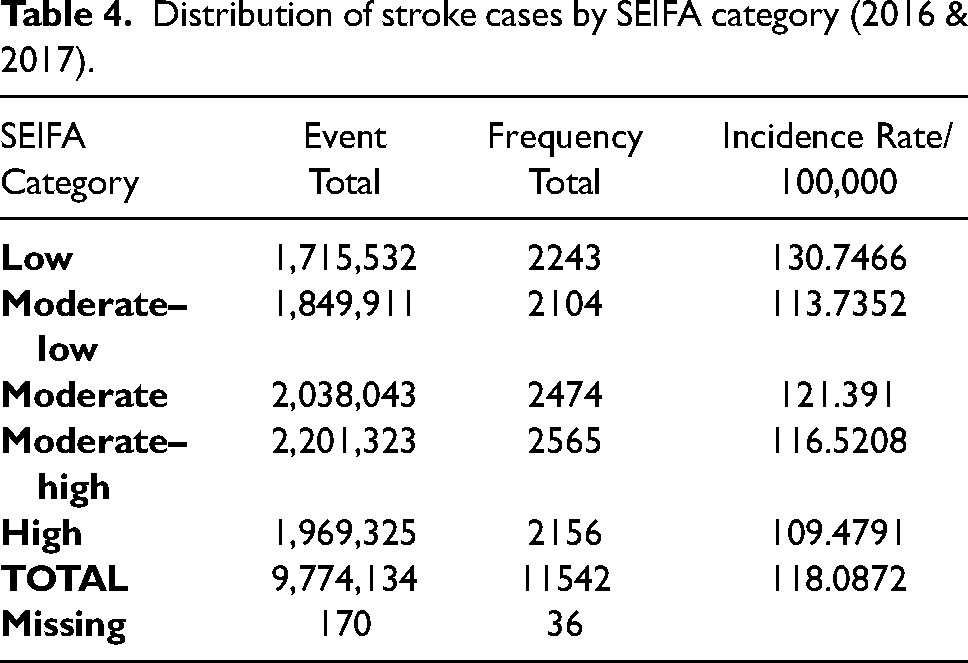
Table 4 shows the incidence rate of stroke by SEIFA category, which demonstrates a trend of a higher incidence in lower socioeconomic areas.
Distribution of stroke cases by SEIFA category (2016 & 2017).
Inner regional areas of Queensland had the highest incidence of stroke events and transporteds via ambulance at 151/100,000 compared to 107/100,000 in metropolitan areas but this did not reach statistically significance (p = .579). There was also no statistically significant difference between metropolitan areas and remote areas, (p = .136).
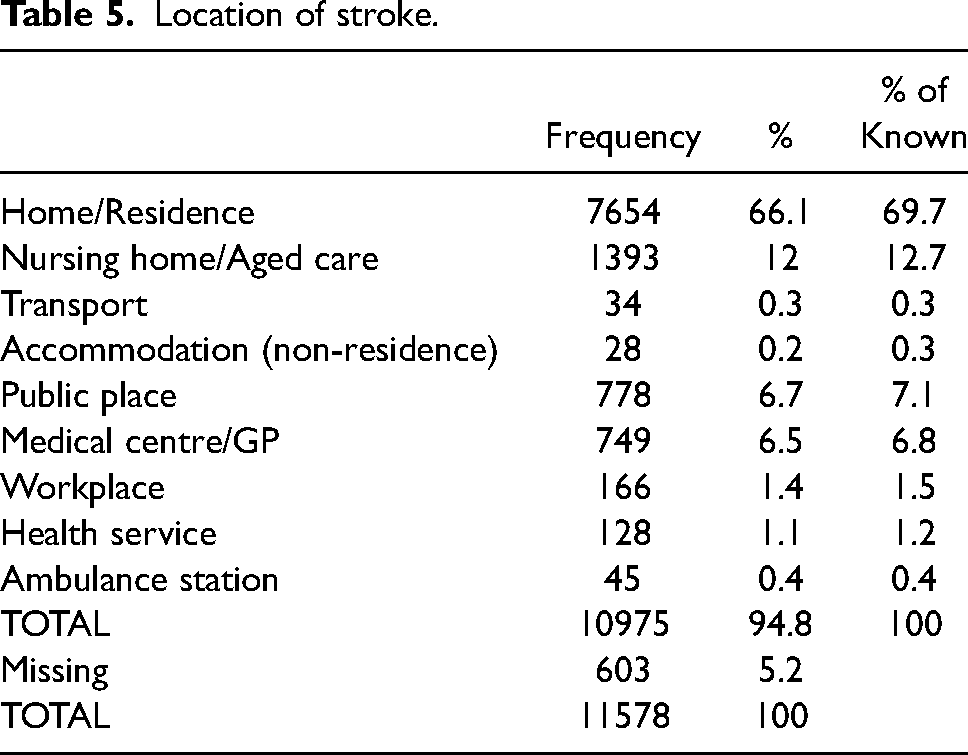
The scene location of stroke presentations is shown in table 5. Most cases attended by paramedics occurred in residential dwellings (69.7%) and aged care settings (12%). Relatively few stroke cases were attended by ambulance in public places (6.7%) and medical centres (6.5%).
Location of stroke.
Mortality from stroke
Stroke was determined to be the cause of death in 1561 persons during the study period. Of these cases the attributable stroke subtype was 825 AIS (52.9%), 499 ICH (31.9%) and 144 SAH (9.2%) related deaths while 93 (6%) were as a sequela of stroke. The case fatality rate at 3 months was highest for ICH (33.3%) and lowest for AIS (14.3%).
Discussion
There were 10,334 stroke admissions in Queensland during 2017 and an incidence of 207/100,000. 21 In our study during the same period (2017), 5771 patients transported by ambulance had a confirmed stroke at discharge with an incidence of 145/100,000. The international literature describes differences in the reported number of stroke patients presenting to emergency medical services with a US study showing ambulance service as the mode of arrival in just 53% of stroke admissions whereas a study in Victoria, Australia reported 71% arrival by ambulance.30,31 Our study indicates a much lower number of patients being transported by ambulance than in the Victorian study but more closely matches the US data. Given the universal nature of healthcare in Queensland we would have expected a higher rate of ambulance transport. This discrepancy warrants further investigation.
Our analysis shows that 89% of confirmed stroke cases transported by emergency ambulance were over 55 years of age with an overall incidence rate of 147/100,000. Patients presenting via ambulance were older in our cohort (75 years) compared to the general stroke population (71.7 years). This difference was not however statistically significant (p = 0.07). Males had an overall higher incidence of stroke at 155/100,000 and a higher incidence for all age groups except for the 35–44-year group. In this age group there was a statistically significantly increased female event rate for SAH (p = 0.033). Published literature in Australia has demonstrated that 60% of SAH admissions to hospital were female although most presentations (45%) were between 45 and 64 years. 32 The cause of these higher rates has yet to be fully elucidated however studies investigating the relationship between hormonal factors and risk of SAH indicate an independent aetiologic role for hormonal factors. 33
Although the frequency of LVO in our study population (9.27%) was consistent with other published data.14–18 we found a high proportion of LVO attributed to the carotid artery (5.71% of LVOs). This however should be interpreted with caution. Vessel imaging results including the anatomical location of carotid occlusions were not consistently recorded during the period of this study so some occlusions may have been in the external carotid artery. Conversely, we found a lower rate of MCA occlusion (2.08%) compared with other published data where MCA occlussions accounted for almost half of all LVO's. 34 This warrants further investigation given the focus of endovascular thrombectomy on occlusions in the internal carotid artery and MCA. Since 2017 it has become standard practice to include vessel imaging for all suspected AIS cases which will ensure availability of data for future research.
Fifty-seven percent of stroke presentations were in metropolitan areas and 40% in regional area's however, the incident rate was highest amongst persons in inner-regional areas (151/100,000) and lowest in remote areas (95/100,000). This incidence is in line with that reported by the stroke foundation where regional Australians are over-represented in areas with lower access to healthcare compared to metropolitan areas this, however, did not reach statistical significance in our dataset. 21 Stroke incidence in Australia exhibits notable disparities across regional, rural, and metropolitan areas. While most stroke cases occur in metropolitan regions due to higher population densities, the incidence is relatively higher in rural and regional areas when adjusted for population size. These disparities are attributed to variations in risk factors, healthcare access, and socioeconomic factors. Rural and remote regions often face challenges related to limited access to specialized stroke care, including thrombolytic therapy and stroke units. Addressing these geographic disparities in stroke incidence necessitates targeted prevention strategies, improved healthcare infrastructure, and enhanced public health initiatives in regional and rural areas of Australia.
In the our study population, there were 4460 deaths across 2016 and 2017, with 1561 having a cause attributed to stroke or its sequelae (Table 6). This equates to an incidence rate of 20 per 100,000 persons in Queensland. Death rates were higher for HS (33% of ICH) compared to AIS (14.3%). The rate of stroke-related fatalities at 3 months (10%, n = 1156) was higher in this study compared to others that have reported a death rate of 3.5–9.7%.35,36 Such a difference may represent a difference in the baseline stroke severity of those transported by ambulance, but this could not be ascertained by this analysis.
Cause of death.
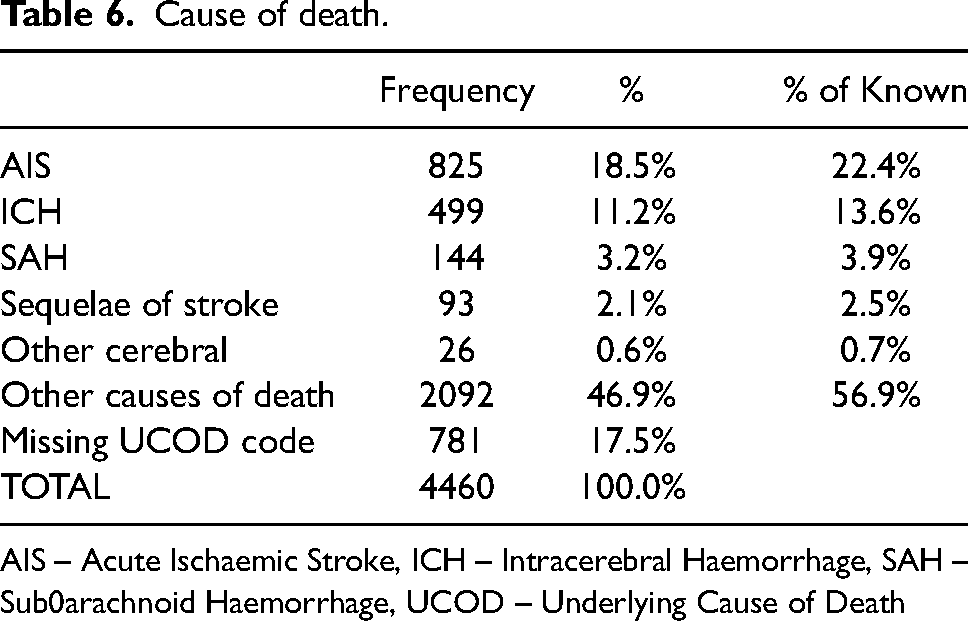
AIS – Acute Ischaemic Stroke, ICH – Intracerebral Haemorrhage, SAH – Sub0arachnoid Haemorrhage, UCOD – Underlying Cause of Death
Study limitations
There are limitations with the use of linked administrative data which does not routinely collect stroke severity data, nor outcome data except for death. The data is also limited in the prehospital phase of care as ambulance report forms are developed for patient care recording rather than research data, meaning many fields contain large sections of free text requiring manual data extraction. Vessel imaging was not routinely performed on all patients during the study period and therefore not all large vessel occlusions may have been captured. It was also not possible to extract occlusions to the ICA from all carotid artery occlusions.
Conclusion
In conclusion, our data indicates that the proportion of patients presenting with stroke and initially treated by paramedics in Queensland is much lower than would be expected based on published literature in similar ambulance systems, this warrants further investigation to determine if this is the case and determine the reasons for this. The mortality rate in our study was higher than the published mortality rate which may be due to more severe stroke syndromes resulting in ambulance attendance, future research should focus on identifying stroke severity at presentation to ambulance services and emergency departments to determine if this is the case. Although our data indicated a higher incidence of stroke presentations to the ambulance service in inner regional areas this did not meet statistical significance.
Footnotes
Acknowledgements
We would like to thank the Queensland Ambulance Service for their support of this body of work. Dr Denise Bunting for statistical oversight and support.
Conflict of interest
No conflicts of interest are reported.
Ethics
The study was approved by an the Royal Brisbane and Womens Human Research Ethics Committee (HREC/17/QRBW/682).
Funding
The authors were awarded a Kenneth James McPherson foundation grant to support this study.
Appendix
STROBE Statement—checklist of items that should be included in reports of observational studies