
Abstract
Hydropower is the leading source of renewable energy and plays a critical role in stabilizing power systems by balancing fluctuations in intermittent and inflexible energy sources. This study evaluated hydropower site suitability in the Central African Power Pool (CAPP) using datasets from CHIRPS (annual rainfall averages from 1981 to 2020), ESRI, SRTM DEM (30 arc-seconds (∼1 km) spatial resolution), FAO, and UNESCO/ISRIC to analyze slope, drainage density, flow accumulation, and related physical parameters. Data preprocessing in ArcGIS Pro ensured spatial consistency by standardizing and resampling all datasets to a uniform spatial resolution of 30 m × 30 m, normalizing, and reclassifying parameters into five suitability categories (1–5) based on predefined thresholds, such as drainage density ranges \(0.0–0.035 km/km2 for low density), slope intervals (0°–2.14° for gentle slopes), and soil types relevant to hydropower development.
The Analytical Hierarchy Process (AHP) structured hydropower suitability evaluation as a multi-criteria decision-making framework, wherein key parameters, including drainage density, slope, elevation, soil type, rainfall, and geology, were compared pairwise to determine their relative importance. Consistency checks validated the logical coherence of these comparisons. Subsequently, a weighted overlay combined these criteria spatially, producing a composite suitability map. Eligibility criteria for hydropower development were defined by reclassifying each parameter into the five suitability classes based on thresholds indicative of hydropower potential.
The integrated results indicate that most of the CAPP region exhibits physical and environmental characteristics favorable for hydropower development. Low drainage density and gentle slopes coincide with loamy soils and tree cover, supporting hydropower viability. Elevation profiles and dendritic flow patterns further reinforce suitability, while stable geological formations, mainly undivided Precambrian rocks, underpin foundational stability. Rainfall variability and land use patterns complement these factors, culminating in approximately 74.07% of the CAPP area being classified as moderately to highly suitable for hydropower development. The dominant determining factors were Drainage Density (weight: 0.20), Flow Accumulation (0.18), and Elevation (0.15). These high-weight criteria, combined with favorable loamy soil textures and stable geological formations, represent the primary drivers of suitability in the region.
Keywords
Introduction
Hydropower is the foremost pillar of renewable energy and the cornerstone of the global power generation landscape. Its prominence was evident in 2008, when it contributed a substantial 3288.0 terawatt-hours (TWh) (Mitigation, 2011) to the global electricity output, constituting just over 16.0% of overall electricity production. However, its potential extends beyond these figures, with an estimated annual technical capacity exceeding 16,400.0 TWh.
Hydropower exhibits inherent storage capacity and rapid response characteristics, making it invaluable for navigating sudden ebbs and flows in electricity demand. Its adaptability aids in balancing the intermittency of less-flexible energy sources and variable renewables, ensuring a stable and reliable energy grid. Despite its strengths, only approximately 19.0% of its global potential is currently deployed, signaling vast untapped reservoirs awaiting exploration (Essentials, 2010).
Nations actively engaged in hydropower development have capitalized approximately 60.0% of their potential in their energy portfolios. However, for numerous other countries, the promise of untapped hydropower potential remains a critical opportunity, offering a pathway toward energy independence and sustainability.
Beyond electricity generation, hydropower plants serve as multifunctional assets, providing indispensable services such as flood control, irrigation, and potable water reservoirs. This versatility underscores hydropower's pivotal role in meeting energy demands, enhancing environmental resilience, and managing water resources. (IRENA, 2015), China has emerged as a leader in hydropower deployment, adding over 15.0 gigawatts (GW) in 2012 alone, setting the pace for global expansion.
IRENA (Simonov, 2021) revealed a burgeoning renewable energy capacity, with 2020 witnessing a remarkable surge in alternative energy generation capacity. It soared by 261.0 GW, marking a 10.3% increase and reaching 2799.0 GW. Solar and wind energy accounted for the largest share of this growth, representing 91.0% of all net additions, with solar capacity reaching 714.0 GW and wind energy totaling 733.0 GW.
Despite these strides, the relative growth of hydropower has been modest, with an increase of only 20.0–21.0 GW, constituting a mere 2.0% rise. Global conventional hydropower now stands at 1211.0 GW, excluding an additional 121.0 GW attributed to pure pumped-storage hydropower. Notably, the increase in hydropower capacity in 2020 accounted for less than 8.0% of all renewable energy additions, indicating a relative decline over the past seven years. Africa harnesses vast renewable resources, including hydropower, making it a key participant in the worldwide shift toward renewable energy. By strategically developing wind energy initiatives and implementing targeted policies aimed at electrifying rural areas, Africa has the potential to forge a more sustainable path forward, benefiting its inhabitants and contributing significantly to the global renewable energy arena.
On April 12, 2003, a power pool (CAPP) serving the Economic Community of Central African States (ECCAS) was founded in Brazzaville. It represents a fledgling yet crucial subregional entity (CAPP, 2024). The CAPP plays a pivotal role in facilitating technical evaluations of proposals for power distribution among ECCAS member nations. Its mandate encompasses power-related policies, furthering research, and overseeing the development of shared assets, including power exchanges and associated services within the ECCAS region. The institution advances regional energy management and exchange mechanisms in Central Africa. It aspires to become a significant participant in regional energy sector collaboration. At the core of its mission lies the ambition to leverage the abundant hydroelectric potential of Central Africa, estimated at over 650,000.0 gigawatt-hours (GWh), constituting 53.0% of the entire African potential. Despite the recognized potential and existing initiatives, a comprehensive spatial assessment of hydropower resources within the ECCAS region remains lacking in the literature. This gap limits strategic planning and optimal resource allocation for sustainable energy development.
Therefore, this study aims to:
Conduct a detailed spatial analysis of hydropower potential in the ECCAS region using ArcGIS. Apply the Analytical Hierarchy Process (AHP) combined with weighted overlay techniques to prioritize suitable sites for hydropower development. Provide actionable insights to inform regional energy policy and infrastructure planning. The methodology employed integrates geospatial analysis with multi-criteria decision-making tools to enhance precision in identifying viable hydropower locations.
The article is structured as follows: Section 2 reviews relevant literature and existing hydropower assessments; Section 3 details the methodology, including data sources and analytical techniques; Section 4 presents the results of the spatial analysis and site prioritization; Section 5 discusses implications for regional energy planning; and Section 6 concludes with recommendations and future research directions.
Related work
Humududu and Killingtveit (2016) assessed the repercussions of climate change on water assets and hydropower capacity within the watershed of the Kwanza River. The basin shares boundaries with the southern and southeastern catchments of the Cubango and Cuito Rivers. The area stretches across an extensive 157,000.0 km2. The Kwanza River has a length of approximately 100.0 km. It originated in the Bie district of the Angolan highlands. Its elevation surpasses 1500.0 m above sea level (ASL). The Kwanza drainage basin experiences moderate to high rainfall. Monthly average rainfall peak from March to June. The basin has witnessed extreme annual rainfall. The best-recorded rainfall in Cambambe was 1490.0 mm, while the lowest was 828.0 mm. In the dry season, typically from July to October, the rainfall diminishes significantly.
The authors of (Humududu and Killingtveit, 2016) signified that the Kwanza catchment receives approximately 900.0 mm of annual precipitation, with the lowest mean rainfall of 400.0 mm and a maximum of 1400.0 mm in the mountains. The Kwanza hydropower system comprises the Capanda and Cambambe operational power plants. Capanda Hydro boasts a 4450.0 million m3 reserve capacity, 520.0 MW installed capacity, 640.0 m3/s flow rate, and 84.0 m head. The downstream Cambambe hydropower plant features a 20.0 million m3 reserve, 260.0 MW installed capacity, 670.0 m3/s flow rate, and 51.0 m head. The Nhangue hydropower plant presents another reservoir with a flow rate of 3300 million m3, 1325.0 MW installed capacity, 625.0 m3/s flow rate, and 193.0 m head. Furthermore, the planned Cacula Cabasa hydropower plant has a 1025.0 MW installed capacity, a 191.0 m head, and 600.0 m3/s flow rate.
The report (Liu et al., 2013) shows that Angola's hydropower potential emerges as a compelling facet of its energy landscape, with a technical capacity reaching approximately 80.0 TWh per year, of which an economically viable segment stands at 72.0 TWh per year, equivalent to 18.0 GW of power generation capacity. The 2011 World Atlas and Industry Guide delineates specific provinces within Angola deemed suitable for micro hydropower projects, including Bié, Bengo, Benguela, Cabinda, Cunene, Huambo, Huíla, and Kuando Kubango.
As outlined in (MIGA, 2014), Laúca is Angola's largest hydroelectric power plant and the second largest hydroelectric power plant in Africa. Situated approximately 300.0 kilometers from the capital city of Luanda, on the border between the provinces of Kuanza-Norte and Malanje. The constructed dam gives rise to a sprawling reservoir spanning nearly 200.0 km2 and boasting a staggering capacity of approximately 5.5 billion m3 of water. The technical specifications of Laúca are as follows: total output capacity reaching an impressive 2070.0 megawatts (MW). The head or height difference was 200.0 m for the principal units and 118.0 m for the eco-friendly component. Impressively, Laúca boasts an average annual energy production of 8640.0 gigawatt-hours (GWh).
In the analysis presented in (Manirakiza et al., 2021), the highlands house the Rwegura catchment, a region characterized by elevations ranging from 1800.0 m to 2650.0 m above sea level. The catchment area was 232.0 km2. This study employed rigorous methodologies to assess the hydrological dynamics within a specified locale. Leveraging Mann-Kendall's (MK) non-parametric test and Pettitt's test for breakpoint detection, the investigation employs a regression-based statistical model to forecast streamflow patterns. The results indicate a discernible decline in rainfall across the northern highlands, juxtaposed with a pervasive rise in temperatures observed throughout the study area. Within the Rwegura catchment, 22.8 m3/s was the lowest flow rate at the 90.0% threshold. Moreover, projections concerning vagaries in hydropower capability paint a sobering picture, with anticipated decreases of 11.0% and 16.0% forecasted by 2050 over the Rwegura catchment.
The objective of (MUSAMBI, 2018) is to develop a straightforward, feasible, and dependable micro-hydropower (MHP) system capable of supplying electricity to rural areas in Burundi. Central to achieving this goal includes two key factors: gross head and water flow rate. Accordingly, the Southwest region was identified as an ideal location because of its hilly terrain and small rivers, facilitating the implementation of micro-hydropower infrastructure. It employs a GPS unit with sufficient accuracy to ascertain the altitude differential between the penstock intake and power plant. The intake point was at an elevation of 1510.0 m above sea level. The power plant is at 1426.0 m and has an 84.0 m available gross head. Comprehensive field surveys provided the essential site characteristics necessary for MHP system design. The feasibility study utilizing RET screen analysis software yielded notable results: 84.0 m gross head and 0.0736 m3/s available flow rate. These parameters resulted in an anticipated power output of 36.5 kW.
In another article (Signe et al., 2017), a straightforward approach to conducting feasibility studies for Micro Hydroelectric Power Plant (MHPP) projects was elucidated, with particular emphasis on the KEMKEN MHPP project. The chosen site for the study was the KEMKEN water body, situated on a river in Banéghang district, Cameroon. Precise measurements of The KEMKEN hydro-aggregate head measured 10.0 ± 1.0 meters. A hydrological study of the location drew upon the findings of a previous study, leveraging the existing data to inform the assessment. Notably, the river under consideration is the same as that which feeds the Metchié Waterfall. Analysis reveals an average annual 9.3 m3/s flow rate and 12.5 m3/s flow rates occurring 30.0% during the year.
Nonki et al. (2021) analyzed the climatic change in the hydropower capability of the Lagdo dam, situated within the Benue River watershed in Northern Cameroon. Central to this analysis is the use of the HBV-Light hydrological design to simulate streamflow dynamics. This sophisticated approach enables researchers to gain insight into the potential effects of climate change on water resources and subsequent hydropower generation. The study reveals that stream flows, with an average ranging between 2000.0 and 2500.0 m3/s, serve as a crucial determinant in assessing hydropower potential.
Kidmo et al. (2021) assessed the hydropower potential across seven distinct locations in the Economic Region of Central Africa (ERoC), shedding light on the diverse hydrological characteristics and mean flow rates prevalent within each river basin. This study delves into the intricate interplay of hydrological variables, including rainfall patterns, mean flow rates, and volume contributions, to elucidate the hydropower prospects of selected locales. Rainfall measurements range from 1550.0 to 1650.0 mm/yr, while volume inputs exhibit substantial variability, spanning from 1816.0 hm3/yr at Colomines to an impressive 11,256.0 hm3/yr at Nki Falls. Notably, catchment areas differed significantly across the sites, with Colomines boasting the smallest catchment area at 3820.0 km2, juxtaposed against Nki Falls, which commands the largest catchment area at 31,550.0 km2. The hydropower distribution sites were within distinct river basins. Both Colomines and Zoukoumanbale are located within the Kadey River watershed. Ngoila, Nki Falls, and Zoulabot nestle within the Dja River watershed, and Bangue and Yenga are in the Boumba River watershed. Moreover, the flow rates for each site are delineated, showcasing the hydrodynamic diversity across the selected locations: Zoukoumanbale (58.0 m3/s), Colomines (55.0 m3/s), Zoulabot (264.0 m3/s), Nki Falls (339.0 m3/s), Yenga (261.0 m3/s), Bangue (152.0 m3/s), and Ngoila (307.0 m3/s).
Alsdorf et al. (2016) provided a comprehensive review of published findings on the hydrology of the Congo Basin, offering a nuanced overview of historic and ongoing research endeavors within the region. Notably, the study sheds light on the intricate precipitation patterns prevalent across the basin, with annual rainfall averaging approximately 1900.0 mm/yr along an east-west trajectory, gradually tapering off towards the northern and southern extents to approximately 1100.0 mm/yr. Further insights gleaned from historic studies employing lysimeters, pans, and modeling techniques indicate minimal variation in annual potential evapotranspiration rates, hovering between 1100.0 and 1200.0 mm/yr across the basin. In the past century, efforts have been dedicated to collecting river discharge data, culminating in memorable and contemporary data that are now accessible at 96 sites. Notably, analysis of the Congo River release data at the Brazzaville-Kinshasa nexus revealed a notable uptick, with a 21.0% increase documented during the 1960–1970 decade, distinguishing it from trends observed in most other decades.
From (ANDRITZ, 2024), we gained valuable insights into the existing hydropower infrastructure within the Republic of Congo. One notable facility is the Moukoukoulou Dam, situated on the Bouenza River, which was commissioned in 1979 to cater to the energy needs of Pointe-Noire. This boasted a nominal drop of 68.0 meters. This hydroelectric installation comprises four turbine/generator sets, each with a capacity of 18.5 megawatts, collectively generating a total power output of 74.0 megawatts. The Djoué HPP plays a pivotal role in supplying electricity to Brazzaville. It is within 10.0 kilometers of the city center. This facility features two units, each with a capacity of 9.06 megawatts, leveraging a head of 24.09 meters and operating at a speed of 300.0 revolutions per minute (rpm).
Synthesizing information from articles (FUND, 1994), we gain valuable insights into the hydroelectric infrastructure centered around Boali, a picturesque town approximately 100.0 km Northwest of Bangui, Central African Republic. Renowned for its awe-inspiring waterfalls, Boali stands as a testament to the natural beauty of the Mbali River, where the Boali Falls cascade majestically, spanning 250.0 m in width and plummeting 50.0 m at a height. These major falls occur in the Boali I and Boali II hydropower plants. Together, these units contribute 18.65 MW, harnessing the immense potential of river flow. The hydroelectric infrastructure includes a 29.0 m height dam, 6.1 m top width, and extending over a total 780.0 m length, meticulously engineered to manage the River's formidable flow. Notably, the maximum flow rate recorded stands at an impressive 295.0 m3/s, underscoring the robust hydrological dynamics of the Mbali River.
As outlined by Dipapoundji (2019), this study undertook a comprehensive analysis of the hydrological characteristics within the Lake Chad Basin, with a specific focus on identifying potential areas conducive to fostering the blue economy goals of the country. Central to this analysis is the seasonal dynamics of rivers within the basin. Notably, the rivers, including Chari in the Northeast and Logone in the Northwest, experience distinct flooding patterns, typically occurring between July and September, followed by low water levels throughout the year. Of particular interest are the tributaries of the Eastern Logone, spanning approximately 1000.0 km. It has an average annual 250.0 m3/s flow rate. Similarly, the Chari tributaries, such as Ouham and Aouk, exhibit notable variability in their yearly flow rates. For instance, the Ouham tributary records 50.0 m3/s flow rate during March and April, surging to a staggering 800.0 m3/s between August and October.
The study by Bamisile et al. (2023) represents a pioneering effort in conducting a techno-analysis of Chad's 100.0% sustainable electrification. A maximum of 8000.0 MW renewable energy resource potential is estimated. Complementing this endeavor, Rodriguez (2019) delves into Chad's hydrology using geographic information system (GIS) technology. It depicts the country's water sources and potential sites for hydropower installation. Of particular concern is Lake Chad, which faced recurrent droughts during the 1970s and the 1980s, resulting in drastic reductions in surface area and volume. Today, the lake relies primarily on the Chari and Logone Rivers, stretching over 1000.0 km in length and originating from the Central African Republic and Cameroon. The hydrography of the project area characterizes the Chari River and its tributaries. It supplies 83.0% of the water in Lake Chad. Notably, the flow rate of Chari exhibits significant fluctuations throughout the year, ranging from 180.0 m3/s throughout the low wet season (October to April) to a staggering 3400.0 m3/s throughout the heavier moist season, which spans from mid-June to the end of September.
The paper highlighted in Hammons et al. (2011) delved into the prospect of harnessing the immense hydroelectric potential of the Congo River for large-scale electricity generation. It leverages river run-off and little-head production technology at the Inga 2 hydro station (Democratic Republic of Congo (DRC)). Through meticulous analysis, this study demonstrated that this approach offers significant advantages over traditional dam-based generation methods, yielding a much smaller environmental footprint. The research reveals that a consistent river flow of 10,000 cm3/s can generate 5000.0 MW. Moreover, given the 30,000.0 cm3/s average river flow rate, the potential for base power generation ramps to an impressive 15,000.0 MW. The study also provides insights into the operational parameters of existing hydroelectric stations, such as Inga 1 and Inga 2, showcasing their respective heads, flow rates, and installed capacities of 50.0 m, 780.0 m3/sec, and 351.0 MW, and 58.0 m, 2800.0 m3/s, and 1424.0 MW, respectively.
In the research delineated by Josue and Mushi (2022), the paper embarks on implementing a solution to leverage the abundant water resources of large rivers or watercourses. This study focuses on the generation of the Congo River hydrokinetic power (HKP). The approach begins with a meticulous analysis of cities situated along the banks of these water bodies, characterized by well-documented depth and width parameters. Through this process and the use of both statistical analysis and GIS for hydrology imagery, the study identifies 44 prospective projects tailored to harness the hydrokinetic energy potential, ultimately culminating in a total energy generation capacity of 795,690.0 kilowatts (kW) from micro-grid installations. These energy projections are distributed across various renewable energy sources, with 661,000.0 kW attributed to solar photovoltaic systems, 83,790.0 kW derived from waste-to-power initiatives, and 50,900.0 kW harnessed through HK generation technologies.
The thesis outlined in Manga (2018) explores the vast potential of renewable energy sources within Gabon, with a primary focus on hydropower. Through meticulous examination, this research underscores Gabon's status as a nation blessed with abundant natural resources, including ample renewable energy reservoirs. Despite this rich potential, the study revealed a significant disparity between the estimated capacity for hydropower exploitation, pegged at approximately 6000.0 MW, and the actual utilization, which stands at a mere 3.0%, translating to 375.0 MW over several years. This underutilization is attributable to various factors, including limited infrastructure and investment in the sector. Gabon's favorable topography, characterized by varied terrain and heavy rainfall, provides an ideal backdrop for harnessing hydropower resources. The country boasts of existing power plants, such as the Petite Poubara and Grand Poubara dams strategically situated along the Ogooué River (Gabon's primary waterway). Additionally, two other dams, Kinguélé and Tchimbélé, are operational on the Mbei River. However, the sector is poised for expansion, with plans underway for additional projects on rivers such as Okano, Ngounié, and Ouue, collectively adding 502.0 MW to the country's hydropower capacity.
The authors (ARTELIA, 2020) indicated that the Kinguélé Aval hydropower project is situated within the Department of Komo in the Estuary province, approximately 90.0 km east of the capital city Libreville. The project represents the most downstream element of the Mbé Hydropower power network. Within this network lies the Tchimbélé hydropower project, located 50.0 km upstream, and the Kinguélé hydropower project, positioned just 10.0 km upstream. The reservoir, a fundamental component of the project, extends between the Monts de Cristal National Park (PNMC) and its buffer zone, with the dam structure and construction site situated within the buffer zone. The project boasts an available power capacity of 34.3 MW at the transformer terminals, facilitating an average annual production output of 200.0 GWh. It is an installation design flow of 90.0 m3/s and an average volume per year through turbines amounting to 1885.0 Mm3. Hydrological considerations underscore the project's resilience, with interannual flow rates averaging 65.0 m3/s. The design of flood events, such as Q1000, Q10000, and Q10, ensures robustness and safety during construction and operation.
The authors of International Rivers (2015) specify that the Djibloho Dam, situated along the Wele River, is a notable hydroelectric infrastructure in Equatorial Guinea, characterized by its impressive dimensions and significant energy generation capacity. With a height of 22.0 meters and 274.0 meters, this dam is a vital component of the country's energy infrastructure. It boasts a projected electricity generation capacity of 120.0 megawatts (MW). Already, the Djibloho Dam plays a crucial role in providing energy to various areas within the Continental Region, including Mongomo, Rio Campo, Machinda, Niefang, Micomesend, Nkue, Bidjabidjan, Ebebiyin, Mengomeyen, Anisok, and Evinayong. Furthermore, it contributes to meeting the energy needs of approximately 40.0% of Bata, a significant urban center in Equatorial Guinea.
Complementing this description, insights from UNIDO (2016) shed light on the prevailing climatic conditions around the Djibloho Dam. Mean temperatures between 23.0°C and 25°C characterize the area and cooler temperatures at higher altitudes in the inland regions. Notably, Equatorial Guinea's coasts experience higher rainfall, receiving between 250.0 to 400.0 millimeters of rain per month throughout the rainy season. In contrast, areas farther inland receive slightly less rainfall, averaging between 150.0 and 250.0 millimeters per month. However, an alarming trend emerges from historical data, indicating a decrease in the average yearly rainfall by 3.7 millimeters monthly (2.1%), a decade from 1960.
As detailed in MINISTRY (2019), the hydrological characteristics of São Tomé and Príncipe highlight the significant water resources available. It has many water reservoirs. It has 2.1 million m3 of water per square kilometer capacity, translating to approximately 10,000.0 m3 per year per inhabitant. The distribution of watercourses across the islands follows a radial pattern, originating from the central regions and extending towards the coastline. This network comprises over 50 water courses, varying lengths ranging from 5.0 to 27.0 km and substantial altitude differentials spanning from 1000.0 to 1500.0 m. Despite the irregularity of watercourse regimes, rivers do not exhibit torrential behavior. Instead, their flow patterns are intricately linked to the rainfall distribution, varying across different zones and seasons of the year. Between June and September, river flows contribute minimally, accounting for less than 10.0% of the annual total. Notably, the spatial distribution of waterways within the islands is uneven, with over 60.0% of the river flow concentrated in the southwest and southern regions.
Belizardo (2020) showed that São Tomé and Príncipe possess vast hydroelectric potential, primarily harnessed from numerous rivers and streams traversing the islands. The highest elevation point on São Tomé Island, reaching 2024 m, is the birthplace of hydropower energy, including Abade, Iô Grande, Manuel Jorge, and Rio do Ouro. These river basins feature steep slopes over relatively small areas, resulting in rapid water flow and limited concentration times. Consequently, the region experiences frequent flooding and substantial sediment transport, averaging 1500.0 and 2000.0 t/yr/km2. In contrast, Príncipe Island exhibited a more stable precipitation pattern, leading to a comparatively lower 60.0 l/s/km2 mean yearly runoff. São Tomé and Príncipe boast of approximately 50 river watersheds and 223 waterways (Belizardo, 2020).
The article (NRV, 2019) highlights a hydropower plant project situated at Contador that leverages the hydroelectric potential of the Contador River, employing a high-head (approximately 500.0 m) hydropower project designed to accommodate a small nominal flow rate, in line with the characteristics of the drainage area. The scope of survey works encompasses comprehensive coverage of all components associated with the Contador Small Hydropower (SHP) project, spanning a 10.0-kilometer corridor along the Contador River valley. This corridor had an average width of 50.0 meters. It is centered around the axis of water conveyance works and roads, extending to six specific areas housing specialized infrastructure. They entailed topographic surveys of six intake points: the forebay, 8.0 kilometers channel, eight tunnels, one and a half kilometers of penstock, powerhouse facility, and 23.0 kilometers of access roads. The survey area encompasses approximately 107.0 hectares.
A summary of previous hydropower siting studies in the Central African region, including their applied methods and evaluation criteria, is presented in Table 1.
Study area.

Methodology
This study is a descriptive and predictive geospatial suitability assessment aimed at identifying optimal sites for hydropower development across the Central African Power Pool (CAPP) region. The dependent variable is the hydropower site suitability score, which quantifies the potential of each location for hydropower development, while the independent variables include drainage density, elevation, flow accumulation, geology, land cover/use, rainfall, slope, soil texture, and stream power index, selected based on their influence on hydropower potential. The selection of these criteria is grounded in established hydrological and geospatial theories: drainage density and flow accumulation reflect water availability and runoff concentration; elevation and slope determine potential energy and flow velocity; geology and soil texture influence foundation stability and permeability; land cover/use represents anthropogenic and vegetation effects on sedimentation and flow regulation; rainfall captures spatial and temporal water input variability; and the stream power index integrates discharge and slope to estimate erosive and energy potential, collectively supporting hydropower site evaluation through principles of runoff generation, flow dynamics, and energy conversion.
Study design and data interaction
A multi-criteria suitability analysis (MCSA) framework was employed, integrating spatial datasets through a weighted overlay approach. This design allows combining heterogeneous data layers by reclassifying parameters into standardized suitability classes and aggregating them with assigned weights to produce a composite suitability score.
Data collection and preprocessing
Datasets were sourced from reputable global and regional repositories: annual rainfall from CHIRPS, land cover/use from ESRI, terrain parameters from Shuttle Radar Topography Mission, soil and geology data from FAO and UNESCO/ISRIC, and Digital Elevation Model data for slope, drainage density, and flow accumulation derivation. Recognizing the rapid expansion of infrastructure in Central Africa, existing grid data for socio-economic suitability assessment were sourced from the Africa Infrastructure Knowledge Program database, managed by the African Development Bank (Bamisile et al., 2023; Hartvigsson, 2012).
Original spatial resolutions prior to resampling were as follows: CHIRPS rainfall data at 0.05°, ESRI land cover at 300 m, SRTM DEM at 30 m, and soil/geology data at 1 km resolution. All datasets were standardized to a common coordinate reference system and resampled to a uniform spatial resolution of 30 arc-seconds (∼1 km) using bilinear interpolation in ArcGIS Pro to ensure spatial consistency. Figure 1 illustrates the study area map.

Study area map.
Reclassification and suitability scoring
Each parameter was reclassified into five suitability classes (1–5), where 5 represents the highest suitability for hydropower. The classification criteria and thresholds for each parameter were defined based on literature and expert judgment as follows:
The specific thresholds used to reclassify environmental parameters into five distinct suitability levels for hydropower development are detailed in Table 2.
Soil Texture, Geology, Land Cover, and Stream Power Index were similarly classified based on their respective ranges and suitability implications.
Hydropower suitability classification criteria for key environmental parameters.

Weighted overlay and AHP weighting
The Analytical Hierarchy Process (AHP) was employed to systematically derive the weights of the criteria influencing hydropower site suitability in the Central African Power Pool (CAPP) region. AHP is a structured multi-criteria decision-making technique that decomposes the complex decision problem into a hierarchy of criteria and sub-criteria, enabling pairwise comparisons to evaluate their relative importance.
Steps involved
Criteria selection
Nine criteria were identified based on hydrological, geological, and environmental relevance: Drainage Density, Flow Accumulation, Elevation, Slope, Rainfall, Soil Texture, Geology, Land Cover/Use, and Stream Power Index (SPI).
Pairwise comparison matrix construction
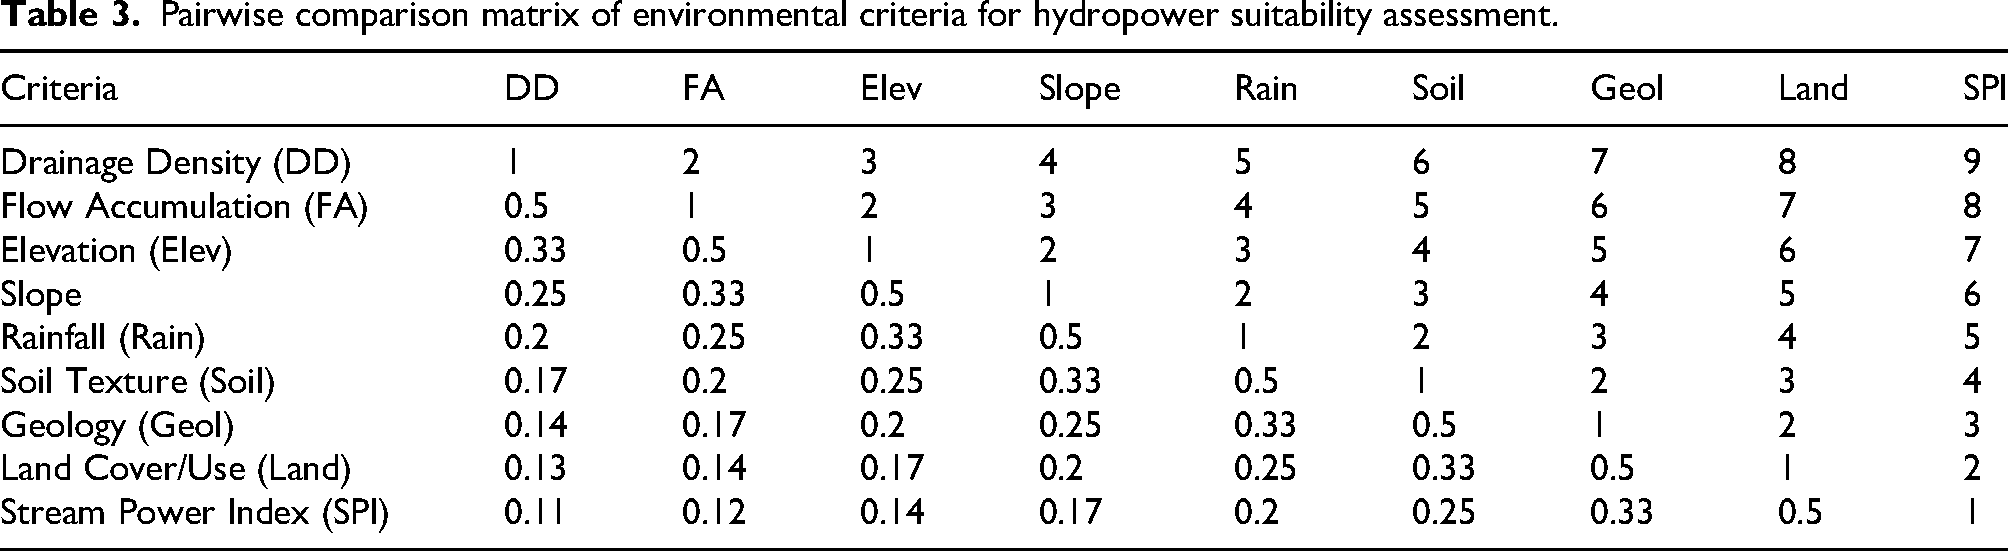
Each criterion was compared pairwise against every other criterion using Saaty's fundamental scale (1 to 9), reflecting the relative importance of one criterion over another. The resulting pairwise comparison matrix is shown below:
To determine the relative importance of the selected variables, a pairwise comparison matrix was developed using the Analytical Hierarchy Process, as shown in Table 3.
Pairwise comparison matrix of environmental criteria for hydropower suitability assessment.
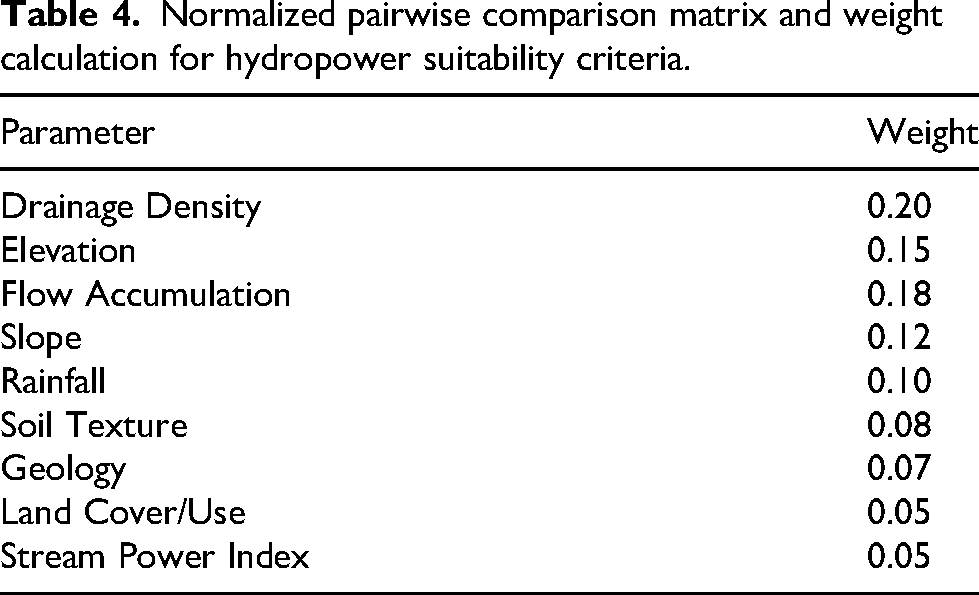
Normalization and weight calculation
The matrix was normalized by dividing each element by the sum of its column. The priority vector (weights) was then computed as the average of each row in the normalized matrix, yielding the following weights:
The final influence of each parameter on the suitability model was determined by calculating normalized weights, which are summarized in Table 4.
Normalized pairwise comparison matrix and weight calculation for hydropower suitability criteria.
Consistency check
To assess the logical consistency of the pairwise comparison matrix, the
The number of criteria is
The maximum eigenvalue of the comparison matrix is
The consistency index (CI) is calculated as follows:
By substituting the values, we obtain
For
The consistency ratio (CR) is then calculated as
By substituting the values, we obtain
Weights for each parameter were derived using the Analytical Hierarchy Process (AHP), which involved pairwise comparisons and calculation of the consistency ratio (CR = 0.08, indicating acceptable consistency). Because the CR is less than 0.1, the pairwise comparisons are consistent and reliable.

Where:
Hydrological modeling parameters
The ArcGIS Pro tools used for hydrological modeling included:
Fill tool: applied with default settings to remove the sinks.
Flow Direction: D8 algorithm was used.
Flow Accumulation: calculated using the standard raster cell neighborhood.
Validation and sensitivity analysis
Validation was performed by spatially comparing the suitability map with existing hydropower infrastructure locations obtained from regional energy database. Accuracy was assessed using spatial overlap metrics and a confusion matrix analysis.
The sensitivity analysis involved varying the AHP weights ±10% for each parameter independently to evaluate the effect on the final suitability classification. Changes in the suitability scores were quantified, and stability was confirmed in key areas.
Additional statistical analysis
A correlation analysis between the independent variables and suitability scores was conducted using Spearman's rank correlation to support parameter relevance and model robustness. Figure 2 illustrates the Methodological flow chart for this study.

Methodological flow chart.
Results and discussion
The hydropower site suitability assessment across the Central African Power Pool (CAPP) region integrates multiple geospatial parameters, analyzed through a multi-criteria suitability analysis (MCSA) using weighted overlay and Analytical Hierarchy Process (AHP) weighting. The results provide quantitative and spatial insights into hydropower potential, detailing the parameter distributions, suitability classifications, and validation outcomes.
The spatial analysis results, confirming the presence of suitable physical and environmental parameters across the ECCAS member states, are synthesized in Table 5.
Summary of results for the CAPP hydropower plant site suitability analysis.

Table 6 shows the drainage density of CAPP. This is the ratio of the total length of all streams/rivers to the drainage basin/watershed area. This indicates local weather, geography, and relief from natural topography (Wei et al., 2022) The overall average drainage density for the CAPP between 0.0 and 0.035 km/km2 was 80.13%. It occupies 5,436,639.46 km2 of the region. The drainage densities between 0.035 and 0.045 km/km2 occupied 16.12% of the total area, whereas those between 0.045 and 0.072 km/km2 occupied 3.75%. Figure 3 illustrates the drainage density patterns in Central Africa.

Map of central drainage density (Angola, DRC, Burundi, Congo, Gabon, Sao Tome and principle, Cameroon, Central Africa Republic, Chad, Equatorial Guinea, drainage density of all central zone).
Central drainage density.

The map represents the drainage density (measured in kilometers per square kilometer) across a specific country, outlined by black borders. The drainage density was categorized into five ranges from 0 to 0.072 km/sq km using a gradient of blue shades, where lighter shades indicated lower drainage density and darker shades represented higher drainage density. The northern and some central regions exhibited the highest drainage density, as indicated by the darkest blue shades, whereas the southern and western regions had relatively lower drainage densities. The map also includes a scale bar for distance reference and a north arrow for the orientation.
Table 7 indicates the elevations of the rivers and streams in CAPP. It rises from −16.0 to 4704.0 m high. The highest elevations were 974.0, 1, 388.0, and above 431.0 m for Congo, Gabon, and Burundi, respectively. Most elevations in the CAPP were below 975.0 m. The percentages of land over 974.0 m elevation include 74.22% (Angola), 17.91% (DRC), 87.27% (Burundi), 5.52% (Sao Tome & Principe), 12.67% (Cameroon), 2.17% (Central African Republic (CAR)), 6.97% (Chad), and 6.97% (Equatorial Guinea). The terrain of a river is a longitudinal portrait downstream that is dependent on distance and elevation. The profile can descend in a straight line or a curved surface. It was precipitous at the top and leveled out at the bottom. (Herrnegger et al., 2024)River elevation measures the height of a river's surface relative to a standard datum, such as the sea level. The elevation of the drainage basin, regional climate, river slope, and weather conditions affect the river elevation. Figure 4 illustrates the elevation map of the relief and rivers/streams in Central Africa and the CAPP.

Map of central elevation (Angola, DRC, Burundi, Congo, Gabon, Sao Tome and principle, Cameroon, Central Africa Republic, Chad, Equatorial Guinea).
Central elevation.
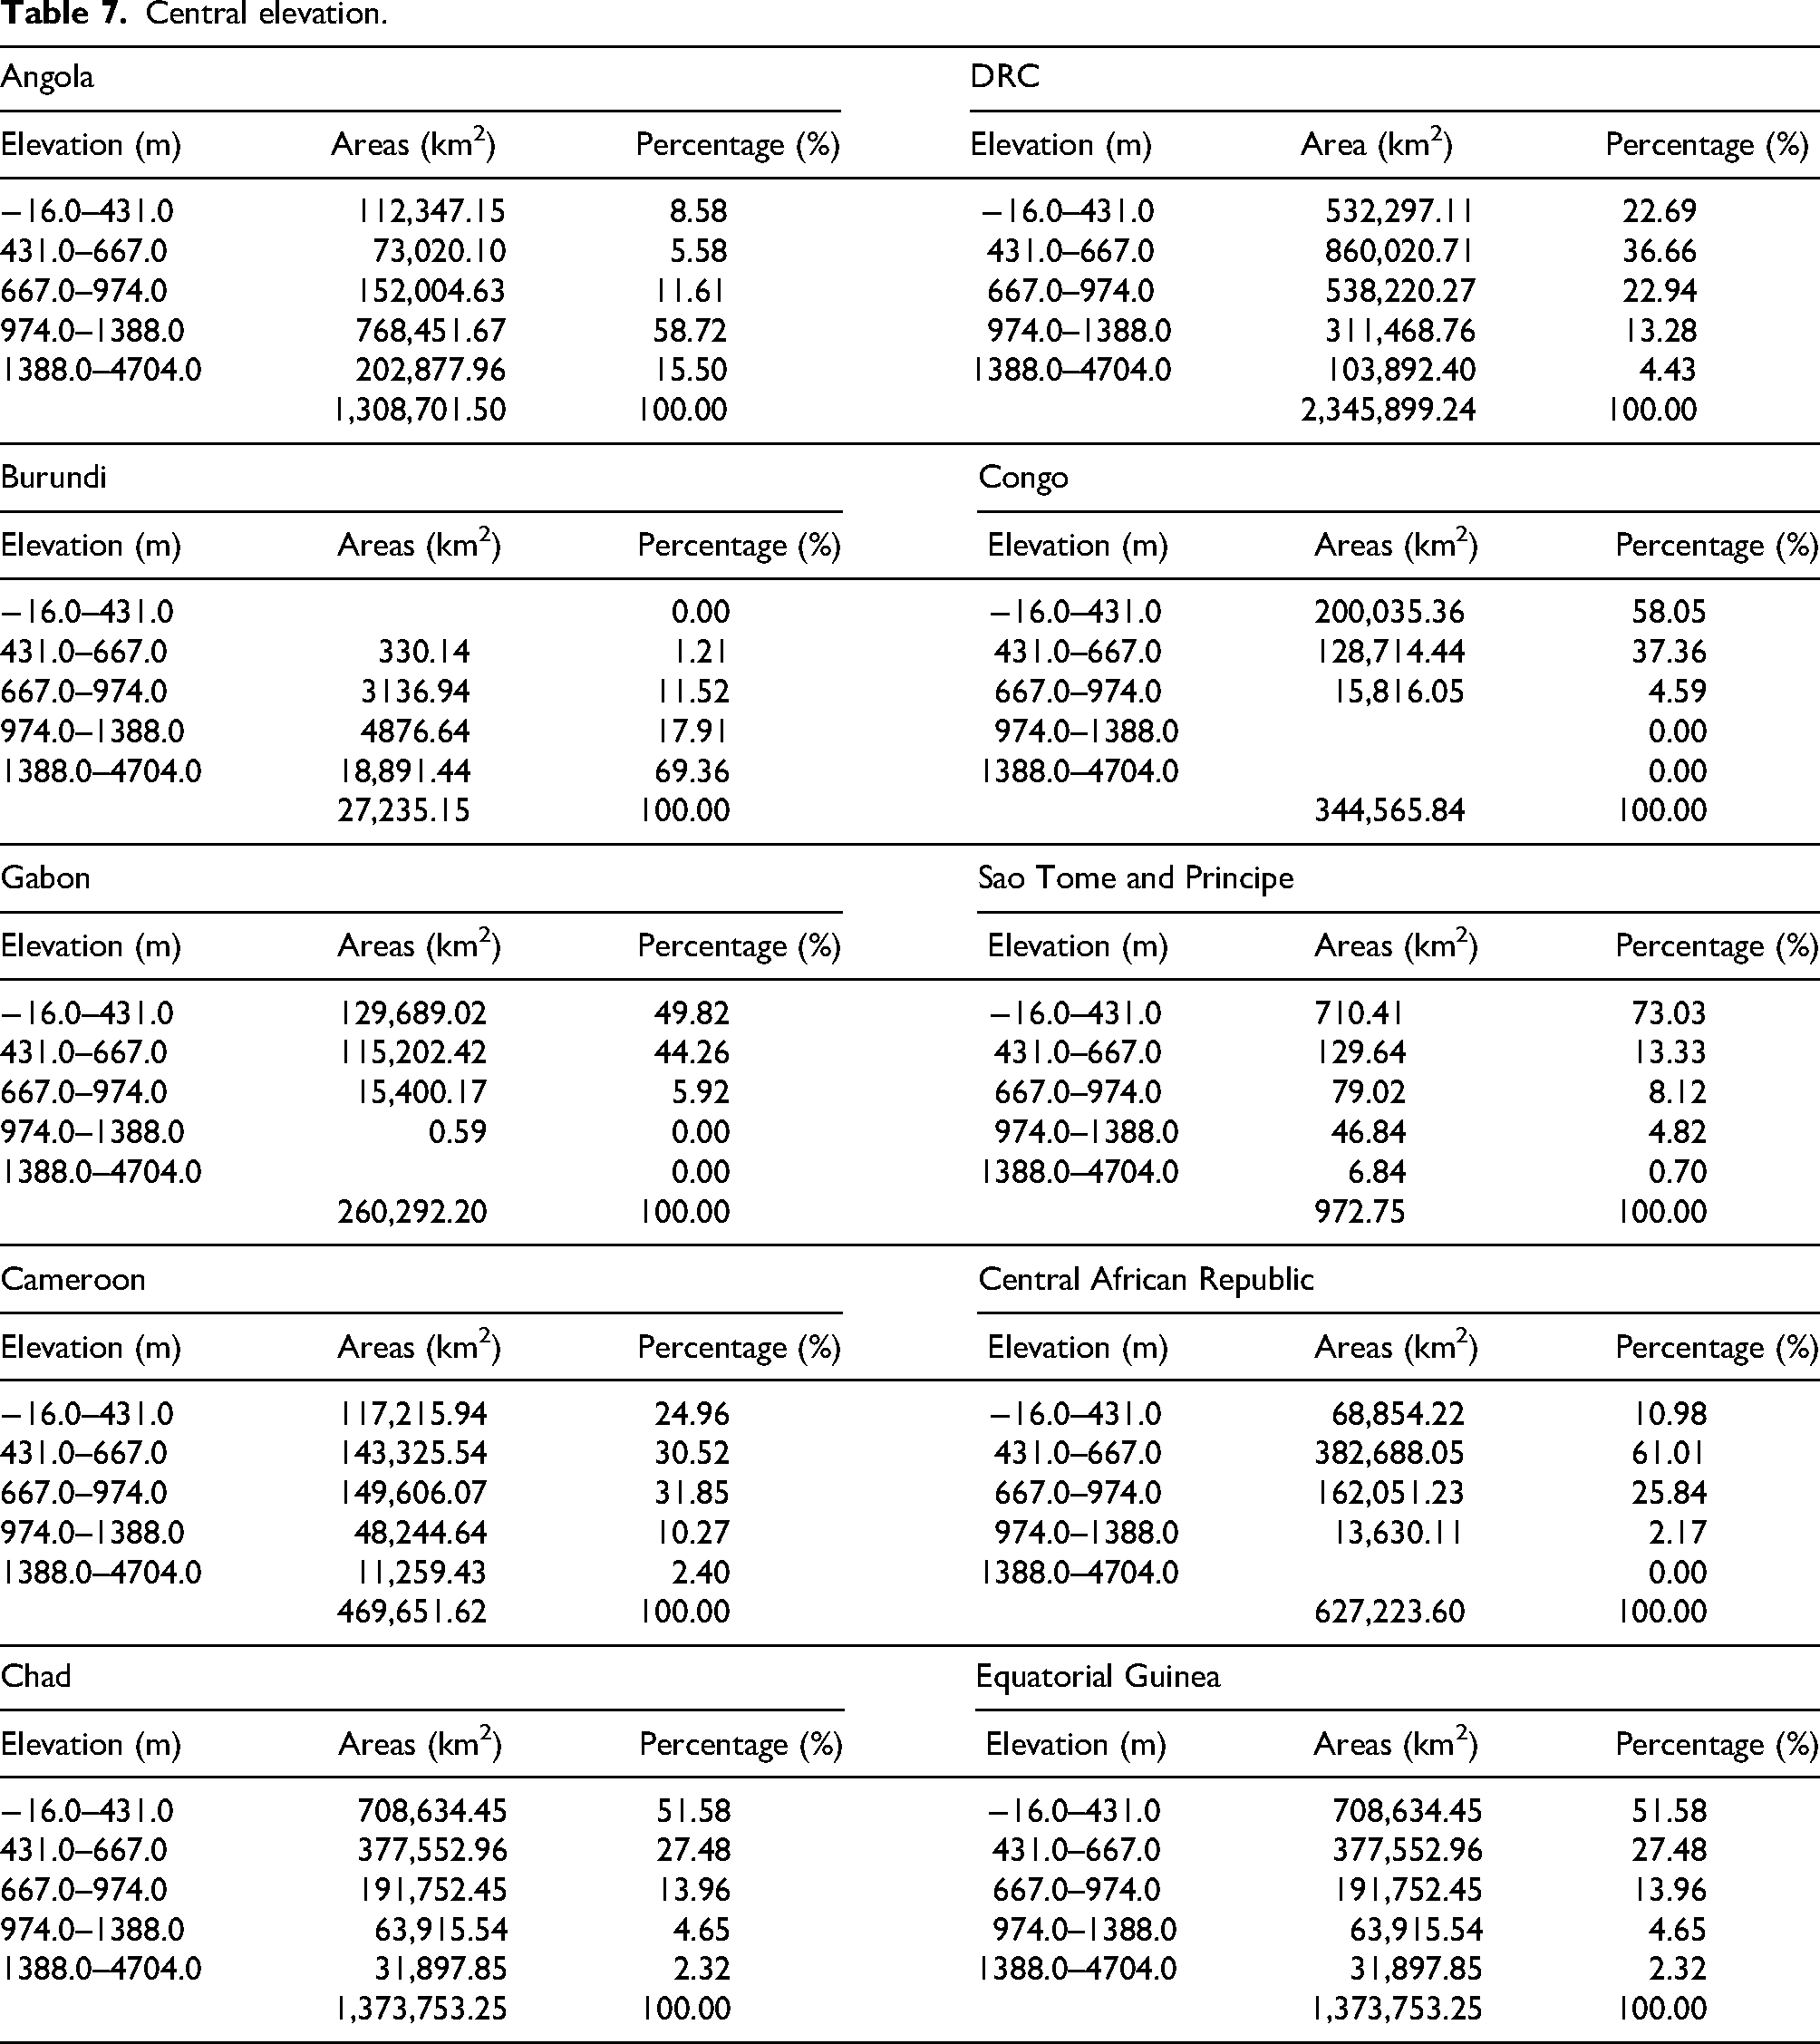
The map displays the elevation distribution of a specific country, with elevation levels categorized into five ranges, from −16 to 4704 m. The colors represent different elevation levels: light green for the lowest elevations (below 431 m), transitioning through green, orange, and brown, with white representing the highest elevations (above 1388 m). Lower elevations dominate the central and northern regions, whereas higher elevations are concentrated in the southern and eastern regions. The map includes a legend, north arrow for orientation, and a scale bar for distance measurement.
Table 8 depicts the flow accumulation of CAPP. This is the aggregate river discharge in the downstream areas. It computes the area, perimeter, and drainage density of river sources. They identified stream channels and ridges, ascertained the quality of rainfall in a watershed, developed a stream network or grid, and pinpointed valleys and watersheds (DATA.GOV, 2024; Jarman, 2019). The relatively high low flow accumulation percentages recorded for almost every country in the CAPP except Sao Tome and Principe without a value include Angola (98.17%), DRC (88.80%), Burundi (100.0%), Congo (91.48%), Gabon were (93.24%), Cameroon (91.75%), Central African, Republic for c (95.30%), and Chad (9,2whichadiddnottorial Guinea (100.0%). Figure 5 shows the dendritic display map of the CAPP flow accumulation.

Map of central flow accumulation (Angola, DRC, Burundi, Congo, Gabon, Sao Tome and principle, Cameroon, Central Africa Republic, Chad, Equatorial Guinea.
Central flow accumulation.

The map illustrates the flow accumulation across a specific country, highlighting the drainage network. Flow accumulation is represented by blue lines, with varying thicknesses indicating different accumulation levels; thicker lines denote higher flow accumulation, whereas thinner lines represent lower values. The network of streams and rivers is clearly depicted, showing how water converges and accumulates in different regions. The largest flow accumulation areas are concentrated in the central and northern regions of the country. The map includes a legend explaining the flow accumulation values, a northern arrow for orientation, and a scale bar for distance reference points.
Table 9 lists the geological structures of CAPP. It comprises Carboniferous, Cenezoic, Cretaceous, Holocene, Jurassic and Triassic, Kimberlite, Lower Cretaceous, Mesozoic, Mesozoic and Paleozoic, Mesozoic Extrusive and Intrusive Rock, Precambrian (undivided), and Quarternary (undivided) – subsurface salt dome and tertiary geological structural types. The most prevalent geological structural types include 93.28% Cenozoic for Angola, 95.89%Undivided Precambrian for DRC, 91.03% Undivided Precambrian for Burundi, 58.41% Undivided Precambrian and 56.81% Holocene for Congo, 72.26% Undivided Precambrian for Gabon, 67.69% Tertiary extrusive and intrusive for São Tomé and Príncipe, 45.32% Cretaceous, 38.11% Undivided Quaternary, and 38.07% Holocene for Cameroon, 81.22% Lower Cretaceous for the Central African Republic, 29.99% Pleistocene for Chad, and 87.92% Undivided Precambrian for Equatorial Guinea.
Central geology.

The Carboniferous geology was present only in Angola, Chad, and Gabon (Permian-Carboniferous). Undivided Precambrian rocks were present in all other CAPP countries except for Sao Tome and Principe. Silurian, Tertiary, Triassic Permian, Upper, and Middle Devonian rocks are present only in Chad

Map of central geology (Angola, DRC, Gabon, Sao Tome principe, Cameroon, Central Africa Republic, Chad, Equatorial Guinea).
This map illustrates the diverse geology of a region using color-coded classifications for various rock types and geological periods ranging from the Precambrian to the Quaternary, including sedimentary, volcanic, and metamorphic formations. It includes a scale bar, geographic coordinates, and detailed legend for identifying specific geological units and their distribution.
Table 10 presents the land cover and use statistics for Central Africa. The measured or assessed parameters included water, trees, flood vegetation, crops, built areas, bare ground, snow/ice, clouds, and rangeland. The largest share for each land use category comprised 57.93% Trees for Angola, 75.31% Trees for DRC, 57.82% Rangeland for Burundi, 72.14% Trees for Congo, 91.30% Trees for Gabon, 82.92% Trees for Sao Tome & Principe, 69.72% Trees for Cameroon, 88.18% Trees for Central African Republic, 54.88% Rangeland and 35.36% Bare Ground for Chad, and 96.46% Trees for Equatorial Guinea. This shows that trees were the most significant land-use component in Central Africa. Only Burundi (57.82%) and Chad (54.88%) had sizeable ranges in CAPP. Figure 7 depicts the motif of land use coverage or patterns in Central Africa.

Map of central land cover (Angola, DRC, Burundi, Congo, Gabon, Sao Tome principe, Cameroon, Central Africa Republic, Chad, Equatorial Guinea).
Central land cover.

This map illustrates the land cover of Central Africa, encompassing countries such as Angola and others, showcasing a diverse range of features, including forests, water bodies, agricultural lands, built-up areas, and rangelands using a color-coded legend. It provides a visual representation of a region's land-use patterns with a scale bar and geographic coordinates for the spatial context.
Table 11 presents the rainfall data for all the Central African countries. The rainfall varies between 0.88 mm and 3255.73 mm. The percentages of rainfall data up to 1979.32 mm for each country in the CAPP are as follows: 99.99% for Angola, 94.60% for DRC, 98.74% for Burundi, 82.58% for Congo, 63.68% for Gabon, 48.06% for Sao Tome & Principe, 81.26% for Cameroon, 98.35% for Central African Republic, 100.0% for Chad, and 68.56% for Equatorial Guinea. In contrast, the highest rainfall for Chad was 1570.87 mm and 1136.89 mm, the minimum rainfall for Equatorial Guinea, Congo, and Sao Tome & Principe. Figure 8 shows a colorful mosaic of the rainfall data maps.
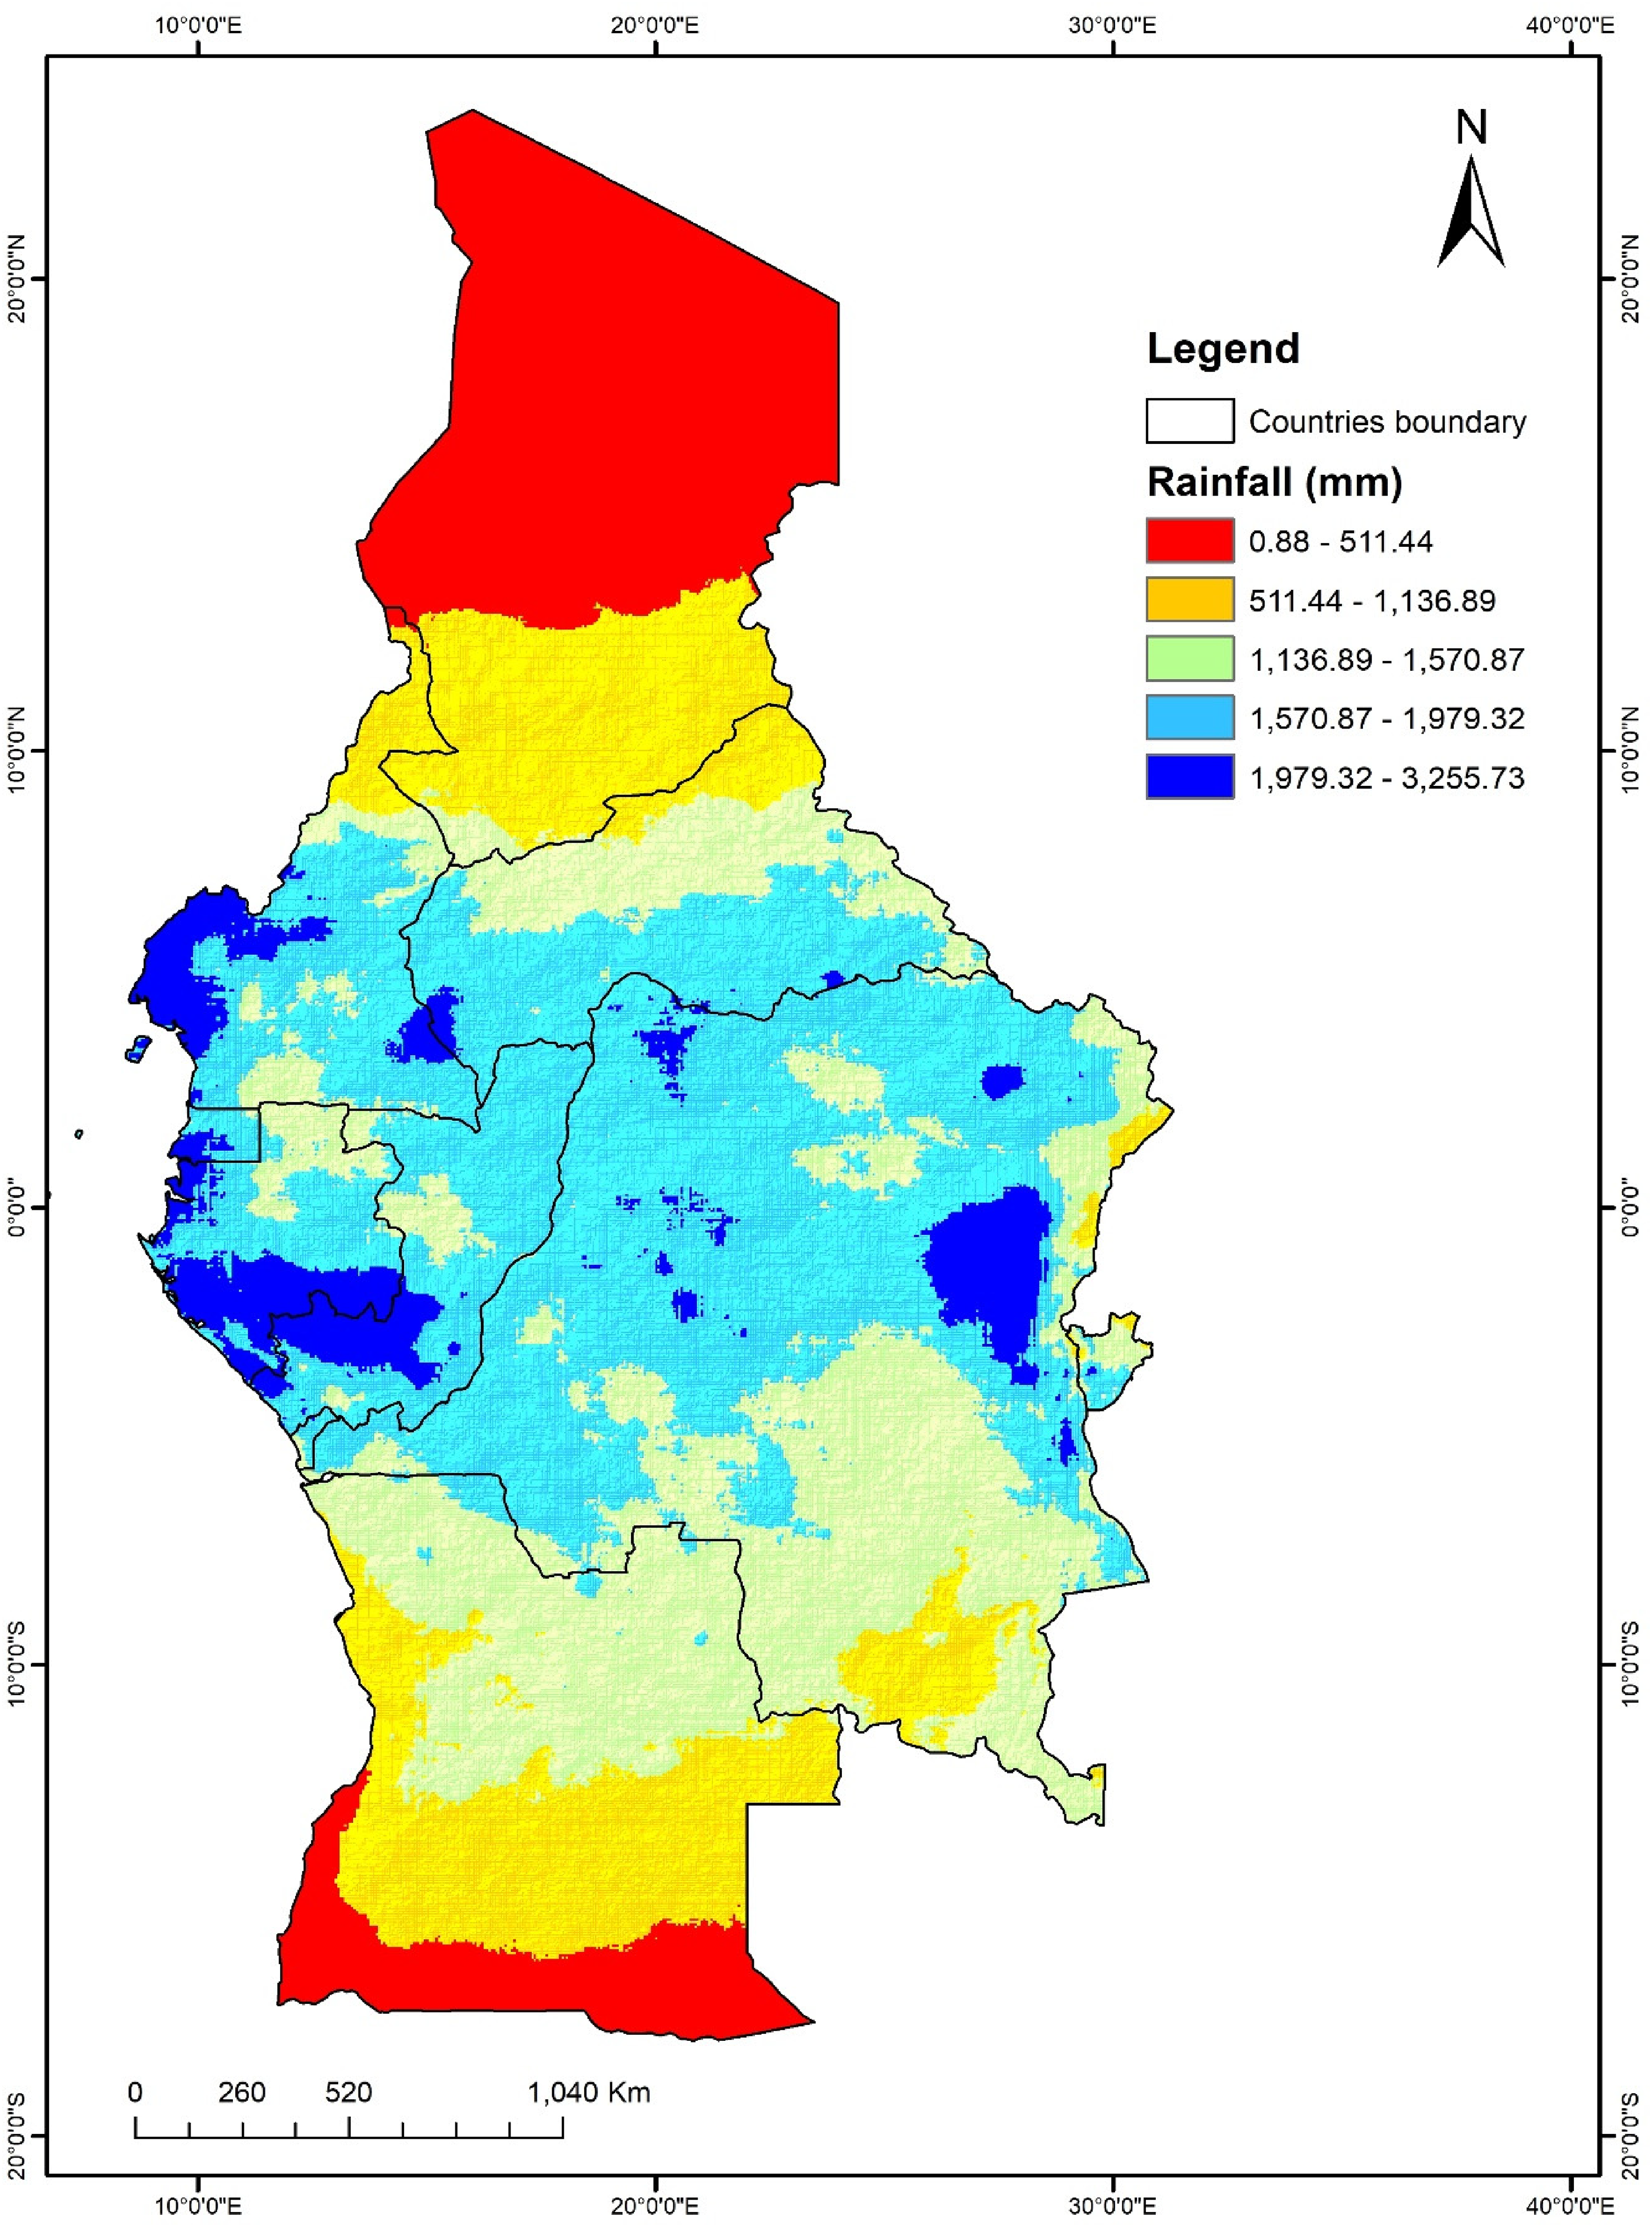
Map of central rainfall (Angola, DRC, Burundi, Congo, Gabon, Sao Tome principe, Cameroon, Central Africa Republic, Chad, Equatorial Guinea).
Central rainfall.
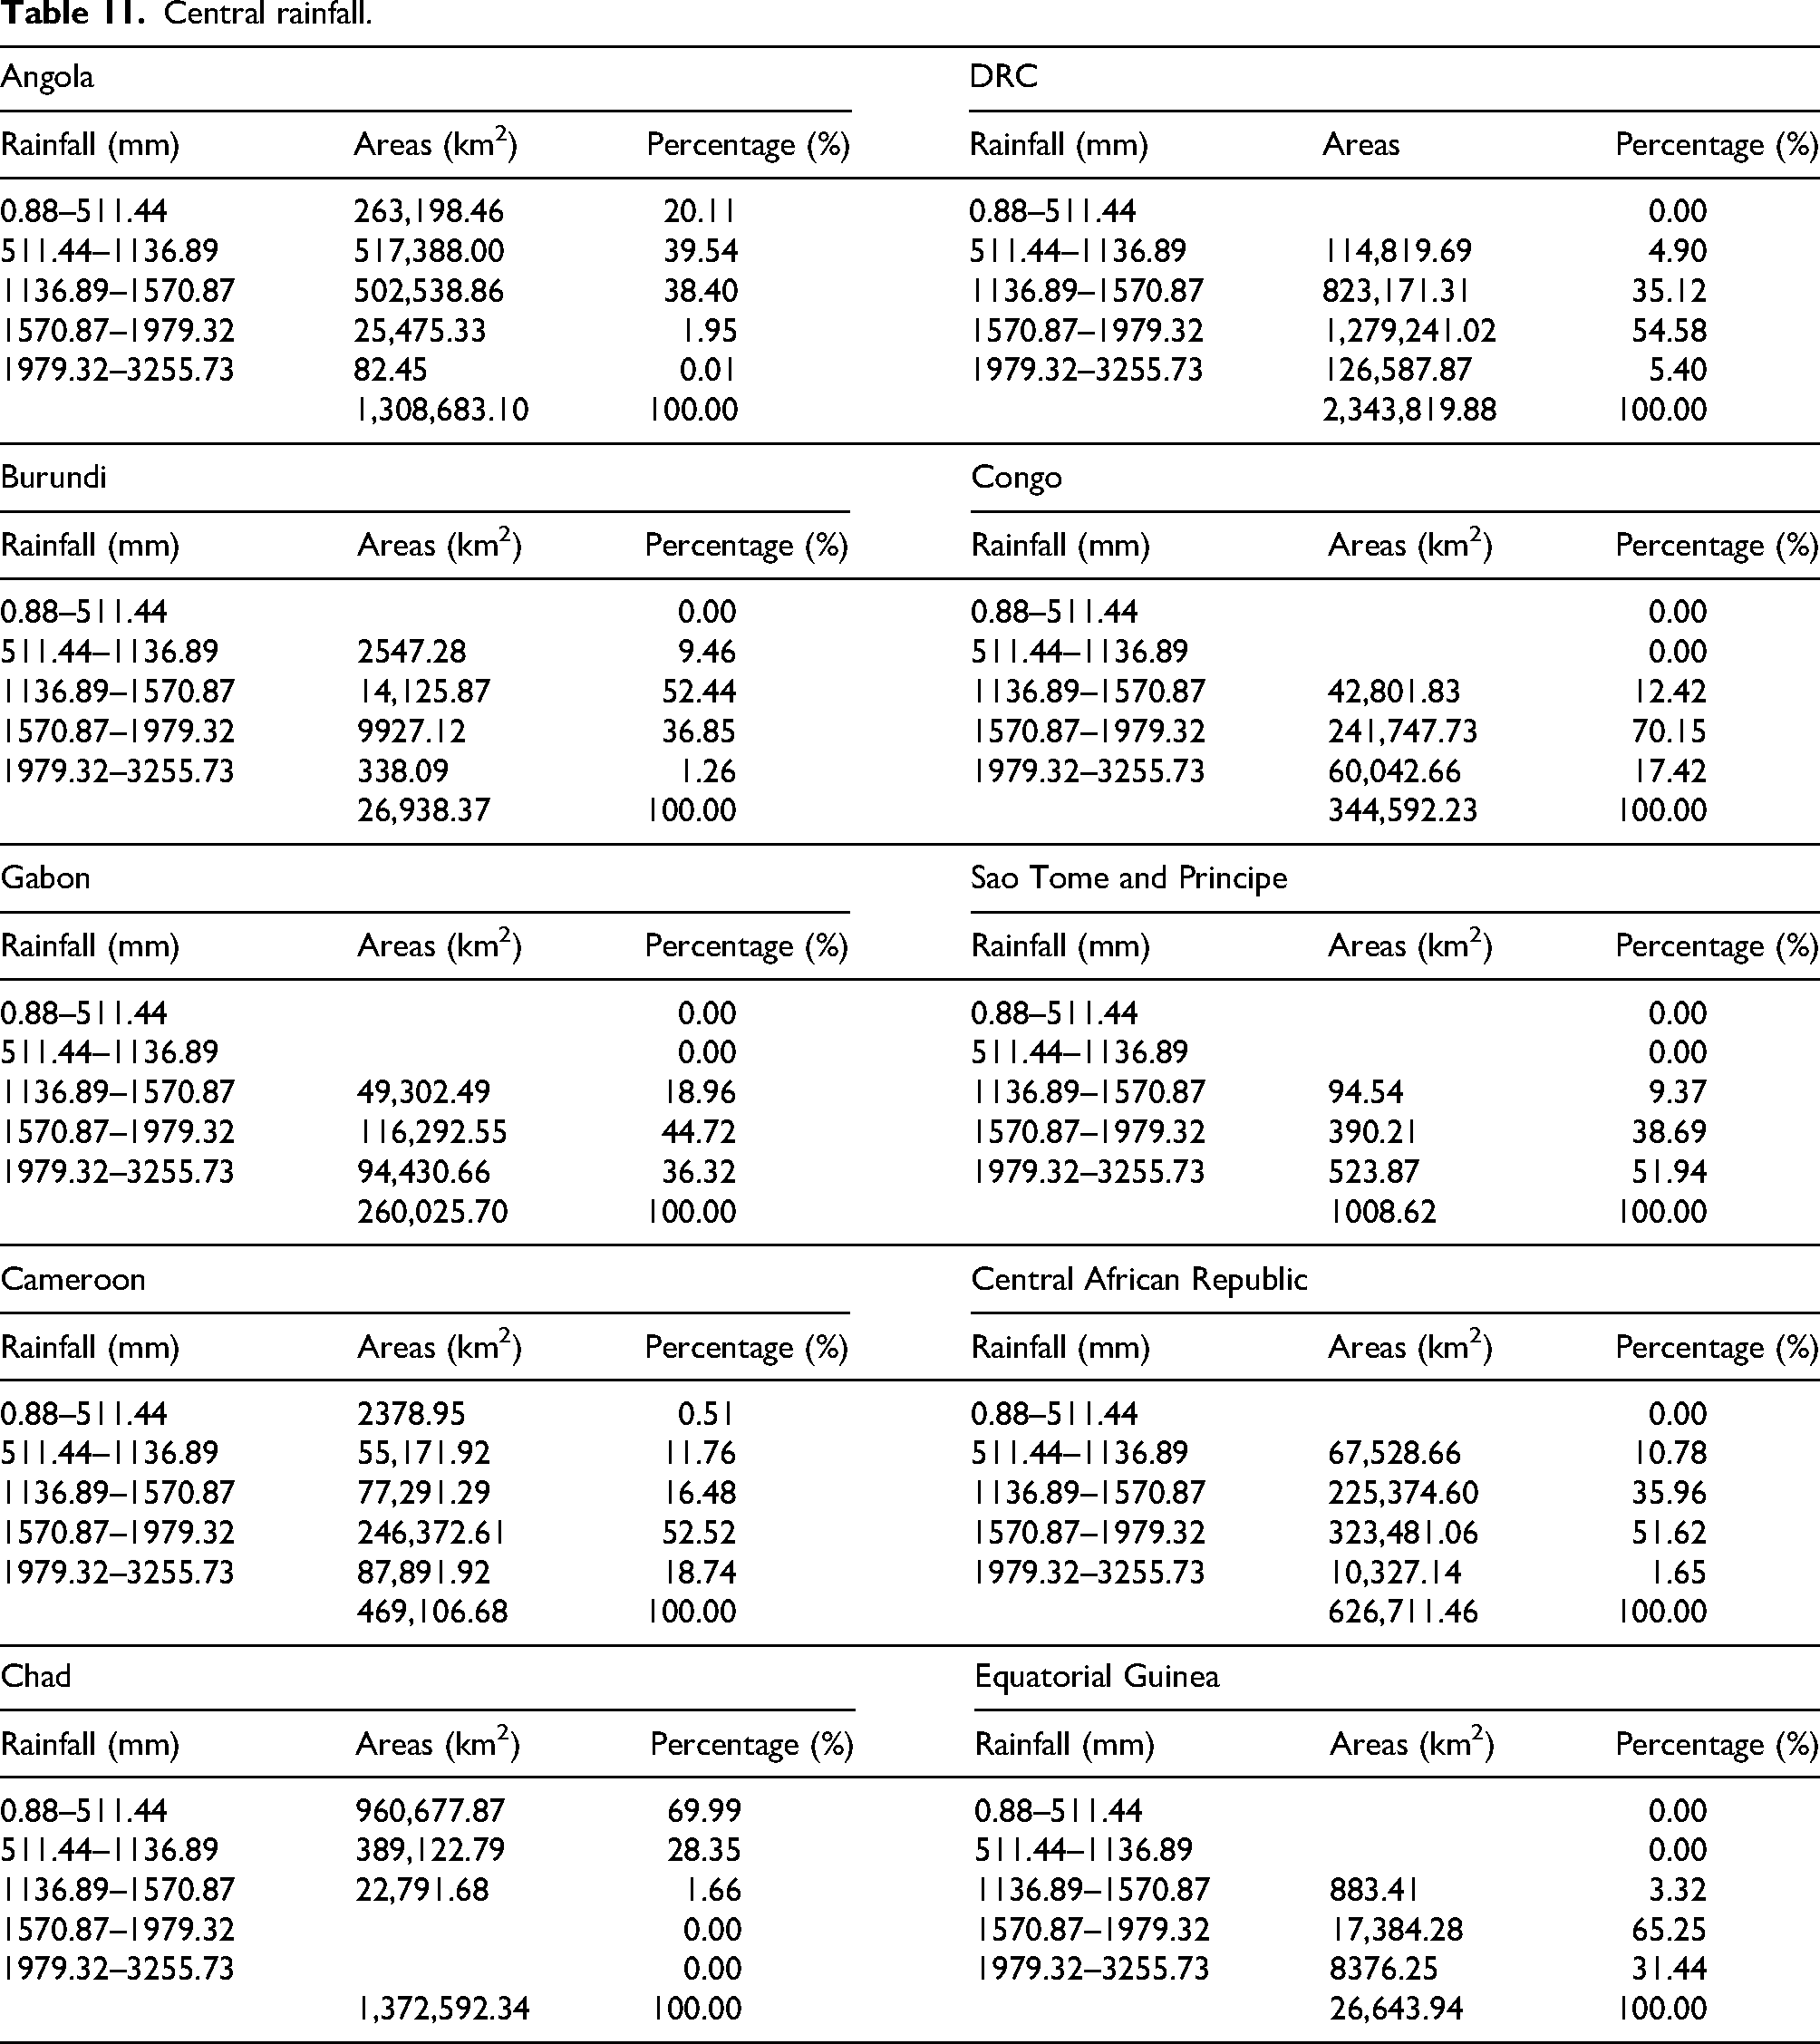
This Map depicts the rainfall distribution across Central Africa, including countries such as Angola and the DRC, showing varying precipitation levels in millimeters using a color gradient. It provides a visual representation of rainfall patterns with a legend for interpretation, scale bar, and geographic coordinates for the spatial context.
Table 12, indicates the slopes of the CAPP that varied between 0.0

Map of central slope (Angola, DRC, Burundi, Congo, Gabon, Sao Tome principe, Cameroon, Central Africa republic, Chad, Equatorial Guinea).
Central slope.

This map displays the slope gradient across Central Africa, encompassing countries such as Angola and the DRC, using a color-coded system to represent varying percentages of slope, from nearly flat to steep. It includes a legend for interpretation, scale bar, and geographic coordinates for the spatial context.
Table 13, indicates the Soil Texture comprising Clay, Clay Loam, Loam, Loamy Sand, Sand, Sand Clay, Sandy Clay Loam, Sandy Loam, Silt Loam, and water. The respective concentrations of soil types comprise 49.95% Sandy Loam in Angola, 55.81% Clay in the DRC, 71.05% Sandy Loam in Burundi, 40.87%Sandy Loam in Congo, 73.08% Sandy Clay Loam in Gabon, 100.0% Loam in Sao Tome and Principe, 61.25% Sandy Clay Loam in Cameroon, 45.48% Sandy Loam in the Central African Republic, 26.38% and 25.03% Sandy Loam in Chad, 82.85% Sandy Clay Loam in Equatorial Guinea. In summary, the general soil type prevalent in Central Africa is Loamy soil. Figure 10 displays a mosaic of soil types available in the CAPP. UWB is an unweathered bedrock. This indicates little or no weathering of the rock, which is likely unsuitable for agriculture. Only Chad had a sizeable 2.43% unweathered bedrock (UWB).

Map of central soil texture (Angola, DRC, Burundi, Congo, Gabon, Sao Tome principe, Cameroon, Central Africa republic, Chad, Equatorial Guinea).
Central soil texture.

This map illustrates the soil texture distribution across a region, likely in Central Africa, categorizing soil into various types, such as clay, loam, sand, and their combinations, along with water bodies (“Water”) and Unweathered Bedrock (“UWB”). It uses a color-coded legend to represent each soil texture, provides a visual understanding of the region's soil composition, and includes a scale bar and geographic coordinates for spatial reference. Additionally, it notes that 2.43% of the area is “izeable.”
Table 14 depicts the Stream Power Index (SPI), which is location- and study-specific. Higher values suggest precipitation and mountainous regions with more severe erosion. (Zhang et al., 2020) The stream power index for Central Africa is between 0.0 and 83,504,521,700.0. Only Congo has 99.96% occupancy in the first class (0.0–22,773,960,460.0) and negligibly small values

Map of central SPI (Angola, DRC, Burundi, Congo, Gabon, Sao Tome principe, Cameroon, Central Africa republic, Chad, Equatorial Guinea, SPI of all zone).
Central SPI (stream power Index).

This map illustrates the Standardized Precipitation Index (SPI) across Central Africa, indicating varying levels of precipitation anomalies. The SPI values, multiplied by 100,000,000, are categorized into ranges represented by different colors, with a legend for interpretation, and the map includes a scale bar and geographic coordinates for the spatial context.
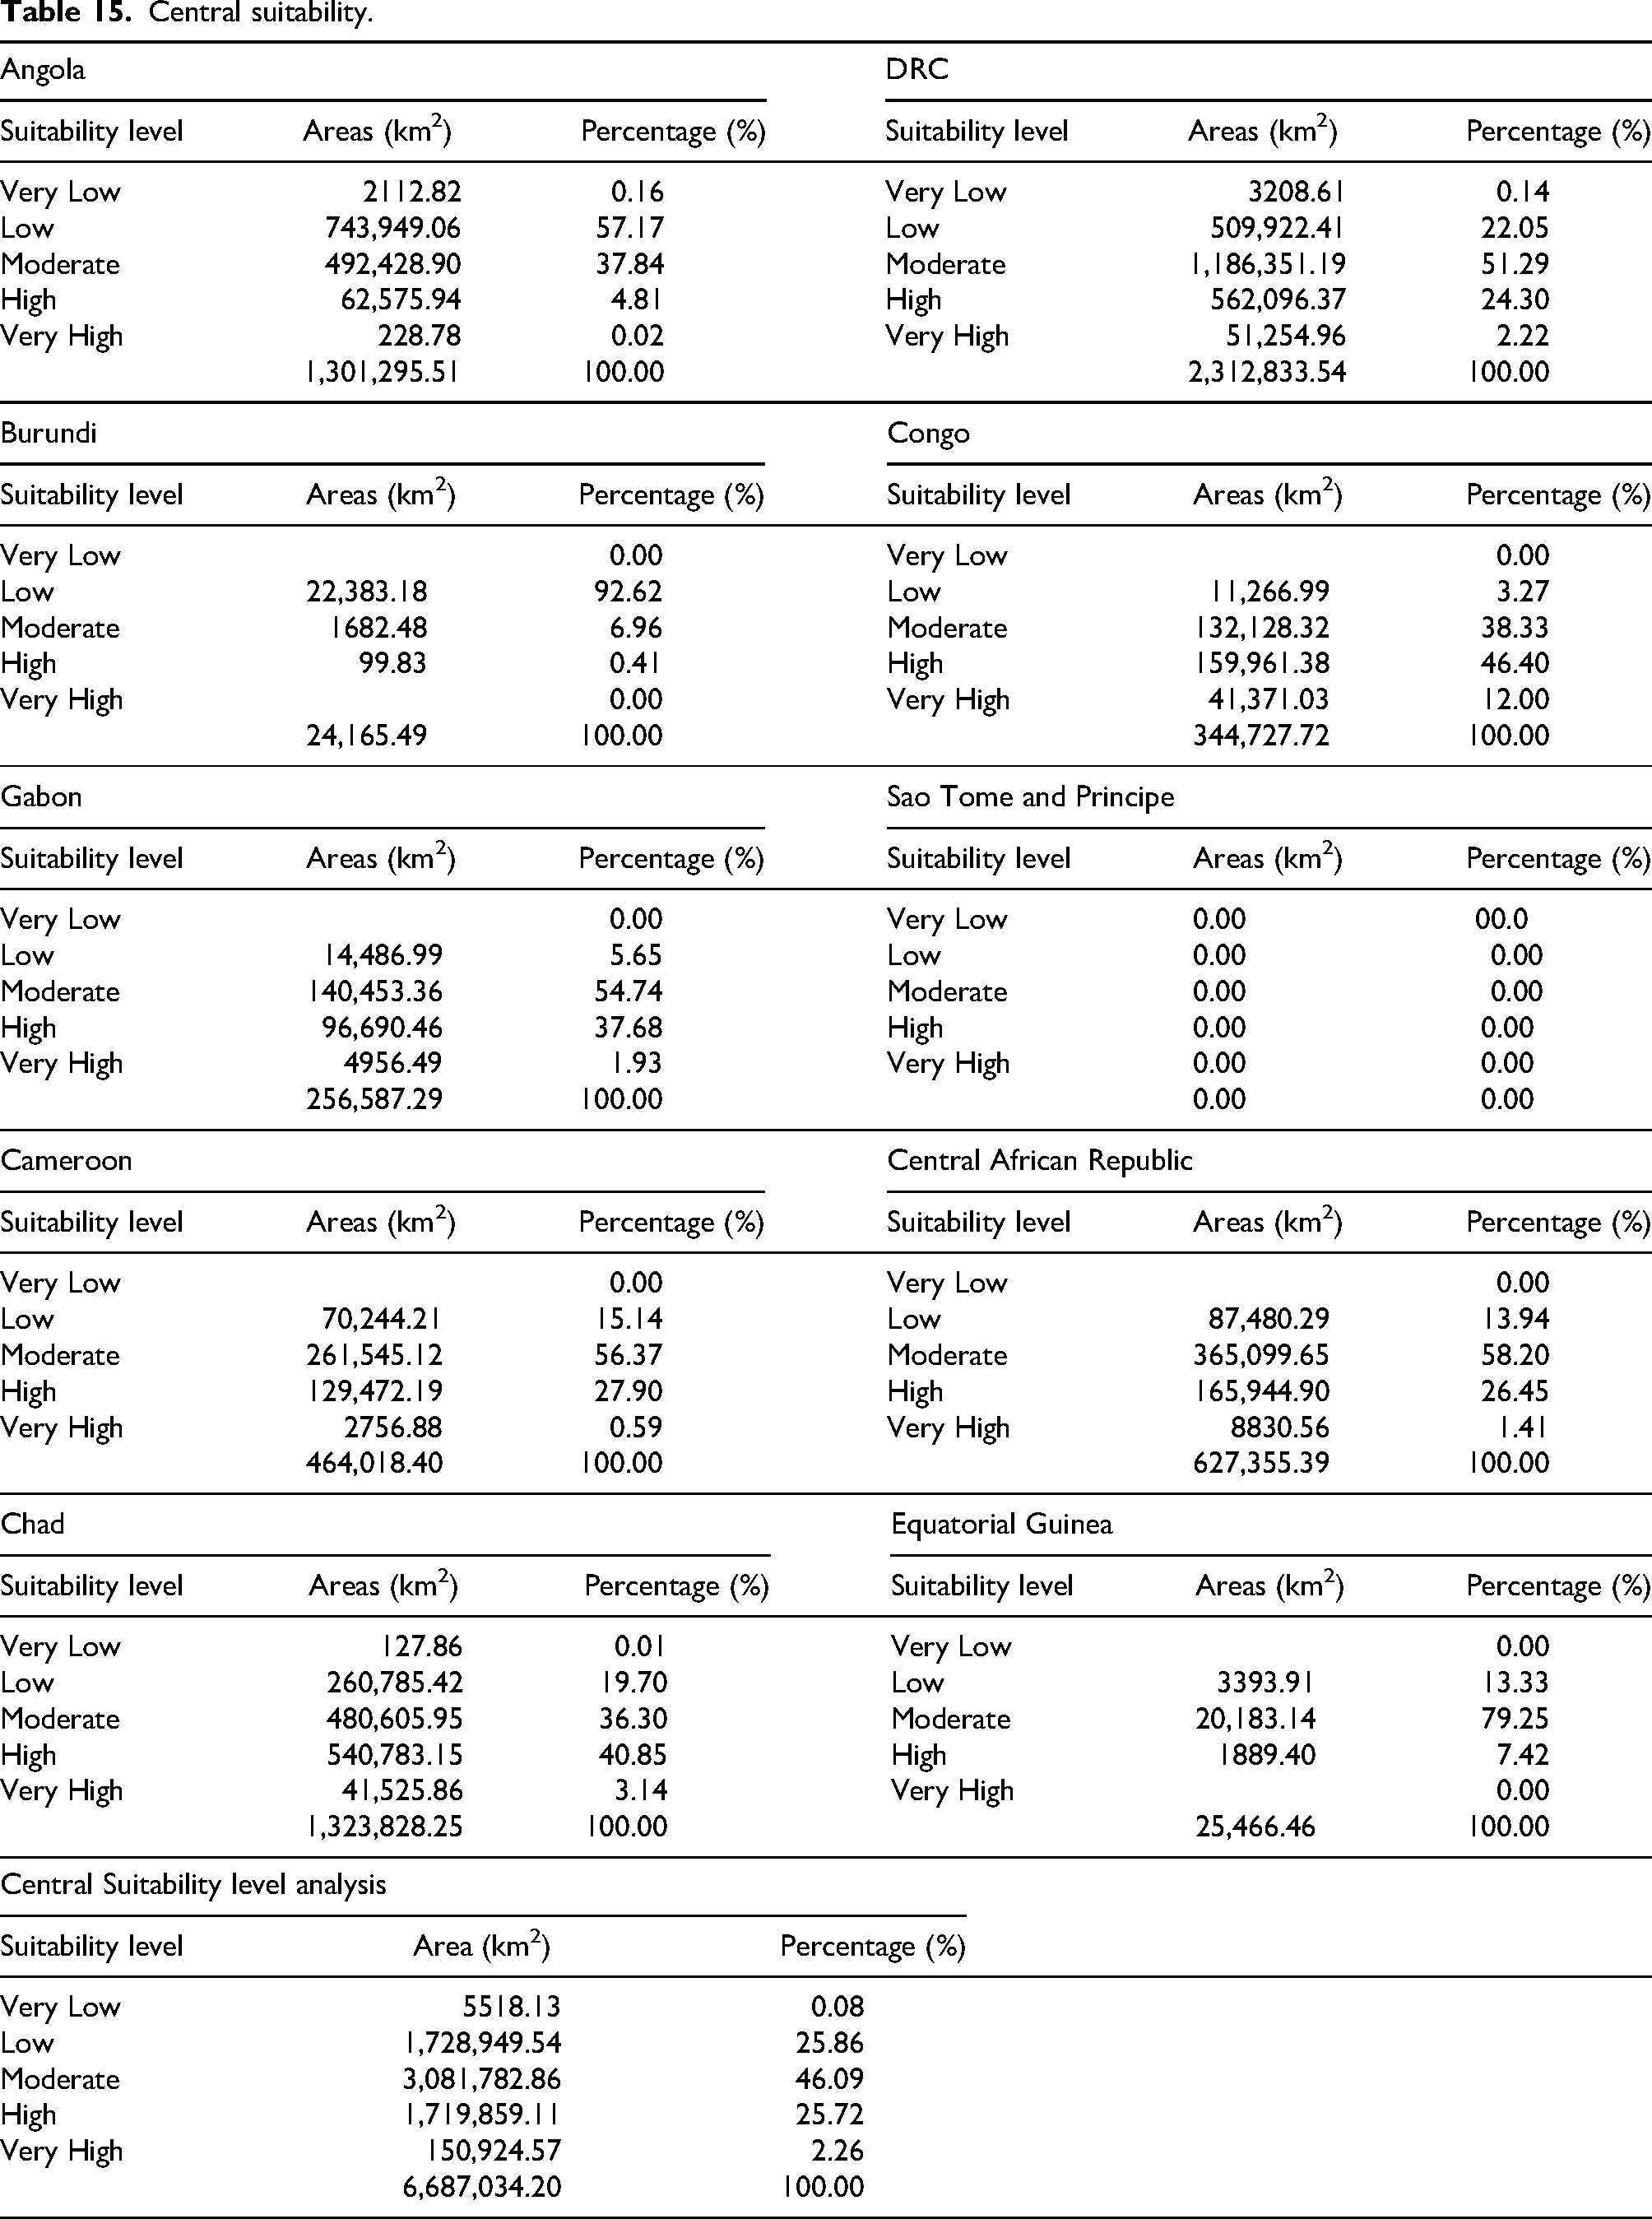
Table 12 presents the suitability of hydropower plant sites for every country in Central Africa. Moderate-to-very high potential suitability parameters were also studied. The suitability percentages for each country in the CAPP are as follows: 42.67% for Angola, 77.81% for DRC, 7.37% for Burundi, 96.73% for Congo, 94.35% for Gabon, 0.00% for Sao Tome and Principe, 84.86% for Cameroon, 86.06% for the Central African Republic, 80.29% for Chad, and 86.67% for Equatorial Guinea. Overall, 74.07% of the total (6,687,034.20 km2) is suitable for hydropower plants if moderate to very high suitability is considered. Figure 12 suggests that the central parts of the region are more favorable for hydropower plant installation than the northern or southern parts of the CAPP.

Map of central suitability (Angola, DRC, Burundi, Congo, Gabon, Sao Tome principe, Cameroon, Central Africa republic, Chad, Equatorial Guinea, central suitability level analysis).
This map displays the suitability levels across Central Africa, categorized from “Very Low” to “Very High,” using a color gradient. It provides a visual representation of how well the region meets certain criteria, possibly for a specific activity or development, with a legend for interpretation, a scale bar, and geographic coordinates for the spatial context.
Parameter distributions
Suitability analysis
Using AHP-derived weights (Drainage Density 0.20, Flow Accumulation 0.18, Elevation 0.15, Slope 0.12, Rainfall 0.10, Soil Texture 0.08, Geology 0.07, Land Cover/Use 0.05, Stream Power Index 0.05), a composite suitability score was calculated per pixel as:
The suitability map classifies sites into Very Low, Low, Moderate, High, and Very High categories (Table 15, Figure 12).
Approximately 74.07% of the CAPP area falls within Moderate to Very High suitability classes, indicating substantial potential for hydropower development. Country-level suitability varies: Congo (96.73%), Gabon (94.35%), and Cameroon (84.86%) show the highest percentages of suitable areas, reflecting favorable hydrological and terrain factors. Sao Tome and Principe show no suitable areas, likely due to geographic constraints or data limitations.
Central suitability.
Model validation and sensitivity
Validation through spatial comparison with existing hydropower infrastructure confirms good alignment between predicted high suitability zones and operational sites, supporting model reliability.
Sensitivity analysis varying AHP weights ±10% shows the model's robustness, with drainage density and flow accumulation weights most influencing suitability outcomes. Classification stability across weight variations confirms method resilience.
Suitability for small vs. large-scale hydropower
While this geospatial model identifies broad suitability zones, it is critical to distinguish between the requirements for Small Hydro Power and large-scale dam projects, as their technical and environmental constraints vary significantly (Anandarajah, 2019; Korkovelos et al., 2018). Large-scale hydroelectric projects, such as the Grand Inga or Laúca developments, require massive reservoir capacities and high hydraulic heads, making them subject to rigorous environmental and social impact assessments due to potential ecosystem disruption (Anandarajah, 2019; Oyewo et al., 2018). In contrast, SHP and micro-hydropower projects often utilize run-of-river configurations that require smaller hydraulic heads and lower flow rates, prioritizing proximity to rural load centers with minimal environmental footprint (Kengne et al., 2017; Signe et al., 2019a). Consequently, while our results indicate high general suitability, site-specific evaluations must weight environmental sensitivity more heavily for large-scale developments versus grid proximity and flow consistency for SHP installations (Cheng et al., 2016; Korkovelos et al., 2018).
Discussion
The hydropower site suitability assessment conducted for the Central African Power Pool (CAPP) region demonstrates a comprehensive integration of geospatial and multi-criteria decision-making approaches, specifically employing the Analytical Hierarchy Process (AHP) weighted overlay method. This methodology aligns closely with similar hydropower potential studies across Africa and other regions, reinforcing the robustness and applicability of such frameworks for regional scale evaluations.
Comparative analyses with studies in Angola, such as those by Humududu and Killingtveit (2016) and Liu et al. (2013), validate the critical importance of parameters like drainage density, flow accumulation, and elevation factors that received the highest weights in our AHP model. The technical specifics of Angola's Kwanza River Basin and Laúca hydropower plant emphasize the necessity of integrating detailed hydrological data with geospatial analyses to refine site-suitability models. This suggests that future iterations of the present study could benefit from incorporating more granular hydrological flow data and seasonal variability to enhance the predictive accuracy (Humududu and Killingtveit, 2016; Liu et al., 2013).
Micro-hydropower feasibility investigations in Burundi and Cameroon (Musambi, 2018; Signe et al., 2017) further corroborate the significance of slope and flow rate parameters, which our study assigned moderate weights. These localized assessments highlight the value of field measurements and hydrological modeling, underscoring the opportunities to augment the current regional-scale GIS-based evaluation with finer-scale hydrological inputs and ground-truth validation (MUSAMBI, 2018; Signe et al., 2017).
Regional assessments, such as those by Kaunda et al. (2012) in Sub-Saharan Africa, reveal congruent findings regarding the predominance of loamy soils and forest cover in promoting hydropower infrastructure stability. Our land cover and soil texture results, which indicate extensive forested areas and dominant loamy soil types, support the suitability classifications for countries such as Gabon and Cameroon. This consistency enhances confidence in the identified spatial patterns and the weighting of the underlying criteria (Kaunda et al., 2012).
The hydropower potential mapping for the Congo Basin (Alsdorf et al., 2016; Hammons et al., 2011) aligns with our findings of extensive suitable zones, particularly in the Congo and Democratic Republic of Congo, where stable Precambrian geological formations and favorable rainfall patterns contribute to high suitability scores. These findings underscore the importance of geological stability and precipitation regimes in hydropower site selection (Alsdorf et al., 2016; Hammons et al., 2011).
International reports (IRENA, 2015); World Energy Council 2013 indicate a relatively modest increase in hydropower capacity in Africa, highlighting the need for spatially explicit assessments, such as ours, to guide strategic development and investment. The spatially detailed suitability map of our study provides a valuable tool for prioritizing sites that balance hydrological, geological, and environmental factors, addressing this critical gap in regional planning (IRENA, 2015).
The results of the current study are consistent with and complementary to existing African hydropower site assessments, reinforcing the methodological choices and highlighting key regional patterns. The identification of approximately 74.07% of the CAPP area as moderately to highly suitable for hydropower development, with the highest suitability in Congo, Gabon, and Cameroon, provides actionable insights for regional energy planning. However, it is important to recognize that geospatial suitability alone does not guarantee the feasibility of a project. Comprehensive feasibility assessments must incorporate additional factors, such as infrastructure availability, environmental protection, social acceptance, and transboundary cooperation.
In summary, this integrated geospatial and multicriteria framework offers a validated and replicable foundation for hydropower site assessment in Central Africa. This study supports strategic energy planning by identifying priority areas for further detailed investigation and development, while underscoring the need for future studies to incorporate dynamic hydrological modeling and socio-environmental considerations to ensure sustainable hydropower development.
Conclusion
This study employed a multi-criteria suitability analysis (MCSA) framework, integrating multiple geospatial parameters weighted through the Analytical Hierarchy Process (AHP), to assess hydropower site suitability across the Central African Power Pool (CAPP) region. The AHP methodology provided a systematic approach to assign relative importance to key factors, including drainage density, flow accumulation, elevation, slope, rainfall, soil texture, geology, land cover, and stream power index, thus directly influencing the composite suitability scores and final classification of potential hydropower sites.
The results demonstrate that approximately 74.07% of the CAPP area falls within moderate to very high suitability classes, effectively identifying regions with favorable conditions for hydropower development. This outcome directly addresses the research objective of evaluating hydroelectric siting suitability by quantitatively synthesizing spatial data into actionable insights. Country-level analyses reveal significant variability in suitability, with Congo, Gabon, and Cameroon exhibiting the highest proportions of suitable areas.
Validation of the suitability map against existing hydropower infrastructure confirms the coherence and reliability of the methodology, reinforcing confidence in the spatial predictions. Sensitivity analyses further demonstrate the robustness of the results to variations in AHP weights, underscoring the methodological rigor. Statements regarding offshore hydropower potential have been excluded from this conclusion, as such analyses were beyond the scope of the applied methods and data.
While approximately 74.07% of the Central African Power Pool (CAPP) region is classified as moderately to highly suitable for hydropower development based on physical and environmental parameters, this assessment does not incorporate socio-economic, ecological, or transboundary constraints. Factors such as infrastructure availability, environmental protection, social acceptance, and regional cooperation can significantly influence the feasibility of hydropower projects. Therefore, the suitability percentages reported here should be interpreted with caution, recognizing that comprehensive feasibility assessments require integration of these additional considerations.
In summary, this study provides a validated, replicable geospatial framework for hydropower site assessment that aligns with the research question and offers valuable guidance for regional energy planning. Future work should incorporate hydrological flow dynamics and socio-environmental factors to refine the suitability assessments and support sustainable hydropower development.
Footnotes
ORCID iDs
Author contributions
All the authors contributed equally to this manuscript. All the authors have read and agreed to the published version of the manuscript.
Funding
The authors received no financial support for the research, authorship, and/or publication of this article.
Conflicts of interest
All authors declare that the research was conducted in the absence of any commercial or financial relationships that could be construed as potential conflicts of interest.
Data availability statement
The data for this study is available from the corresponding authors upon request.
Institutional review board statement
The authors declare that the content of this study complies with ethical standards and concepts. The authors confirm that this paper has not been published previously, it is not under consideration for publication elsewhere, and is not under consideration for publication elsewhere.
Author biography
Prof. Dr.