
Abstract
Hydropower is a vital renewable energy source for West Africa that addresses environmental concerns and energy security challenges. This study employed a geospatial multi-criteria decision analysis (MCDA) framework to assess hydroelectric site suitability across the West African Power Pool (WAPP). Nine biophysical parameters (drainage density, elevation, flow accumulation, geology, land cover, rainfall, slope, soil texture, and stream power index) were sourced from authoritative datasets (SRTM DEM, CHIRPS, FAO, and UNESCO/ISRIC), processed, normalized, and integrated into a Composite Appropriateness Index (CAI) within a GIS environment. The results revealed spatial variability in hydroelectric potential, with the most suitable sites characterized by moderate drainage density, low to moderate elevation (below 536 m), and dendritic flow accumulation patterns. The geology is predominantly Precambrian, with land cover dominated by bare ground and rangeland, and rainfall intensity is higher in coastal regions. Slope gradients are generally low, indicating limited potential energy head for large-scale hydropower but suitability for low-head hydropower technologies. The soil textures are mainly loamy with clay and sand components, influencing infrastructure feasibility. Validation against existing hydropower infrastructure demonstrated strong spatial correspondence, confirming the model's effectiveness for site prioritization. While this study focuses on geospatial suitability mapping, it highlights the implications for hydropower development planning in WAPP and underscores the need for future integration of dynamic hydrological and energy modeling, as well as socioeconomic and infrastructural constraints to provide a comprehensive energy potential assessment. This study offers a valuable spatial decision-support tool to guide sustainable hydropower development and regional energy planning in West Africa.
Keywords
Introduction
This study aims to identify and map optimal sites for hydroelectric power generation within the West African Power Pool (WAPP) using a geospatial multi-criteria decision analysis (MCDA) framework. The persistent warming of the Earth's surface, driven by increased greenhouse gas emissions from human activities, has intensified climate-related challenges such as floods, droughts, and rising temperatures. As part of climate change mitigation strategies, renewable energy sources have become critical, with hydro energy emerging as a clean and abundant resource capable of addressing environmental concerns and growing energy security needs in West Africa.
Energy generation and distribution remain significant challenges across the African continent, impeding robust socioeconomic growth and development. Despite Africa's relatively low contribution to global greenhouse gas emissions, its energy sector accounts for a substantial share of these emissions. Sub-Saharan Africa struggles with limited power generation capacity and energy poverty, underscoring the need for sustainable and diversified energy solutions. The WAPP, comprising thirteen member nations, plays a strategic role in improving electricity access and reliability through regional cooperation, targeting ambitious goals of 100% electrification and 48% renewable energy by 2030.
Hydropower currently represents a vital energy source within the WAPP, yet a comprehensive understanding of the region's hydroelectric potential, considering geospatial and environmental factors, remains limited. This study addresses this gap by conducting a geospatial analysis of hydro energy site suitability across the WAPP region. The central research question guiding this work is: Which geospatial factors most significantly influence hydroelectric site suitability within the WAPP, and where are the optimal locations for hydropower development? We hypothesize that integrating parameters such as drainage density, elevation, flow accumulation, geology, land cover, rainfall, slope, soil texture, and stream power index through a Composite Appropriateness Index (CAI) will effectively delineate areas with high hydroelectric potential.
By employing GIS-based spatial analysis and an MCDA approach, this study systematically evaluates multiple biophysical parameters to quantify and map the spatial variability of hydroelectric suitability. The findings aim to provide decision-makers with a geospatial tool to prioritize hydroelectric development sites, support regional energy planning, and contribute to the sustainable development goals in West Africa. This study builds upon the existing literature by synthesizing diverse environmental datasets and applying a robust analytical framework tailored to the unique hydro-energy landscape of the WAPP region.
Literature review
Hydropower plays a critical role in addressing electrification challenges and promoting sustainable development across West Africa, particularly in the West African Power Pool (WAPP). The region's rural areas face significant energy deficits, and investment in renewable energy infrastructure, especially hydropower, offers a dual benefit: enhancing electricity access and supporting environmental sustainability through low greenhouse gas emissions. Therefore, a comprehensive assessment of hydro-energy potential that integrates hydrological, topographical, and socioeconomic factors is essential to optimize site selection and project viability within WAPP (ESMAP, 2023).
The hydrological regime, including river flow variability, rainfall-runoff dynamics, and evapotranspiration patterns, fundamentally determines hydropower potential across WAPP countries. Studies have revealed significant spatial variability in water balance components; for example, southern Senegal and Mali exhibit approximately 15% of rainfall generating runoff, while the central and northern regions demonstrate much lower runoff due to high evapotranspiration rates (Poyry Energy GmbH and ECOWAS Centre for Renewable Energy and Energy Efficiency (ECREEE), 2016a). Similar patterns are observed in Burkina Faso, Guinea, and The Gambia, where evapotranspiration often exceeds 80% of rainfall, limiting surface water availability for hydropower (Adama Nombré, Complementarities and synergies with intermittent renewable energy, related issues - Burkina Faso cases studies, 2022)(Adama Nombre, 2022); (THE GAMBIA).To capture this variability and support site viability assessment, hydrological modeling approaches such as the HBV-light model, ARIMA time series forecasting, and hydrological ensemble forecasting systems (HEFSs) have been effectively applied. For instance, the HBV-light model was calibrated for the Bafing River catchment to generate robust daily rainfall predictions (Didier Maria Ndione, 2020), while ARIMA-based perturbations improved rainfall ensemble forecasts (Energy, 2013) Moreover, the integration of GIS and remote sensing data further enhances spatial assessment of hydrological parameters, enabling detailed water balance analysis and runoff estimation critical for hydro-energy site evaluation (Poyry Energy GmbH and ECOWAS Centre for Renewable Energy and Energy Efficiency (ECREEE), 2016b).
Beyond hydrological and environmental factors, technical feasibility and socioeconomic considerations are vital in hydropower development. Key technical parameters such as flow rates, dam height, net head, and discharge capacity vary across micro and large-scale projects within WAPP. For example, the Souapiti dam in Guinea features a 130 m earth-fill dam with a 120 m head and 4500 m3/s spillway capacity (Amadou Sidibe, 2021; A. Dejoux, 2009), whereas micro-hydropower feasibility studies report total drop heights around 19 m with flow rates near 290 m3/s (Amadou Sidibe, 2021). Software tools like RETScreen facilitate the sizing and structural design process by integrating meteorological, geological, and topographical data, supporting comprehensive feasibility analyses (Amadou Sidibe, 2021). Socioeconomic impacts and energy contributions of hydropower infrastructure are significant within WAPP; existing facilities such as the Manantali dam supply approximately 12% of Senegal's electricity (Didier Maria Ndione, 2020), while Ghana's Akosombo and Kpong dams collectively produce about 1060 MW, fulfilling 80% of national demand (Mawusi Amenuvor, 2020). These infrastructures underpin regional energy security and demonstrate the importance of integrating technical design with socioeconomic considerations in planning.
WAPP countries exhibit diverse hydropower capacities reflecting their geographical and climatic variability. Aggregate installed capacities include approximately 1988 MW in Nigeria, 1180 MW in Ghana, 605 MW in Côte d'Ivoire, and smaller but growing capacities in countries like Guinea (127 MW), Mali (155 MW), and Burkina Faso (29 MW) (Energy, 2013) (Poyry Energy GmbH and ECOWAS Centre for Renewable Energy and Energy Efficiency (ECREEE), 2016c).
Many countries are undertaking expansions or renovations of existing stations, yet data gaps and inconsistencies remain, particularly in small-scale and mini-hydropower sectors. Consequently, the integration of geospatial and hydrological data is imperative to address these gaps and optimize hydro-energy resource allocation across the region (Energy, 2013) (Poyry Energy GmbH and ECOWAS Centre for Renewable Energy and Energy Efficiency (ECREEE), 2016d).
The literature highlights a variety of methodological frameworks that inform hydro-energy suitability assessments. Hydrological models such as HBV-light, coupled with statistical forecasting methods including ARIMA and kernel dressing techniques, improve the accuracy of rainfall and runoff predictions ( (Didier Maria Ndione, 2020); ((Energy, 2013)). Hydrological ensemble forecasting systems provide probabilistic inputs that enhance decision-making under uncertainty ((Energy, 2013) GIS and remote sensing technologies enable high-resolution spatial analysis of hydrological parameters and terrain features, facilitating comprehensive geospatial evaluations of hydropower potential ((Energy, 2013) (Poyry Energy GmbH and ECOWAS Centre for Renewable Energy and Energy Efficiency (ECREEE), 2016e). These integrated approaches support the analytical workflow of hydro-energy suitability by enabling multi-criteria evaluation of site viability, incorporating hydrologicsal variability, topographical constraints, and socioeconomic factors. Enhancements such as ensemble forecast quality improvements and spatial data integration underpin robust and scalable assessment frameworks suitable for WAPP's diverse contexts (Didier Maria Ndione, 2020; Poyry Energy GmbH and ECOWAS Centre for Renewable Energy and Energy Efficiency (ECREEE), 2016f).
In summary, the reviewed literature underscores the complexity and regional variability of hydropower potential within WAPP, shaped by hydrological regimes, environmental conditions, technical parameters, and socioeconomic contexts. While numerous studies provide valuable hydrological and infrastructural data, there remains a need for updated, harmonized datasets and integrated modeling frameworks that combine hydrological, geospatial, and socioeconomic dimensions. This synthesis informs the current study's approach to evaluating hydro-energy suitability, emphasizing comprehensive, multi-faceted analyses to optimize hydropower development and support sustainable electrification goals across West Africa (ESMAP, 2023; Poyry Energy GmbH and ECOWAS Centre for Renewable Energy and Energy Efficiency (ECREEE), 2016g) Table 1.
Study area.

Methodology
The study area
The study focuses on the West African Power Pool (WAPP) region, encompassing thirteen member countries: Benin, Burkina Faso, Ghana, Guinea, Guinea Bissau, Ivory Coast, Mali, Niger, Nigeria, The Gambia, Togo, Senegal, and Sierra Leone. The geographical extent spans latitudes 1.58°N to 25.00°N and longitudes 17.57°W to 15.95°E, covering diverse topographical, climatic, and environmental conditions relevant to hydroelectric potential assessment Figure 1.
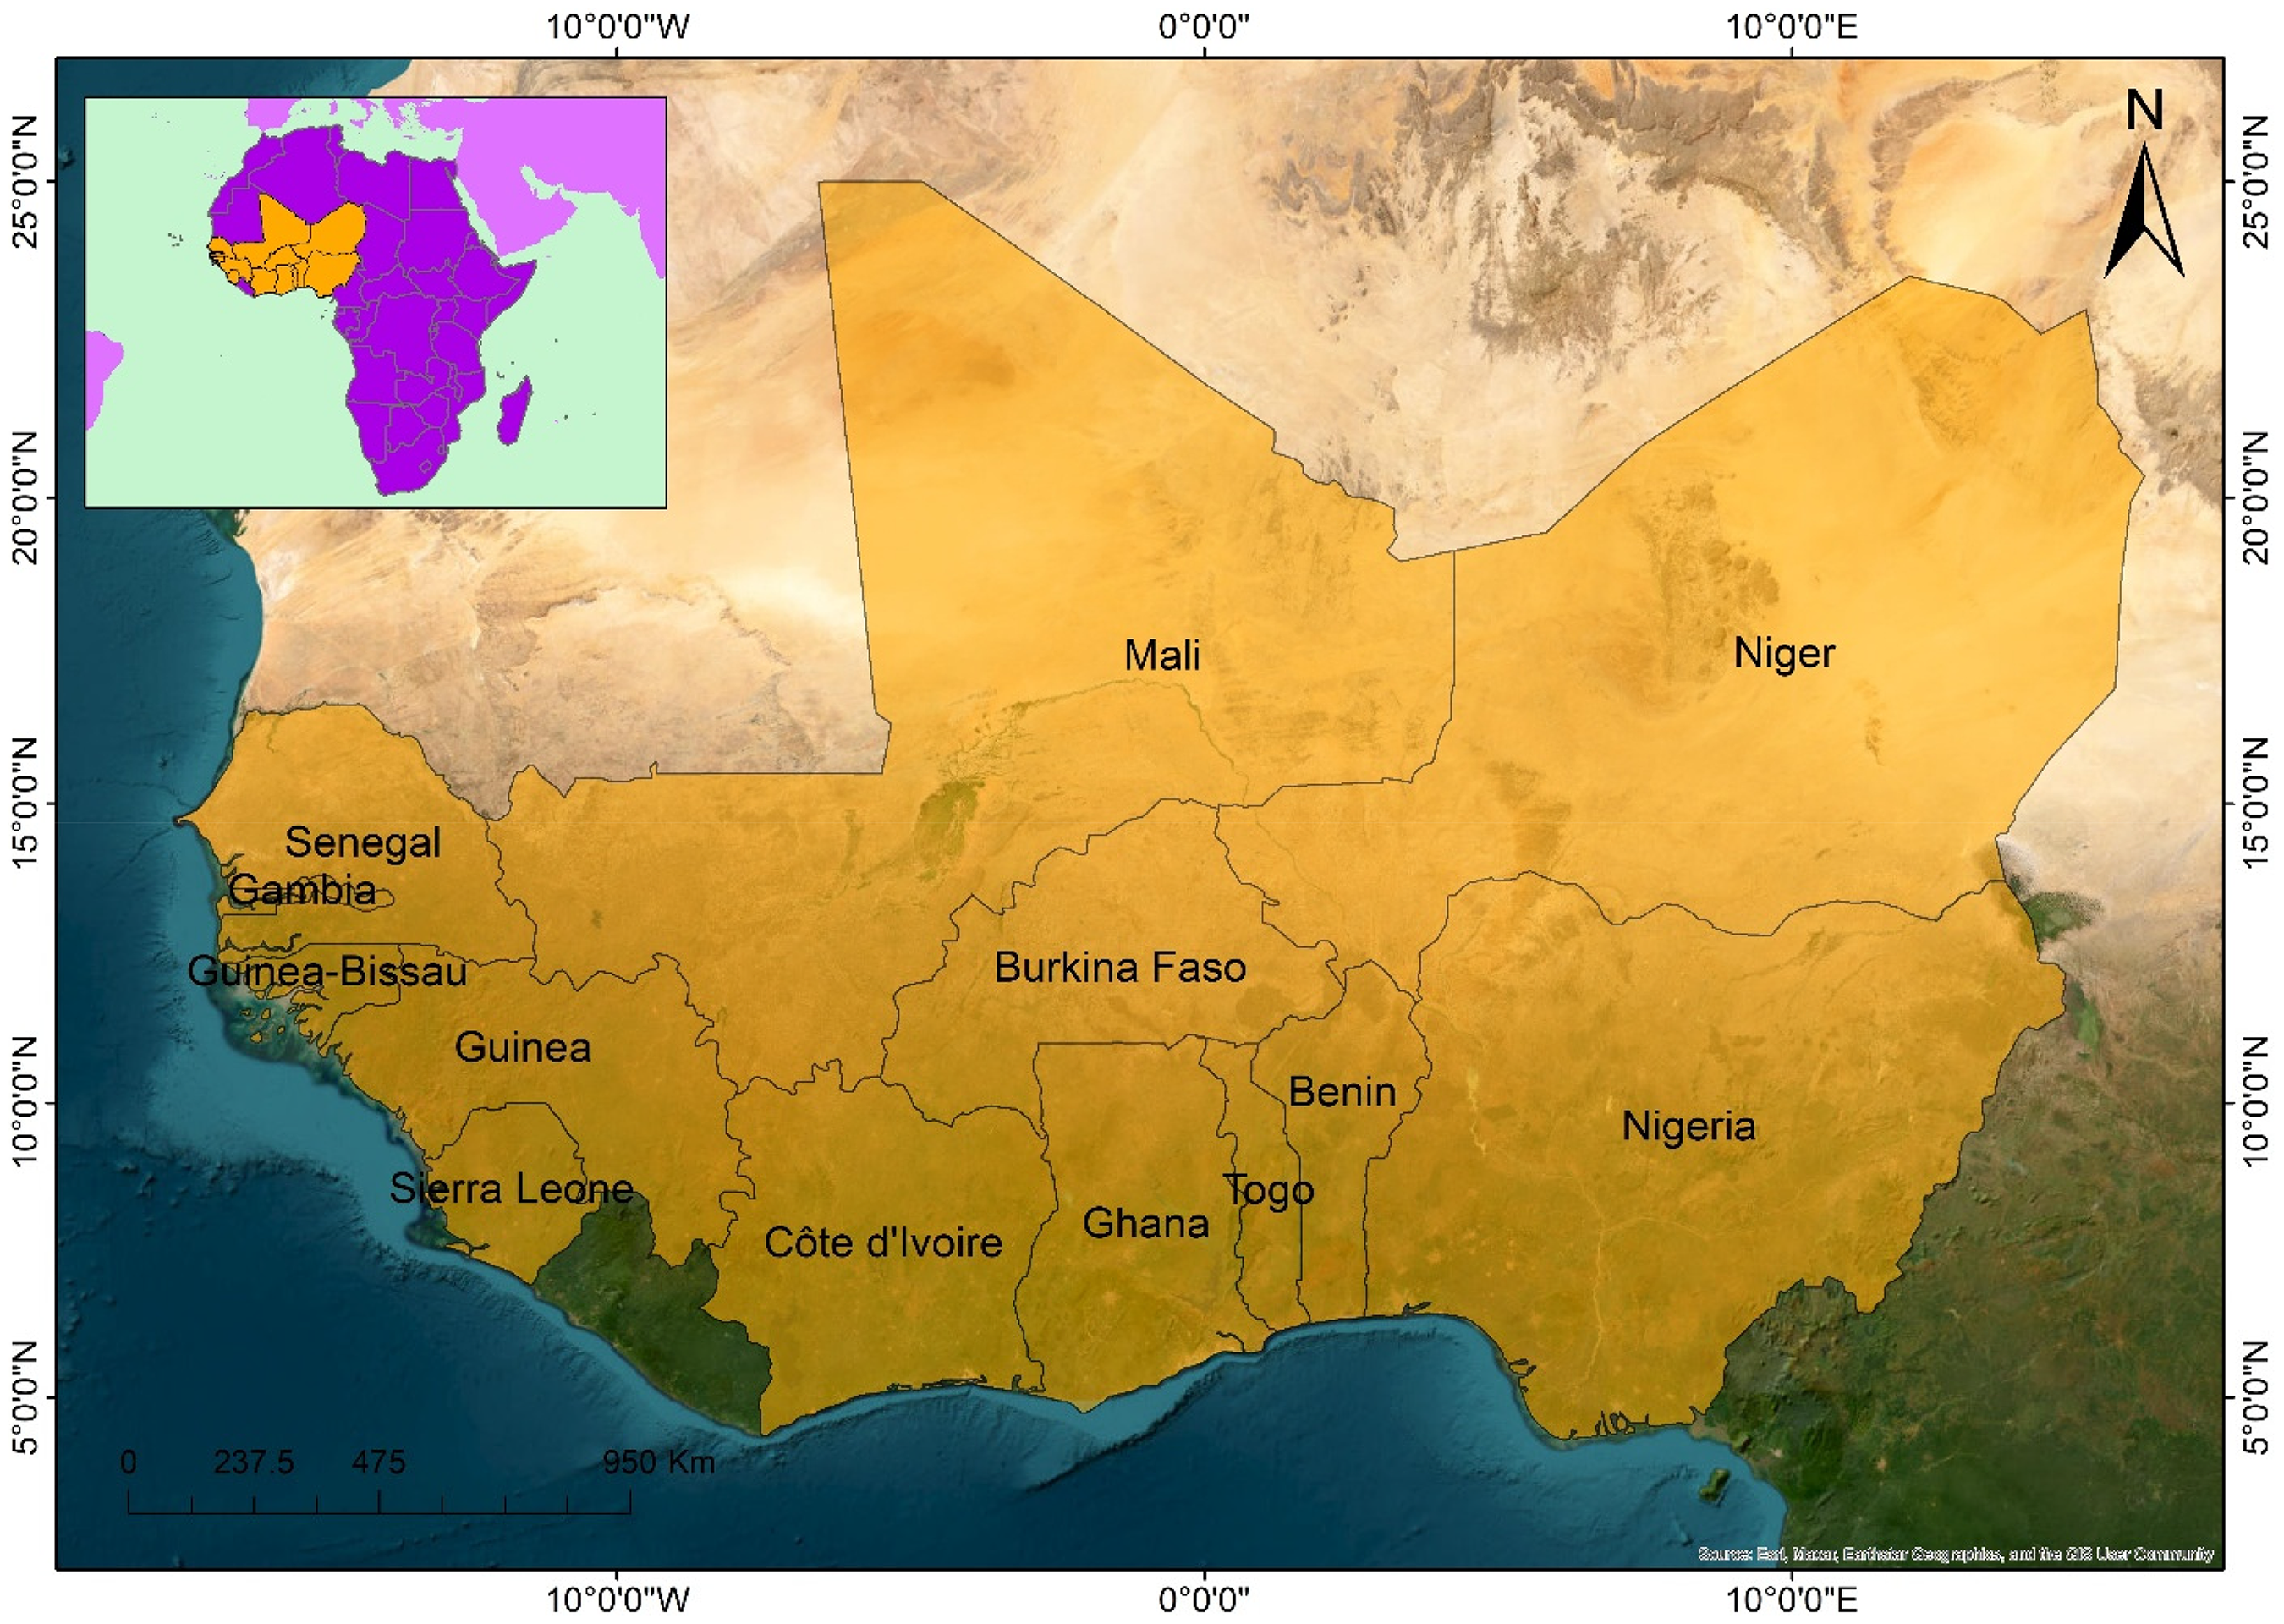
Study area map.
Data collection and sources
Spatial datasets were sourced from authoritative repositories to ensure precision, validity, and reliability. Key parameters and their data sources include:ss Table 2.
Key parameters and their data sources.
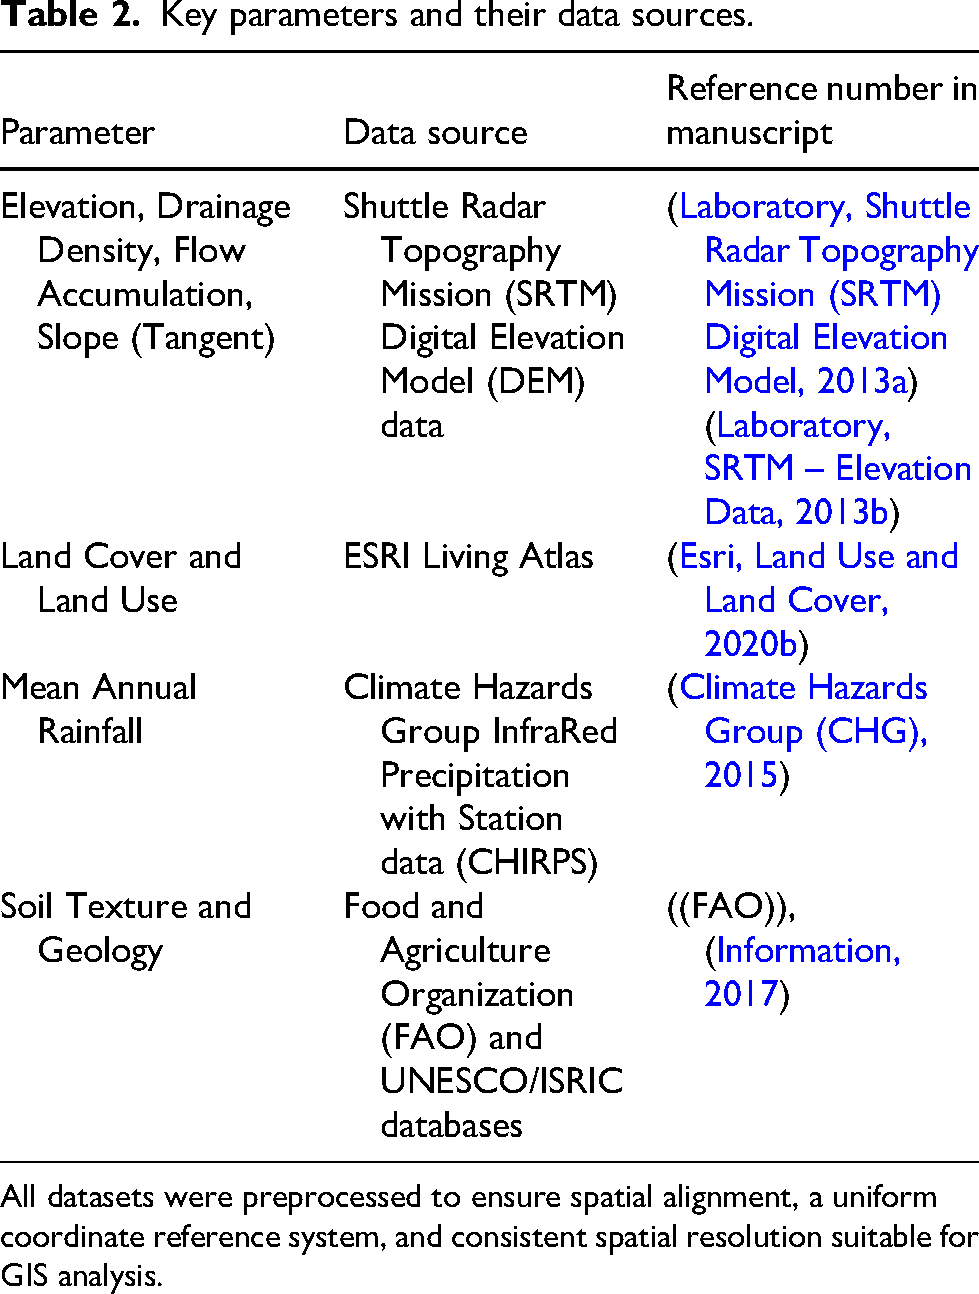
All datasets were preprocessed to ensure spatial alignment, a uniform coordinate reference system, and consistent spatial resolution suitable for GIS analysis.
Parameter selection and justification
Nine biophysical parameters were selected based on their established influence on hydroelectric potential and supported by literature and expert consultation: drainage density, elevation, flow accumulation, geology, land cover, rainfall, slope (tangent), soil texture, and stream power index (SPI). Each parameter reflects a critical aspect of hydropower feasibility, such as runoff availability (drainage density), potential energy head (elevation and slope), geological stability (geology), environmental constraints (land cover), water availability (rainfall), soil properties affecting infrastructure (soil texture), and erosive power of streams (SPI).
Data processing and normalization
To ensure comparability across parameters with different units and scales, all raster layers were normalized using min-max normalization:
Where:
This scales each parameter to a 0–1 range, facilitating integration into the composite index.
Weighting scheme and composite appropriateness Index (CAI)
Weights were assigned to each parameter to reflect their relative importance in influencing hydroelectric suitability. Weight derivation involved comprehensive literature review and expert elicitation tailored to the WAPP context. Table 3 summarizes the normalized weights:
Normalized weights.

The Composite Appropriateness Index (CAI) for each spatial unit was computed as a weighted sum of normalized parameters:
Where:
This aggregation produced a continuous suitability surface representing the hydroelectric potential.
Addressing multicollinearity and parameter redundancy
Pearson correlation analysis was conducted to detect potential multicollinearity among parameters, notably between elevation and slope. Parameters with high correlation coefficients (>0.7) were examined, and weights were adjusted to minimize redundancy while preserving their distinct contributions. For instance, elevation and slope were assigned to complementary weights to reflect their unique influences on potential energy and water flow velocity.
Sensitivity analysis
The sensitivity analysis (±10% weight variation) revealed that the model is most sensitive to changes in Rainfall and Elevation weights. A 10% increase in the weight of Rainfall expanded the ‘High’ suitability class in coastal regions by approximately 4.2%, while a similar increase in Elevation weight shifted suitability clusters toward the Guinea Highlands. Despite these fluctuations, the spatial core of ‘High’ suitability zones remained consistent across 92% of the study area, confirming that the CAI provides a stable prioritization framework regardless of minor weighting uncertainties.
GIS integration and suitability mapping
All normalized and weighted parameter layers were integrated within a GIS environment using raster calculator tools. The CAI raster was generated to produce a hydroelectric suitability map for the WAPP region. Suitability classes (e.g., high, moderate, low) were defined based on CAI value thresholds to facilitate interpretation and decision-making.
Validation
Suitability results were validated by spatially overlaying the CAI map with existing hydropower infrastructure locations across WAPP countries. Correspondence between high suitability zones and operational hydropower plants was analyzed to assess model accuracy. Additionally, comparisons were made with prior regional hydropower assessments to contextualize findings and identify discrepancies.
Results and discussion
Overall hydroelectric suitability assessment
The integration of nine biophysical parameters into the Composite Appropriateness Index provides a differentiated spatial assessment of hydroelectric potential across the WAPP region. Unlike individual parameters, the CAI identifies priority zones by balancing water availability, topographical relief, and geological stability. The results indicate that while most of the West African territory falls within “Low” to “Moderate” suitability classes, specific coastal and highland regions exhibit significant potential for hydropower development.
The quantitative distribution of these suitability classes is summarized in Table 4, which replaces the previous binary results summary. This table provides the discriminative data required to prioritize regional energy investments.
Overall hydroelectric suitability assessment.

Regional suitability mapping
The spatial distribution of these findings is visualized in Figure 2 (the Overall Western Suitability Map). The map reveals a clear latitudinal gradient: the northern Sahelian countries are dominated by “Low” suitability (exceeding 65% of their territory) due to limited rainfall and low slope (NASA, 2025). In contrast, a “suitability corridor” is evident along the southern coast, specifically in Sierra Leone and Guinea, where the intersection of high flow accumulation and moderate elevations creates optimal conditions for both large-scale and run-of-river technologies.
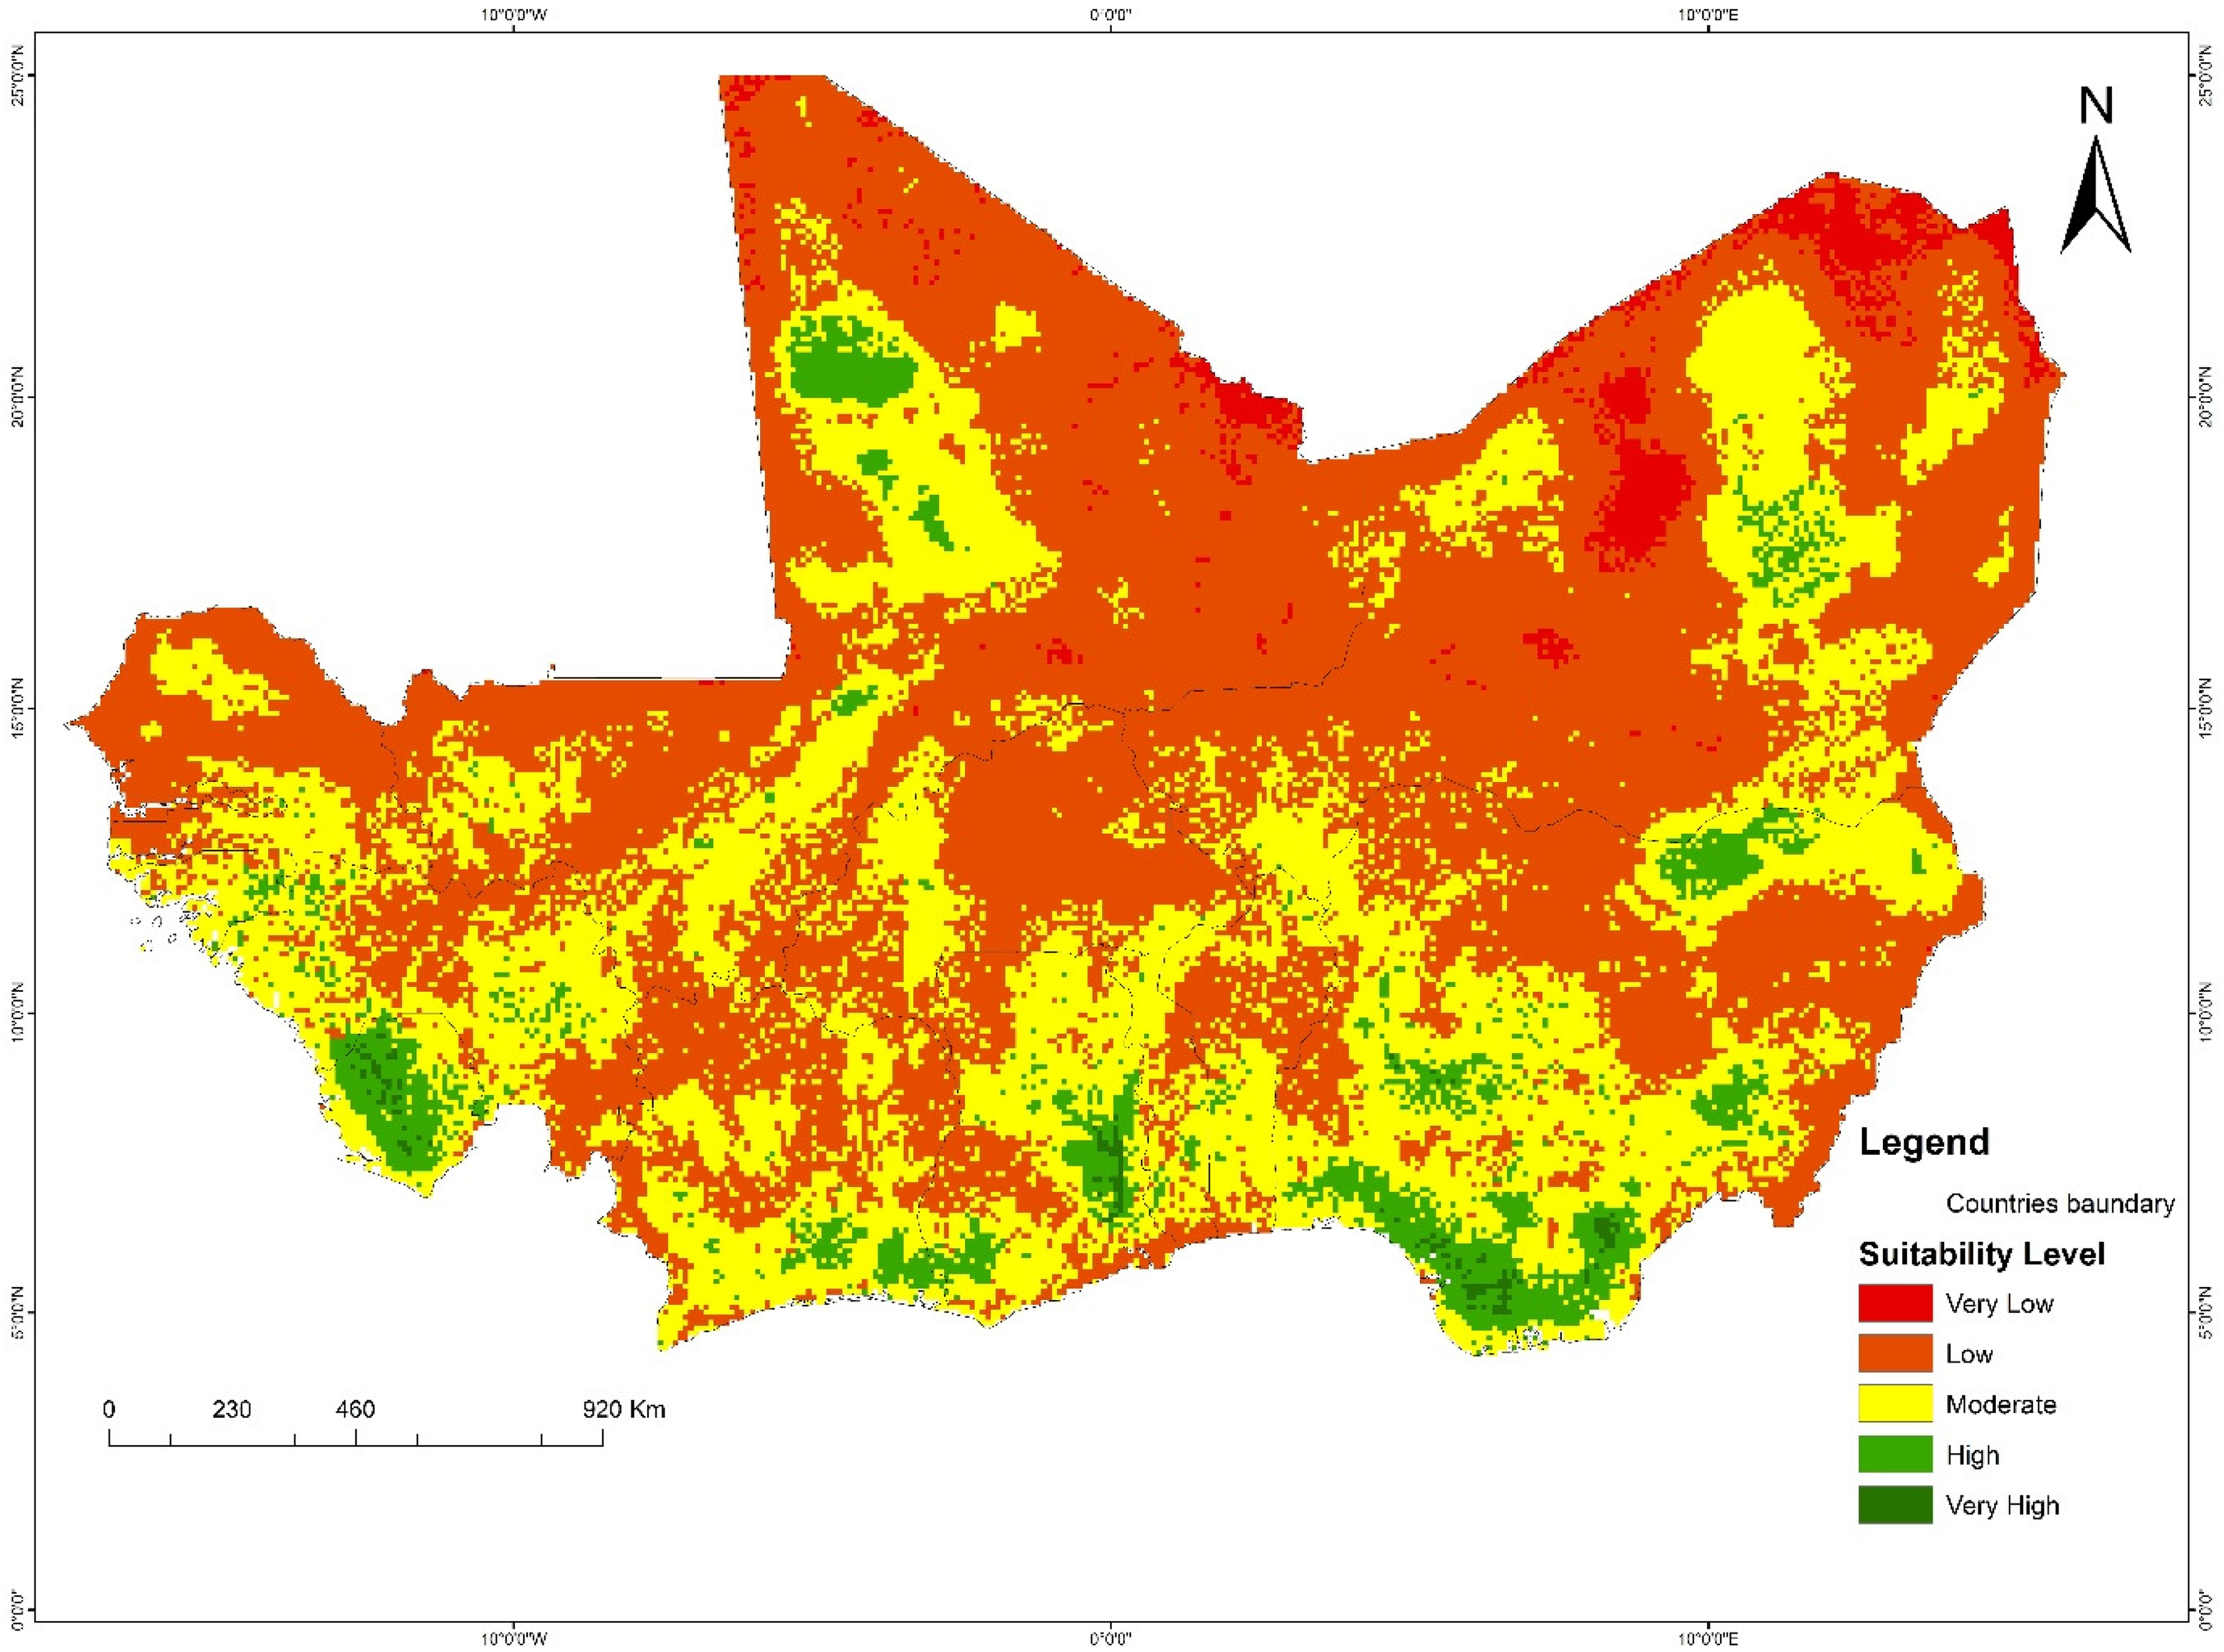
Overall Western suitability map.
Spatial characterization of individual siting criteria
The regional hydroelectric suitability summarized in the previous sections is the result of the spatial intersection of nine distinct biophysical and environmental parameters. To understand the specific drivers of suitability within each WAPP member nation, it is necessary to examine the individual distribution of these criteria.
Topographical parameters, specifically elevation and slope gradients derived from the Shuttle Radar Topography Mission, establish the physical constraints for potential energy head and determine the feasible hydropower typology differentiating between high-head storage and low-head run-of-river systems (Laboratory, SRTM – Elevation Data, 2013b; NASA, 2025). Hydrological abundance is captured through mean annual rainfall and drainage density, which reveal the water availability gradient from the humid coastal south to the arid Sahelian north ((GHG), 2015; Eresanya et al., 2017). Furthermore, the structural and environmental viability of hydroelectric sites is characterized by geology, soil texture, and land cover, which influence dam foundation safety, reservoir permeability, and potential land-use conflicts (Esri, Land Use and Land Cover, 2020b).
The following subsections (Tables 5 to 14 and Figures 6–113) provide a detailed, country-level quantitative breakdown and spatial visualization for each of these nine parameters, highlighting the unique biophysical profile of each country in the WAPP region.
Western drainage density.

West elevation.

West flow accumulation.
West geology.

West land cover.

Western rain fall.

Western slope.
Western soil texture.

Western SPI (stream power Index).

Quantitative summary of hydroelectric suitability by country (% of national territory).
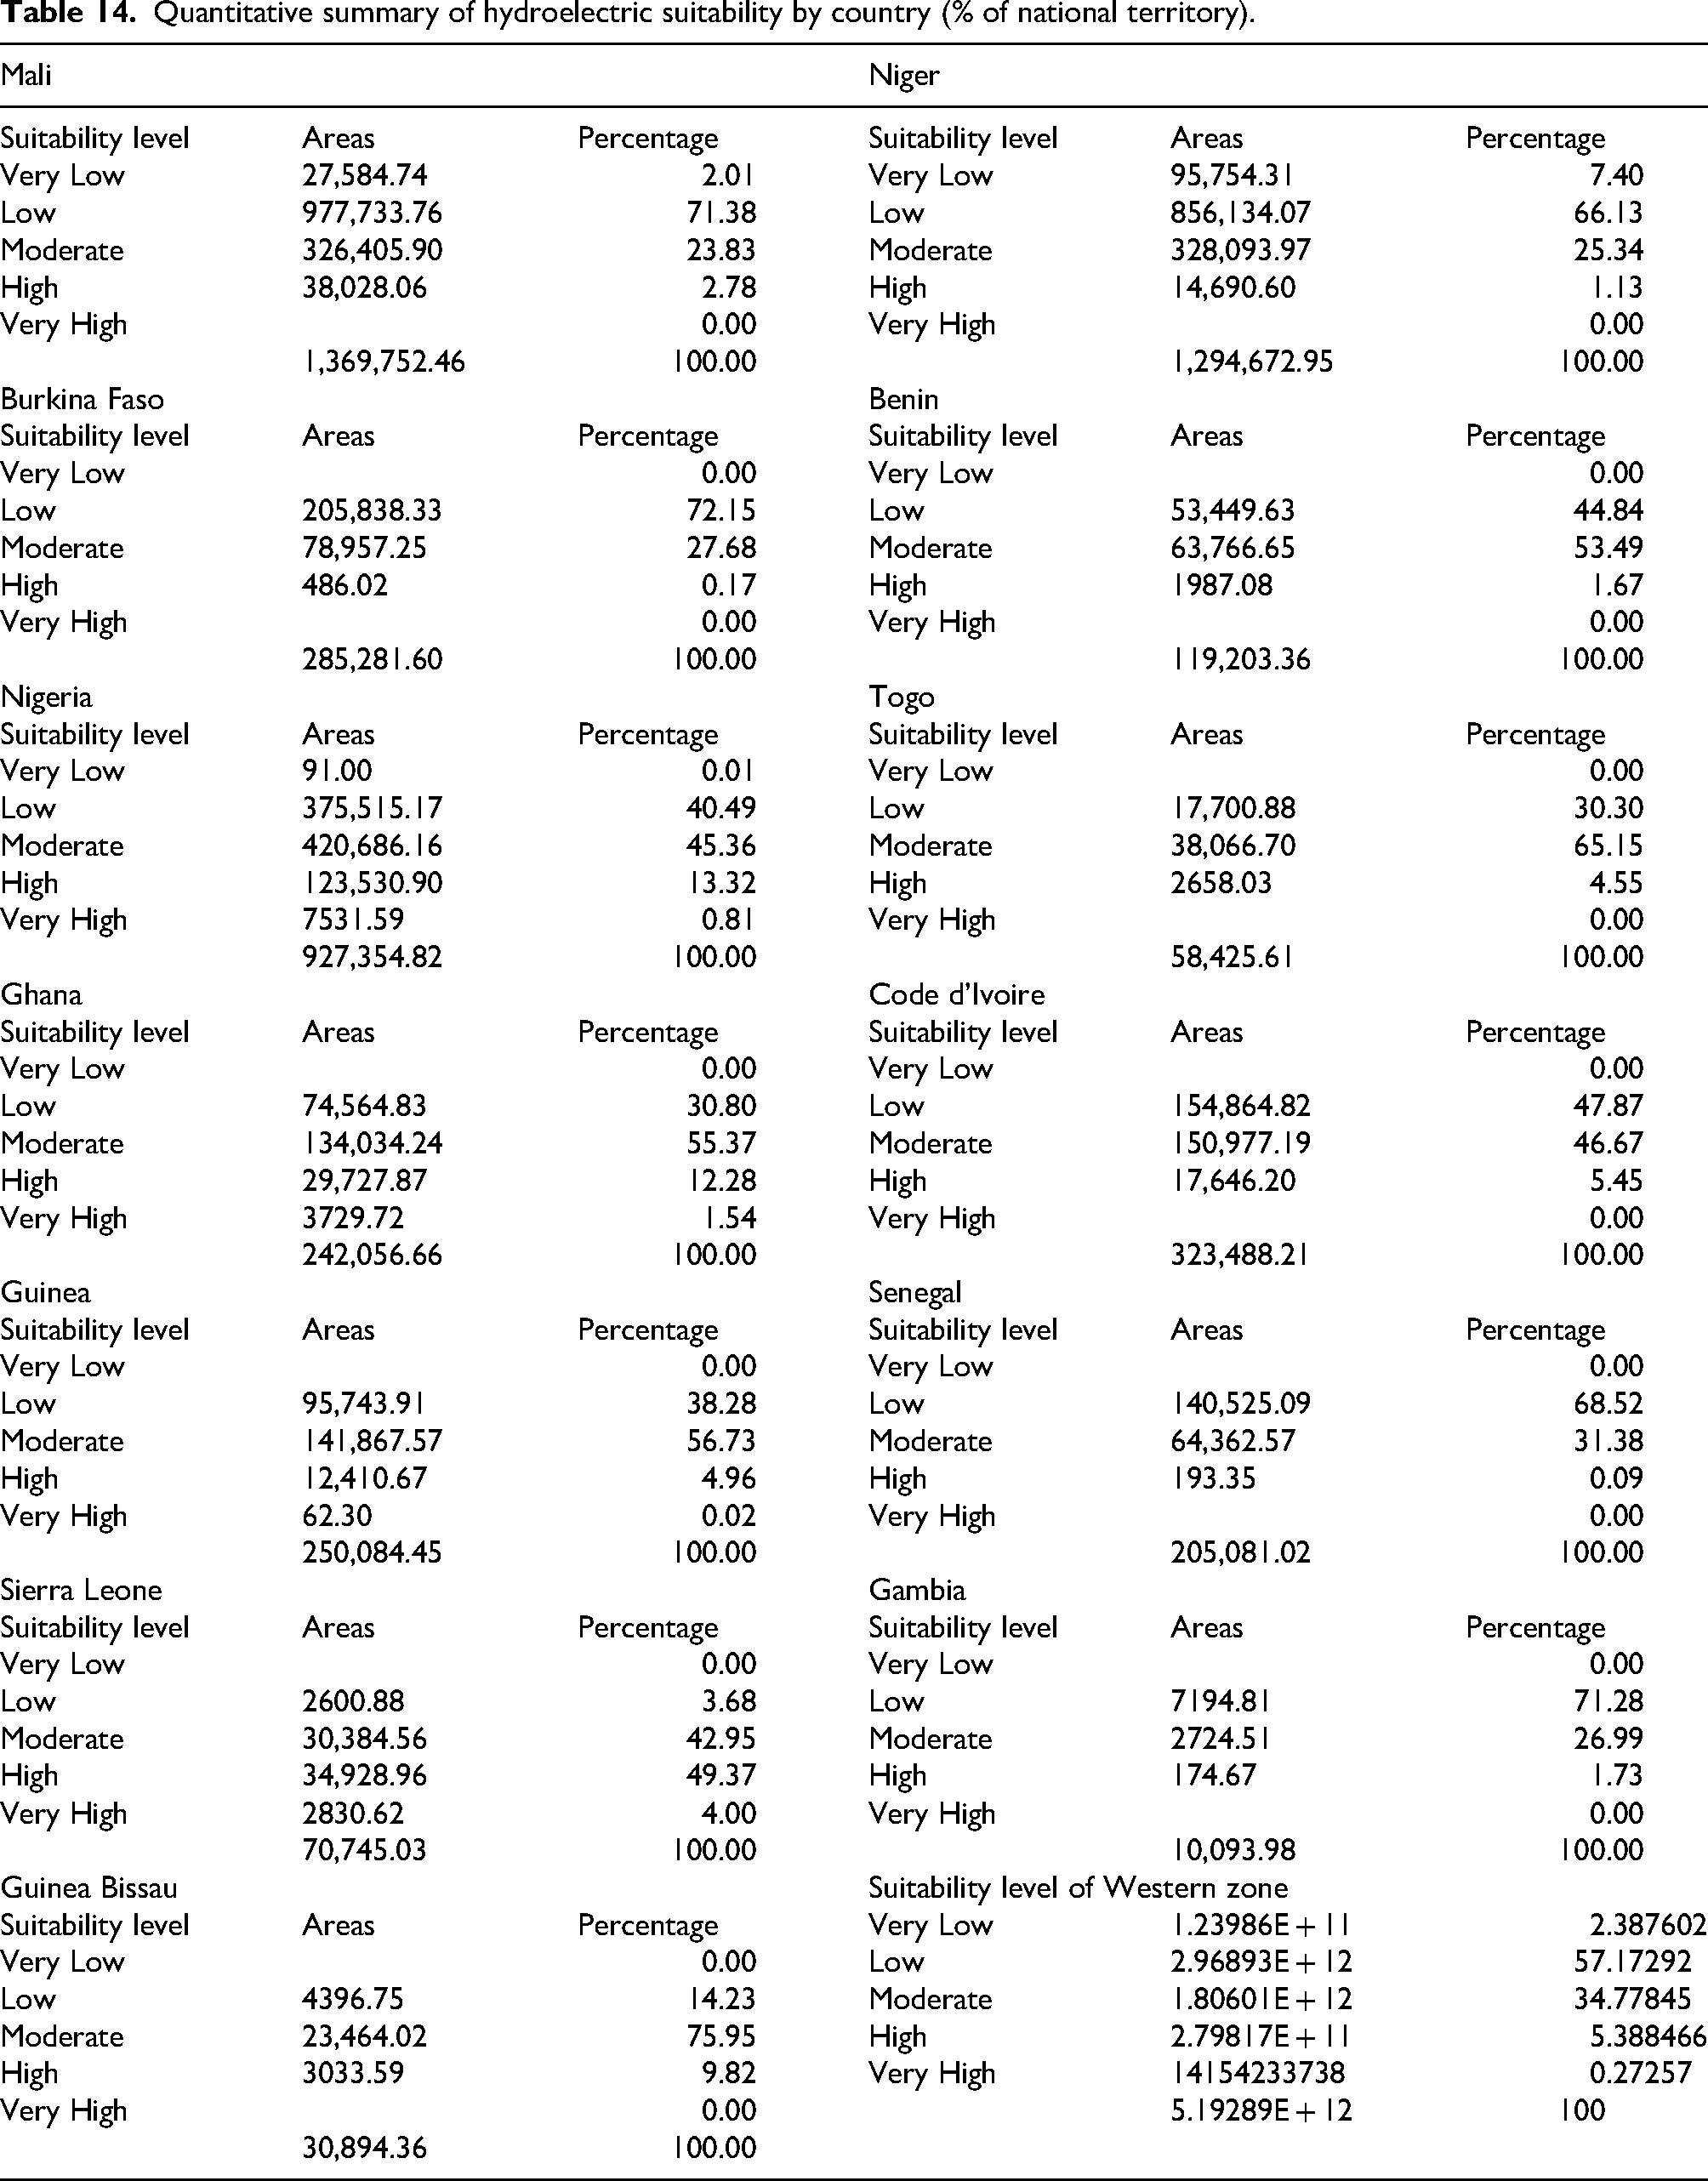
Table 5 presents the drainage density distribution across the WAPP region, ranging from 0.0 to 0.097 km/km2. Most drainage densities fall within the 0.0 to 0.046 km/km2 range. Country-specific percentages of drainage density within this range are: Mali (79.60%), Niger (67.77%), Burkina Faso (95.19%), Benin (97.53%), Nigeria (87.36%), Togo (99.68%), Ghana (95.38%), Côte d’Ivoire (100.0%), Guinea (99.74%), Senegal (99.87%), Sierra Leone (99.75%), The Gambia (100.0%), and Guinea Bissau (100.0%). illustrates a spatial mosaic characterized by predominantly low drainage density zones across the WAPP. Figure 3 presents the drainage density distribution across the WAPP.

Map of Western drainage density.
Table 6 presents the elevation distribution within the WAPP region, ranging from −24.0 m to 2359.0 m. The majority of elevations fall below 536.0 m, with country-specific percentages as follows: Mali (97.12%), Niger (79.38%), Burkina Faso (99.58%), Benin (99.36%), Nigeria (86.73%), Togo (93.14%), Ghana s(99.45%), Côte d’Ivoire (98.34%), Guinea (72.60%), Senegal (100.0%), Sierra Leone (96.32%), The Gambia (100.0%), and Guinea Bissau (100.0%). Figure 4 illustrates the spatial distribution of elevation categories, emphasizing the predominance of low-lying zones across the region.

Map of West elevation.
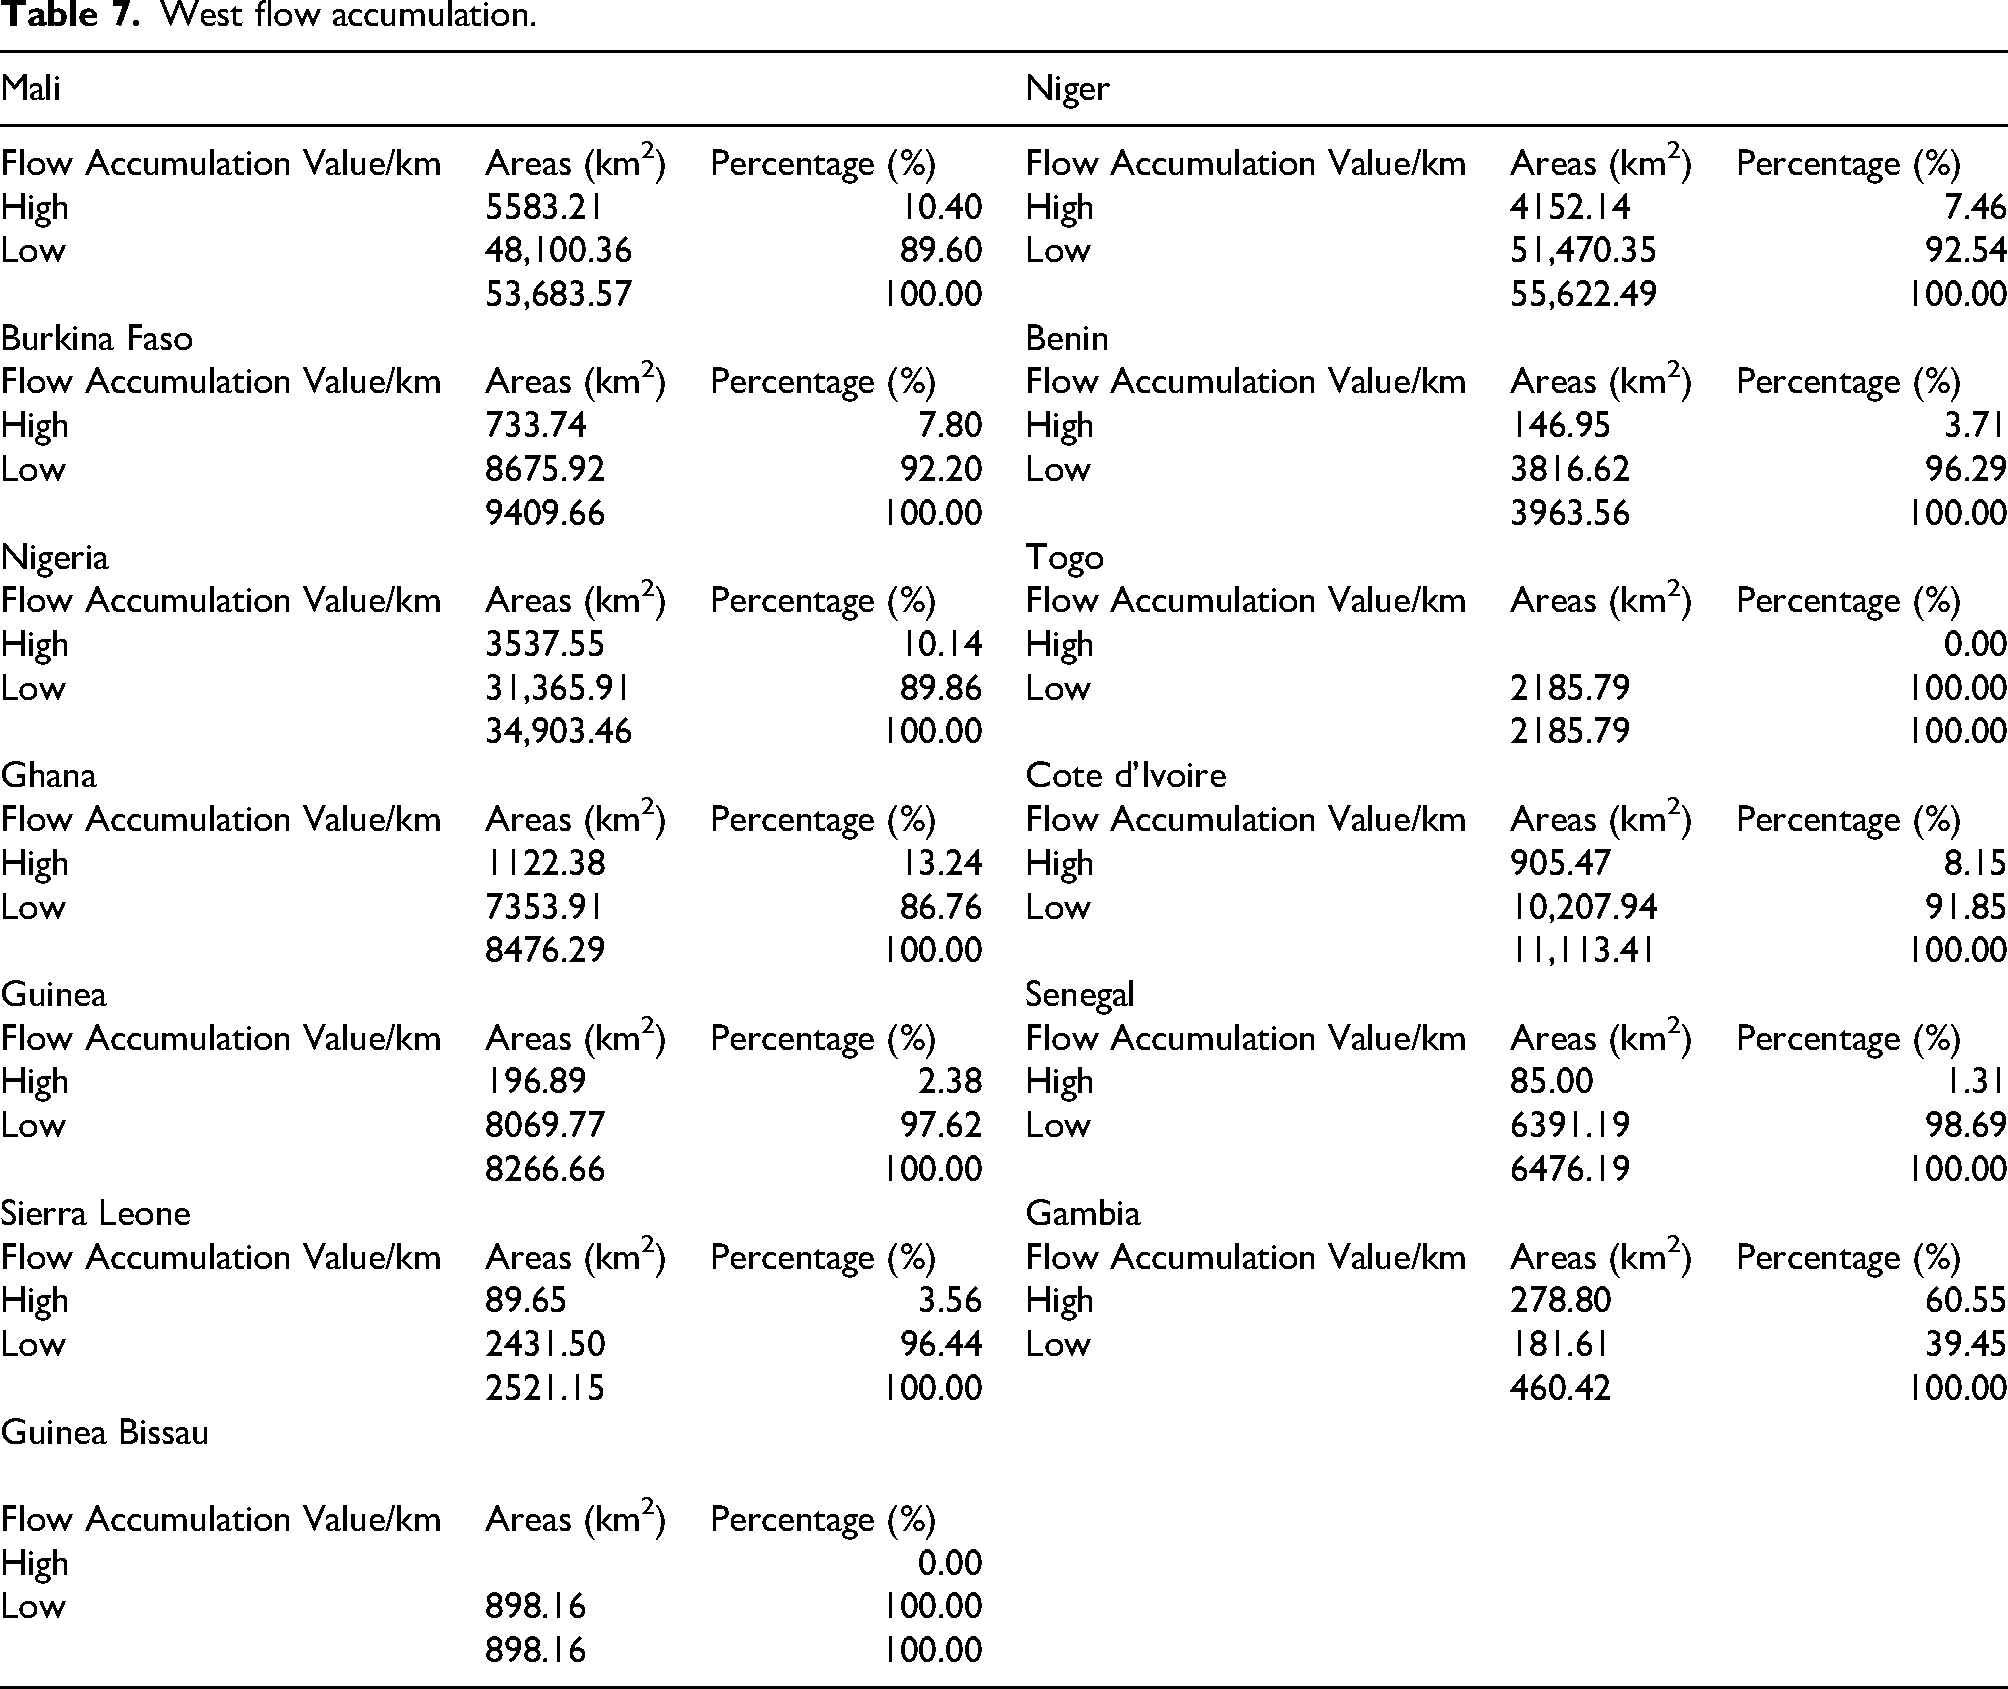
Table 7 summarizes flow accumulation values categorized as high or low across WAPP countries. Most countries exhibit a high percentage of low flow accumulation areas, including Mali (89.60%), Niger (92.54%), Burkina Faso (92.20%), Benin (96.29%), Nigeria (89.86%), Togo (100.0%), Ghana (86.67%), Côte d’Ivoire (91.85%), Guinea (97.62%), Senegal (98.69%), Sierra Leone (96.44%), and Guinea Bissau (100.0%). The Gambia stands out with 60.55% high flow accumulation. Figure 5 depicts the dendritic flow accumulation pattern characteristic of the WAPP.
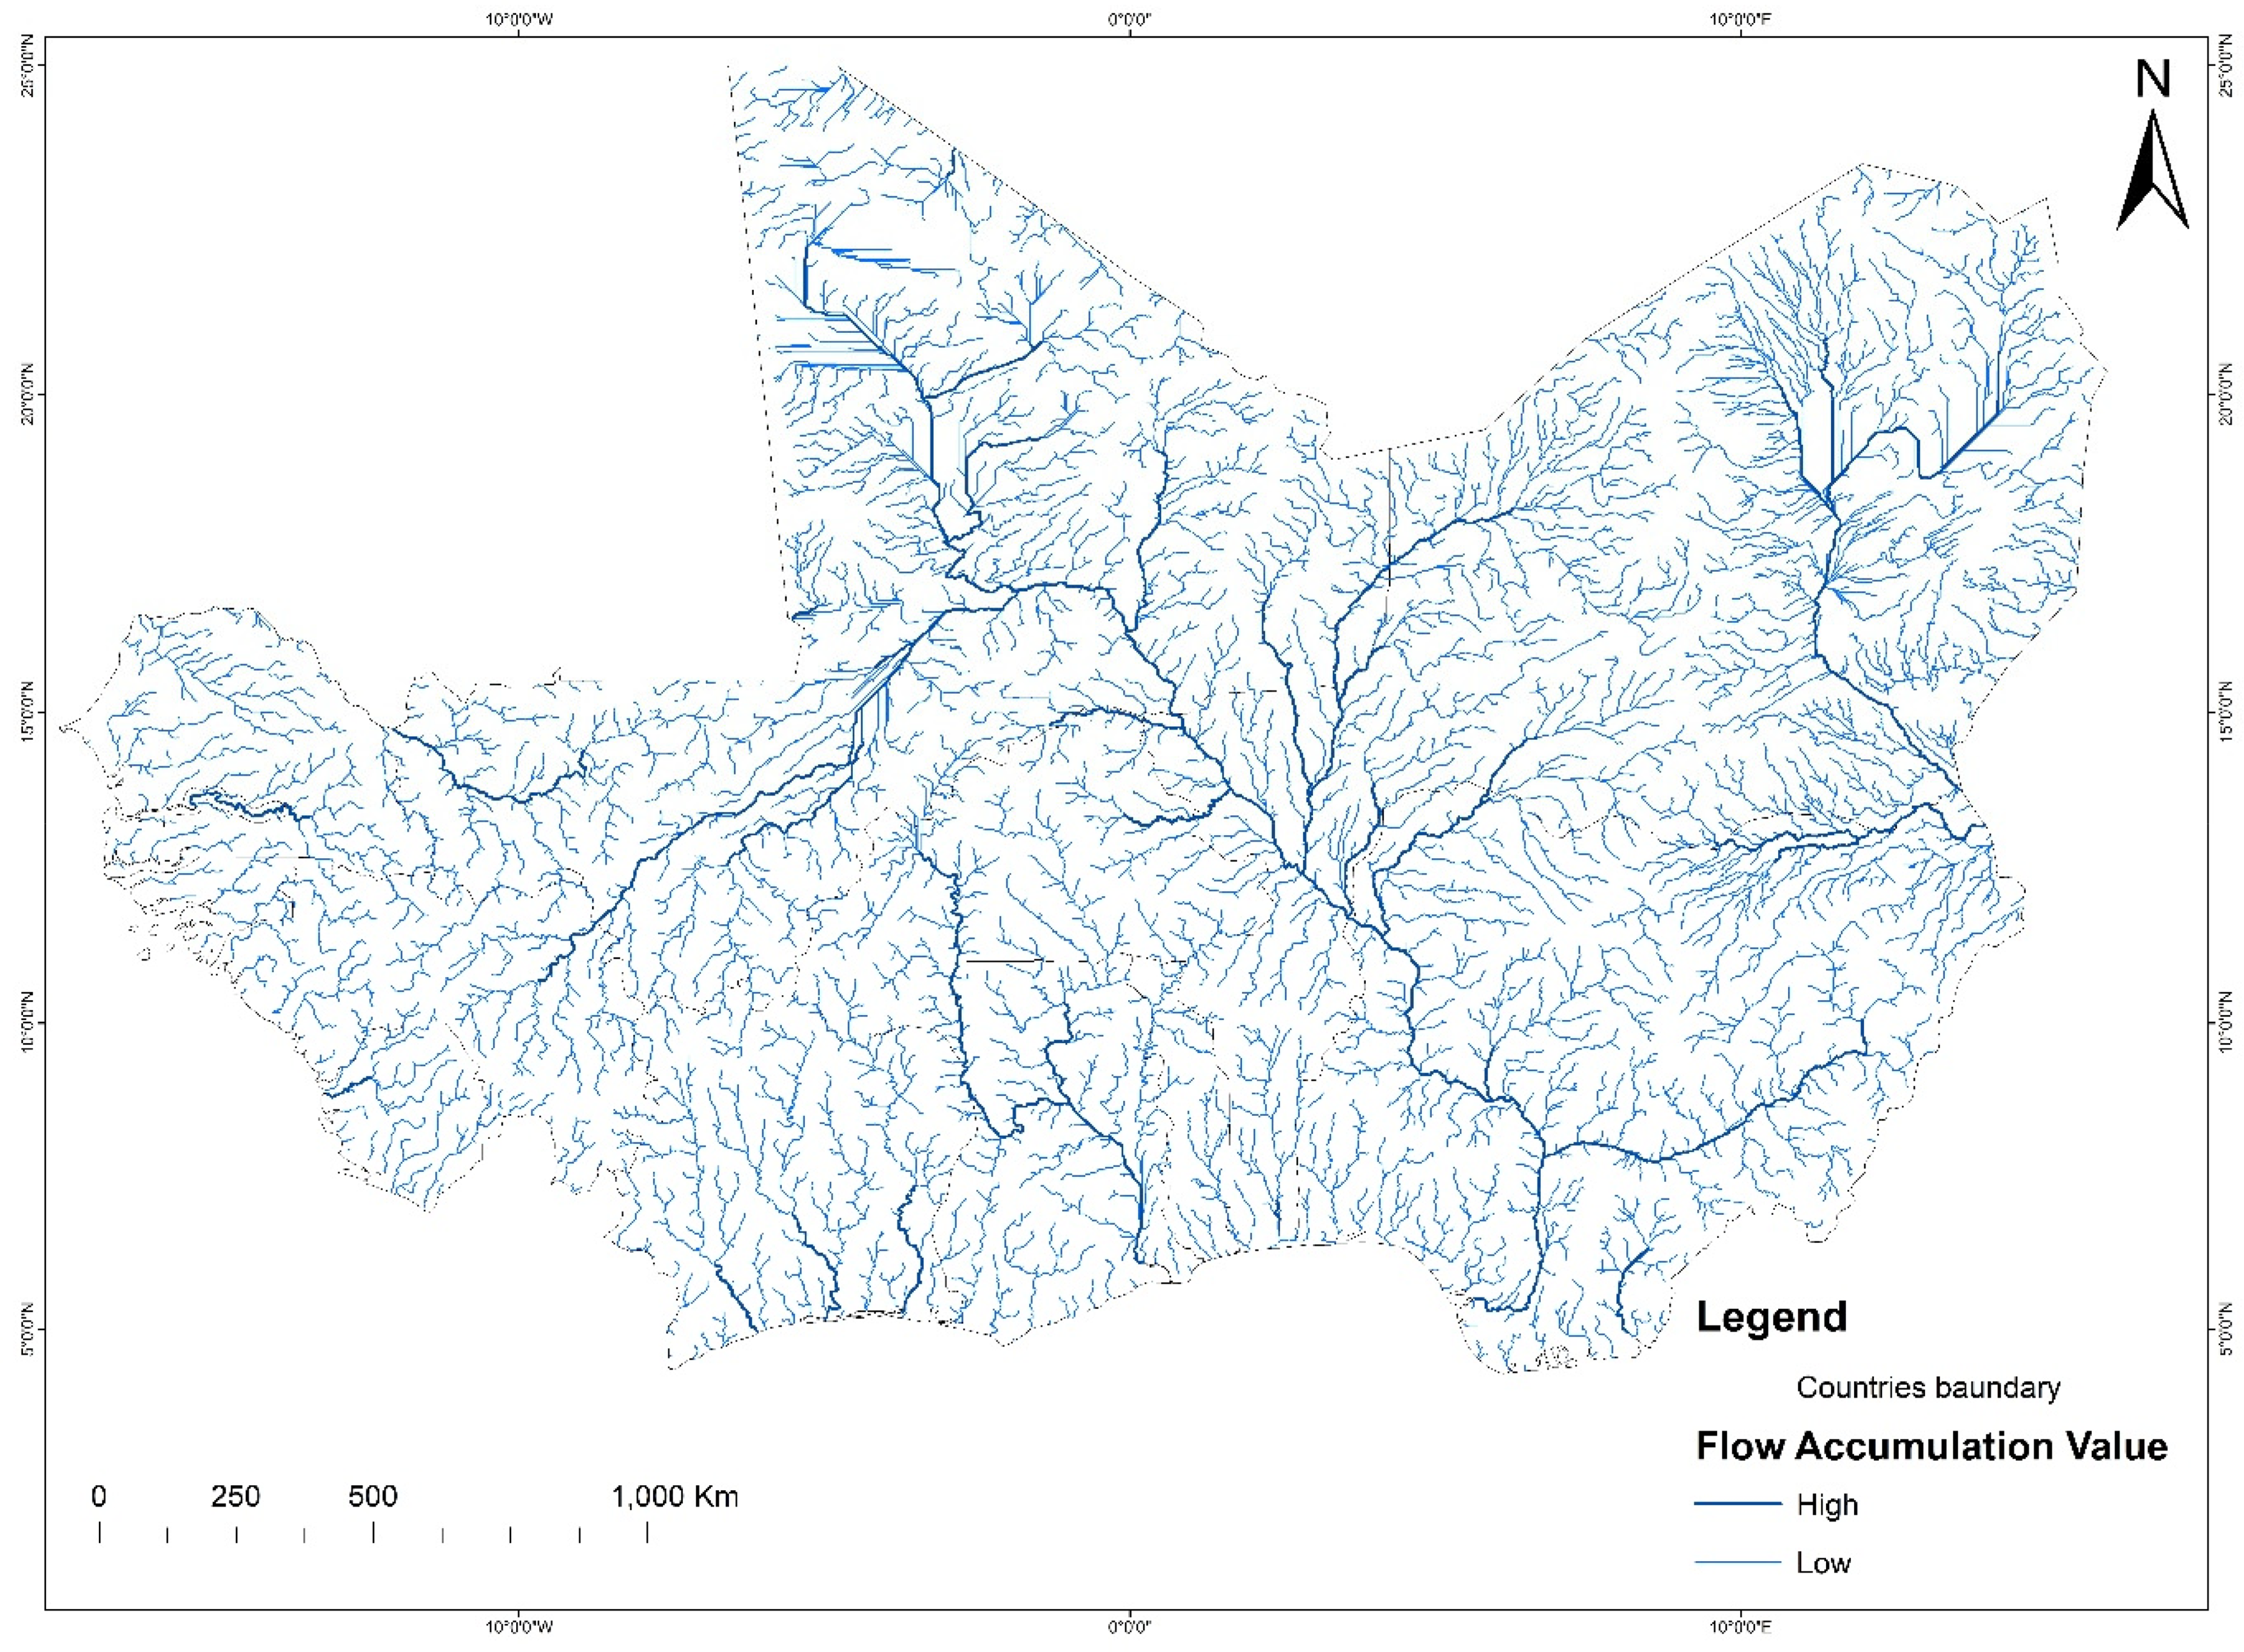
Map of West flow accumulation.
Table 8 details the geological formastions across WAPP countries, including Carboniferous, Cretaceous, Devonian, Holocene, Precambrian (undivided), and others. The most prevalent formation is Precambrian (undivided), dominating most countries except The Gambia and Guinea Bissau, which have 4.12% Precambrian geology. Other significant formations include Holocene deposits in Mali (78.54%) and Niger (82.98%), and Mesozoic-Paleozoic rocks in Benin (45.05%). Figure 6 shows the spatial distribution of these geological units across the region.
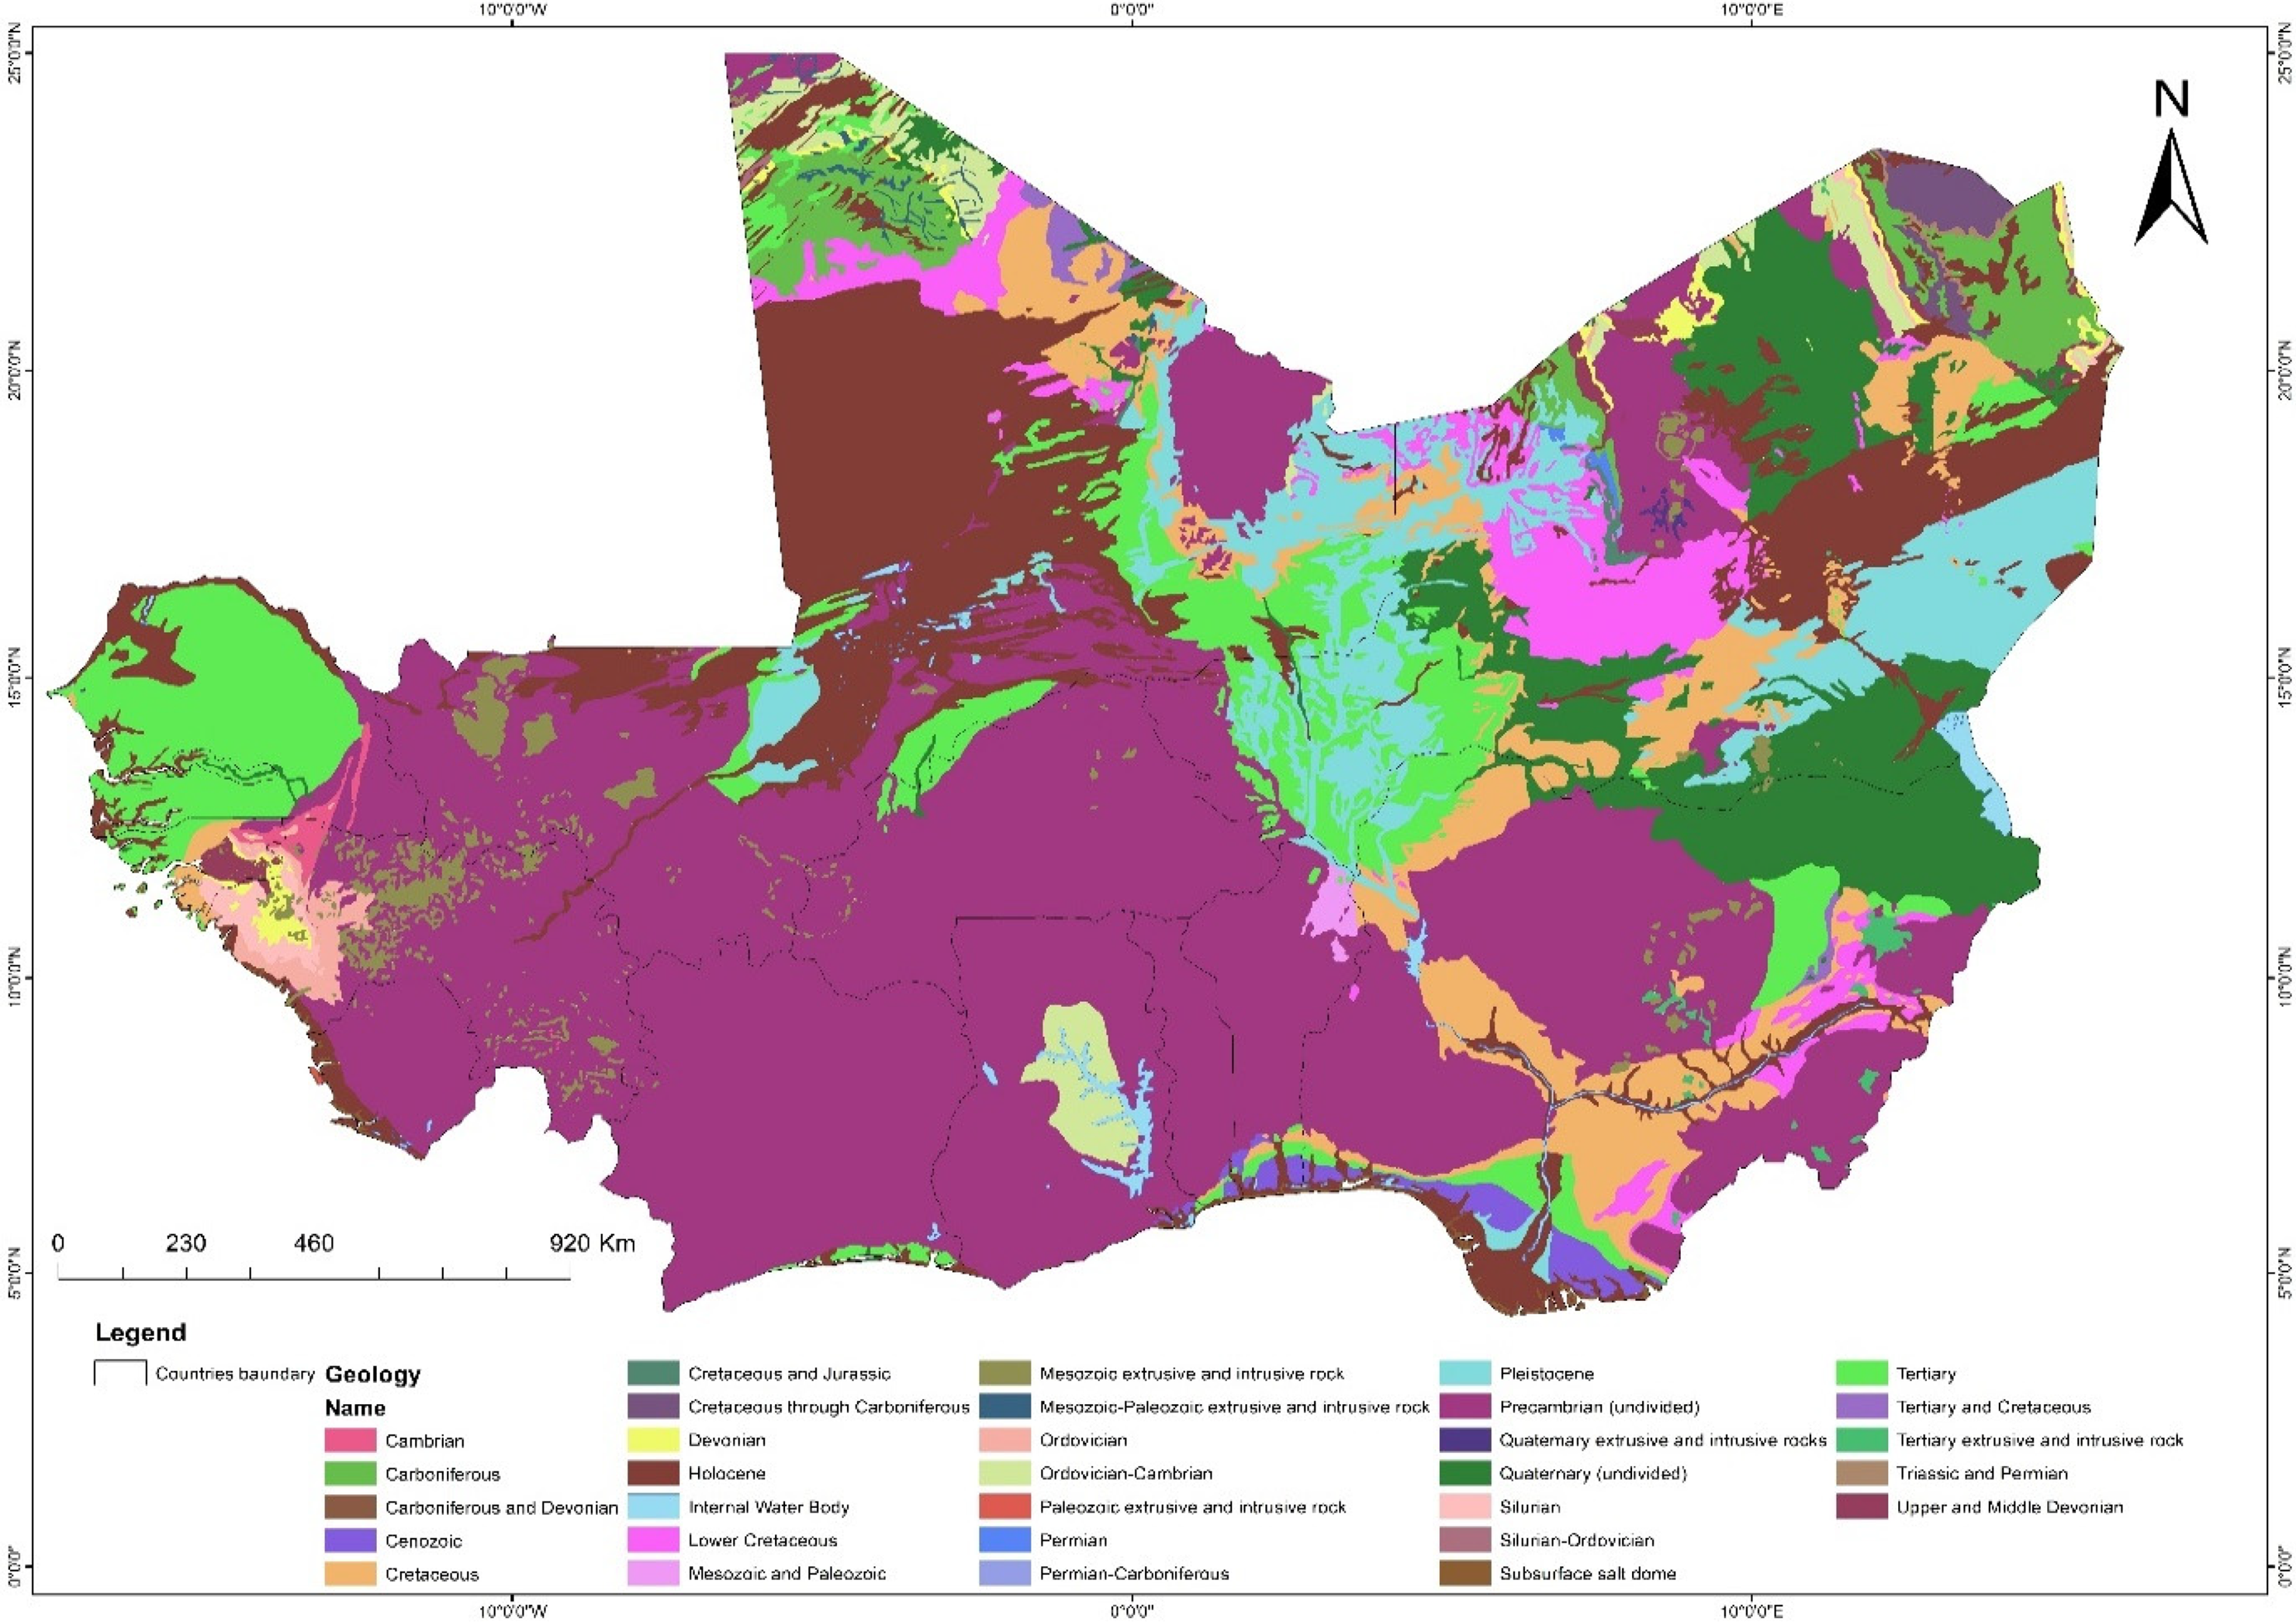
Map of West geology.
Table 9 reports land cover classes within the WAPP, including water, trees, flooded vegetation, crops, built-up areas, bare ground, and rangeland. Bare ground and rangeland dominate most countries, such as Mali (37.84% bare ground, 58.25% rangeland) and Niger (50.14% bare ground, 48.89% rangeland). Tree cover is significant in countries like Benin (23.48%), Nigeria (21.24%), Ghana (43.27%), and Guinea (68.55%). Figure 7 illustrates the spatial patterns of land cover types, highlighting the prevalence of bare ground and rangeland.

Map of West land cover.
Table 10 shows rainfall distribution ranging from 1.89 mm to 4445.97 mm annually. Most countries receive rainfall within the 1.89–1430.97 mm range, including Mali, Niger, Burkina Faso, and The Gambia at 100%. Higher rainfall (>1430.97 mm) is recorded predominantly in Sierra Leone (100%) and Guinea Bissau (79.45%). Figure 8 maps rainfall intensity gradients, emphasizing higher precipitation along coastal areas compared to the drier northern regions.

Map of Western rain fall.
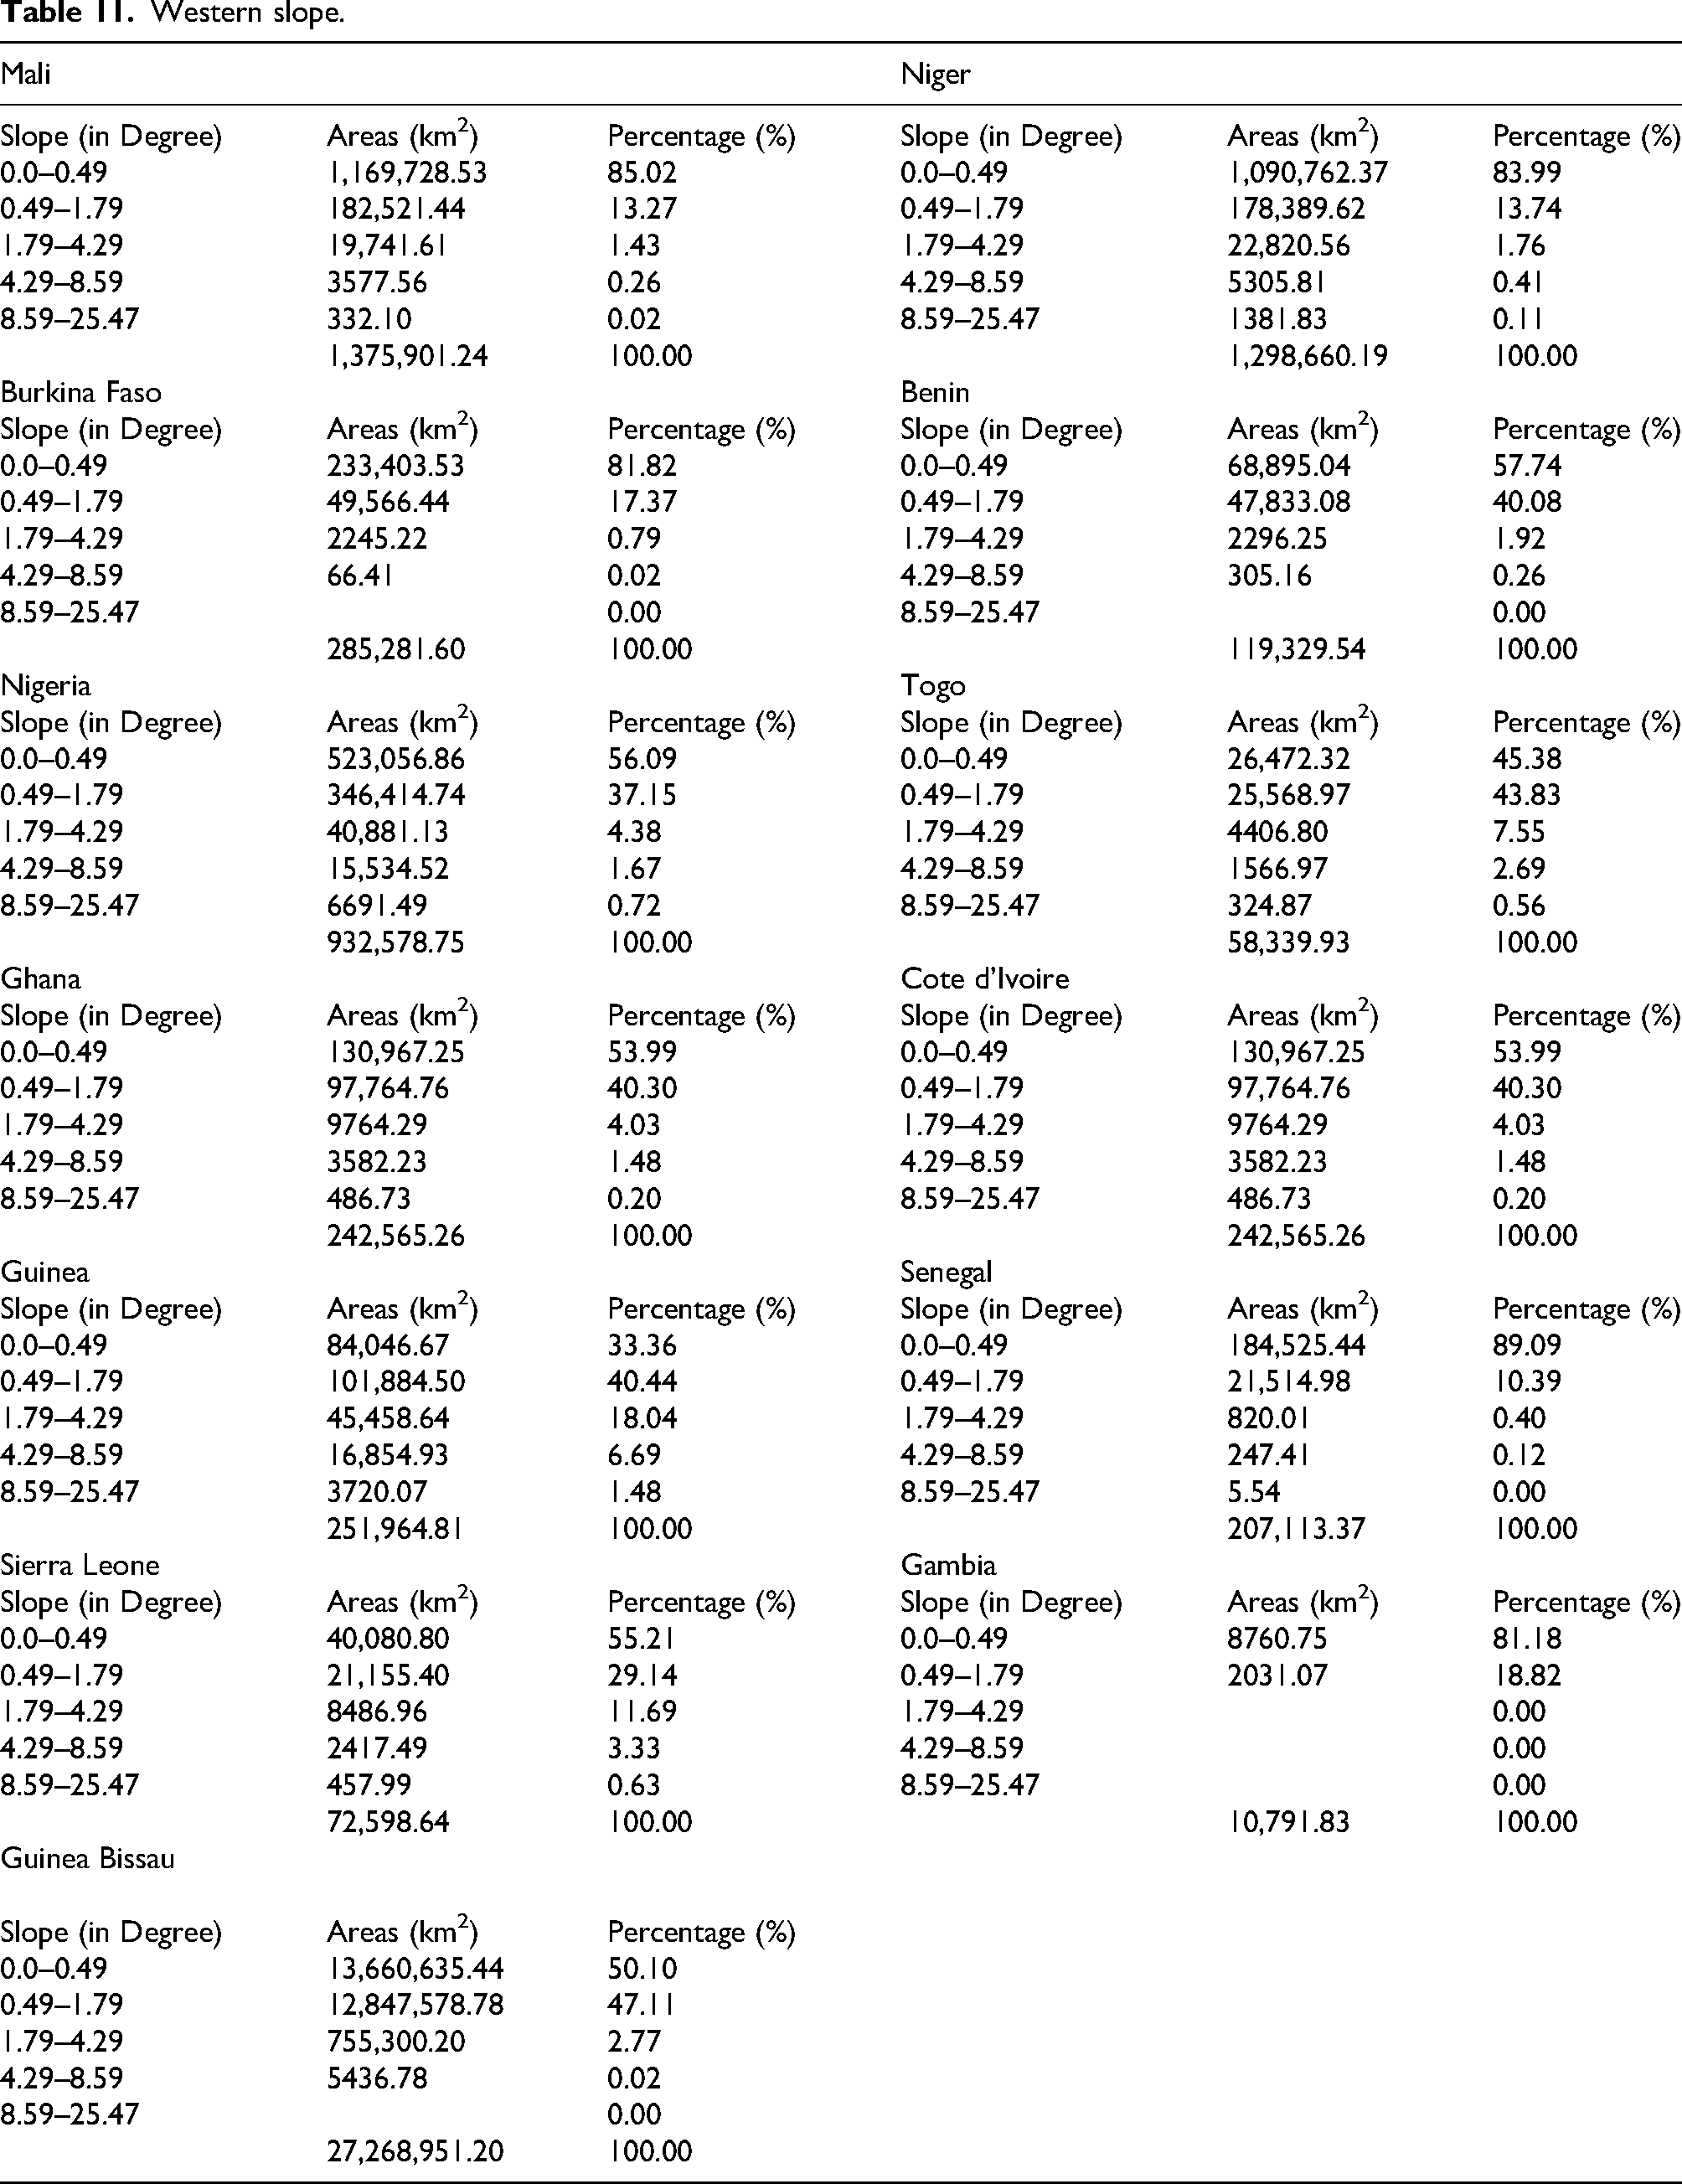
Table 11 presents slope classifications in degrees, with the majority of areas exhibiting low slope gradients between 0.0° and 1.79°. Country-specific percentages within this range include Mali (97.73%), Burkina Faso (99.19%), Benin (97.82%), Nigeria (83.24%), Sierra Leone (89.21%), The Gambia (100%), and Guinea Bissau (97.21%). Figure 9 depicts the predominance of low slope gradients across the WAPP.

Map of Western slope.
Table 12 summarizes soil texture types, including clay, clay loam, loam, loamy sand, sand, sandy clay loam, and sandy loam. Loam and sandy clay loam are the dominant textures in most countries, for example, Mali (54.88% loam, 20.94% sandy clay loam), Niger (40.42% loam, 19.96% loamy sand), and Benin (72.32% sandy clay loam). Silty loam is present only in Mali, while unweathered bedrock occurs in Mali and Niger. Figure 10 illustrates the spatial distribution of soil textures across the region.

Map of Western soil texture.
Table 13 shows SPI values predominantly in the lowest category (0.0–2.18 × 10^9), with near-total coverage in all countries: Mali (99.99%), Niger (99.97%), Burkina Faso (100%), Benin (99.99%), Nigeria (99.94%), Togo (100%), Ghana (99.97%), Côte d’Ivoire (100%), Guinea (100%), Senegal (100%), Sierra Leone (100%), The Gambia (100%), and Guinea Bissau (100%). Minor quantities appeared in higher SPI categories in Mali, Niger, Benin, Nigeria, and Ghana. Figure 11 presents the spatial variability of SPI, highlighting the generally low erosive power of streams in the WAPP.

Map of Western SPI (stream power Index).
Table 4 presents the spatial distribution of hydroelectric site suitability levels across the WAPP member countries, classified into five categories: Very Low, Low, Moderate, High, and Very High suitability. The areas (in km2) and corresponding percentages indicate the extent of each suitability class within each country. The results show that most countries have most of their land area falling within Low to Moderate suitability classes, with smaller proportions classified as High or Very High suitability. For instance, Mali and Niger predominantly exhibit Low suitability (71.38% and 66.13%, respectively), while Sierra Leone shows a considerable percentage (49.37%) in the High suitability category. No country reported significant areas under Very High suitability, suggesting that optimal hydroelectric sites are limited and dispersed. This classification supports targeted decision-making for hydroelectric development by highlighting priority zones within each country. Figure 11 represents the suitability map for west.
Interpretation
The geospatial multi-criteria assessment of hydroelectric site suitability across the West African Power Pool (WAPP) integrates nine biophysical parameters into a Composite Appropriateness Index (CAI). The analysis reveals distinct spatial patterns and quantitative distributions that influence hydroelectric potential.
Drainage density
Drainage density across WAPP ranges from 0.0 to 0.097 km/km2, with a predominant concentration below 0.046 km/km2 in most countries. For example, Mali (79.60%), Niger (67.77%), and Burkina Faso (95.19%) exhibit low drainage densities, indicating dispersed runoff conducive to small-scale hydropower development.
Elevation
Elevations are largely below 536 m, covering 97.12% of Mali and 100% of Senegal, reflecting predominantly low-lying terrain. This elevation range suggests limited potential energy head for large-scale hydropower but suitability for low-head technologies.
Flow accumulation
Flow accumulation values are mostly low, consistent with a dendritic drainage pattern typical of the region, except in The Gambia where 60.55% of the area shows high flow accumulation, indicating localized potential for hydropower development.
Geology
Precambrian (undivided) formations dominate the geology in most countries, except The Gambia and Guinea Bissau, where Precambrian geology accounts for only 4.12%. Geological stability inferred from these formations supports infrastructure development feasibility.
Land cover
Bare ground and rangeland dominate land cover, e.g., Mali with 37.84% bare ground and 58.25% rangeland. Tree cover is more prevalent in southern and coastal countries, which may influence environmental constraints and site selection.
Rainfall
Annual rainfall varies significantly, from 1.89 mm to 4445.97 mm. Coastal countries such as Sierra Leone receive over 1430.97 mm (100%), aligning with higher hydroelectric suitability due to greater water availability.
Slope
Slope gradients are generally low (0.0°–1.79°), covering over 80% of many countries (e.g., Mali 97.73%). Such low slopes limit potential energy head but favor low-head hydropower technologies.
Soil texture
Soil textures are predominantly loamy with clay and sand components, e.g., Mali with 54.88% loam and 20.94% sandy clay loam. These soil types affect construction feasibility and erosion risks.
Stream power Index (SPI)
SPI values are mostly low (0.0–2.18 × 10⁹), with near-total coverage in all countries (e.g., Mali 99.99%, Nigeria 99.94%), indicating generally low erosive energy of streams.
Composite appropriateness Index (CAI) suitability
Suitability classification shows most land areas fall under low to moderate suitability, e.g., Mali with 71.38% low and 23.83% moderate suitability. Sierra Leone stands out with 49.37% high suitability, highlighting priority zones for hydroelectric development. No areas were classified as very high suitability.
Validation
Spatial overlay with existing hydropower infrastructure, including Manantali (Mali), Akosombo (Ghana), and Kainji (Nigeria) dams, reveals strong correspondence with CAI high and moderate suitability zones, confirming the model's robustness.
Discussion
The results provide a comprehensive spatial characterization of hydroelectric site suitability in WAPP, revealing critical insights into regional hydropower potential and development feasibility.
Hydropower typology and feasibility
The findings indicate a strong regional bias toward specific hydropower technologies. The predominance of slope gradients between 0.0° and 1.79° covering over 80% of the territory in countries like Mali, Burkina Faso, and Senegal effectively precludes the development of traditional high-head storage schemes which require significant topographical relief for large-scale potential energy generation (NASA, 2025). Consequently, these regions are highly suited for low-head technologies and run-of-river micro/mini-hydropower systems. These systems can leverage the high flow accumulation found in localized basins (such as 60.55% of The Gambia) without requiring large-scale flooding or dam infrastructure. Conversely, the “High Suitability” zones in Sierra Leone and Nigeria, which combine higher rainfall with stable Precambrian geology, present the only viable candidates for large-scale storage schemes capable of providing baseload power to the WAPP grid.
Potential energy implications
Rainfall distribution strongly influences hydropower potential, with coastal regions exhibiting higher precipitation and corresponding higher CAI suitability scores. However, the generally low slope gradients limit the potential energy head, constraining large-scale hydropower capacity but favoring low-head technologies. The low SPI values imply limited stream erosive power, which may reduce sedimentation risks but also indicate moderate Stream Energy available for power generation.
Spatial prioritization utility
The CAI-based suitability map serves as a valuable decision-support tool, enabling policymakers and planners to prioritize hydroelectric development in zones with the most favorable biophysical conditions. The strong spatial alignment with existing hydropower infrastructure validates the model's practical relevance.
Limitations and future directions
While the static geospatial parameters provide a robust spatial framework, the absence of dynamic hydrological modeling (e.g., flow variability, discharge forecasting) limits the precision of energy potential estimates. Additionally, the current analysis does not incorporate socioeconomic and infrastructural factors such as grid proximity, population density, land use conflicts, and regulatory constraints, which are critical for practical project feasibility.
Conclusion
The drainage This study delivers a comprehensive geospatial multi-criteria assessment of hydroelectric site suitability across the West African Power Pool (WAPP) by integrating nine critical biophysical parameters into a Composite Appropriateness Index (CAI). The findings highlight that the region predominantly exhibits low to moderate drainage densities (0.0–0.097 km/km2), with most countries such as Mali (79.60%), Niger (67.77%), and Burkina Faso (95.19%) falling below 0.046 km/km2. Elevations are largely under 536 m, covering 97.12% of Mali and 100% of Senegal, whereas flow accumulation patterns are primarily dendritic and low, except for The Gambia, with 60.55% high flow accumulation. Geological formations are mainly Precambrian (undivided), except in The Gambia and Guinea-Bissau (4.12%). Land cover is dominated by bare ground and rangeland, exemplified by Mali's 37.84% bare ground and 58.25% rangeland coverage. Rainfall distribution shows significant spatial variability, with coastal countries such as Sierra Leone receiving over 1430.97 mm annually (100%). Slope gradients are generally low (0.0°–1.79°), covering over 80% of many countries (e.g., Mali 97.73%), indicating a limited potential energy head for large-scale hydropower but favorable conditions for low-head technologies. Soil textures are predominantly loamy with clay and sand components, such as Mali's 54.88% loam and 20.94% sandy clay loam content. The Stream Power Index values were mostly low (0.0–2.18 × 10⁹), with near-total coverage in all countries.
The CAI suitability classification revealed that most land areas fall under the low to moderate suitability categories, with exceptions such as Sierra Leone, which exhibited 49.37% high suitability. Validation against existing hydropower infrastructure, including the Manantali, Akosombo, and Kainji dams, demonstrated a strong spatial correspondence, confirming the model's robustness as a spatial decision-support tool.
This study underscores the critical role of geospatial multi-criterisa analysis in guiding regional hydroelectric planning in the WAPP. To advance towards a comprehensive and energy-focused assessment, to refine these geospatial findings, future work must transition from static suitability mapping to dynamic energy estimation. This should include: Hydrological Modeling: Integration of models such as SWAT or HBV to estimate specific annual energy potential (GWh/year) by accounting for seasonal flow variability, Socioeconomic Constraints: Inclusion of ‘exclusion zones’ such as protected areas, high population density centers, and land-use conflicts (Esri, Land Use and Land Cover, 2020a; Esri, 2020b), and Infrastructural Proximity: Evaluating site viability based on the distance to the existing WAPP regional grid to account for transmission costs and technical feasibility. Such multidimensional approaches will enhance the practical feasibility and sustainability of hydroelectric development, thereby supporting West Africa's renewable energy goals and regional energy security.
Footnotes
ORCID iDs
Informed consent statement
Not applicable.
Author contributions
All the authors contributed equally to this manuscript. All the authors have read and agreed to the published version of the manuscript.
Funding
The authors received no financial support for the research, authorship, and/or publication of this article.
Declaration of conflicting interests
All authors declare that the research was conducted in the absence of any commercial or financial relationships that could be construed as potential conflicts of interest.
Data availability statement
The data for this study is available from the corresponding authors upon request.
Institutional review board statement
The authors declare that the content of this study complies with ethical standards and concepts. The authors confirm that this paper has not been published previously, it is not under consideration for publication elsewhere and is not under consideration for publication elsewhere.