
Abstract
The relationship between urban heat island (UHI) and land use/land cover (LULC), and local climate zone (LCZ) is apparent and takes rising attention in the current literature. This study aimed to investigate the relationship between meteorological data collected from 30 stations between 2016 and 2022 and Istanbul’s LULCs and LCZs. Several notable findings were uncovered, providing light on the UHI phenomenon and its consequences for the city’s characteristics. The stations in urban areas (typology A) had higher temperatures than stations in rural/suburban (typology B) and forested landscape (typology C). Those yearly values were ∼1°C for monthly mean temperatures and ∼1.5°C for monthly minimum temperatures. Moreover, urban areas possessed +4 and +2 hot days (35°C and above) for typologies B and C, respectively. Another remarkable result was that stations situated close to water surfaces exhibited a lower tendency to exceed temperatures of 35°C. Furthermore, built-type LCZs wind velocity achieved a lower value than land cover type, and humidity in typology A was 5% and 10% less than the typologies B and C, respectively. Consequently, the southern part of Istanbul emerged as the most vulnerable location to the UHI phenomena, suffering greater temperatures.
Introduction
Climate change is a remarkable reality of our time. The theory of systematic scientific evaluations conducted since the 1970s has progressed from theory to established acceptance. The most recent and concrete pieces of evidence of climate change are a 1.1°C increase in global mean temperature from 1880 to 2023, a carbon dioxide ratio in the atmosphere reaching 422 ppm, a 12.6% decrease in glacier area since 1979 and a 10 cm rise in sea level. 1 These alterations influence both natural and manmade processes, including changes in precipitation patterns, extreme weather occurrences, phenological shifts and varied habitats such as forest and rural and urban environment.2,3
Nowadays, the world’s population is about 8 billion, and is predicted to increase to 8.5 billion by 2030, 9.7 billion by 2050 and 10.4 billion by 2100. Cities now accommodate 55% of the world’s population. By 2050, it is expected to grow to 68%. 4 Cities, covering approximately 3% of the Earth’s surface, account for 75% of global energy consumption by their inhabitants. 5 Due to various difficulties such as rising population, rapid urbanization and excessive pressure on natural habitats, many NGOs and public sectors offer a variety of conservation and implementation suggestions to reduce the impact of climate change by addressing the complex interplay between population dynamics, urbanization and environmental sustainability.6–8
Many problems are currently awaiting resolution in cities. One of the most obvious issues is urban heat island (UHI). The UHI is an increased temperature occurrence in a city compared to its immediate surroundings, 9 and is caused by a variety of reasons. Contrary to common perception, it cannot only be attributed to a lack of green space in the city. The excessive use of heat-absorbing materials, dense population and traffic, constructing a built environment without considering local climate characteristics, and inappropriate land use decisions increase heat retention and create localized hotspots. This may result in raised temperatures, heat-related health risks, increased energy consumption for cooling and compromised air quality, and may be specified as components that cause the establishment of an urban heat island (UHI).10,11
Another serious problem to date has been the change in land use/land cover (LULC). 12 Climate change, LULC and energy are all interlinked. 13 LULC change are recognized as important interconnections that are impacted by human activities like population growth, rapid urbanization and increasing pressure on ecosystem resources, in addition to changing climatic conditions. 14 The interplay between LULC and climate change is not given enough attention, even though effective interventions are necessary in land-based ecosystems. 15 Changes in the LULC have an impact on the climate, either directly or indirectly.16,17 There are many studies examining the relationship between LULC and climate, revealing the importance of this issue at various scales such as global, regional and local.18–20 Additionally, some governments have been focusing on LULC changes and their consequences on climate.21,22
Urbanization has a strong correlation with LULC dynamics, which in turn leads to changes in UHI intensity. Each LULC type effects UHI differently as the environment changes; therefore, understanding this impact and link is crucial. 23 As such, the density and occurrence of UHI are highly related to LULC patterns,24–26 which have a significant impact on land-surface climatic interactions, altering heat exchange, moisture, trace gas fluxes and albedo. 27
The geographical monitoring and mapping of variation in LULC assist local governments and decision-makers in developing comprehensive and sustainable plans for future urbanization and city sustainability. 28 Through this, dense meteorological data has taken on an important role.29,30 For example, Okumus and Terzi (2021) 31 determined the surface temperatures in urban areas to be approximately 4°C higher than in rural areas of Istanbul. Likewise, Şekertekin and Marangoz (2019) 32 found a similar temperature difference for the city of Zonguldak. Moreover, Toy and Yilmaz (2010) 33 studied Erzincan City, which is a well-planned, unindustrialized and medium-sized Turkish town. The urban environment is 2°C warmer than the rural for minimum temperatures. Similar results have been observed for the above-mentioned studies, although the study areas are different.
Climate parameters are critical for cities, especially when UHI is present. Understanding and monitoring the interaction between climate parameters and LULC is critical for covering the scope and impact of UHI in cities. LULC changes can impact local climate variables such as temperature patterns, wind velocity and humidity. Wind is critical for cooling the city and introducing fresh air into the city voids. Urban environments tend to cut the wind velocity and to be drier than their surroundings.34,35 Humidity is another significant parameter that regulates perceived temperature, meaning high humidity levels can make the air feel warmer than the actual temperature. To deeply investigate the effect of LULC on climate, Stewart and Oke (2012) 36 introduced a detailed classification method called local climate zone (LCZ). The LCZ offers researchers to classify the land with 17 different definitions and provides a protocol to compare the land use type all over the world.
UHI is one of the most important problems for metropolitan cities like Istanbul 37 and the importance of the LULC/LCZ and their effect on climate is opulent. Therefore, this research investigated the relationship between climate data and LULC by looking at a variety of climatic factors such as monthly mean temperature (°C), monthly minimum mean temperature (°C), monthly maximum mean temperature (°C), frequency of days exceeding 35°C, monthly mean wind velocity (m/s) and monthly mean humidity (%). Through this approach, the aim was to shed light on the influence of LULC on climatic conditions by evaluating specific factors, notably the UHI effect and its interaction with LULC and LCZ. This investigation addressed the following questions: (1) How does LULC influence meteorological data? and (2) do LCZ types exhibit variations amongst themselves? Through our study, we contribute to a deeper understanding of how UHI variability interacts with LULC and LCZ dynamics, giving useful insights for landscape and urban planning, climate mitigation methods and sustainable urban development.
Material
The study area covered Istanbul Province (Figure 1). Under the material title, the physical, demographic and climatic characteristics of the study area are described. Location of the study area (a and b), selected meteorological stations (c) and Istanbul topography (d).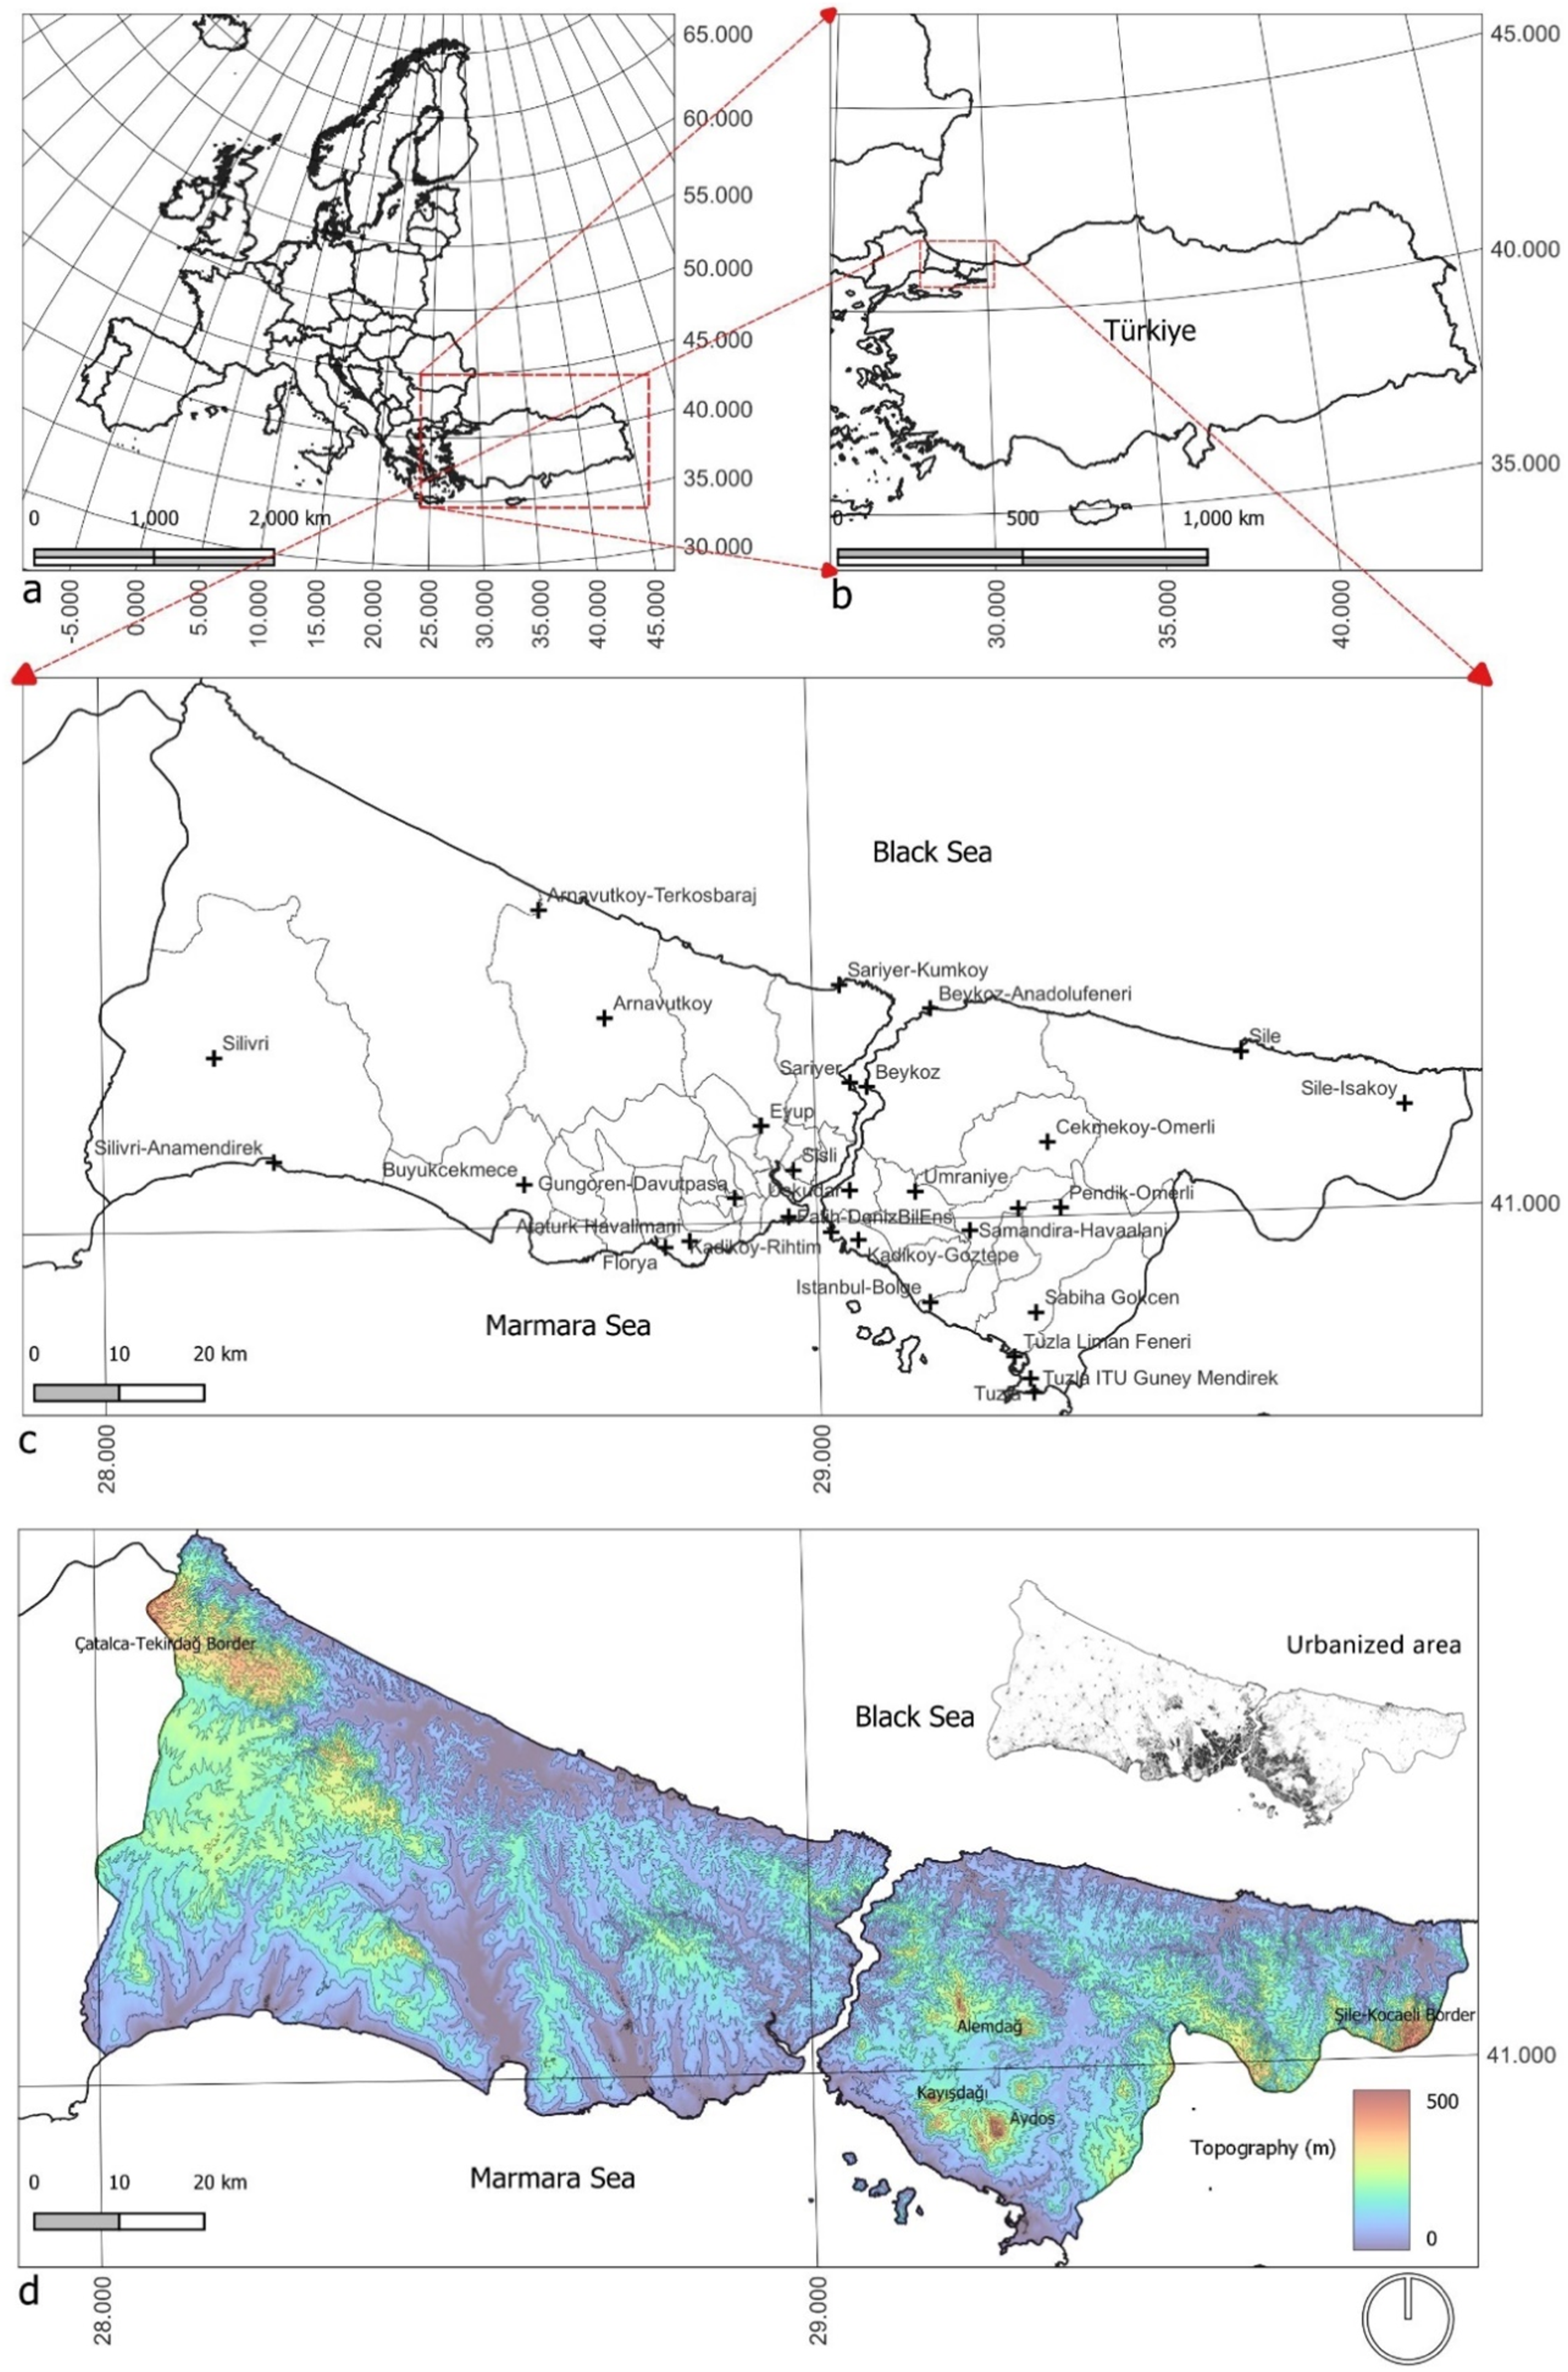
Istanbul
Istanbul is a metropolitan city with a population of approximately 16 million and consists of 39 districts. Istanbul borders the Black Sea to the north and the Marmara Sea to the south. It has a unique geographical position with the strait connecting these two seas (Figure 1(c)). The altitude of the city varies between 0 and 537 m. Its highest point is Aydos Hill, which is adjacent to Kartal, Pendik, Sultanbeyli and Sancaktepe districts on the Anatolian side of Istanbul. Aydos Hill is followed by two hills with an altitude of 478 m on the Şile–Kocaeli Border and 442 m on the Çatalca–Tekirdağ Border. In addition, Alemdağ is located within the borders of Çekmeköy at 442 m, and Kayışdağı is located within the borders of Ataşehir with an altitude of 438 m, which are amongst the high hills in Istanbul (Figure 1(d)).
Istanbul has been under the influence of rapid urbanization since 1980. Some of the physical steps that led to increased urbanization are the opening of the Bosphorus Bridge (now the 15 July Sehitler Bridge) in 1973 and the Fatih Sultan Mehmet Bridge in 1988. The planning and positioning of many industrial zones on the peripheries of Istanbul accelerated the migration from Anatolia to Istanbul, which caused a significant change in Istanbul’s LULC and LCZ, and the city expanded rapidly in the east-west direction. 38
The forests of Istanbul are amongst the natural areas that are most heavily damaged due to human-based pressures. 39 While there are moist-temperate leafy forests in the north of Istanbul, there are maquis and Pinus brutia Ten. forests in the inner and southern parts. This area constitutes 44% of the total area of Istanbul (238,000 ha). The primary tree species in these forests are: Quercus spp., Fagus spp., Carpinus spp. and Castanea spp. The total forest area has decreased from 270 thousand hectares to 238 thousand hectares in the last 50 years. Structural pressures on the forest and wrong urbanization policies are the most important reasons for this negative situation. 40
In addition, the vertical architectural policy adopted after the 2000s has increased the anthropogenic effects in the urban area. In addition, the construction of Yavuz Sultan Selim Bridge and roads in the north of the province may cause the city to expand towards the north in the near future.41,42 Due to such effects, Istanbul has become one of the most populated regions in the world. The most populated districts of Istanbul are the southern districts on the coast of the Marmara Sea. The northern parts of the province have forest cover. 43 When these main findings are put together, it is very important to understand how the urban areas of Istanbul show the temperature difference according to its LULCs and LCZs. Due to wrong urbanization, most places were formed haphazardly, and this affected the urban climate.
Istanbul climate
Istanbul’s climate is transitional between Mediterranean and Black Sea types with cold and wet in winter and hot and humid in summer. 44 The southern parts of Istanbul generally represent the Mediterranean climate type and are warmer than other regions. However, due to the winds blowing from the north, the city is cooler and rainier than other Mediterranean regions further south. 45 In addition, the climate is mostly affected by the Marmara and Black Sea and the presence of the Bosphorus passing through the city. 46
The annual temperature is about 14.7°C between 1980 and 2022, derived from Sarıyer-Kumköy, Kadıköy-Rıhtım, Şile, Florya and Sarıyer stations, and the mean annual maximum and minimum temperatures are 18.6°C and 11.1°C, respectively. The annual precipitation is about 760 mm, and the northern part receives slightly more precipitation than the southern part. Lastly, the prevailing wind directions of the city are on the northeast and southwest.
Methods
This section consists of two parts: preliminary and main research. Preliminary research includes the processing of raw data, and the main research involved the evaluation of the processed data (Figure 2). Method flow chart.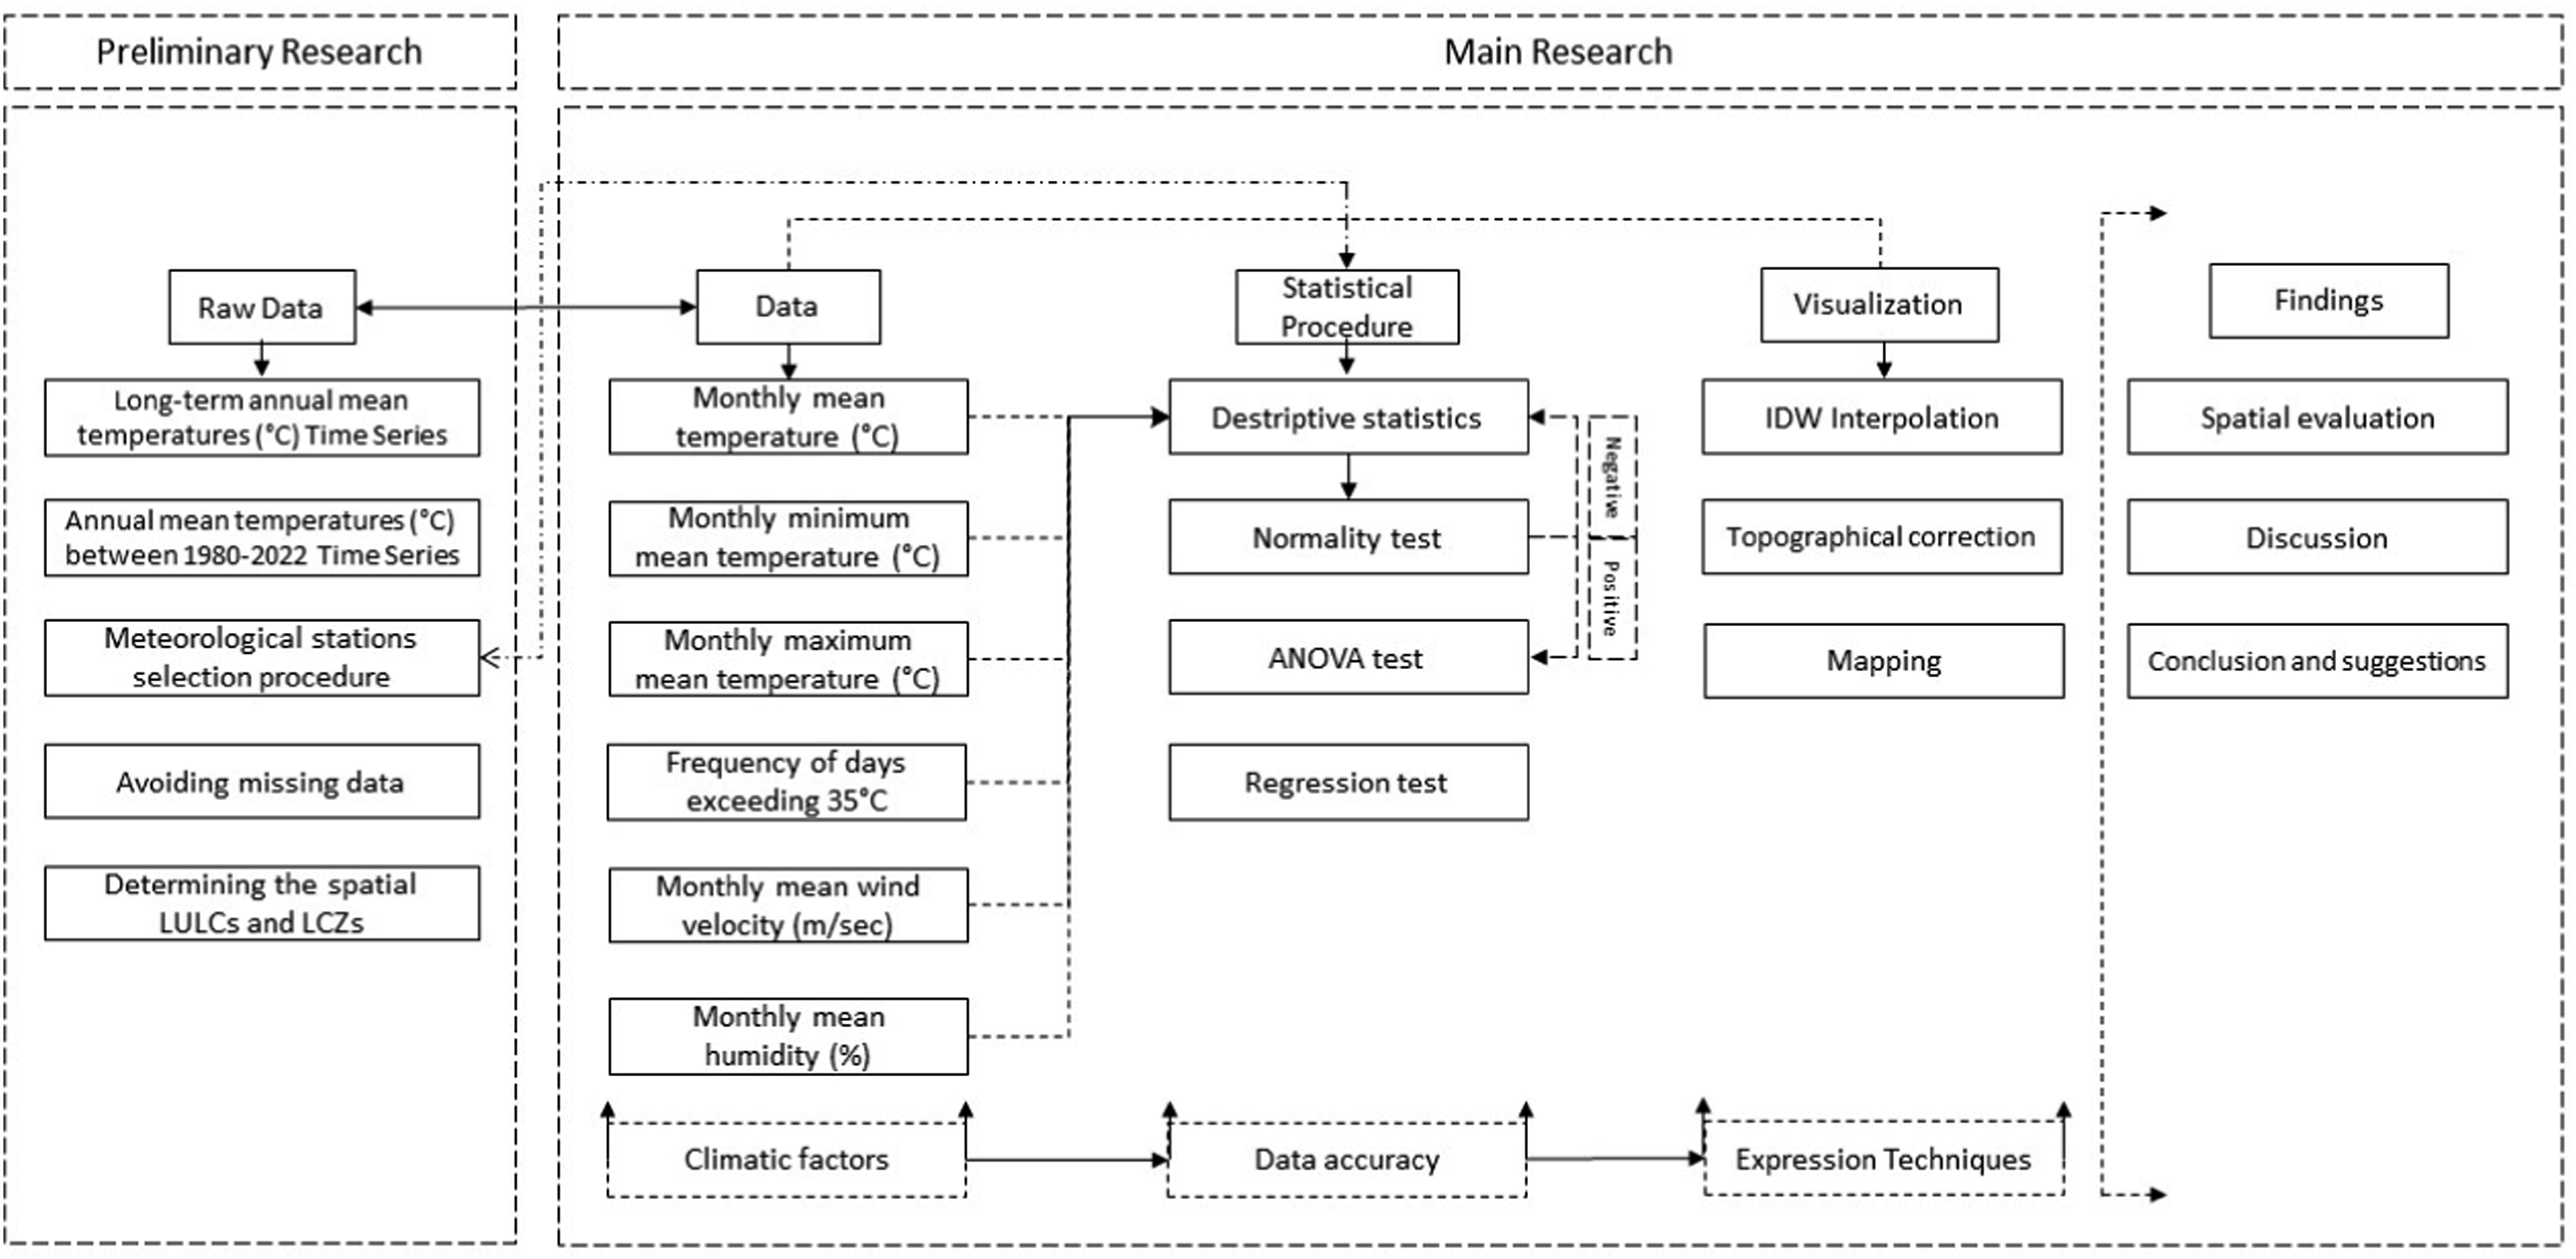
The preliminary part investigated the long-term annual mean temperatures (°C), the annual mean temperatures (°C) between 1980 and 2022, the meteorological stations’ selection procedure and avoiding missing data.
The main part included the extraction and analysis of the data. In this context, between 2016 and 2022, monthly mean temperature (°C), monthly minimum mean temperature (°C), monthly maximum mean temperature (°C), day frequencies with 35°C and above temperature, monthly mean wind velocity (m/s) and monthly mean relative humidity (%) data were examined.
First, statistical procedures were applied. Each data set was explained by descriptive statistical methods. Next, the data were subjected to normality test. If normality test results were positive, then statistical procedures continued with ANOVA and Scheffe multi-comparison tests. If normality was negative, the data was left with descriptive statistics and visualization. The purpose of ANOVA and Scheffe multi-comparison tests was to explore the land use/land cover (LULC) typologies influence the data or not.
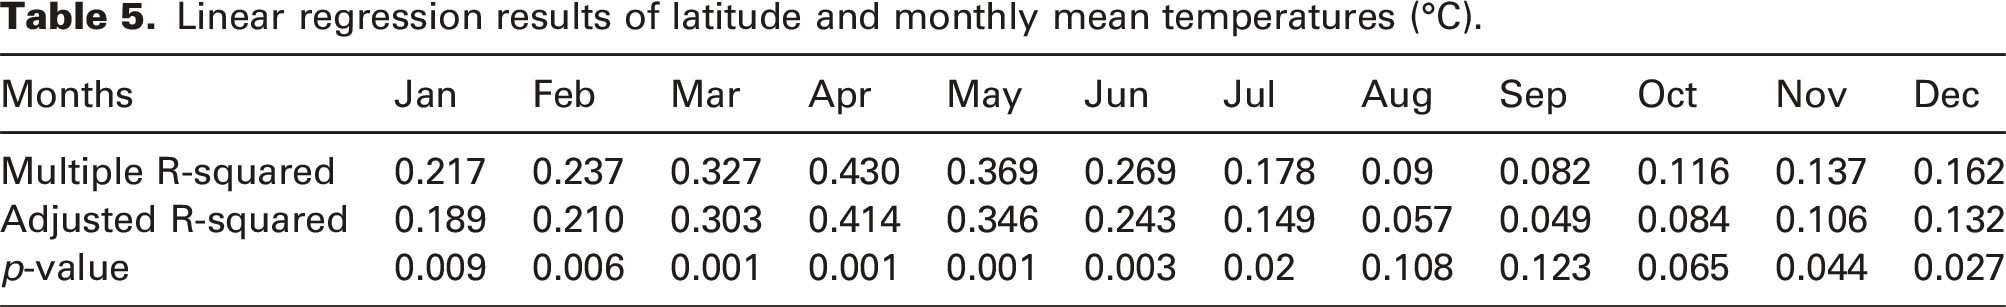
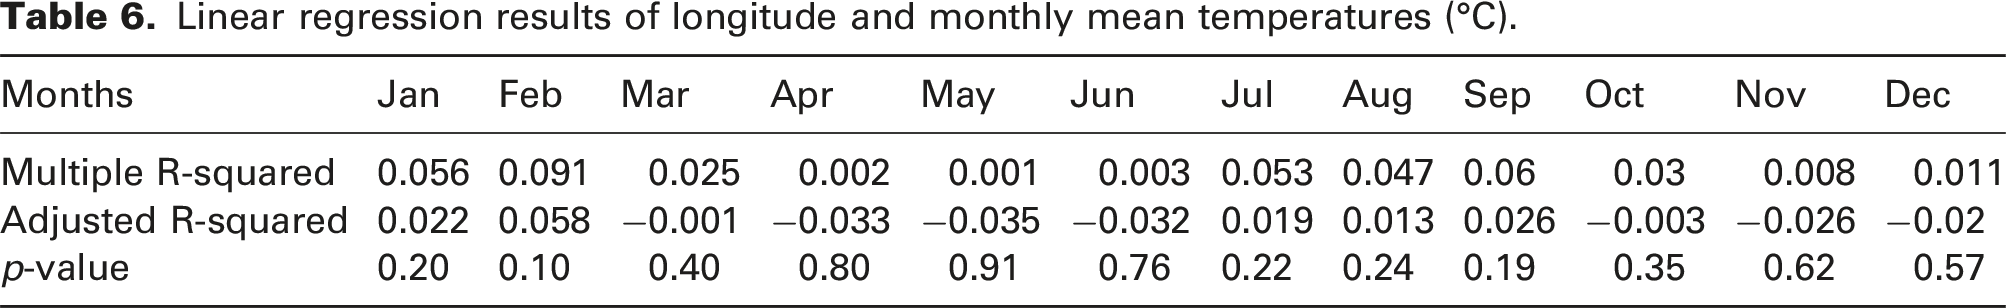
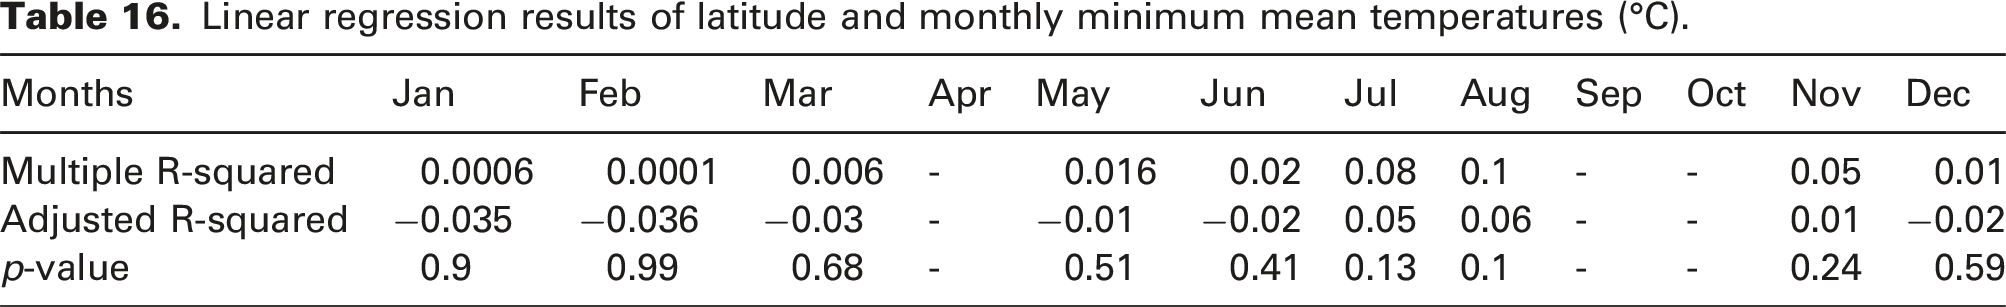
Finally, the regression test was applied to correct the latitude–longitude effect depending on the data set to increase the data purity and accuracy. For LULC typology, the concepts of urban and rural may not be sufficient to classify areas alone. 10 For this reason, the station and its surroundings are supported by LCZ typologies. Then the data were evaluated with various visualization techniques.
Long-term annual mean temperature (°C) time series
First, a long-term time series was plotted with data from six different stations over annual mean temperatures (°C). The stations were selected for the criteria of having the oldest data in order to present the long-term data properly. These stations were Atatürk Airport (1980–2022), Florya (1937–2022), Kadıköy-Rıhtım (1929–2022), Sarıyer (1949–2022), Sarıyer-Kumköy (1951–2022) and Şile (1940–2022). Thus, an increasing trend was determined in annual mean temperatures in 1980 and later (Figure 3, left graph). Then, another time series was drawn for the data between 1980 and 2022, and after 2010, it was seen that the stations located in the dense urban texture (Atatürk Airport and Kadıköy-Rıhtım) began to separate from other stations. In other words, the range of 2010–2022 was found to be suitable for evaluations (Figure 3, right graph). After this stage, the selection procedure for meteorological stations was started. Graph of long-term mean annual temperature data (°C) (left) and graph of annual mean temperature data (°C) from 1980 and later (right).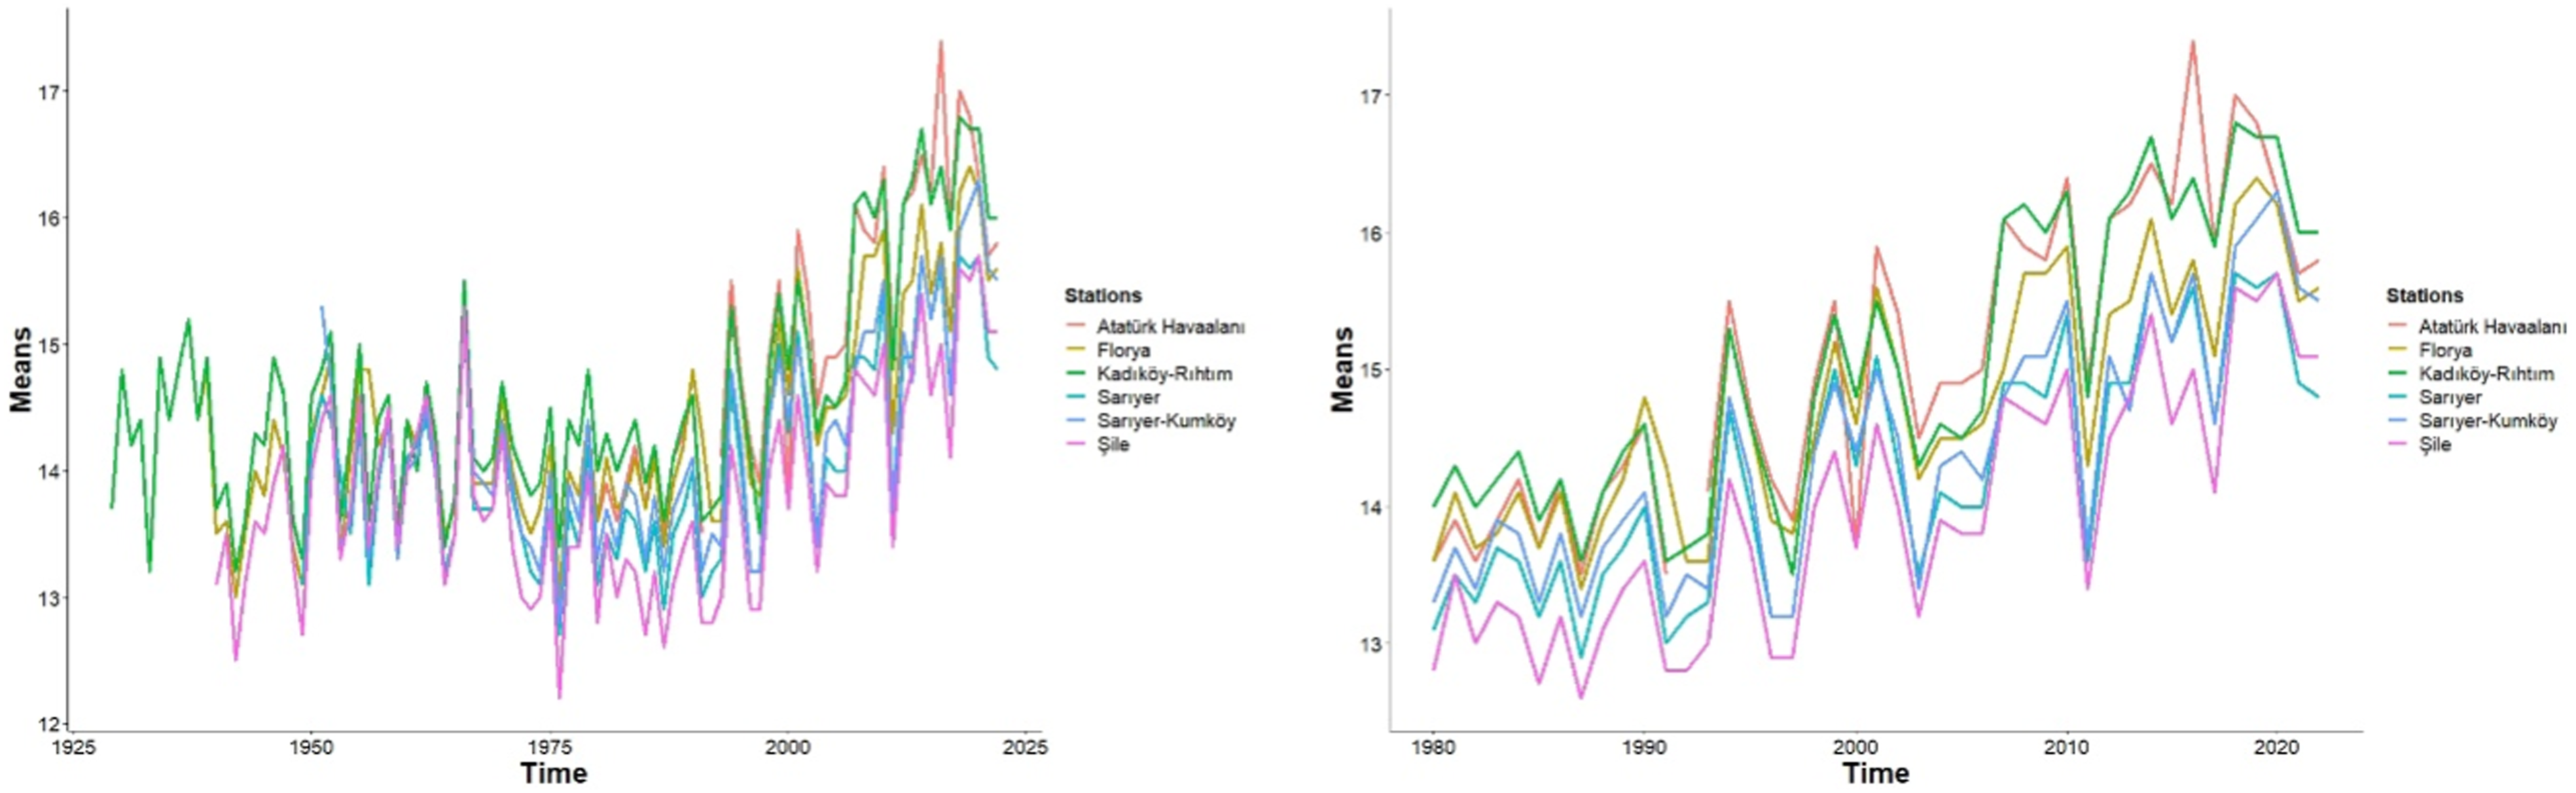
The selection procedure of meteorological stations and the determination of the year range
First of all, the number of recording stations was determined by going back to 2022, and as of 2016, 30 stations were found to be recording. This determination revealed the year range, which constitutes the main pillar of the study, as 2016–2022. Statistical procedures were effective in determining the maximum number of stations. These details are explained below.
Data analysis and accuracy
Data analysis and accuracy included several statistical procedures: Shapiro–Wilk normality test, ANOVA test, Scheffe multi-comparison test and linear regression test. This procedure was applied to monthly mean temperature (°C), monthly mean minimum temperature (°C), monthly mean maximum temperature (°C), monthly mean wind velocity (m/s) and monthly mean relative humidity (%).
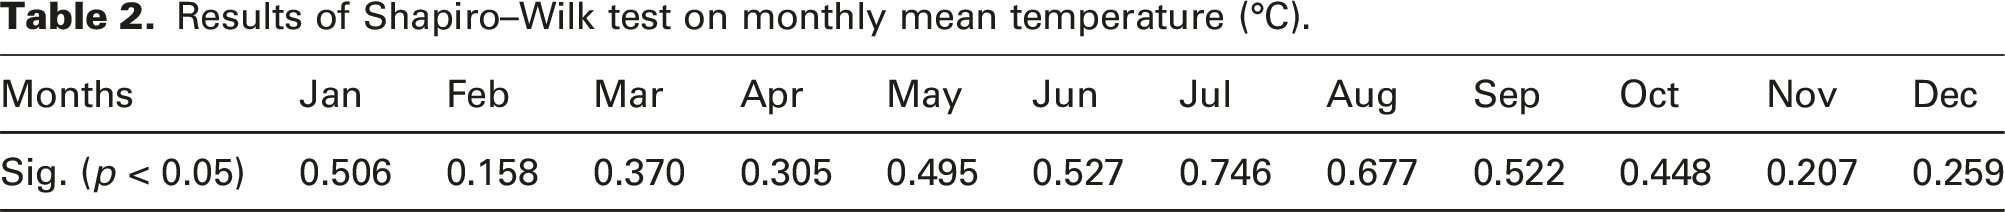
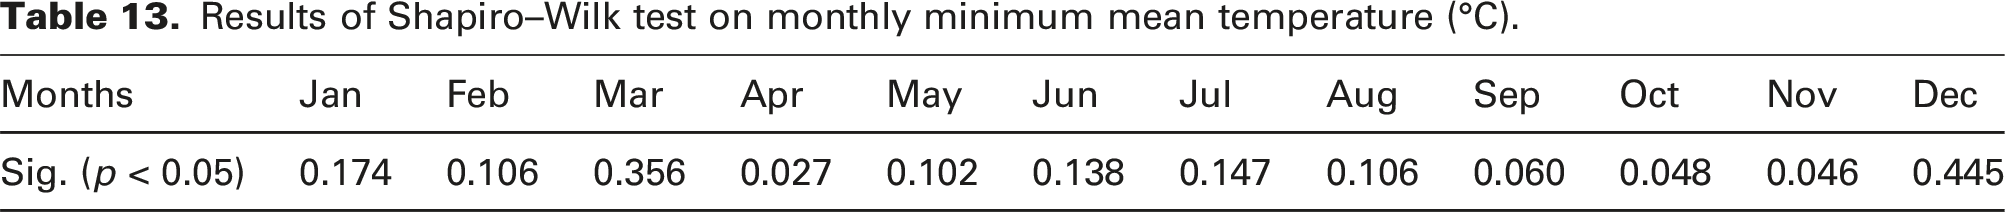
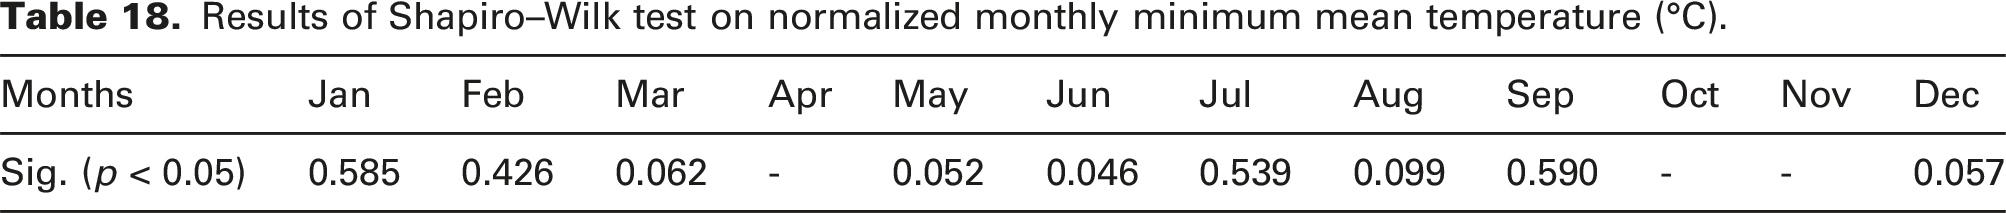
In statistics, the assumption of normality is important for correctly analyzing data. The assumption of normality is one of the first steps for the validity of hypothesis tests. 47 First, the Shapiro–Wilk test of normality, which can be applied to observations with a sample size of less than 50, was applied to each data set. With this, we can decide whether the data can be evaluated with a parametric or non-parametric test. 48
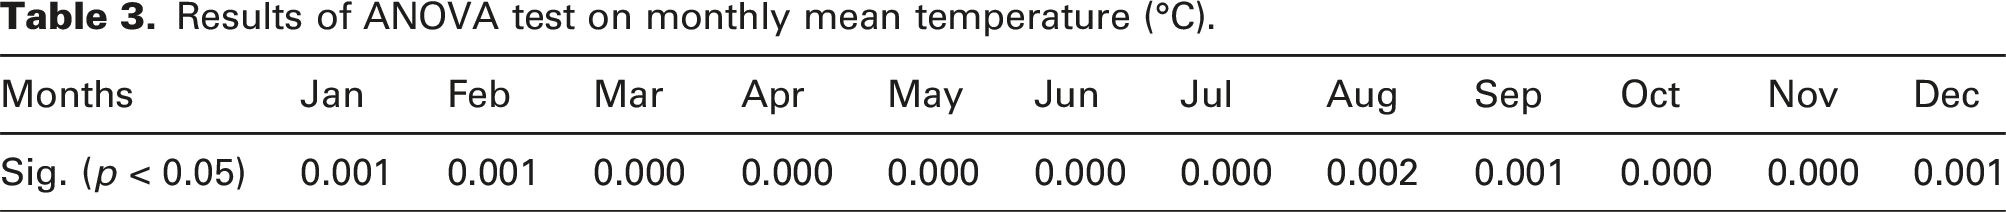
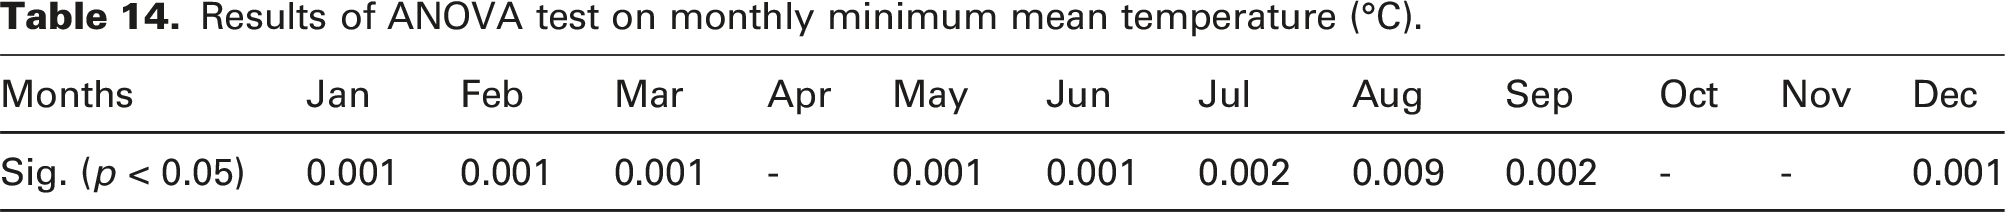
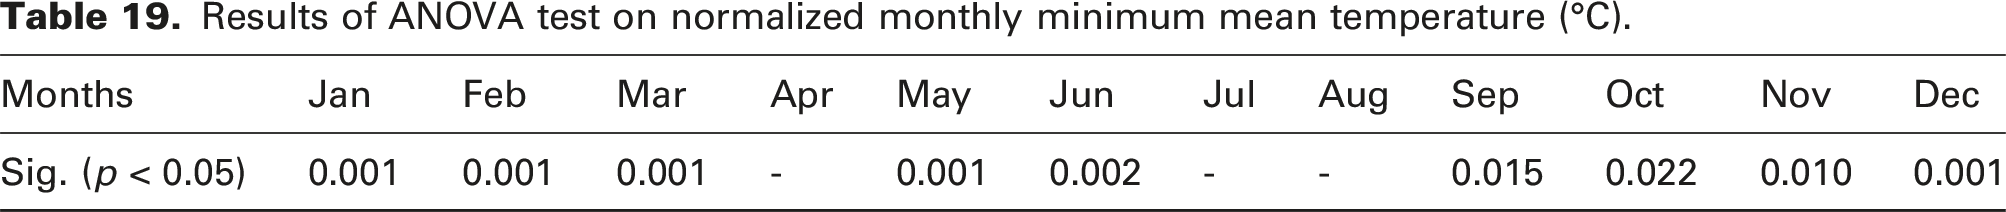
After determining the normality, the relationship between all data from 30 stations and the LULC was examined with a one-way ANOVA (Analysis of Variance) test, which was considered significant if at least one of the variables was different but did not show which two variables were different. 49 To reveal this detail, Scheffe’s test, which is a multi-comparison test, was performed and the evaluation phase was started. All statistics were calculated by SPPS 22.0 and R Studio v. 4.12. 50
Determining the spatial land use/land cover and local climate zones of the stations
There are several methods to define LULC. The most well-known is the CORINE categorization form, which is typically referred to as urban, rural and forest. CORINE 2018 Land Cover divides land into three main classifications: urban, rural/suburban and forest patterns. For urban classification, each class has a continuous urban fabric, a discontinuous urban fabric, industrial or commercial units, road and rail networks, associated land, etc. It has detailed sub-classifications such as non-irrigated arable land, continuously irrigated land, complex cultivation patterns, etc., for rural/suburban classification; and broadleaf forest, mixed forest, transitional woodland-shrub, etc., for forest classification. 51
The other well-known classification method is the local climate zone (LCZ) classification. The LCZ provides a basic standardization for UHI studies and allows comparing urban temperature observations in different areas over these standards. LCZ types are divided into 17 distinct classifications which are grouped under two broad categories. The first primary title expresses a type of built-type, which are compact high-rise (1), compact mid-rise (2), compact low-rise (3), open high-rise (4), open mid-rise (5), open low-rise (6), lightweight low-rise (7), large low-rise (8), sparsely built (9) and heavy industry (10), while the second indicates the land cover type, which are dense trees (A), scattered trees (B), bush-scrub (C), low plants (D), bare rock and paved (E), bare soil and sand (F) and water (G). 36
CORINE 2018 Land Cover was used for LULC detection of stations 51 ; nonetheless, we benefited from Google Earth aerial photographs to make LULC clear. As such, we decided on the LULC classification with urban (typology A), rural/suburban (typology B) and forested landscape (typology C). Typology A was for those who remained inside the urban macro-form; typology B was for stations between the urban and forested landscape; and typology C was assigned to the stations inside the forest texture. In this case, seventeen (17) urban, seven (7) rural/suburban, and six (6) forested landscape typologies were determined as LULC typologies.
To analyze the LULC distributions in detail, the most dominant local climate zone (LCZ) was determined with the help of a 500 m × 500 m grid covering the station and its immediate surroundings (Figure 4). Yang et al. (2023)
52
also used the same measures to assess the LCZ types. World Urban Database and Access Portal Tools (WUDAPT) database was used to determine LCZ types. WUDAPT is an international community-based initiative to obtain and disseminate climate-related data on the physical geographies of cities for modelling and analysis.
53
In this study, an LCZ map created for Istanbul with an accuracy of 0.79 was used.
54
While determining the LCZ types, the most dominant LCZ type in the 500 m × 500 m grid was taken as a basis, and the presence of water in the grid was coded between 0 and 1.0 (zero) indicates no or little effect, and 1 indicates that the presence of water is very effective. Local climate zone patterns of selected sites.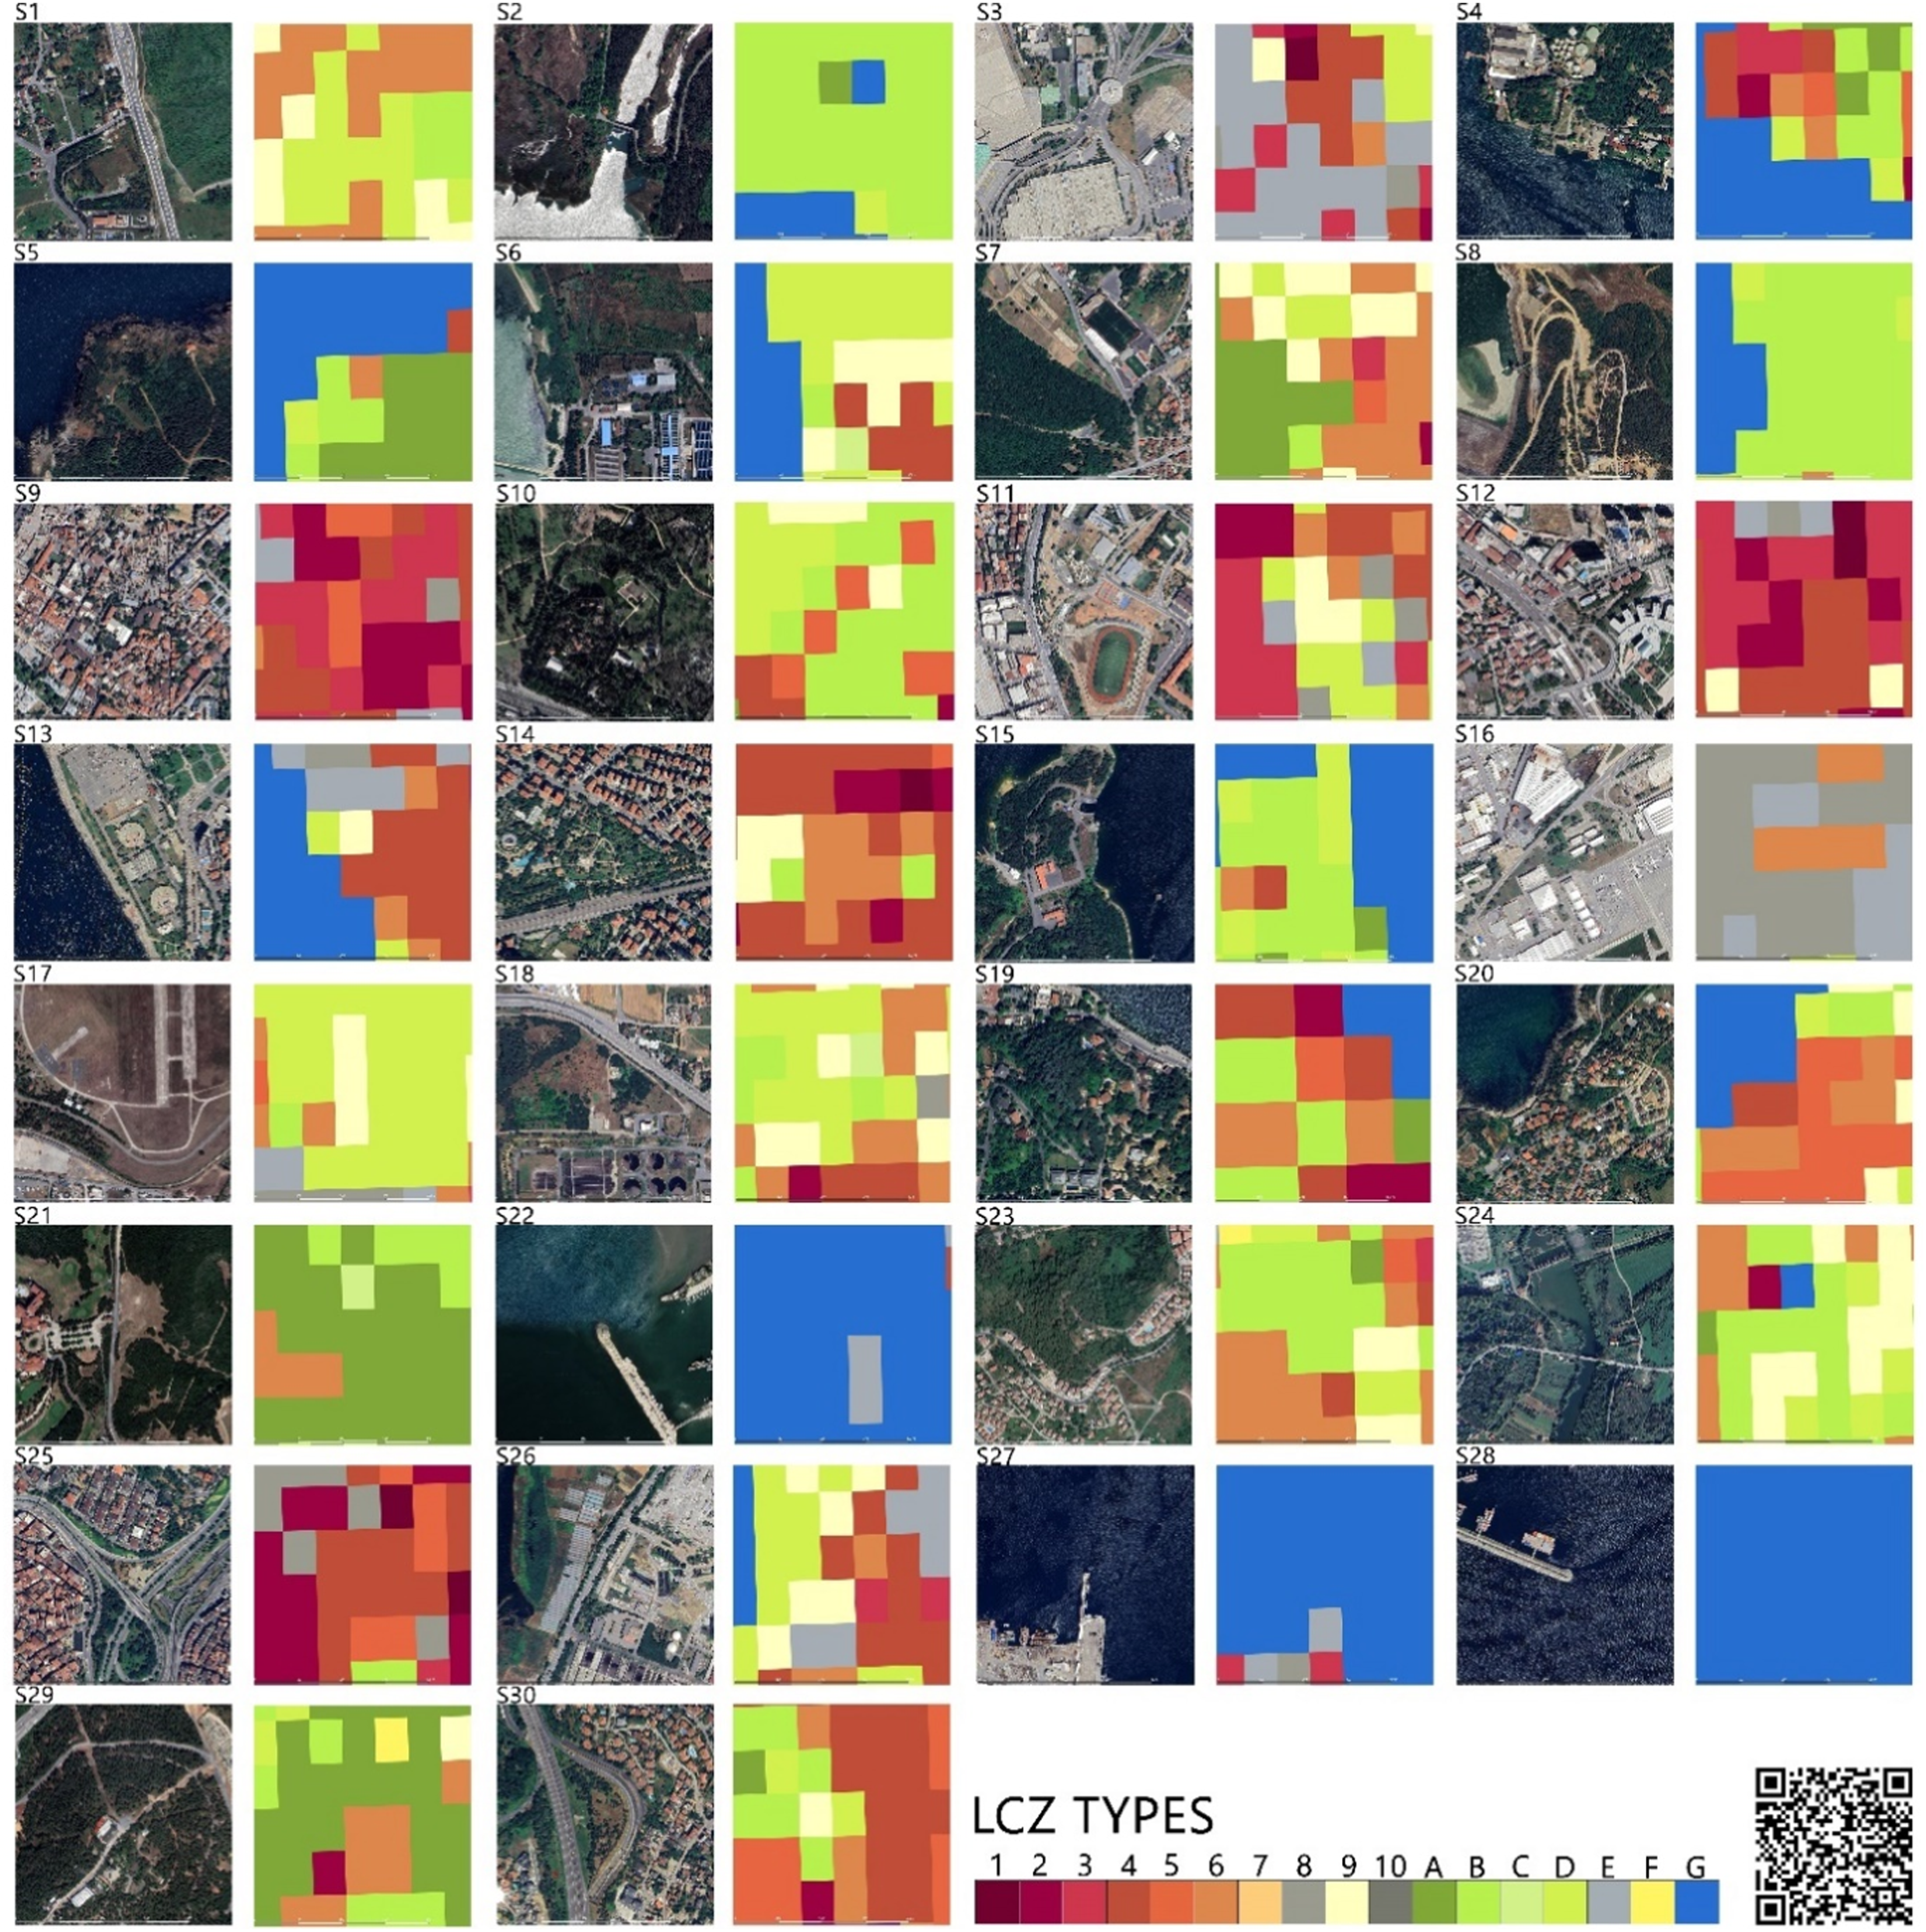
Information on selected stations.
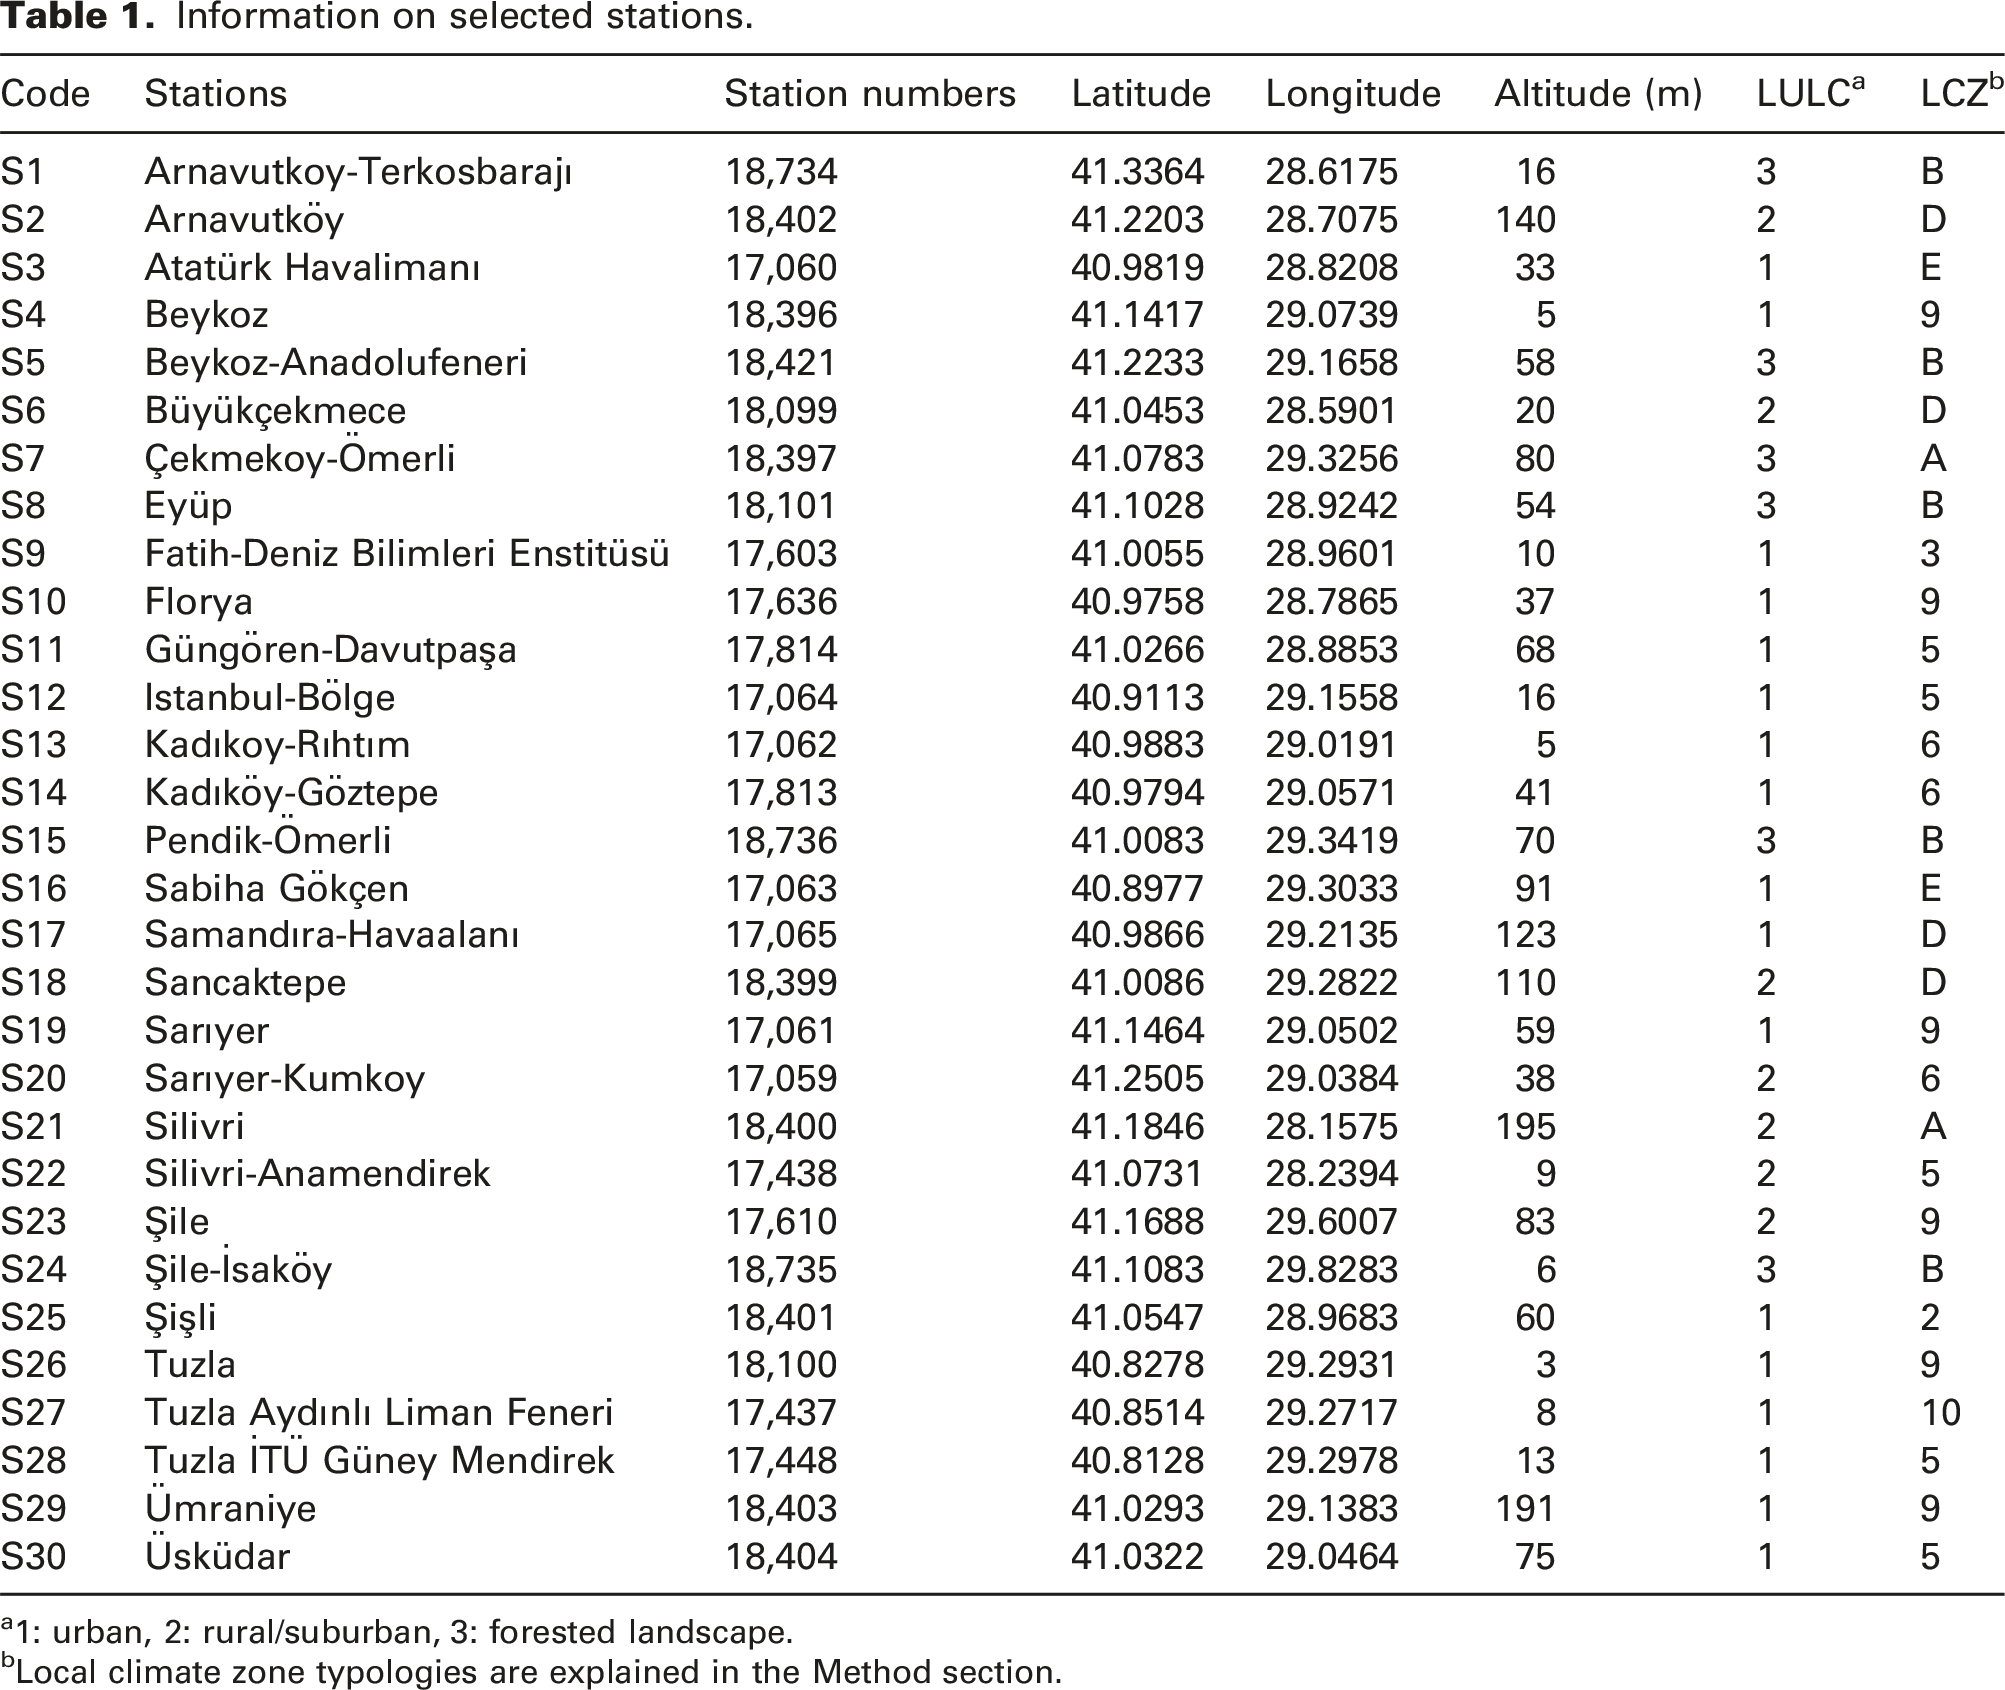
a1: urban, 2: rural/suburban, 3: forested landscape.
bLocal climate zone typologies are explained in the Method section.
Data interpretation and visualization
All data was visualized by Quantum Geographic Information System (QGIS) for maps and R Studio for the figures of time series. On QGIS, inverse distance weighted (IDW) interpolation was used in a monthly scale, and a topographical correction on monthly mean temperature (°C), monthly minimum mean temperature (°C) and monthly maximum mean temperature (°C) to correctly visualize the data. By doing this, a 0.65°C constant value was used for every 100 m altitude.
Findings
Under this heading, monthly mean temperature (°C), monthly minimum mean temperature (°C), monthly maximum mean temperature (°C), temperature frequencies of 35°C and above, monthly mean wind velocity (m/s) and monthly mean relative humidity (%) data were evaluated.
Monthly mean temperatures (°C)
The mean monthly temperatures (°C) for the years 2016–2022 were as follows: 6.20, 7.73, 8.73, 12.59, 17.51, 22.18, 24.38, 24.98, 21.40, 16.61, 12.98 and 8.98. January recorded the lowest temperature, while August registered the highest.
Results of Shapiro–Wilk test on monthly mean temperature (°C).
Results of ANOVA test on monthly mean temperature (°C).
Results of Scheffe’s multi-comparison test on monthly mean temperature (°C).
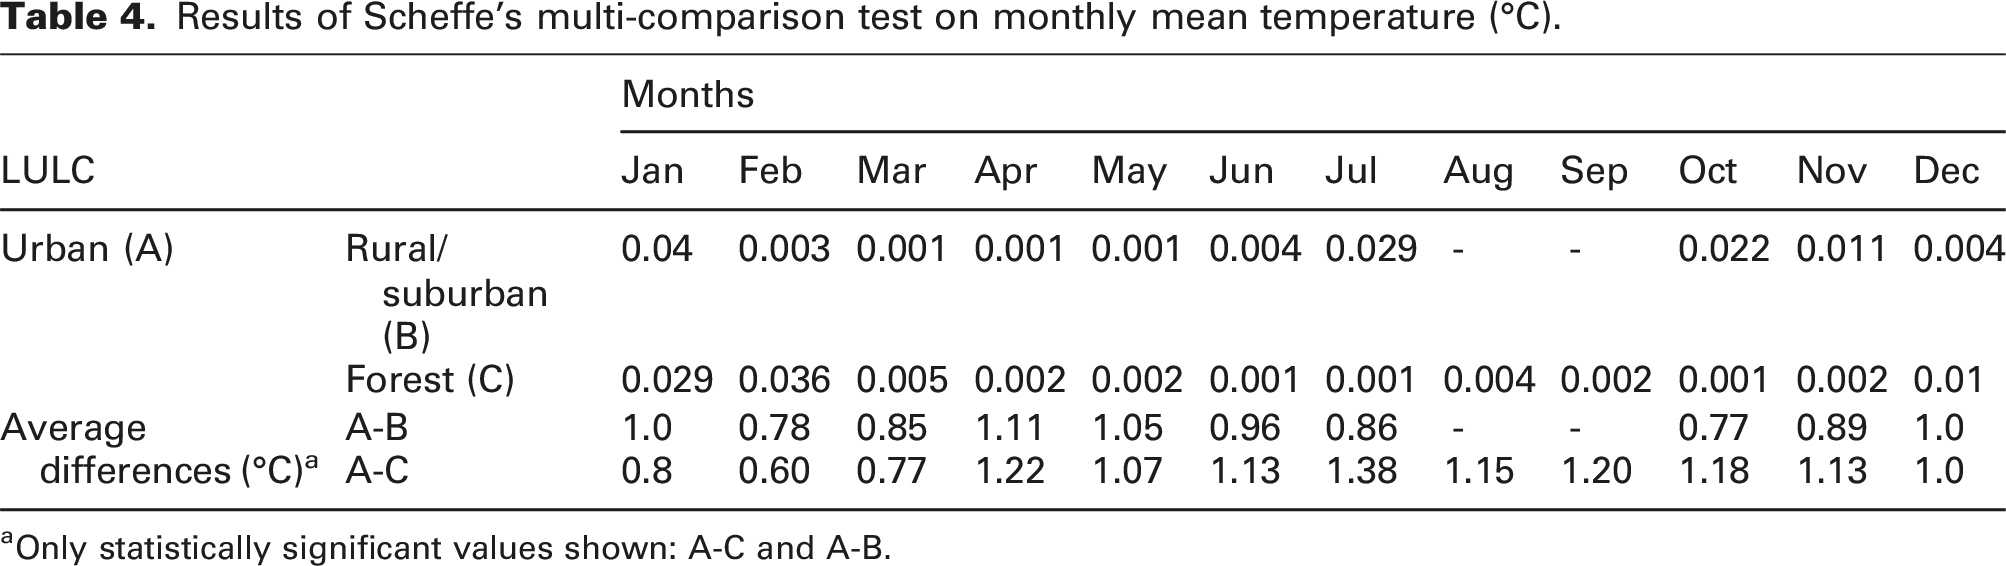
aOnly statistically significant values shown: A-C and A-B.
Linear regression results of latitude and monthly mean temperatures (°C).
Linear regression results of longitude and monthly mean temperatures (°C).
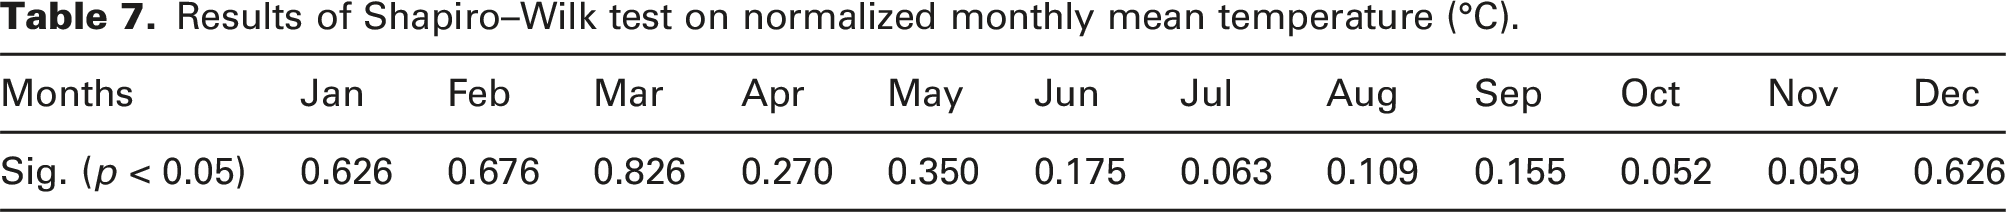
Results of Shapiro–Wilk test on normalized monthly mean temperature (°C).
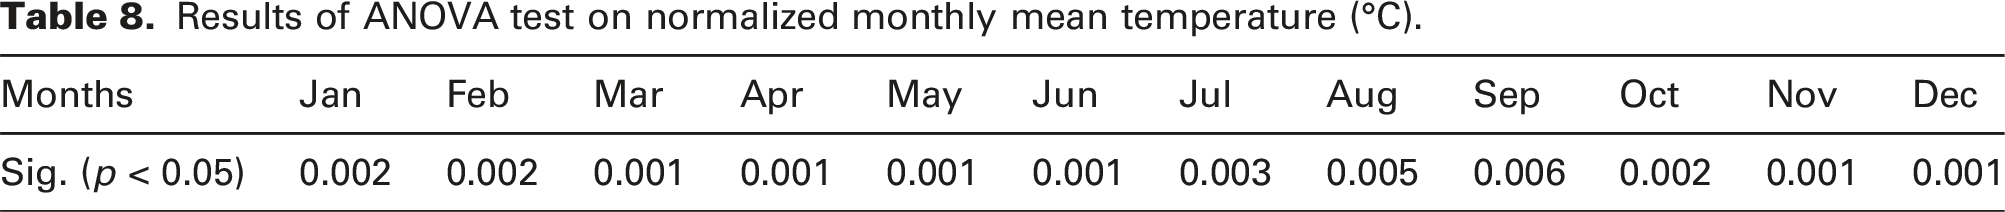
Results of ANOVA test on normalized monthly mean temperature (°C).
Results of Scheffe’s multi-comparison test on normalized monthly mean temperature (°C).
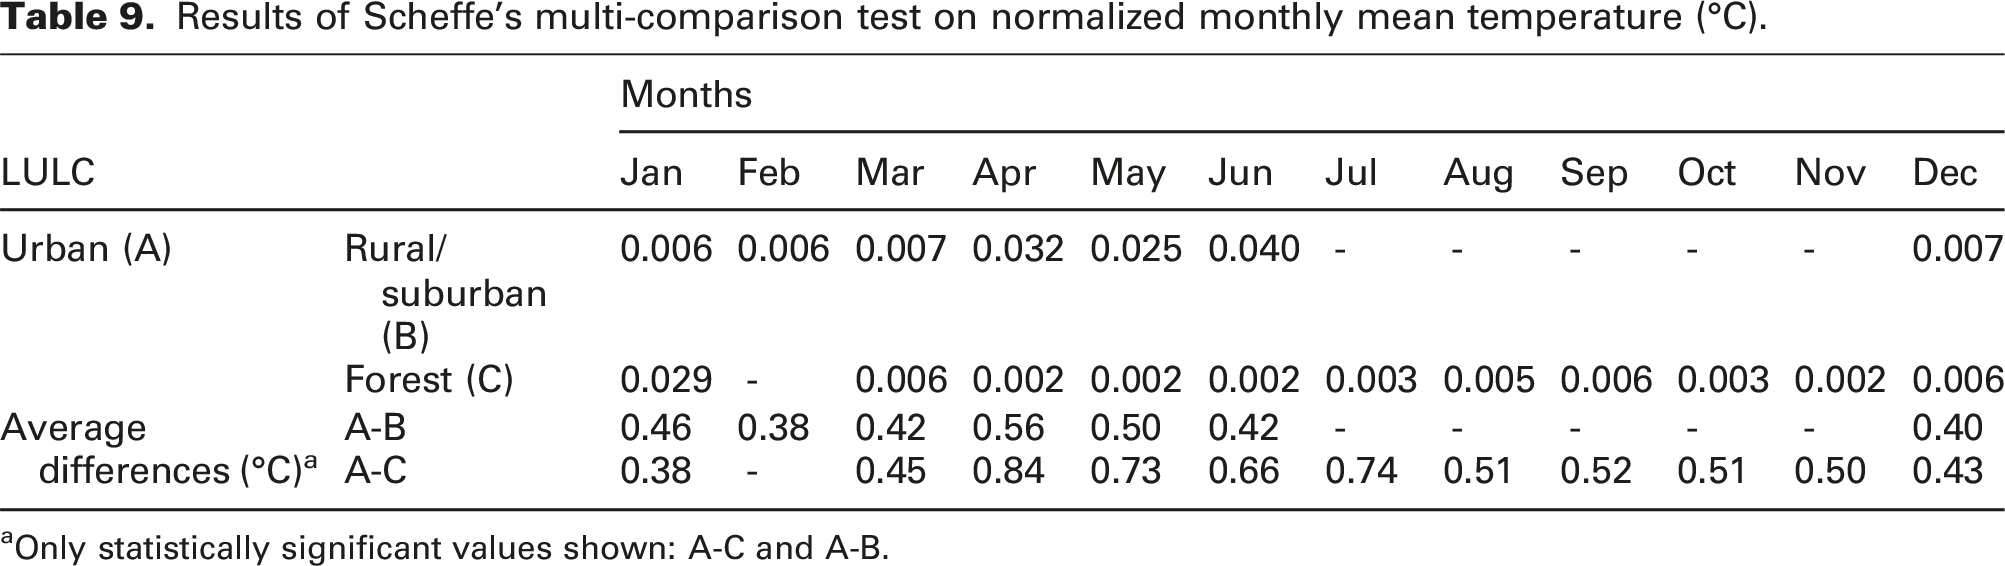
aOnly statistically significant values shown: A-C and A-B.
Monthly mean temperature data (°C) of LCZ typologies.
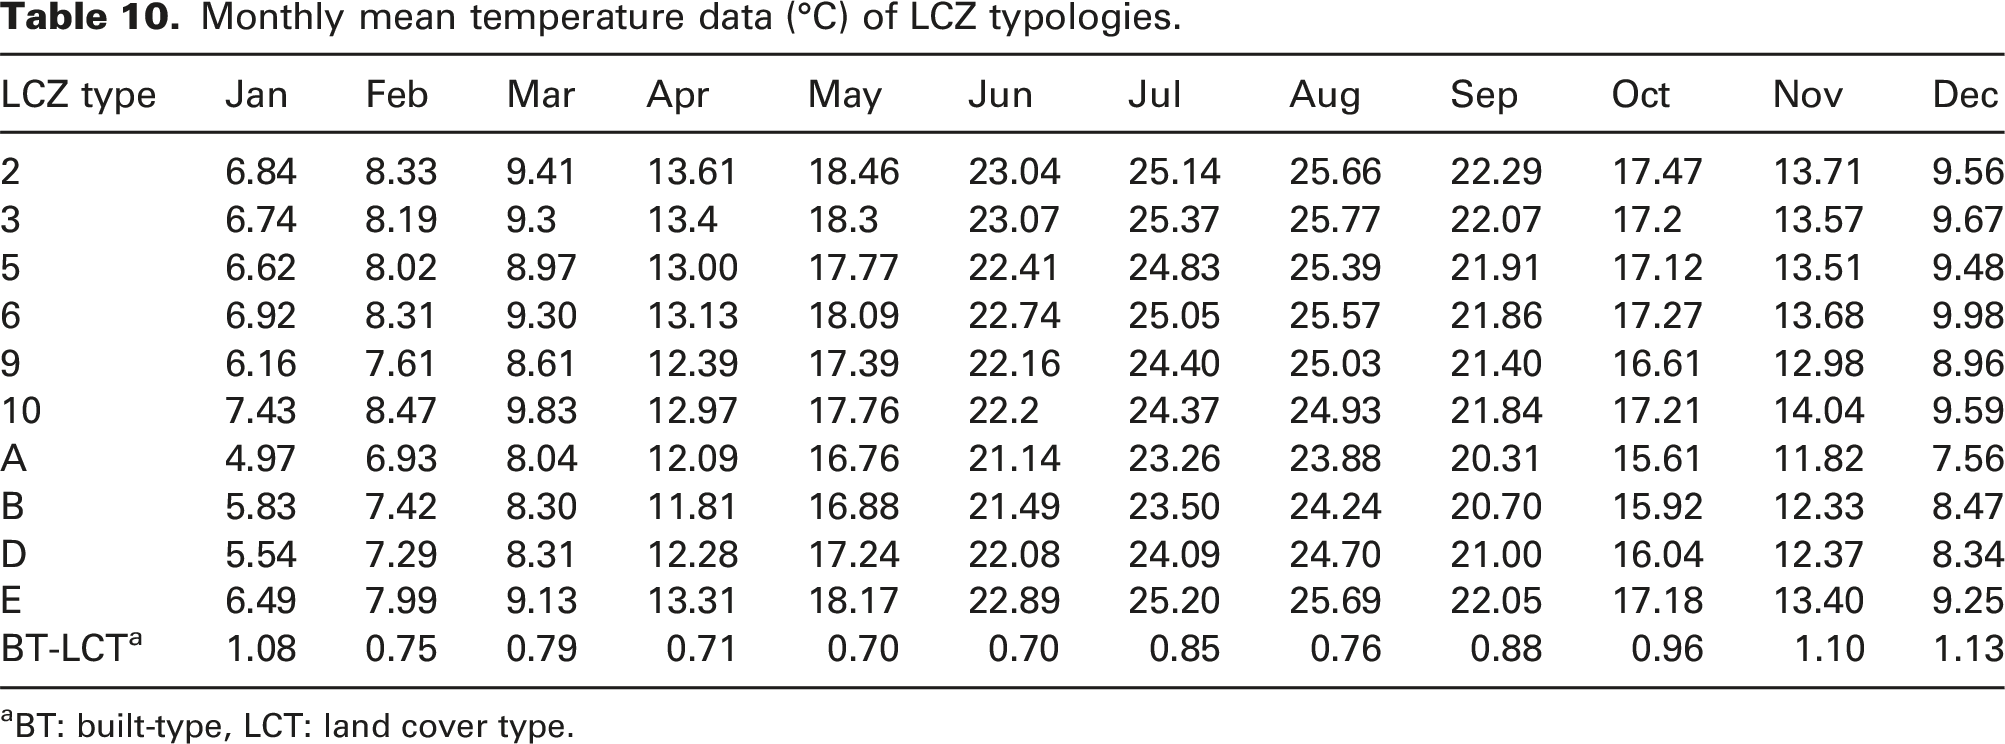
aBT: built-type, LCT: land cover type.
Normalized monthly mean temperature data (°C) of LCZ typologies.
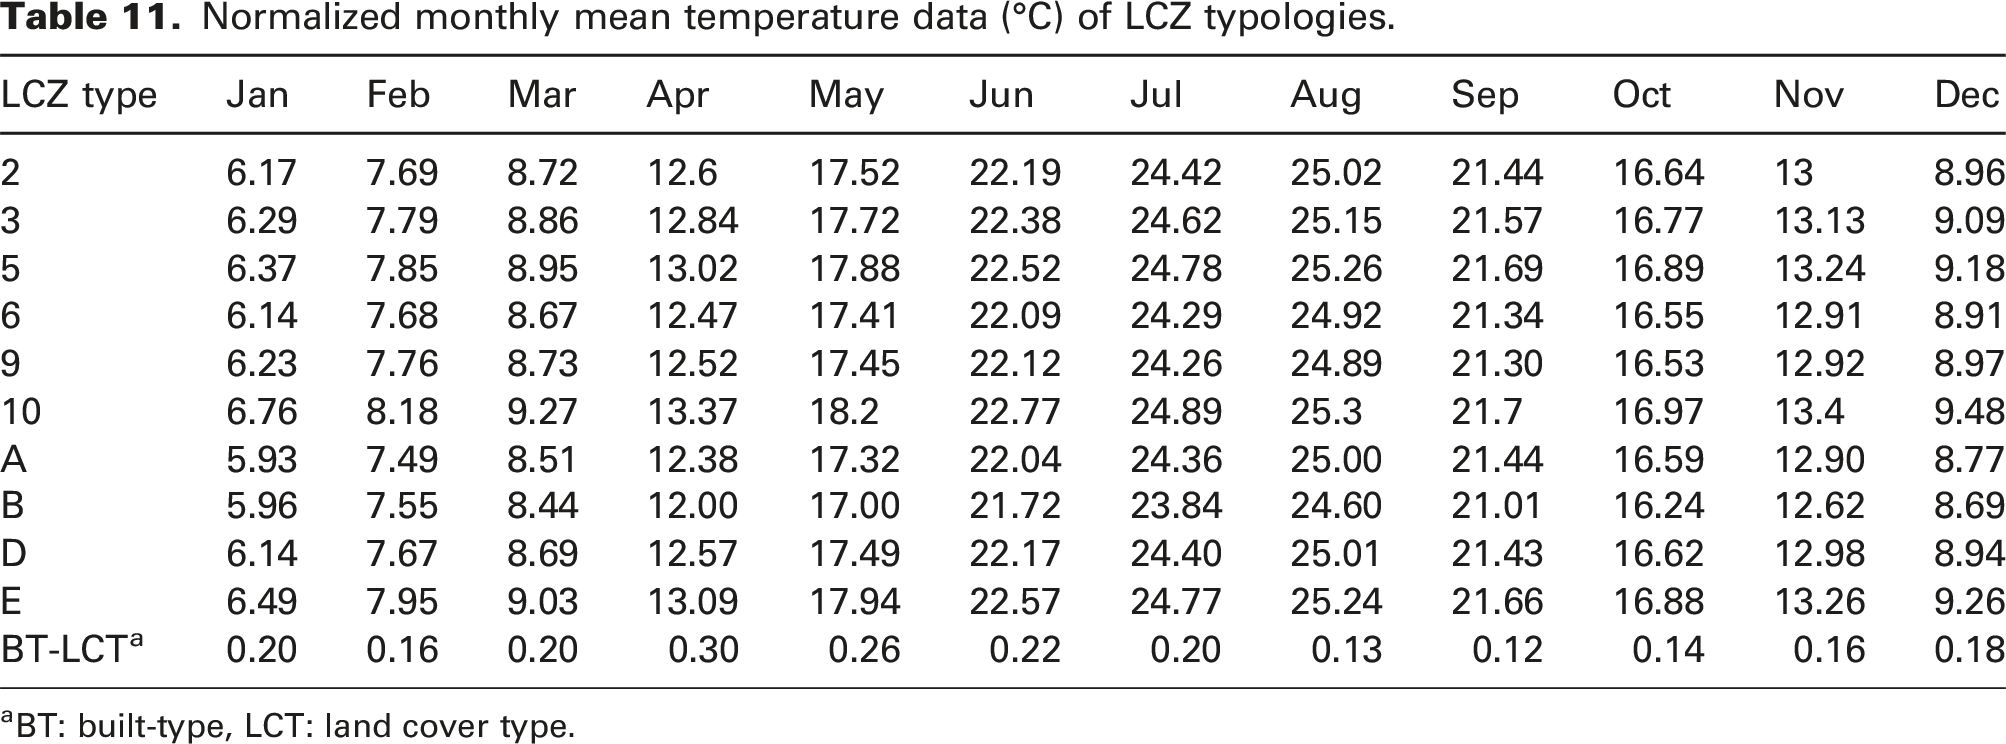
aBT: built-type, LCT: land cover type.
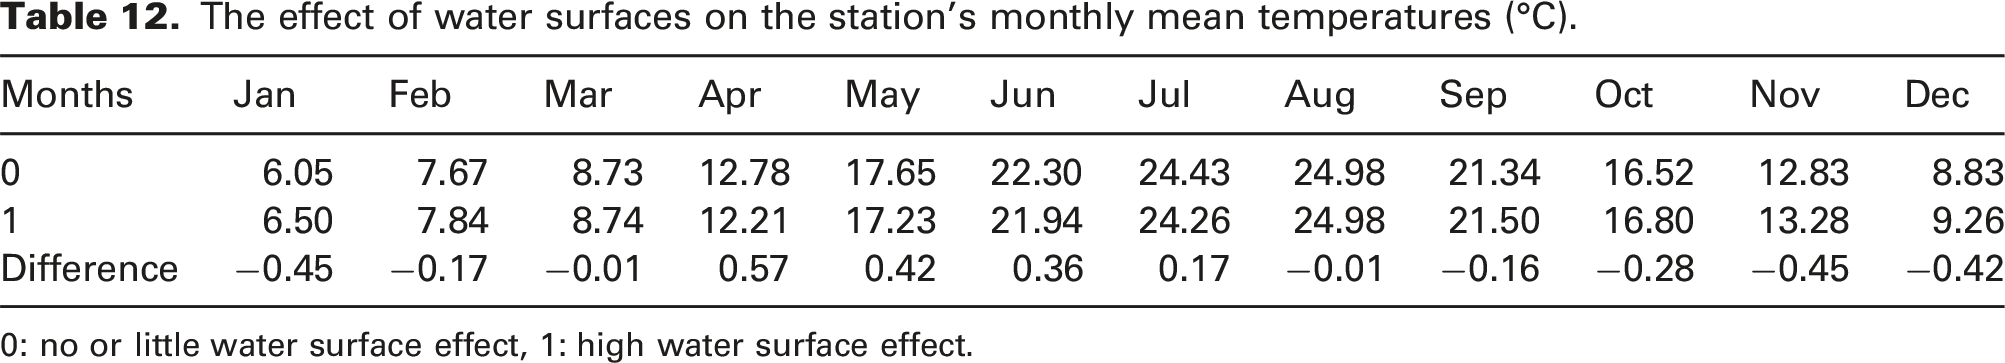
January was the coldest month at 6.20°C. In January, the higher parts of the city with the natural formation were important cold area clusters. These examples were seen in Silivri and Çatalca districts (left-rectangular), Aydos and Kayışdağı regions (right-rectangular in Figure 5). In August, the mean temperature was 24.98°C. Similar to January, there were cool islands in the same areas. However, temperature differences were narrow compared to January values (Figure 6). Interpolation map of monthly mean temperatures (°C) of January by the inverse weighted distance. Topography correction has been made on the maps and the raw data has been reduced by 0.65°C for every 100 m of elevation. 25 m resolution EarthExplorer satellite DEM data was used for topography correction. Interpolation map of monthly mean temperatures (°C) of August by the inverse weighted distance. Topography correction has been made on the maps and the raw data has been reduced by 0.65°C for every 100 m of elevation. 25 m resolution EarthExplorer satellite DEM data was used for topography correction.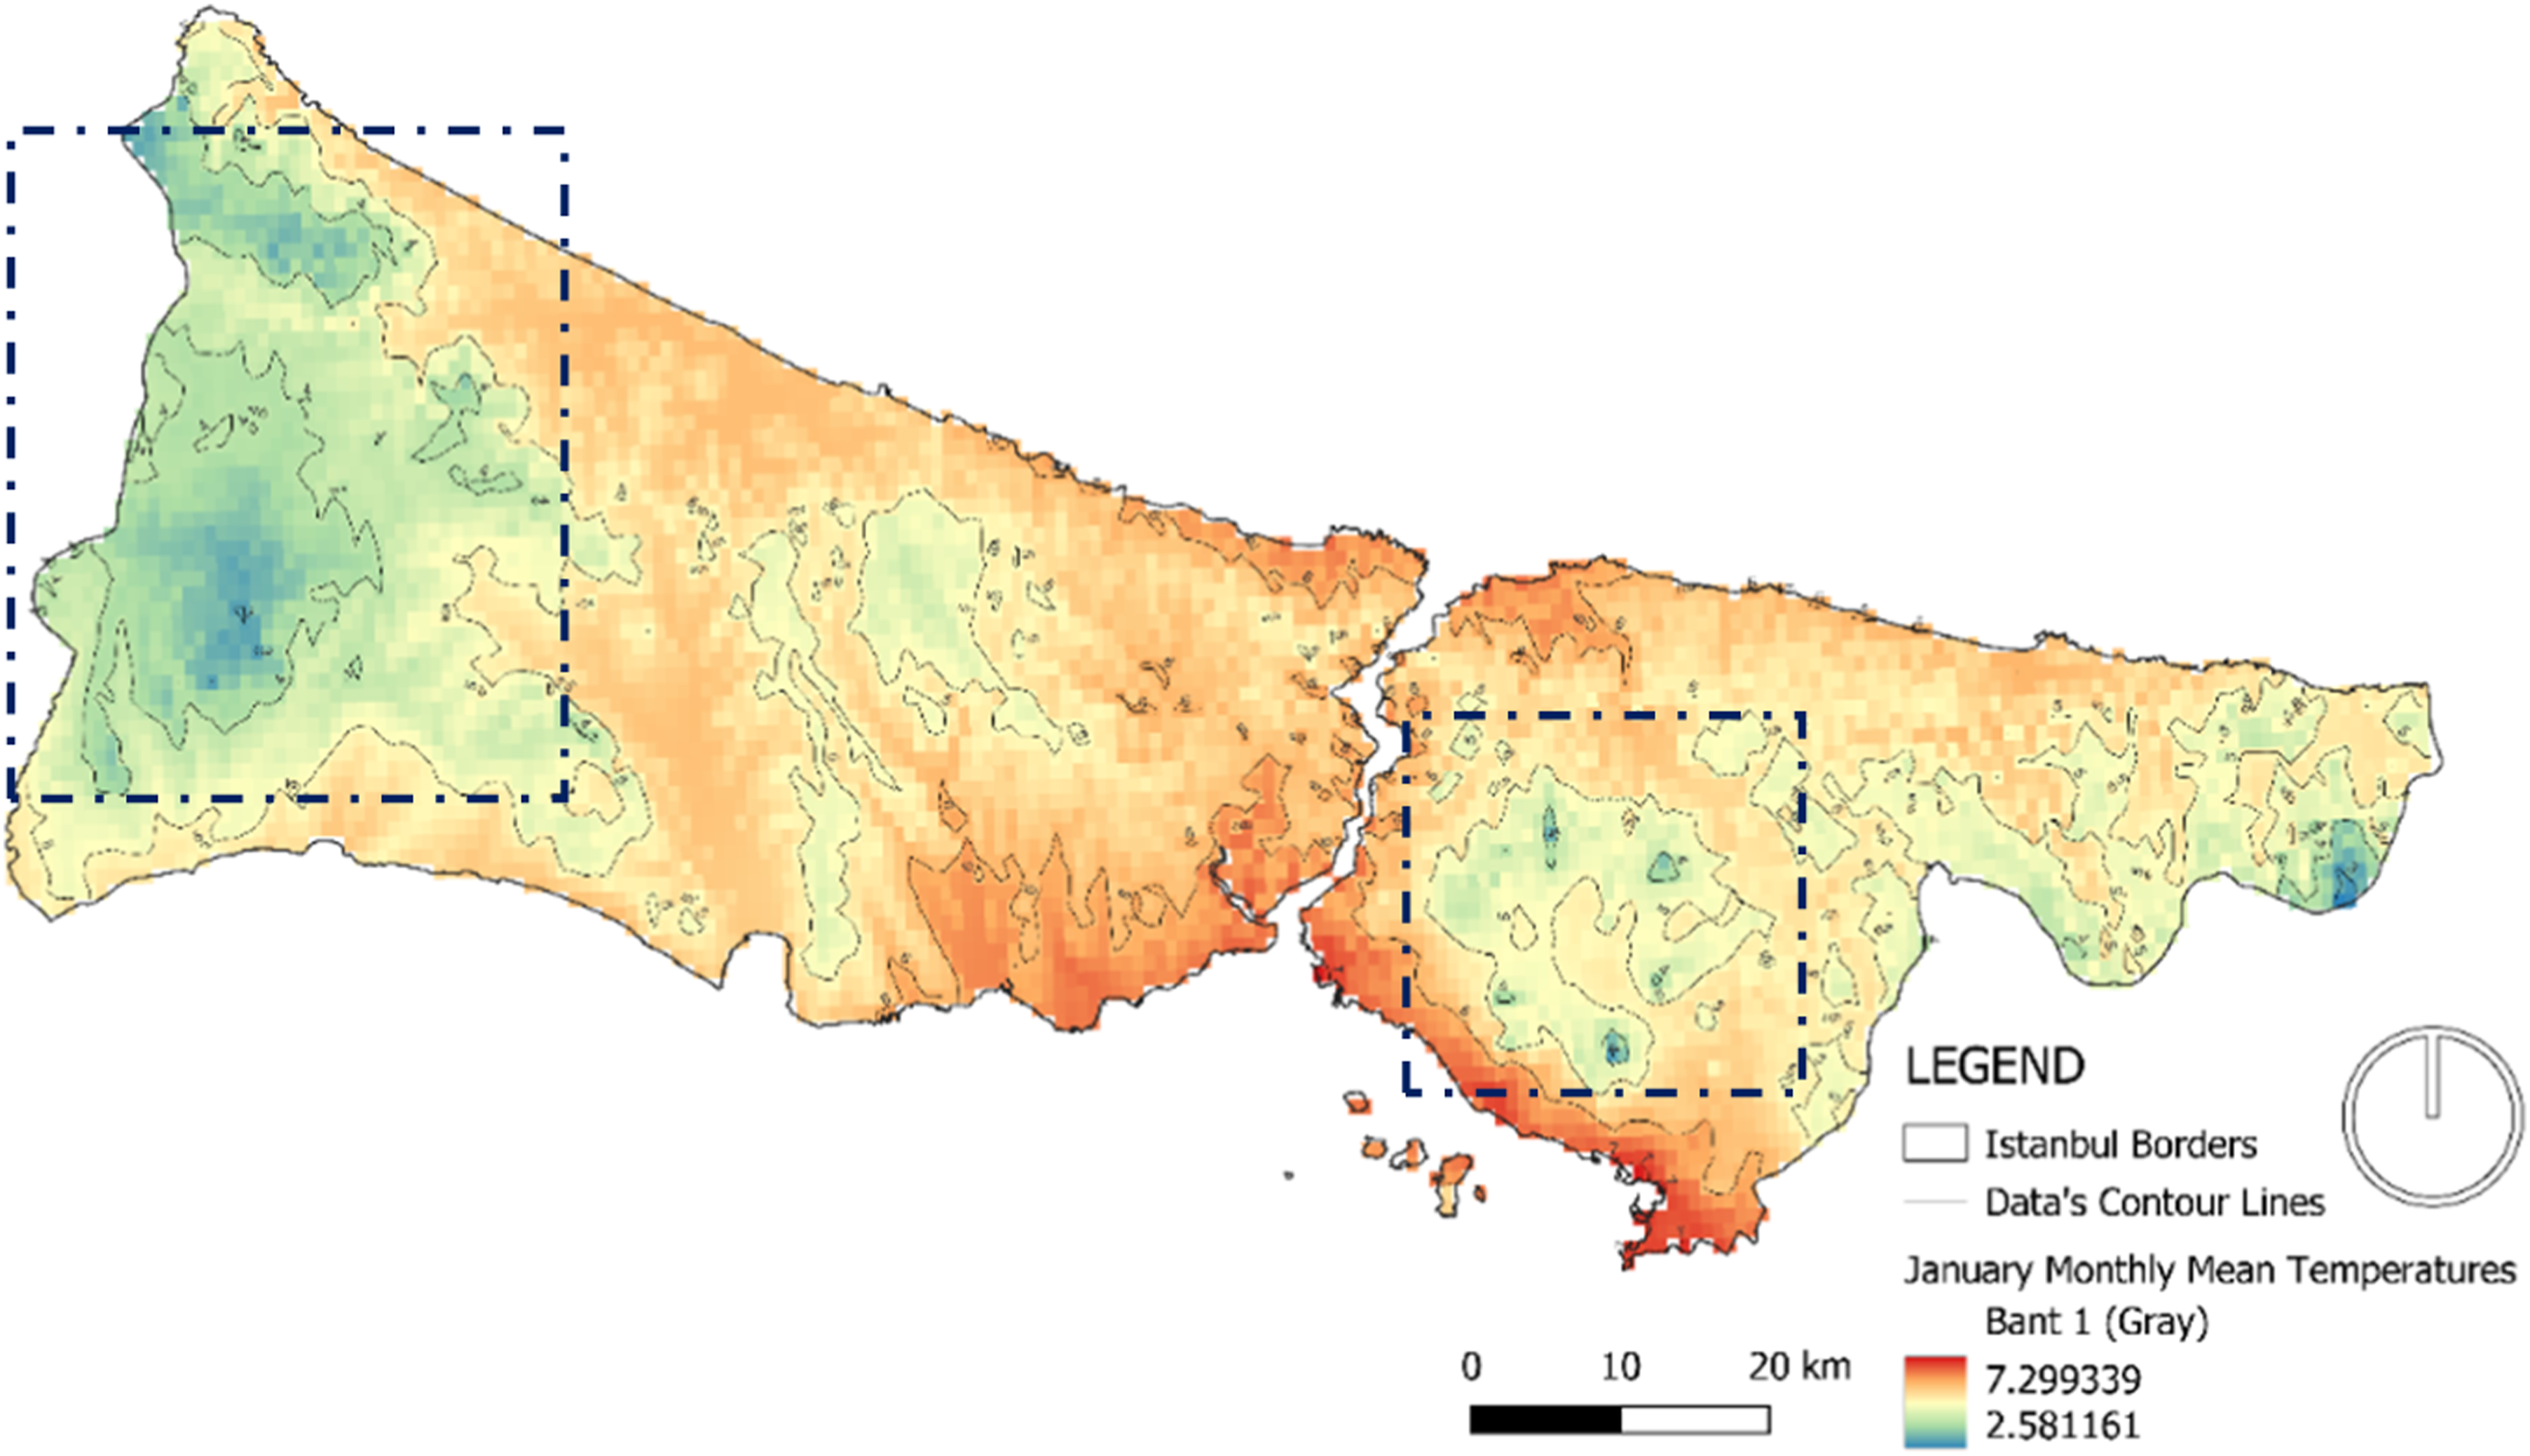
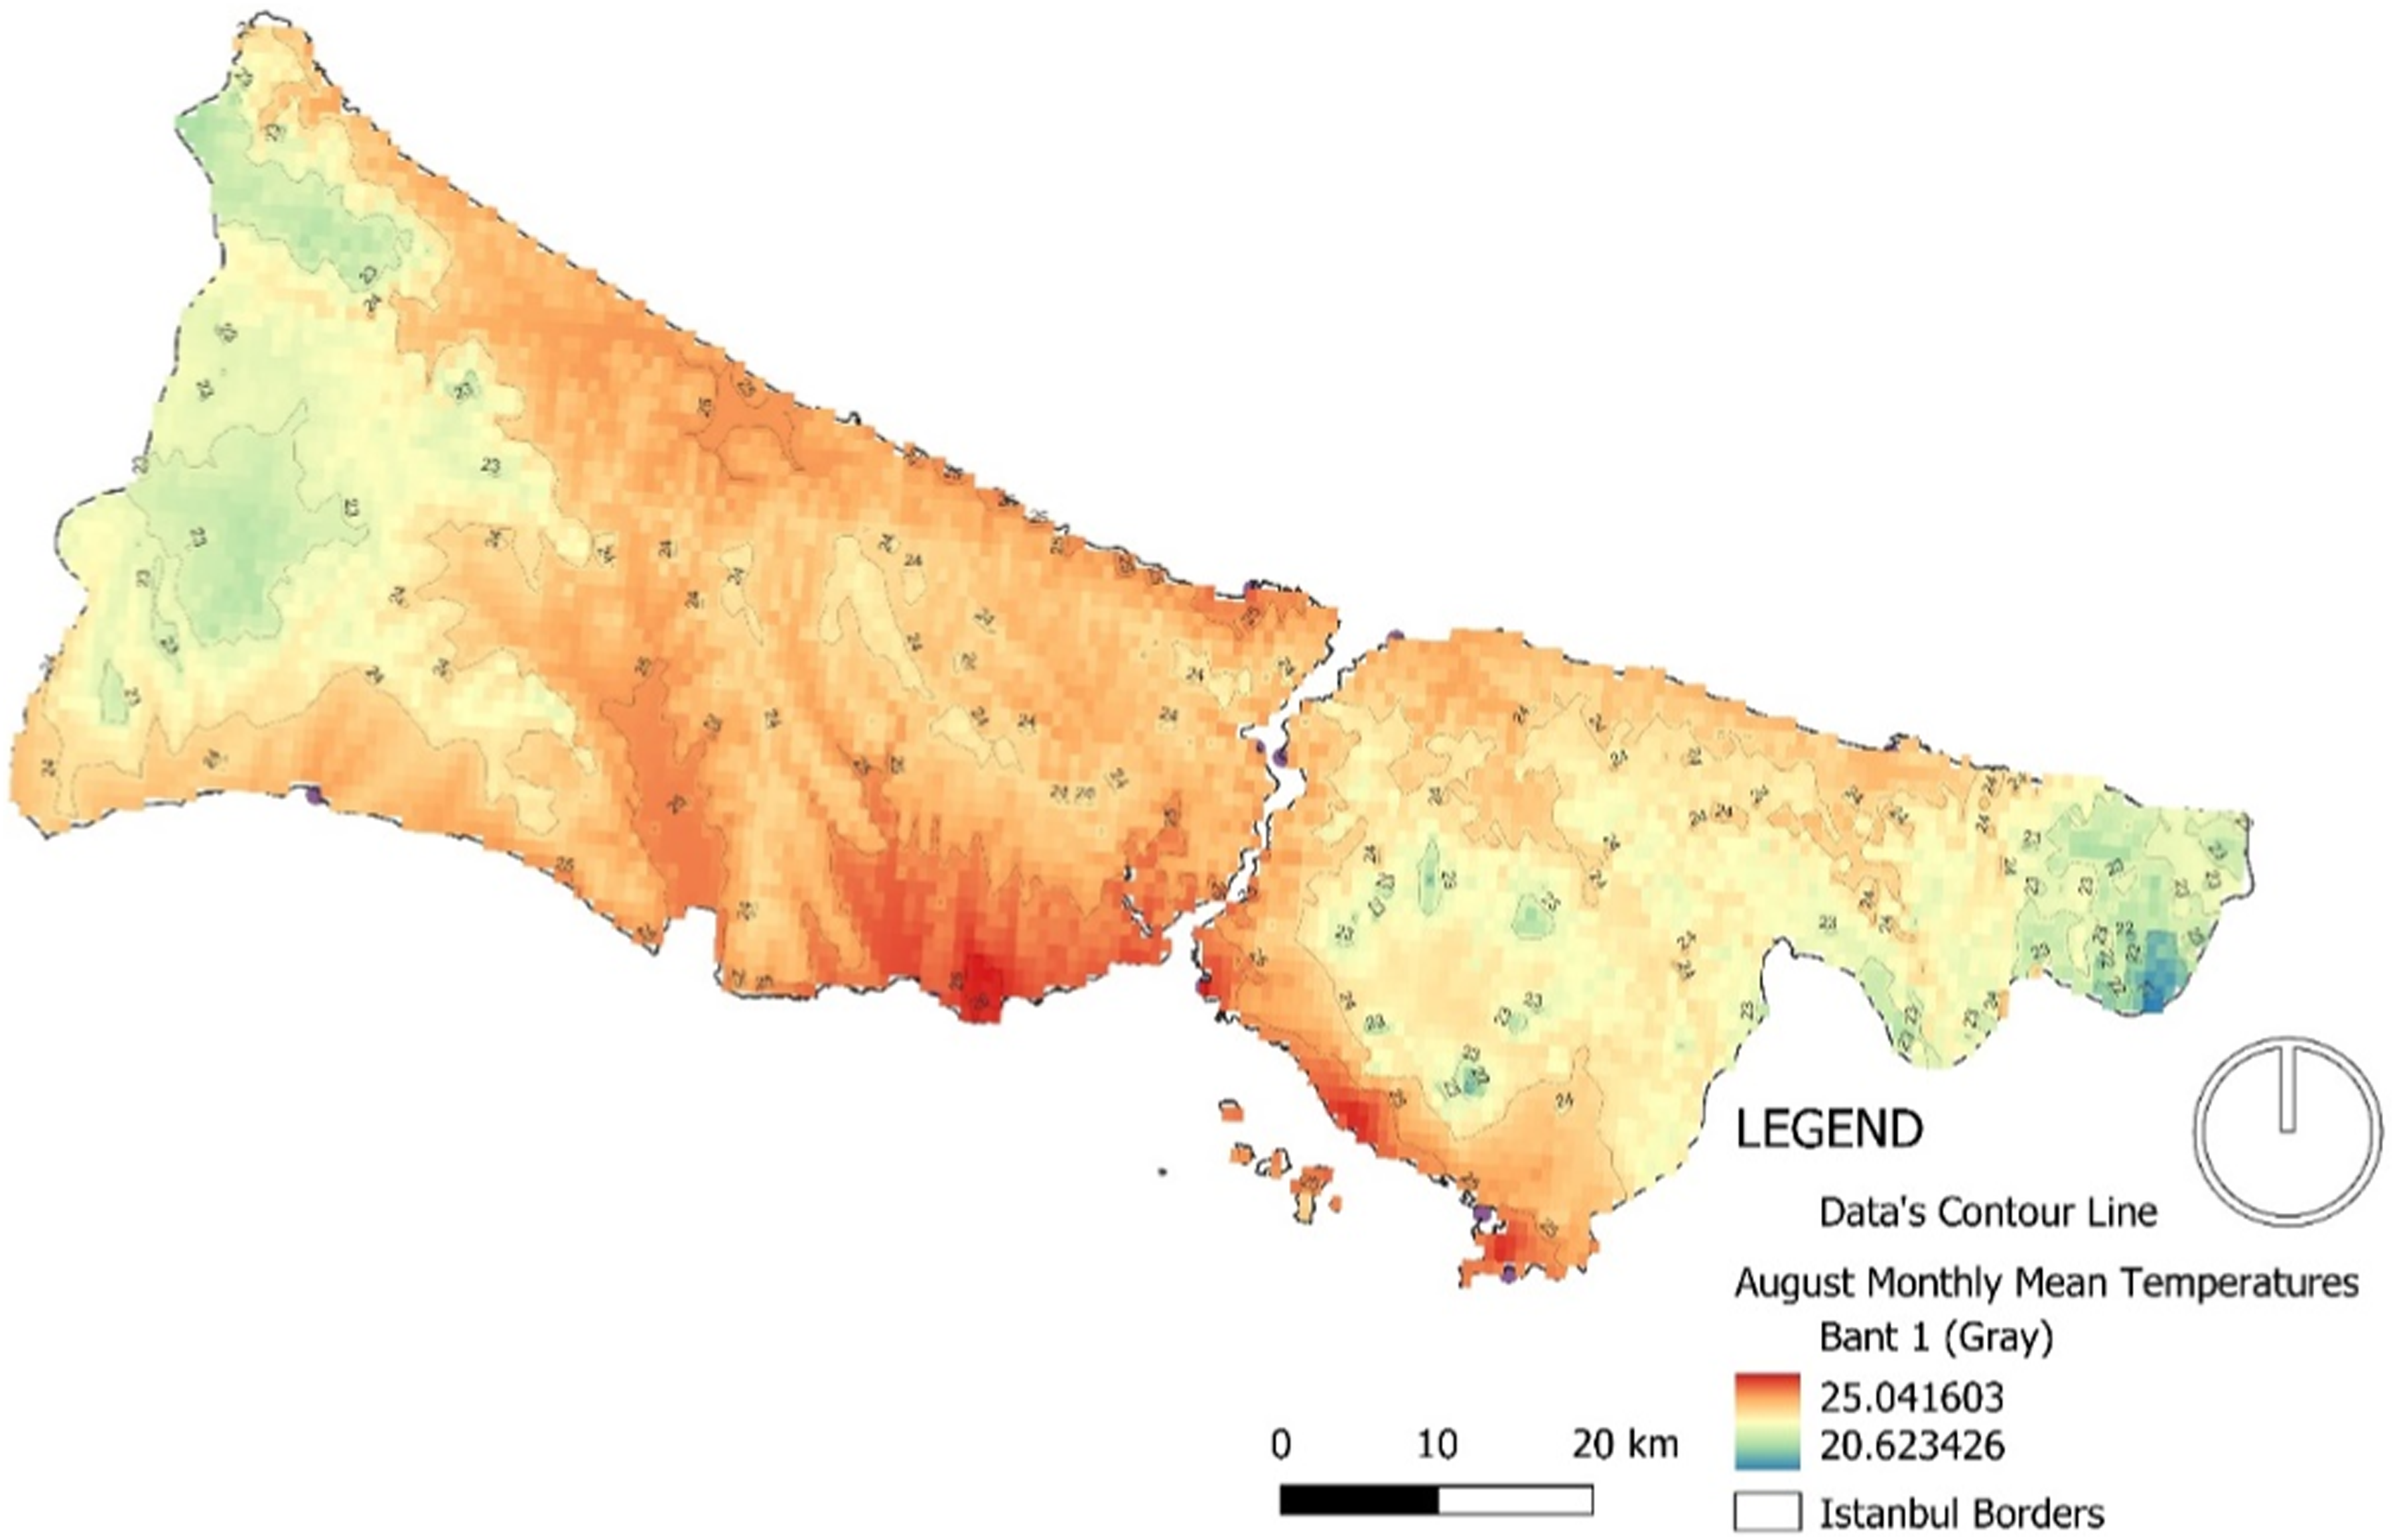
The effect of water surfaces on the station’s monthly mean temperatures (°C).
0: no or little water surface effect, 1: high water surface effect.
Monthly minimum mean temperatures (°C)
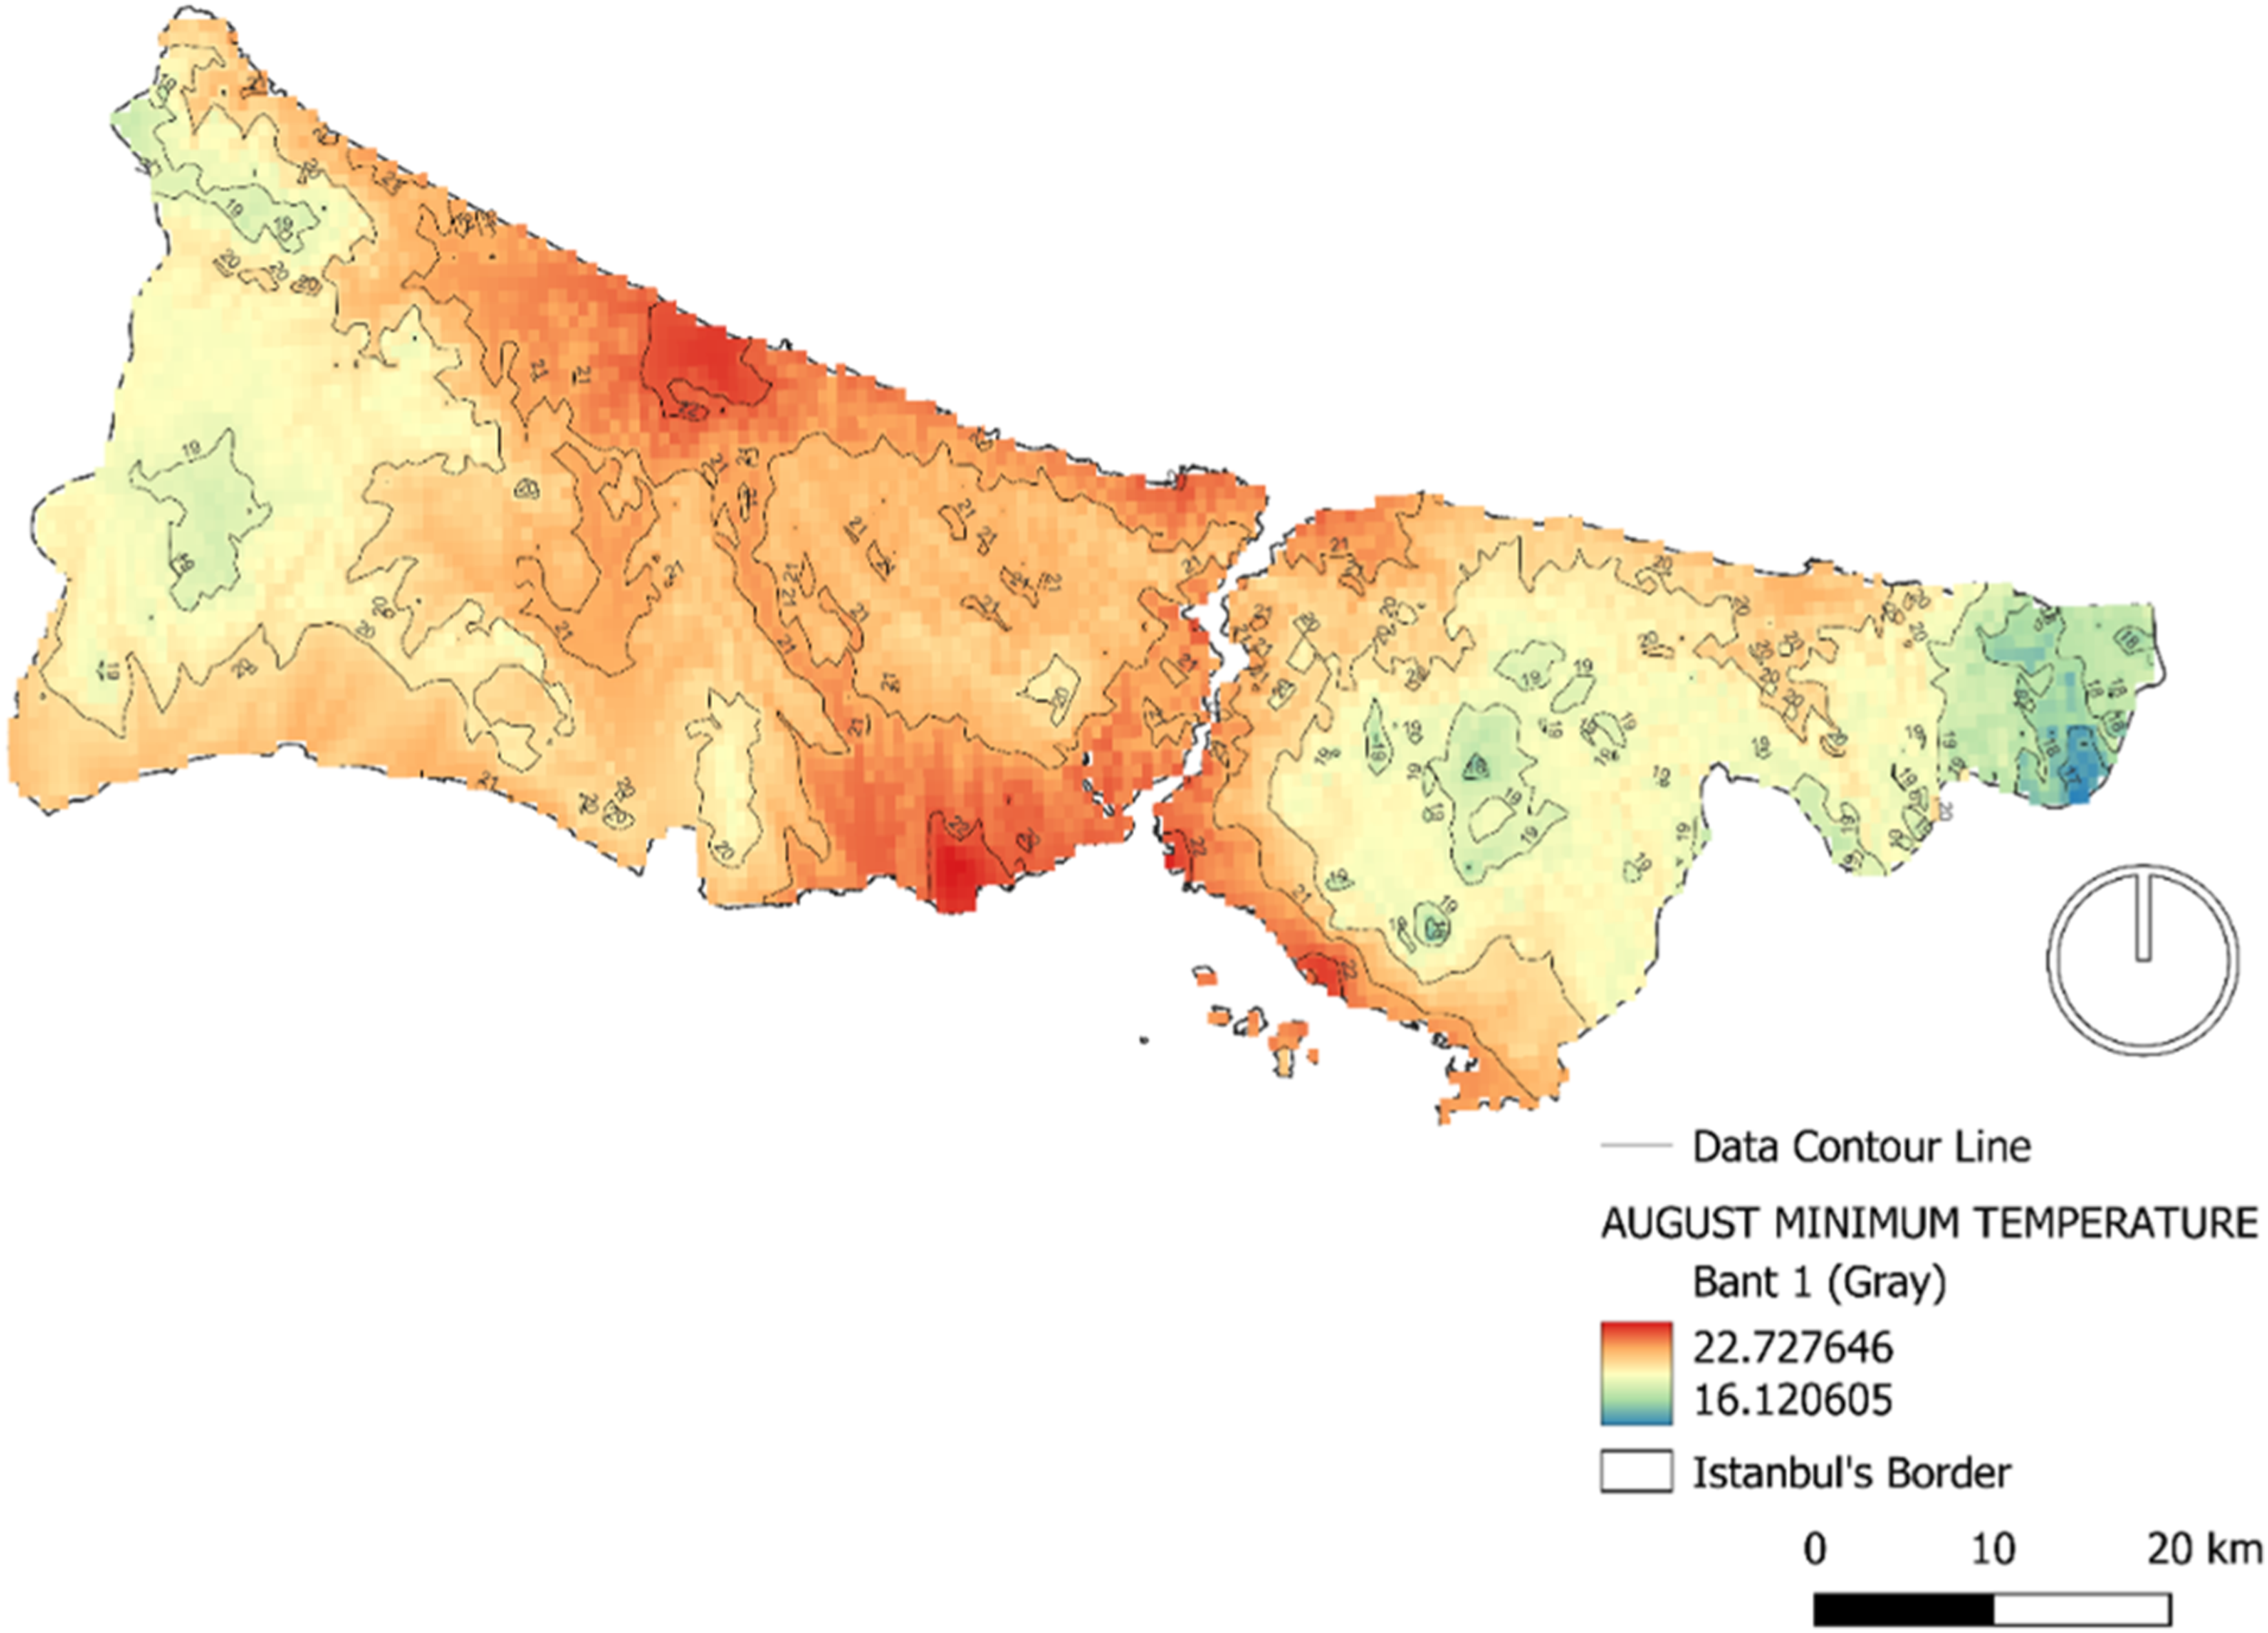
The monthly minimum mean temperatures for the specified period were as follows: 3.37, 4.57, 5.25, 8.19, 13.27, 18.04, 20.12, 21.16, 17.47, 13.15, 9.92 and 6.25. According to the monthly minimum mean temperature (°C) between 2016 and 2022, the coldest month and the warmest month are January at 3.37°C and August at 21.16°C. Similar to monthly mean temperature (°C), urbanized area of Istanbul was much warmer than the other typologies (Figures 7 and 8). Interpolation map of monthly minimum mean temperatures (°C) of January by the inverse weighted distance. Topography correction has been made on the maps and the raw data has been reduced by 0.65°C for every 100 m of elevation. 25 m resolution EarthExplorer satellite DEM data was used for topography correction. Interpolation map of monthly minimum mean temperatures (°C) of August by the inverse weighted distance. Topography correction has been made on the maps and the raw data has been reduced by 0.65°C for every 100 m of elevation. 25 m resolution EarthExplorer satellite DEM data was used for topography correction.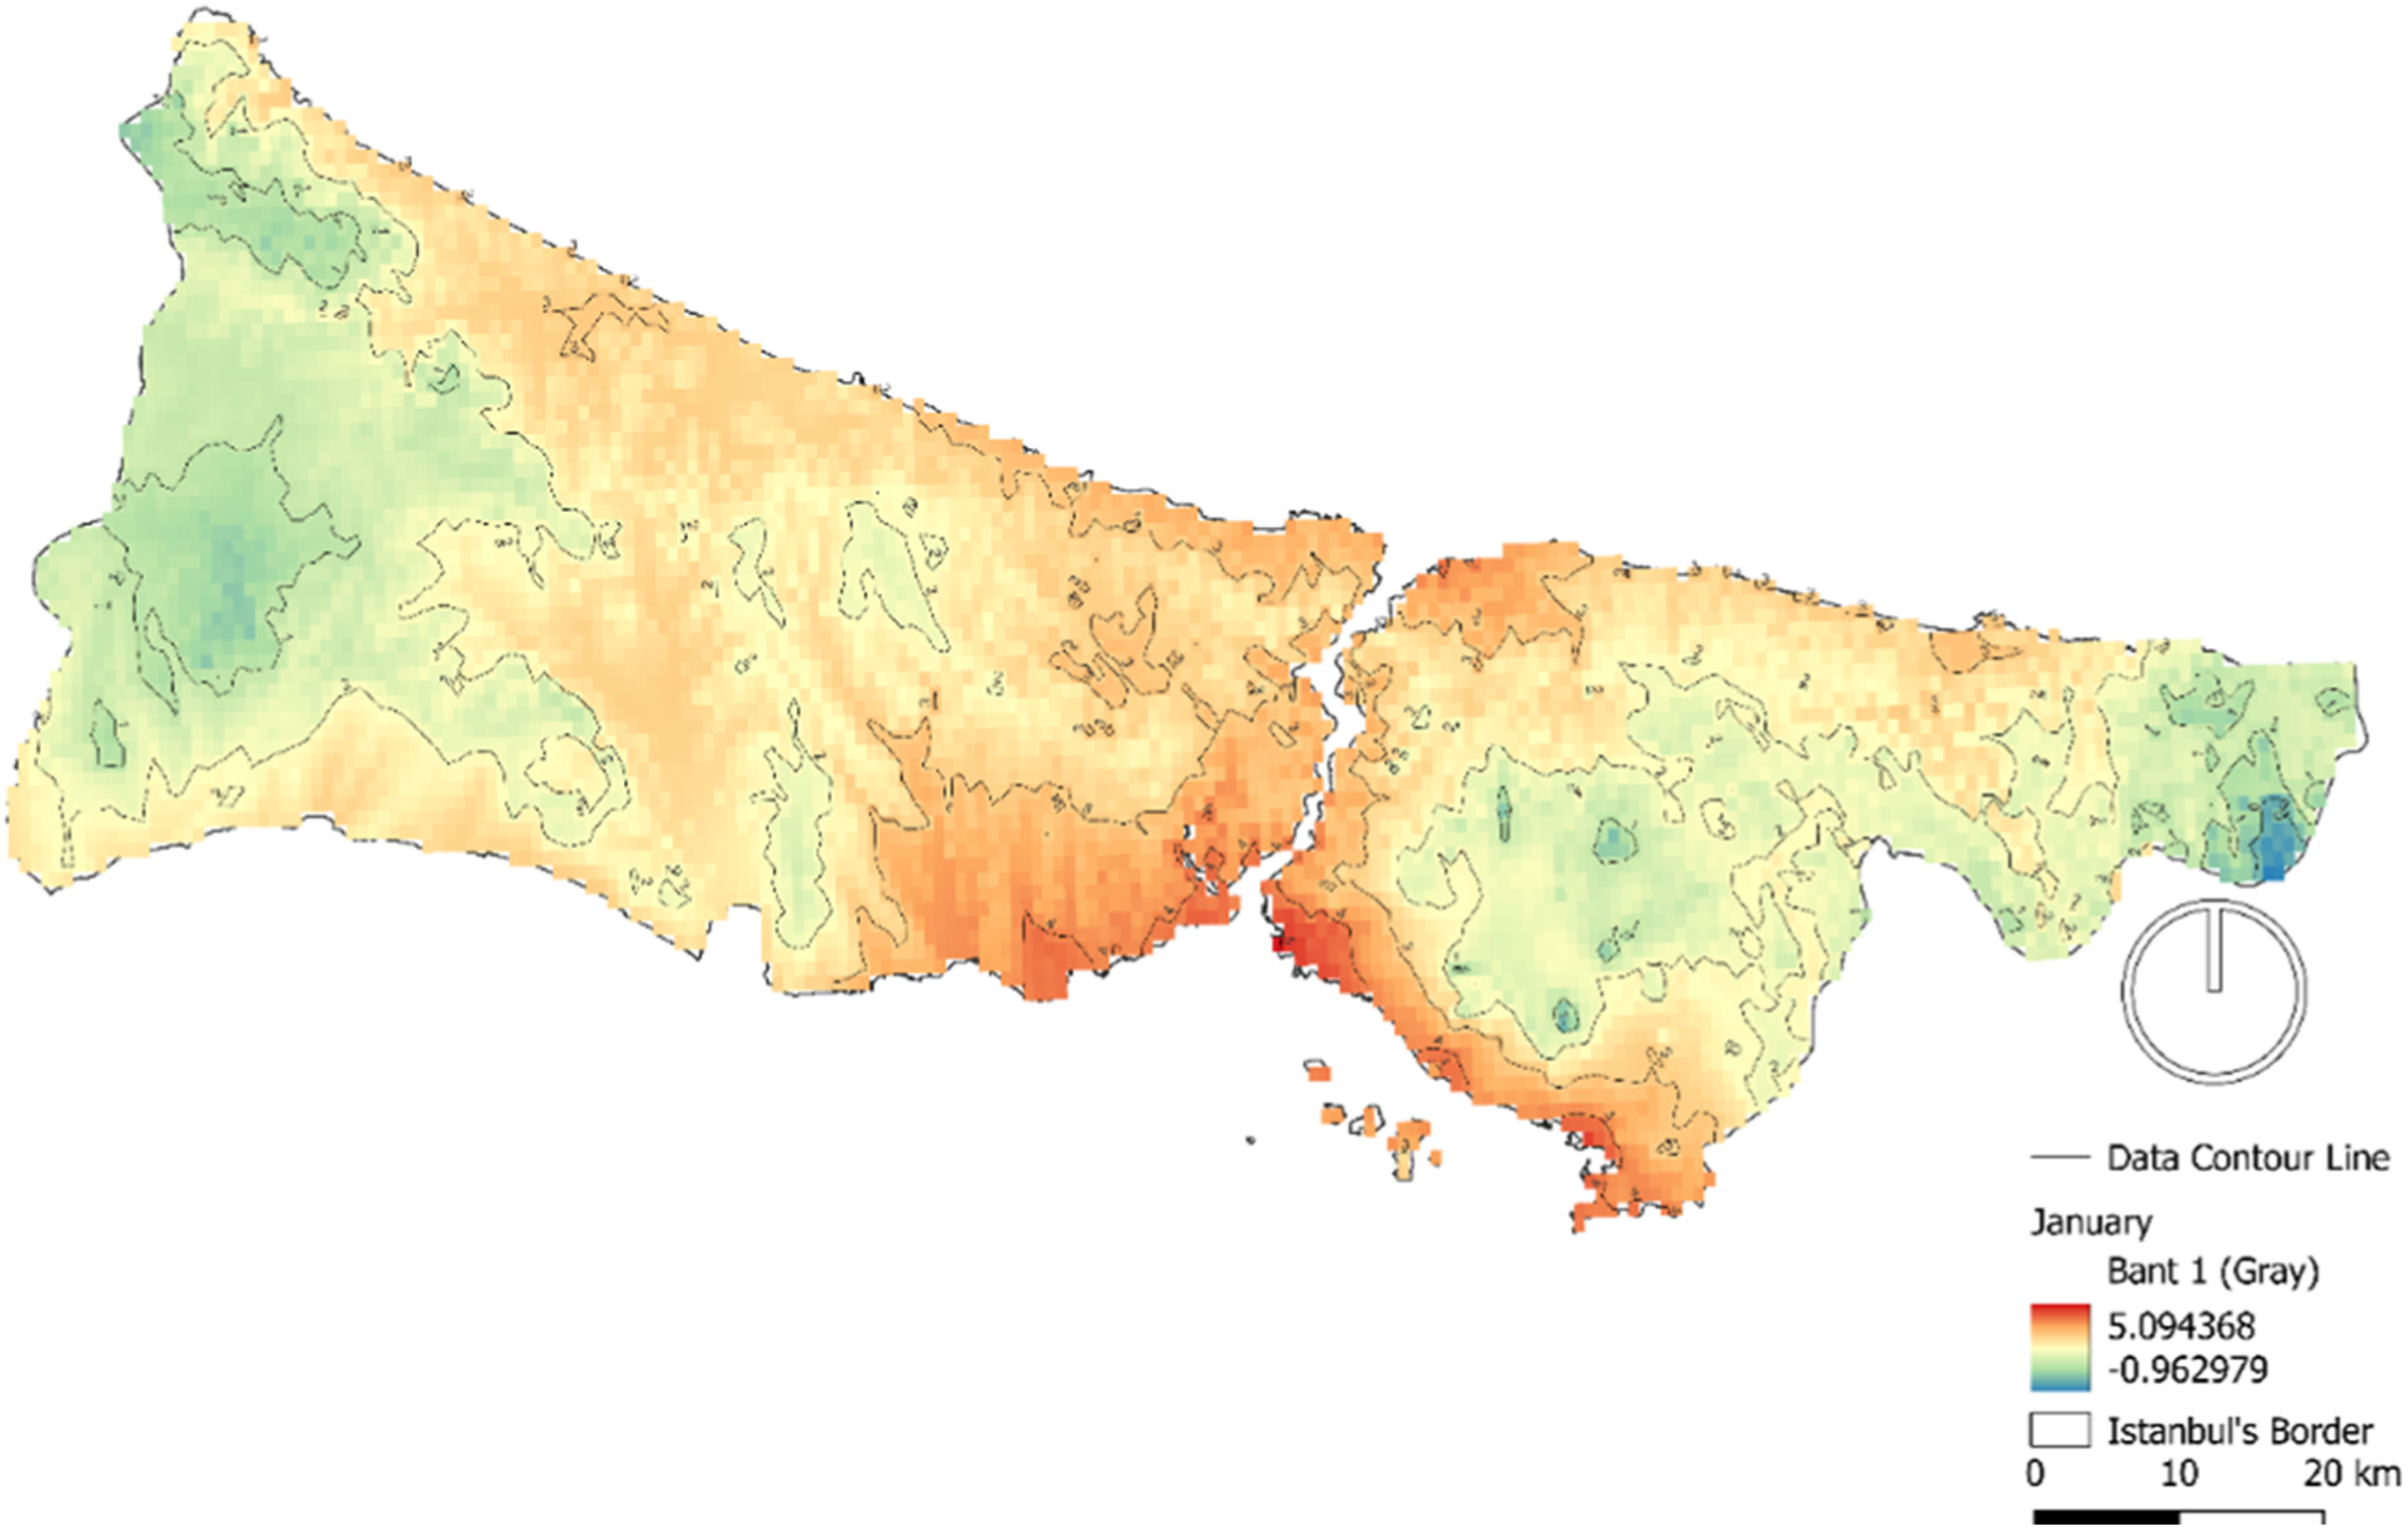
Results of Shapiro–Wilk test on monthly minimum mean temperature (°C).
Results of ANOVA test on monthly minimum mean temperature (°C).
Results of Scheffe’s multi-comparison test on monthly minimum mean temperature (°C).
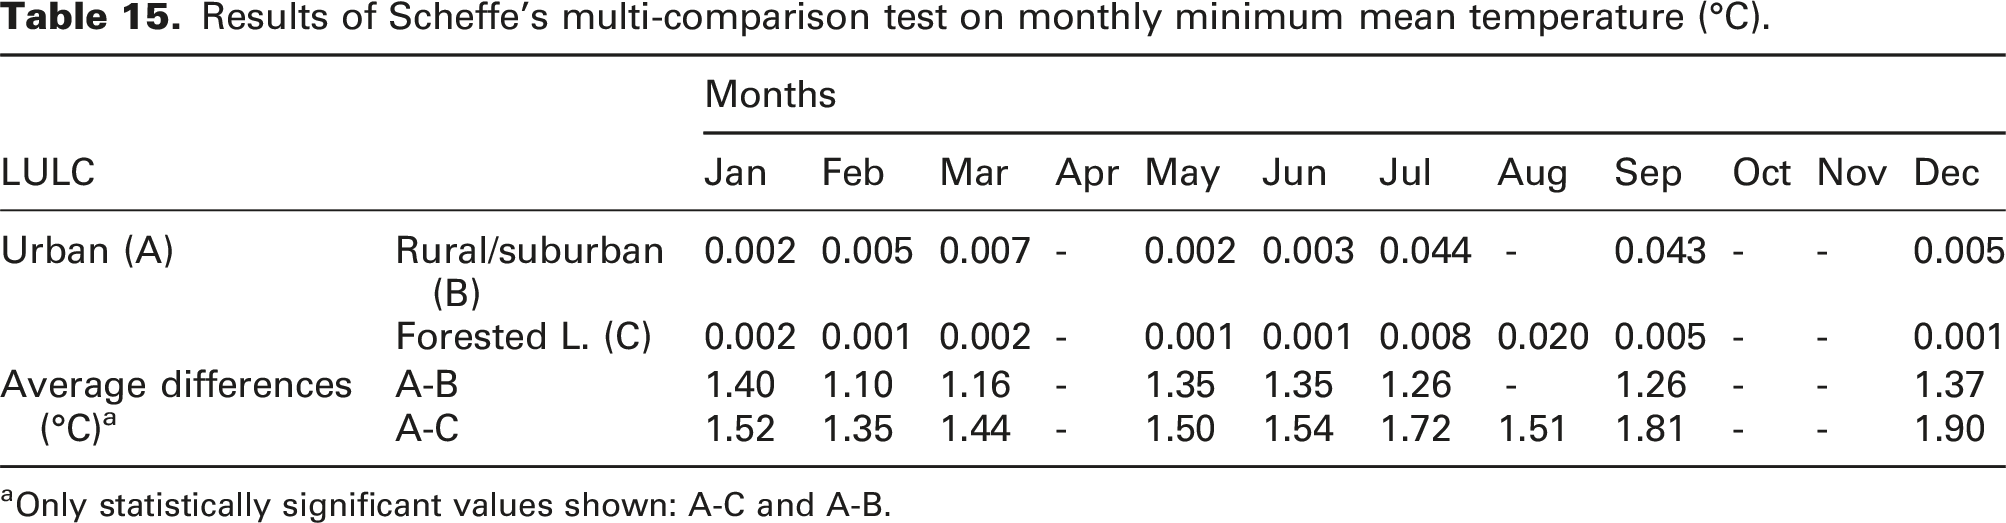
aOnly statistically significant values shown: A-C and A-B.
Linear regression results of latitude and monthly minimum mean temperatures (°C).
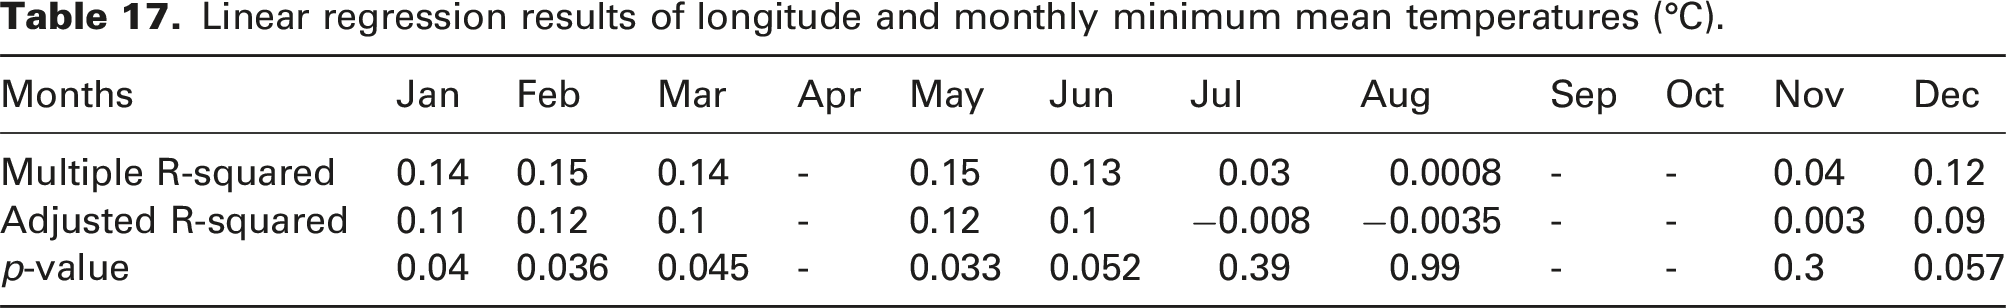
Linear regression results of longitude and monthly minimum mean temperatures (°C).
Results of Shapiro–Wilk test on normalized monthly minimum mean temperature (°C).
Results of ANOVA test on normalized monthly minimum mean temperature (°C).
Results of Scheffe’s multi-comparison test on normalized monthly minimum mean temperature (°C).
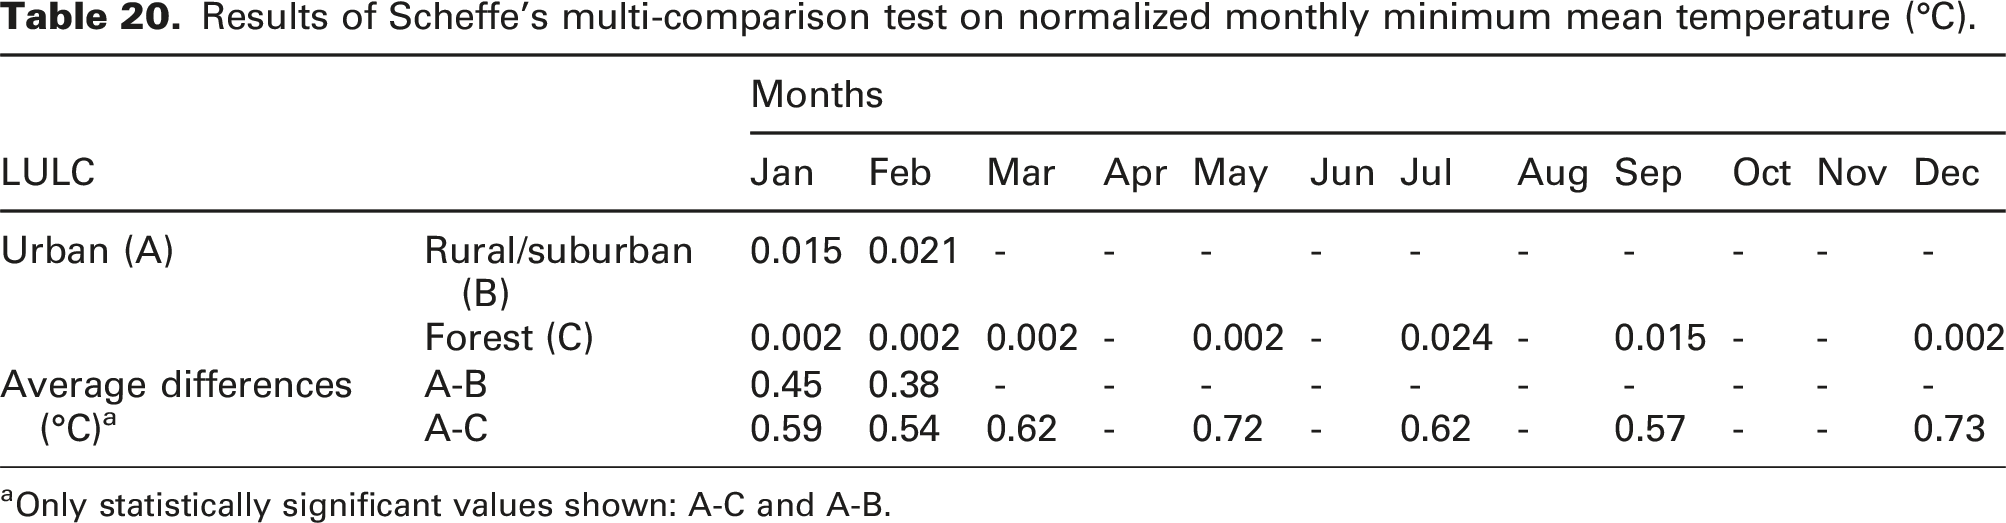
aOnly statistically significant values shown: A-C and A-B.
Monthly mean minimum temperature data (°C) of LCZ typologies.
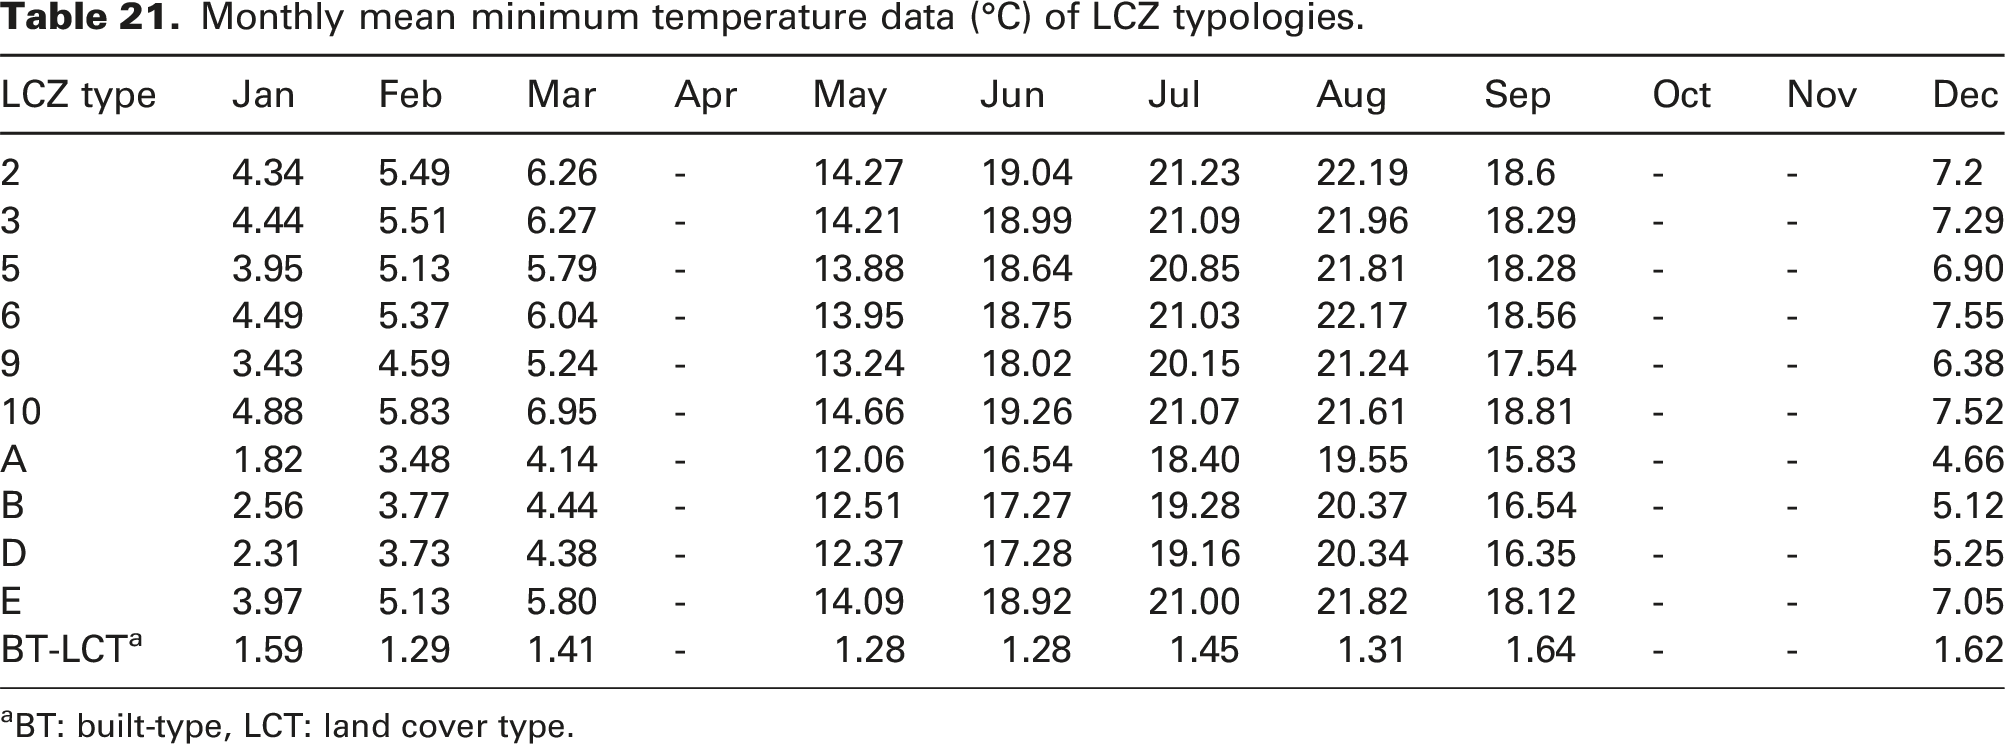
aBT: built-type, LCT: land cover type.
Normalized monthly mean minimum temperature data (°C) of LCZ typologies.
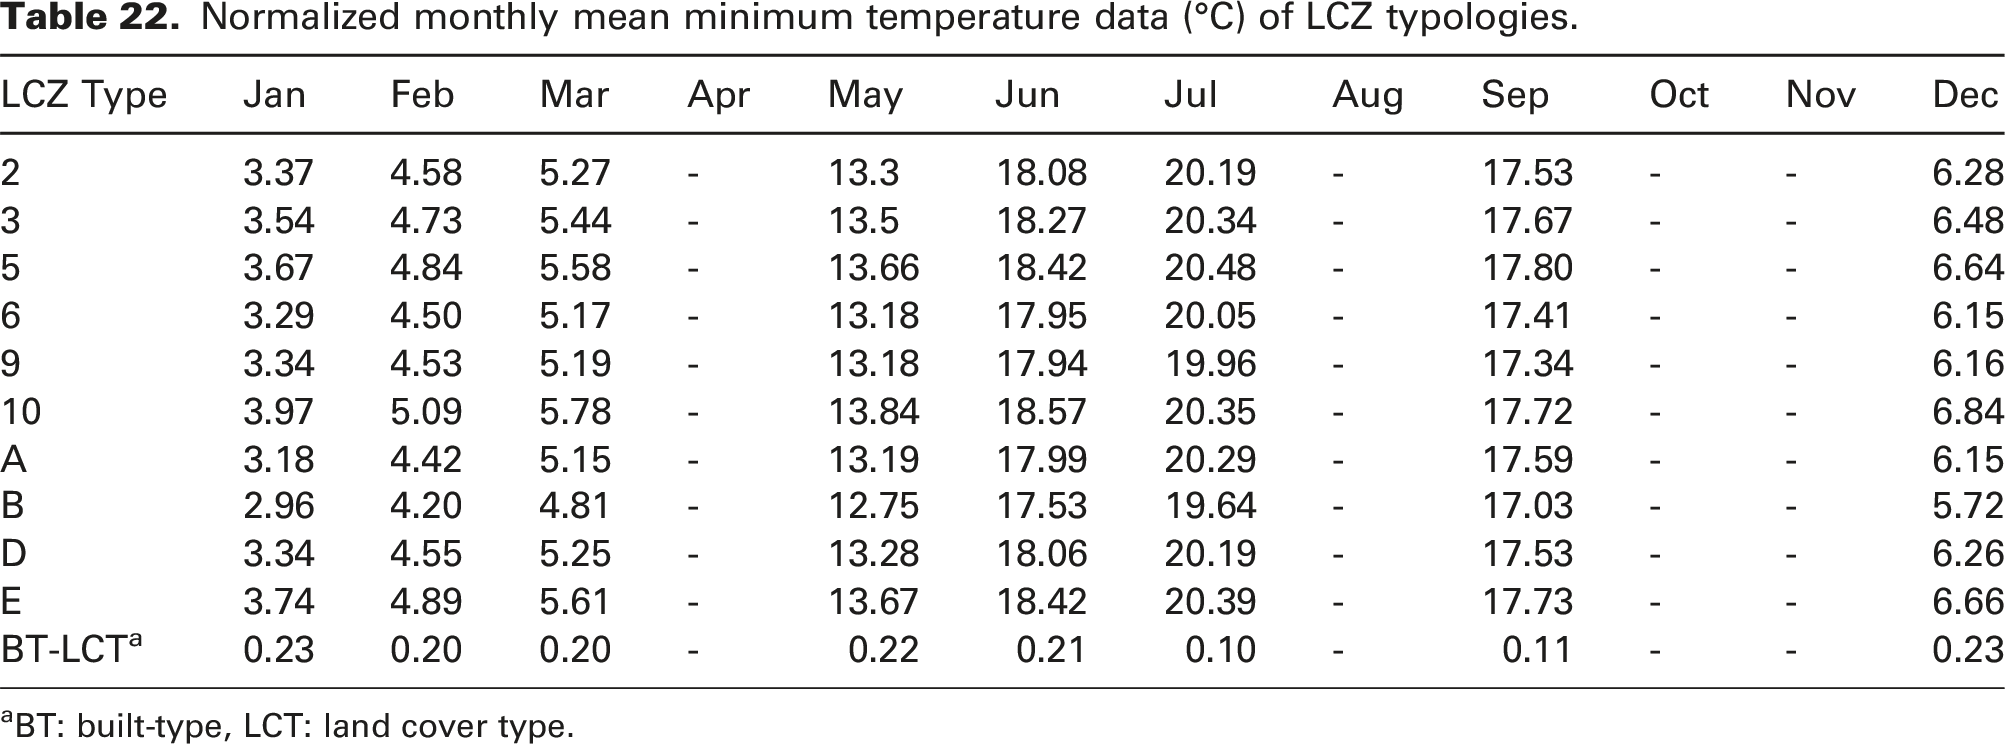
aBT: built-type, LCT: land cover type.
The effect of water surfaces on the station’s monthly minimum mean temperatures (°C).
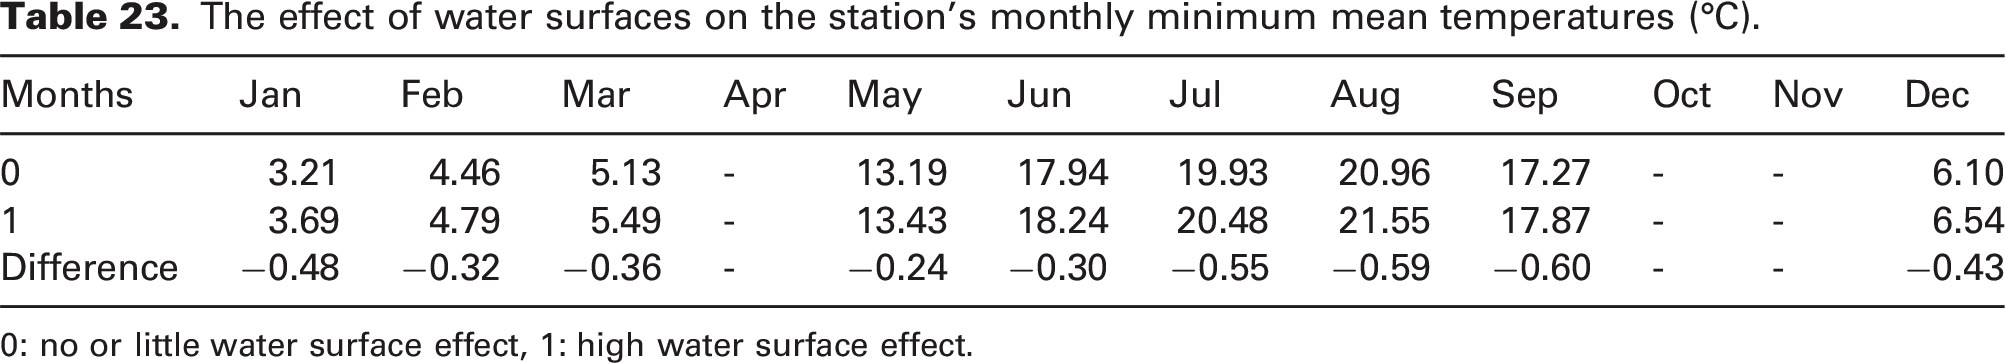
0: no or little water surface effect, 1: high water surface effect.
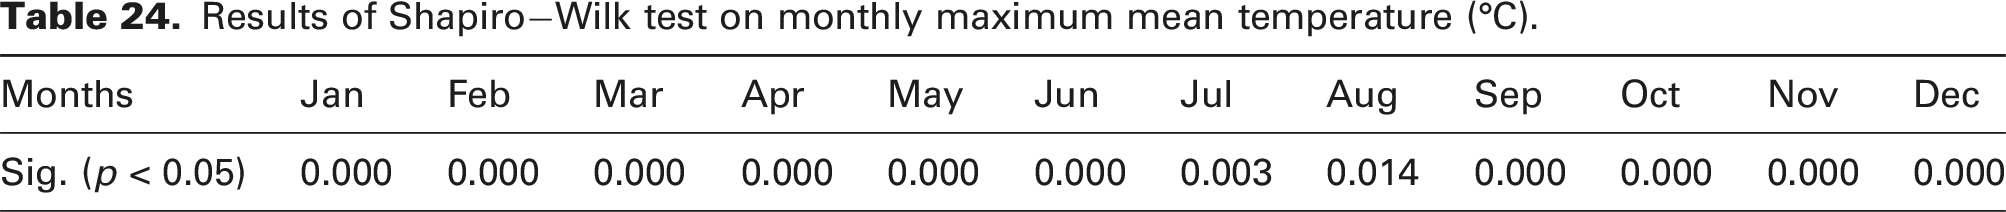
Monthly maximum mean temperatures (°C)
Throughout the given period, the highest monthly mean temperatures (°C) were recorded as follows: 10.51, 12.79, 14.31, 19.26, 23.81, 27.95, 29.88, 30.23, 27.16, 22.07, 17.78 and 13.26. According to the monthly maximum mean temperature (°C), the coldest and the warmest month were January and August, respectively. Figure 9 is the map of the monthly maximum mean temperature data for all months. Accordingly, some stations obtained more monthly maximum mean temperature values (°C) than others. These were Fatih-Deniz Bil. Enst. (S9), Kadıköy-Rıhtım (S13), Sabiha Gökçen (S16), Samandıra (S17) and Sarıyer-Kumköy (S20) stations (Figure 9). Interpolation map of monthly maximum mean temperatures (°C) of all months by the inverse weighted distance. Topography correction has been made on the maps and the raw data has been reduced by 0.65°C for every 100 m of elevation. 25 m resolution EarthExplorer satellite DEM data was used for topography correction.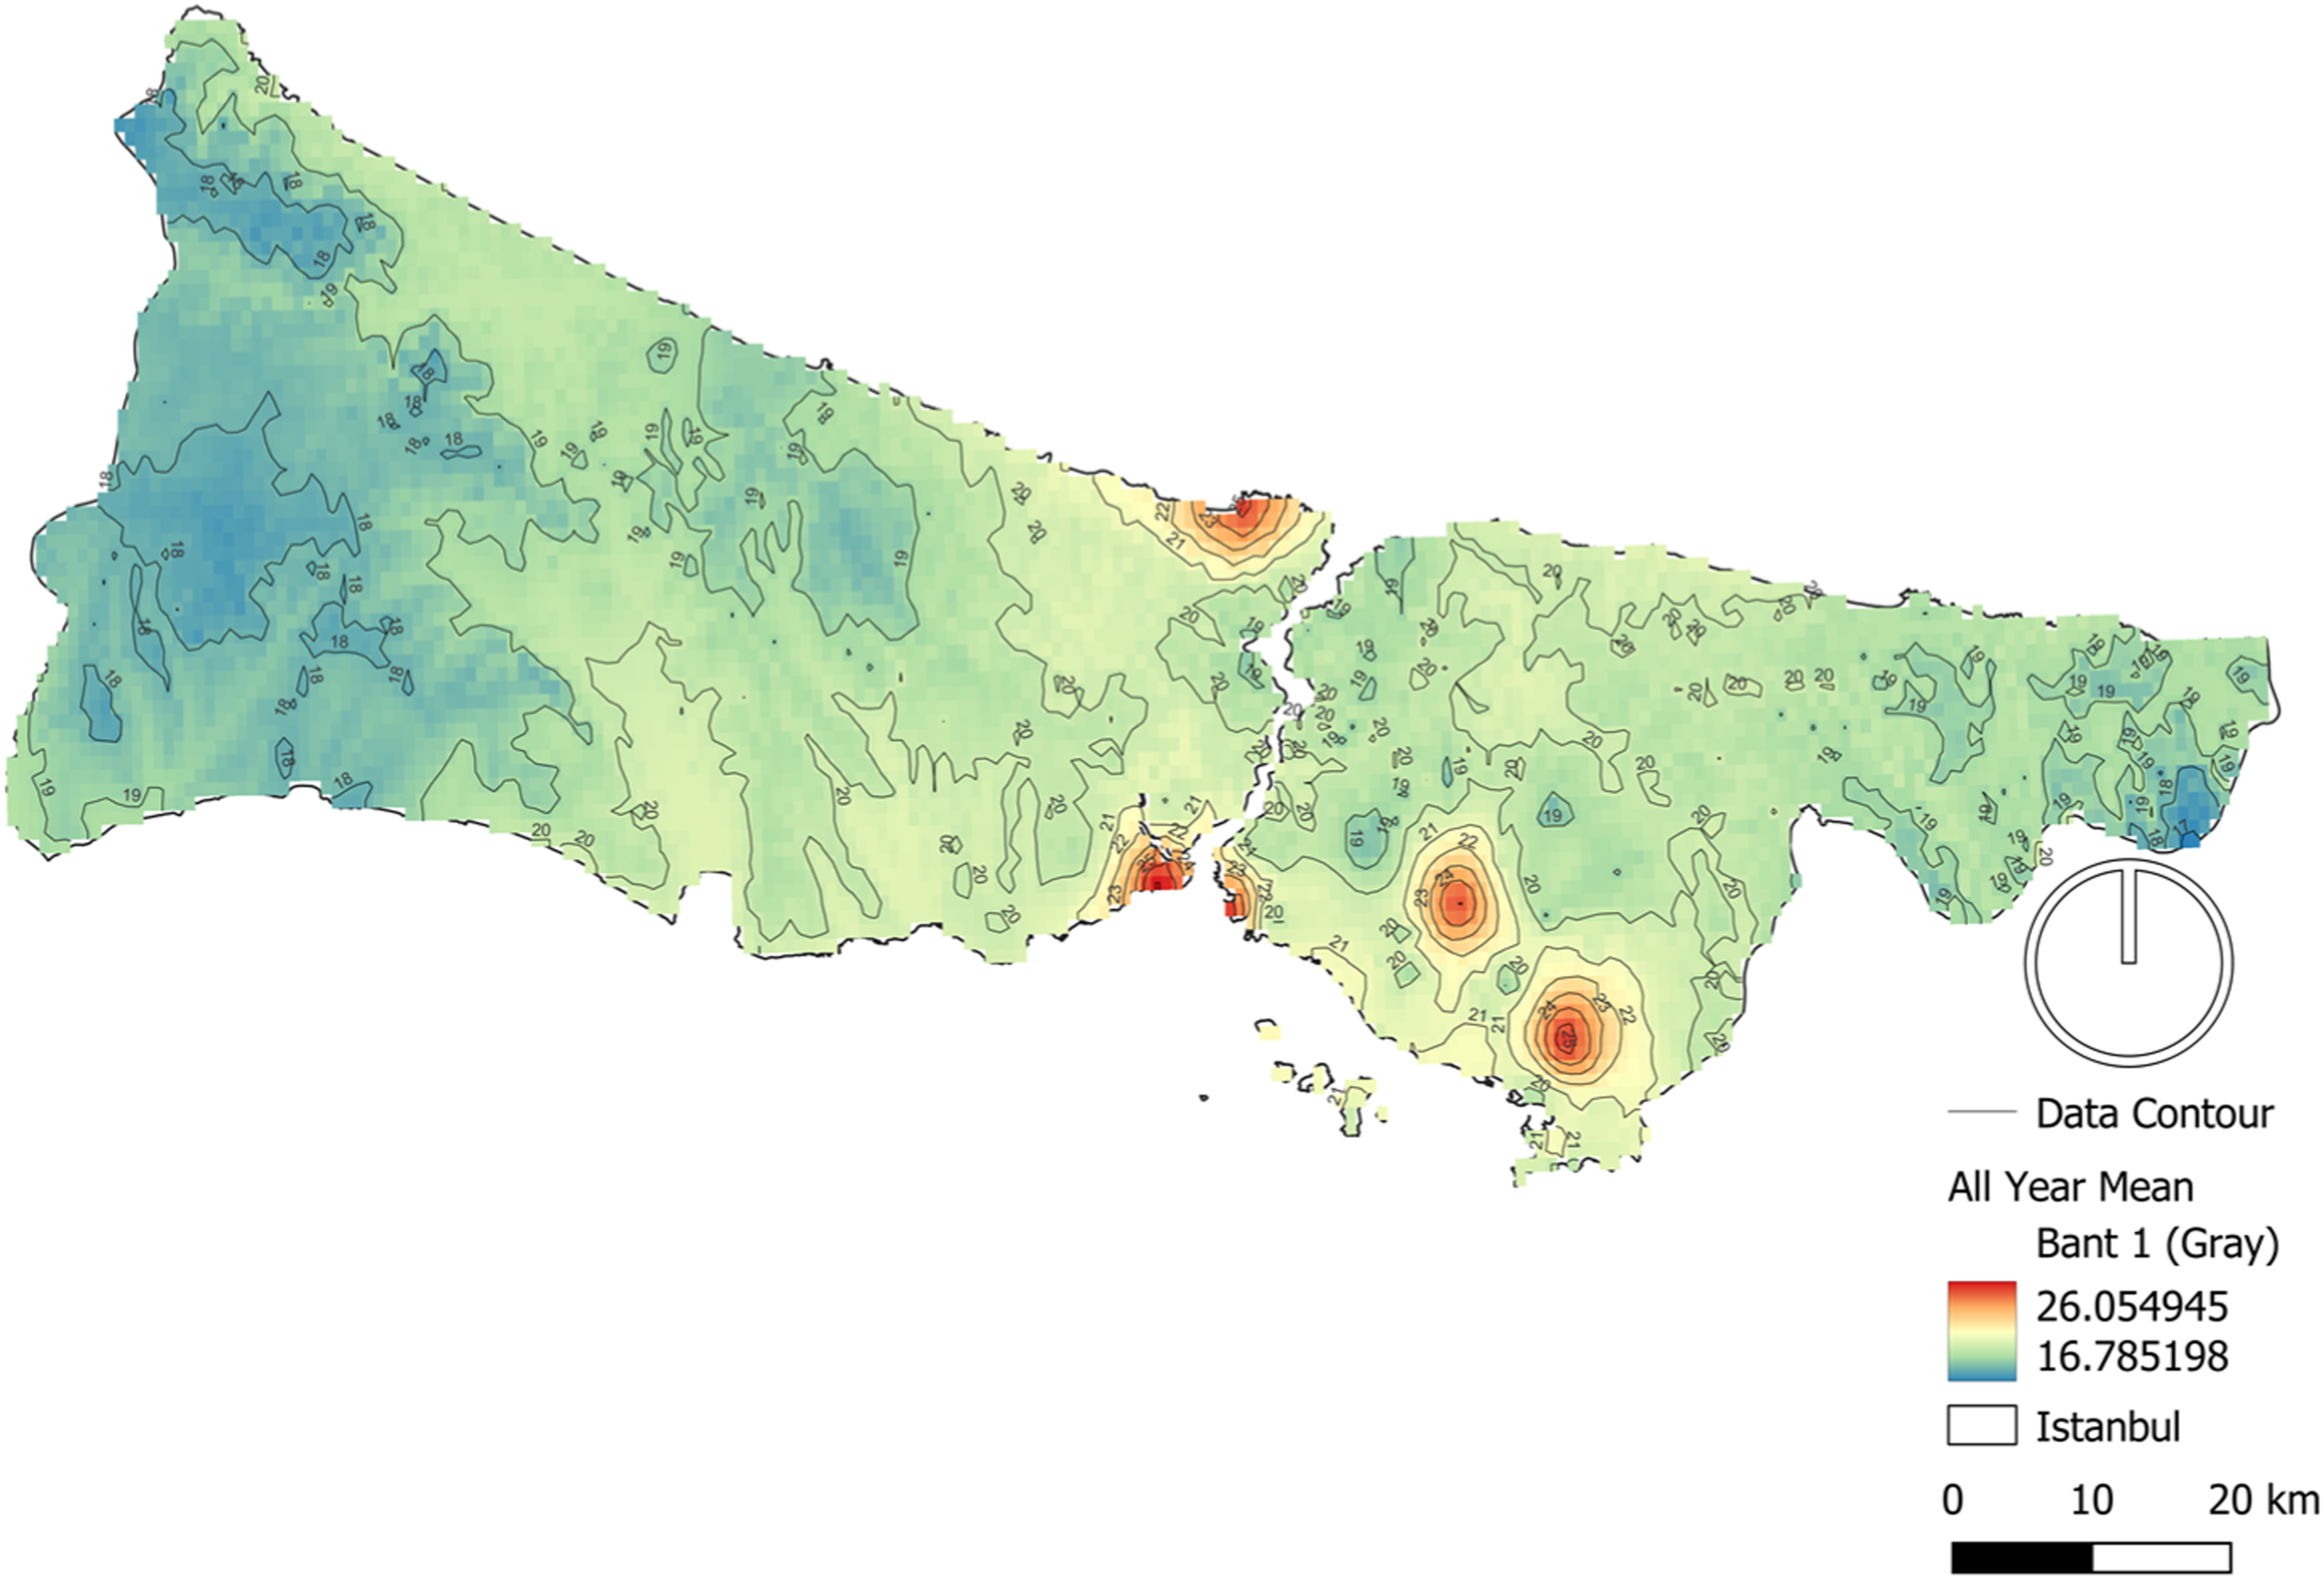
Results of Shapiro−Wilk test on monthly maximum mean temperature (°C).
The effect of water surfaces on the station’s monthly maximum mean temperatures (°C).
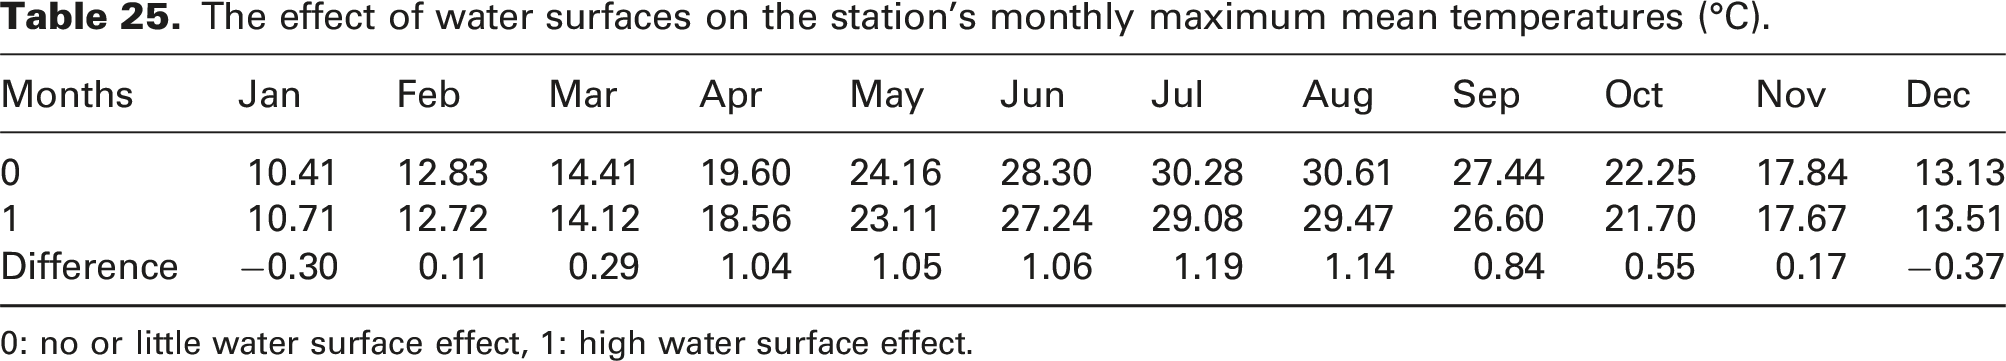
0: no or little water surface effect, 1: high water surface effect.
Frequency of days 35°C and above for selected stations
Increasing temperatures can cause heat-related diseases,55,56 and the values of 30°C–35°C and above are critical.57,58 For this reason, we defined 35°C as the threshold point. The days above this threshold value are expressed with the concept of a hot day.59–61
Years and total values of 35°C and above.
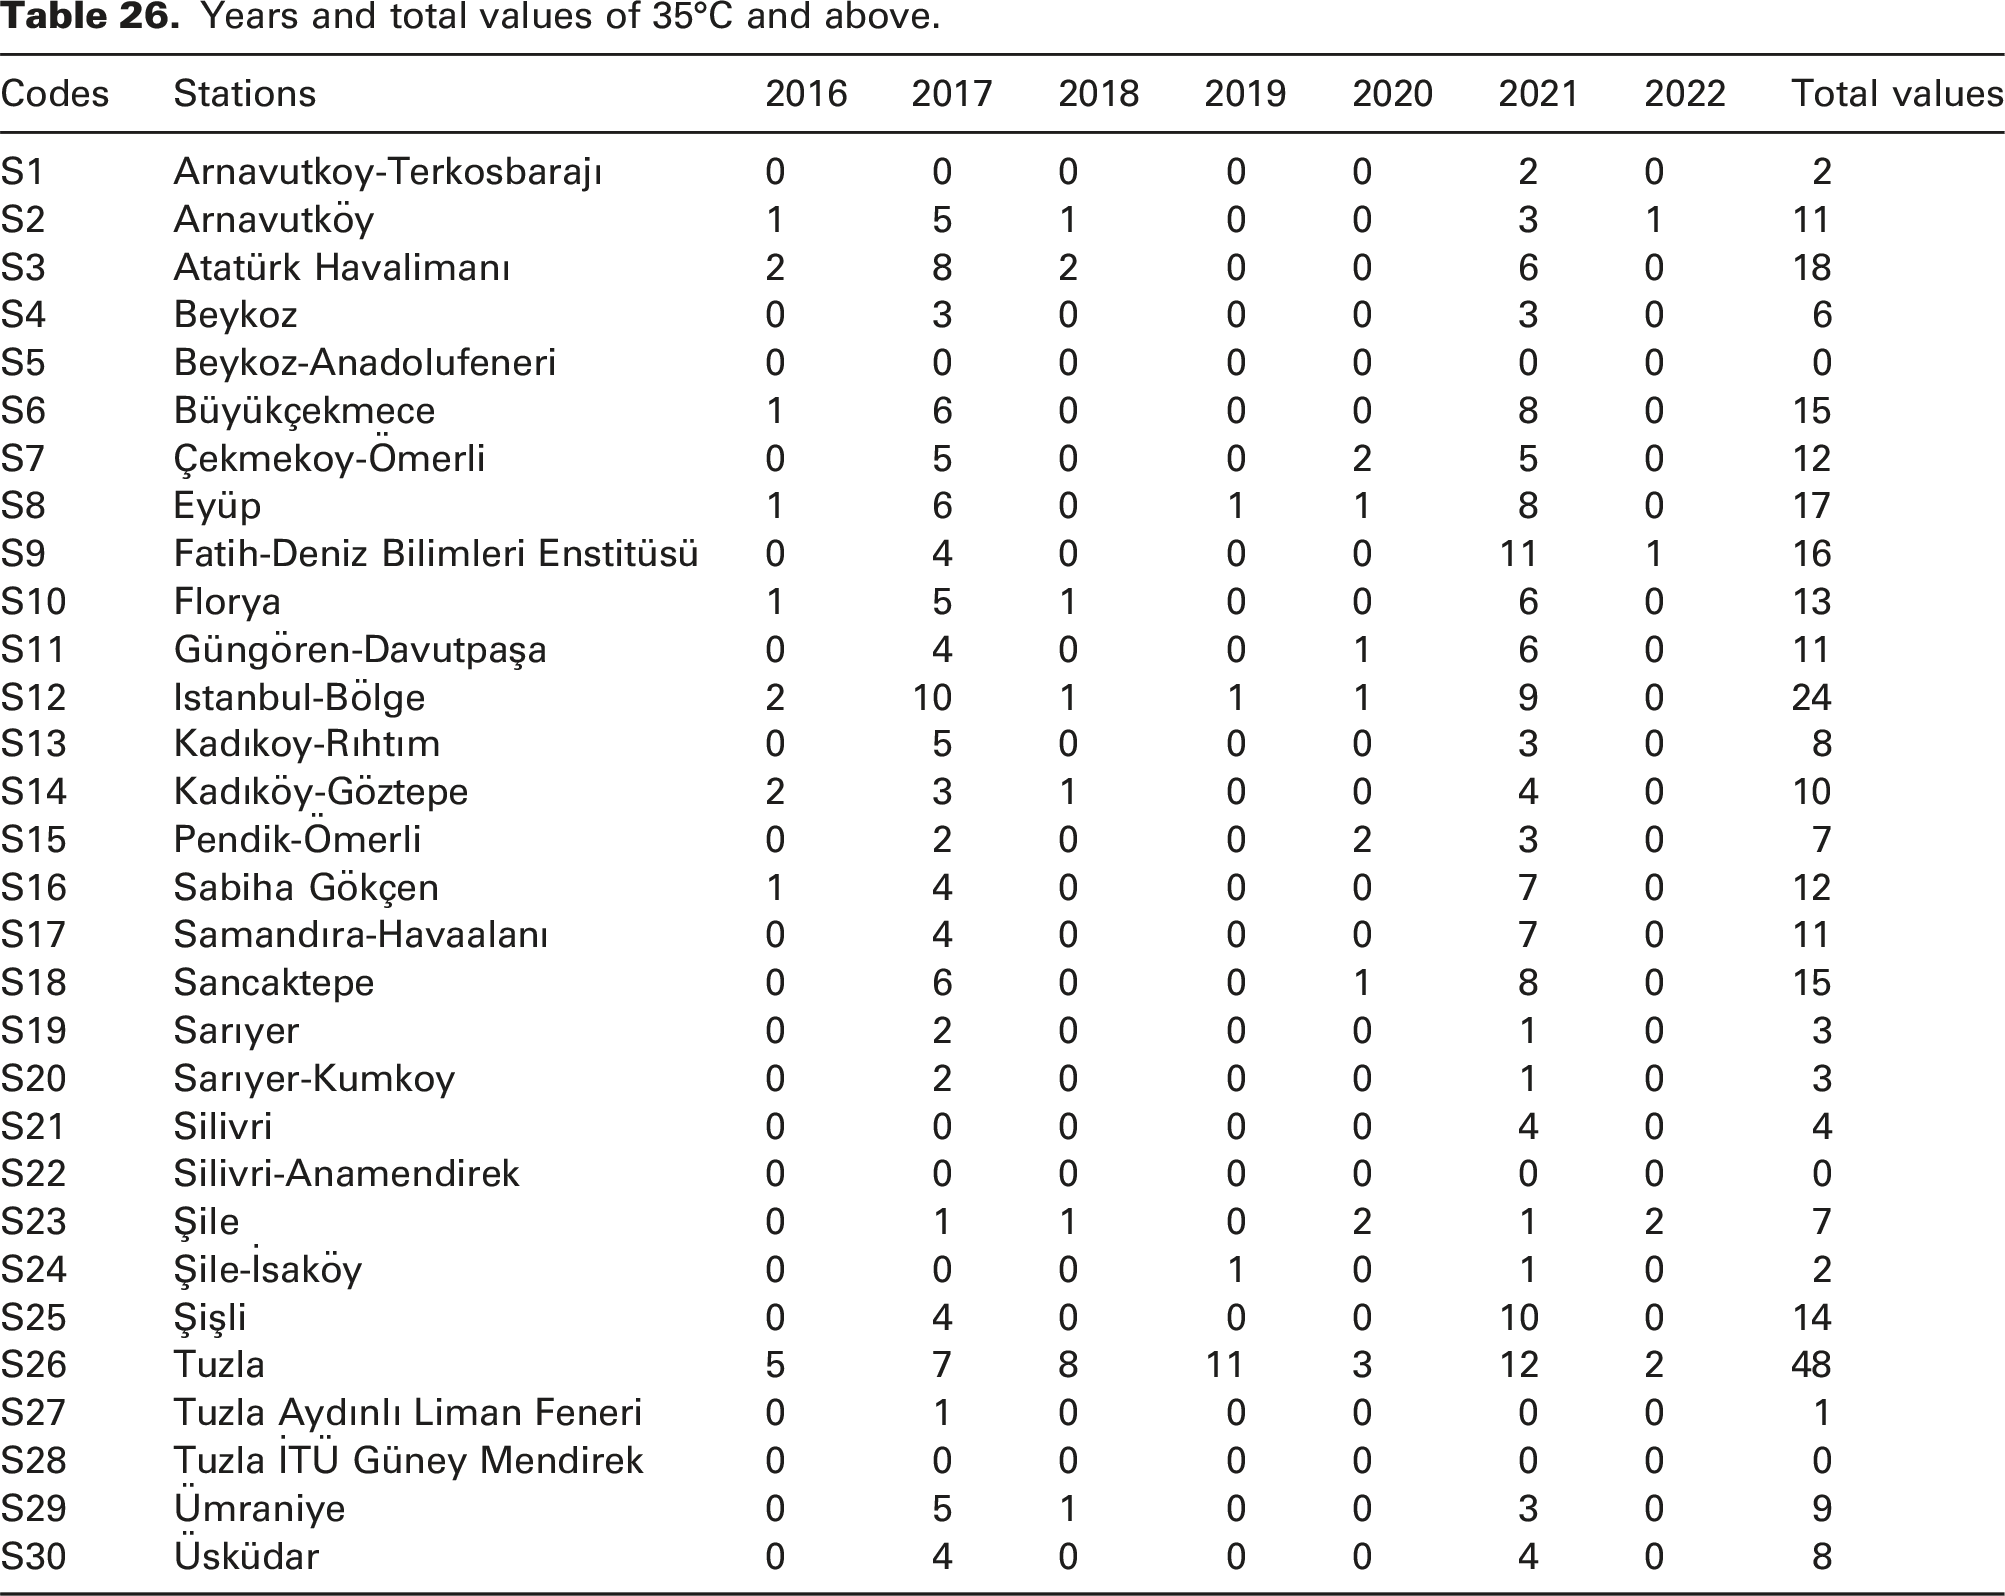
In addition, the tendency to exceed 35°C was lower at stations close to the sea. This highlights the fact that the areas on the south coast were warmer despite being cooled by the effects of the sea. However, this effect was not seen in the interior of the south coast due to the built environment that cuts the wind.
Between 2016 and 2022, the frequency of 35°C and above values at Tuzla station (S26) was determined as 48. These extreme heat measurements are remarkable. Five of the values were in 2016, 7 in 2017, 8 in 2018, 11 in 2019, 3 in 2020, 12 in 2021 and 2 in 2022. In addition, temperature values of 35°C and above were not detected at stations S5 (Beykoz Anadolu-Feneri), S22 (Silivri Ana-Mendirek) and S28 (Tuzla ITU Güney Mendirek) (Table 25). Those were located next to the sea.
S28 was Tuzla İTÜ Güney Mendirek station, which was very close to S26. However, the extreme values of 35°C and above detected in S28 were not detected. The reason why no extreme temperature was observed can be explained by the cooling effect of the winds coming from the sea. Lastly, July and August were the months with the highest temperatures of 35°C and above.
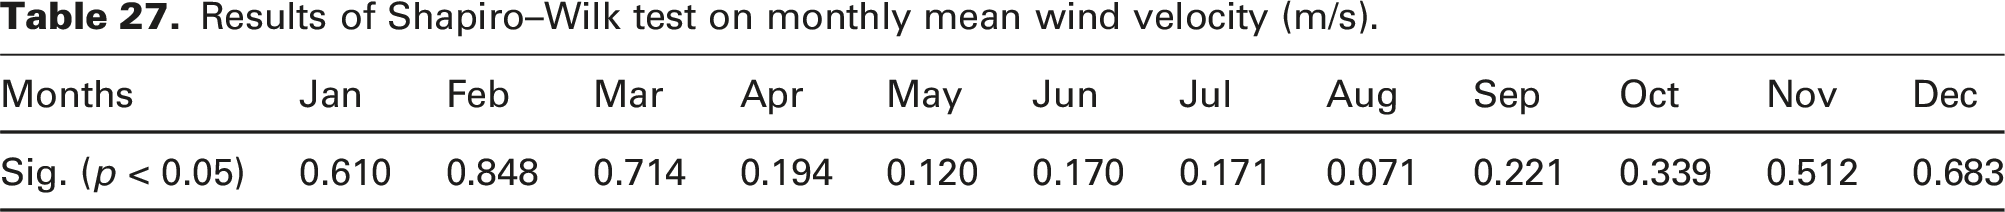
Monthly mean wind velocity (m/s)
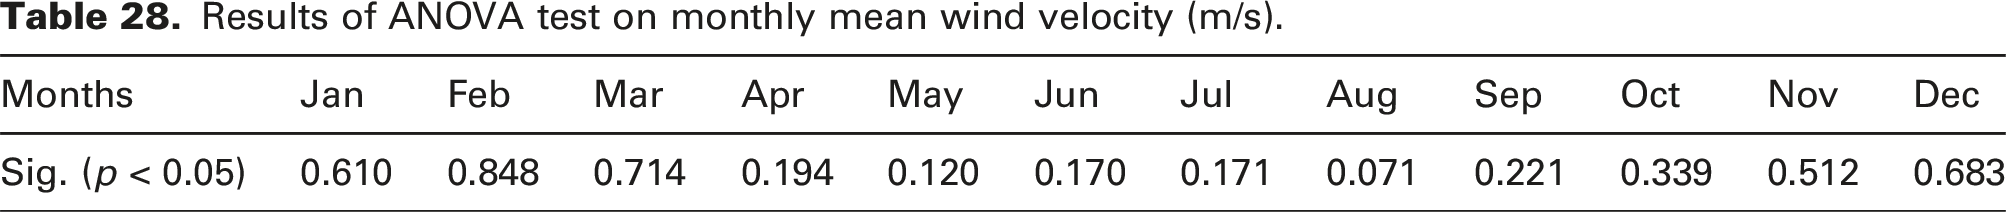
The monthly mean wind velocity values (m/s) for the years 2016–2022 were as follows: 3.38, 3.39, 3.19, 2.92, 2.80, 2.76, 3.20, 3.39, 3.12, 2.83, 2.98 and 3.24. The three stations with the least wind, in general, were Istanbul-Bölge (1.46 m/s), Kadıköy-Göztepe (1.61 m/s) and Beykoz (2 m/s). The stations with the highest monthly mean wind velocity (m/s) were Beykoz-Anadolufeneri (4.84 m/s), Silivri Ana-Mendirek (4.57 m/s) and Atatürk Airport (4.54 m/s).
Wind data for Arnavutköy-Terkos, Pendik-Ömerli and Şile-İsaköy stations were not recorded. Therefore, those could not be included in the sampling. Data from statistical analyses were evaluated on 27 station data. Mean values were calculated by taking these considerations into account.
Results of Shapiro–Wilk test on monthly mean wind velocity (m/s).
Results of ANOVA test on monthly mean wind velocity (m/s).
The effect of water surfaces on the station’s monthly mean wind velocity (m/s).

0: no or little water surface effect, 1: high water surface effect.
Monthly mean relative humidity (%)
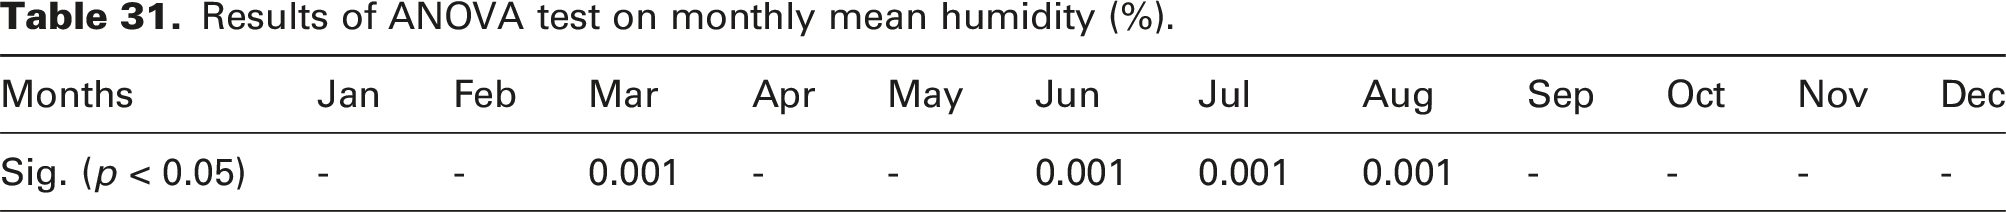
The monthly mean relative humidity percentages for the period under consideration were as follows: 80.16, 79.71, 77.27, 72.70, 75.06, 75.96, 73.16, 74.69, 72.80, 78.76, 80.14 and 80.20. The highest humid month (%) was December with 80.2%, and the lowest humidity was in April with 72.7% for the years 2016–2022.
Results of Shapiro–Wilk test on monthly mean humidity (%).

Results of ANOVA test on monthly mean humidity (%).
Results of Scheffe’s multi-comparison test on monthly mean humidity (%).
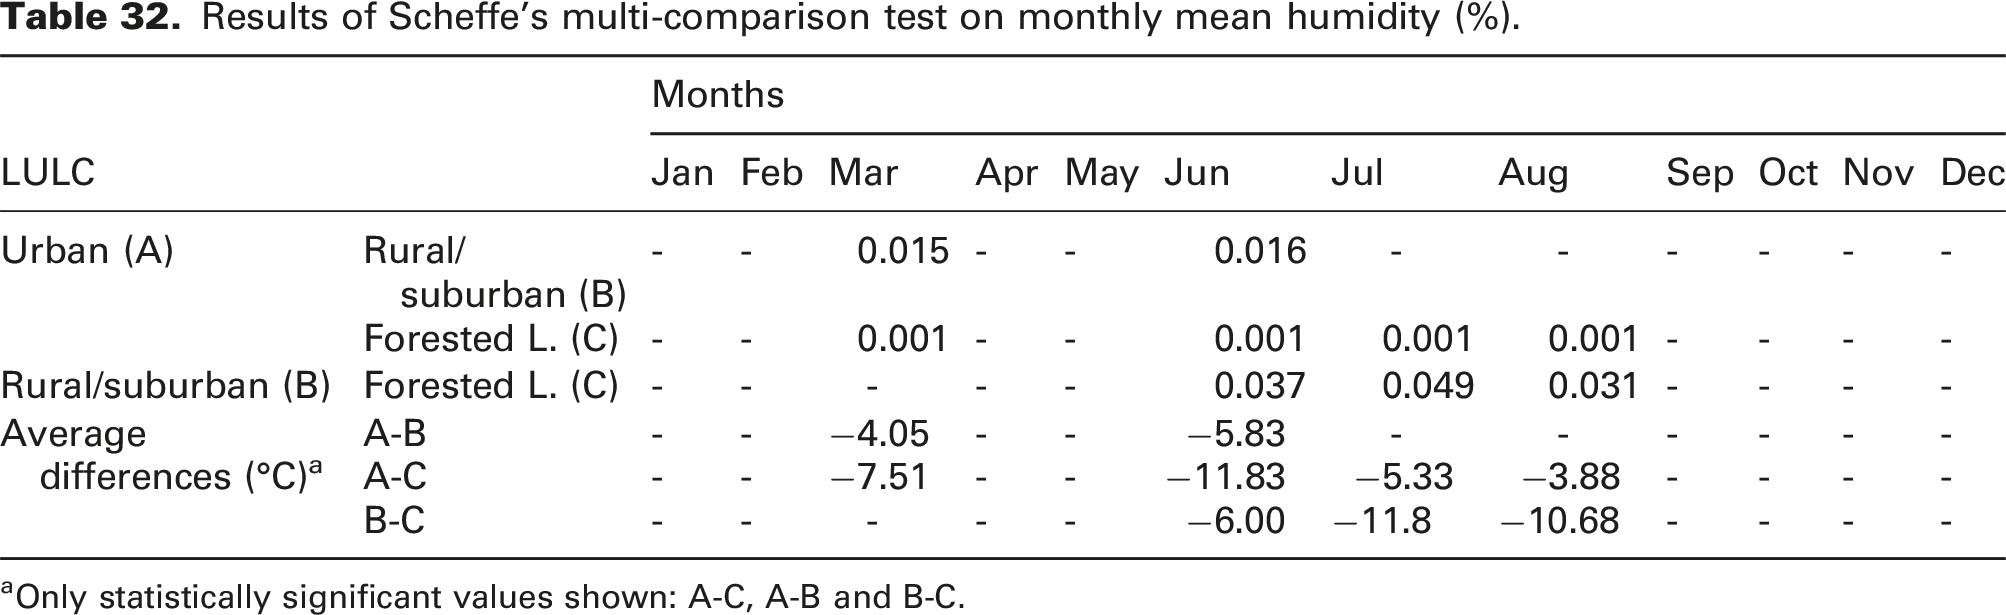
aOnly statistically significant values shown: A-C, A-B and B-C.
The effect of water surfaces on the station’s monthly mean humidity (%).
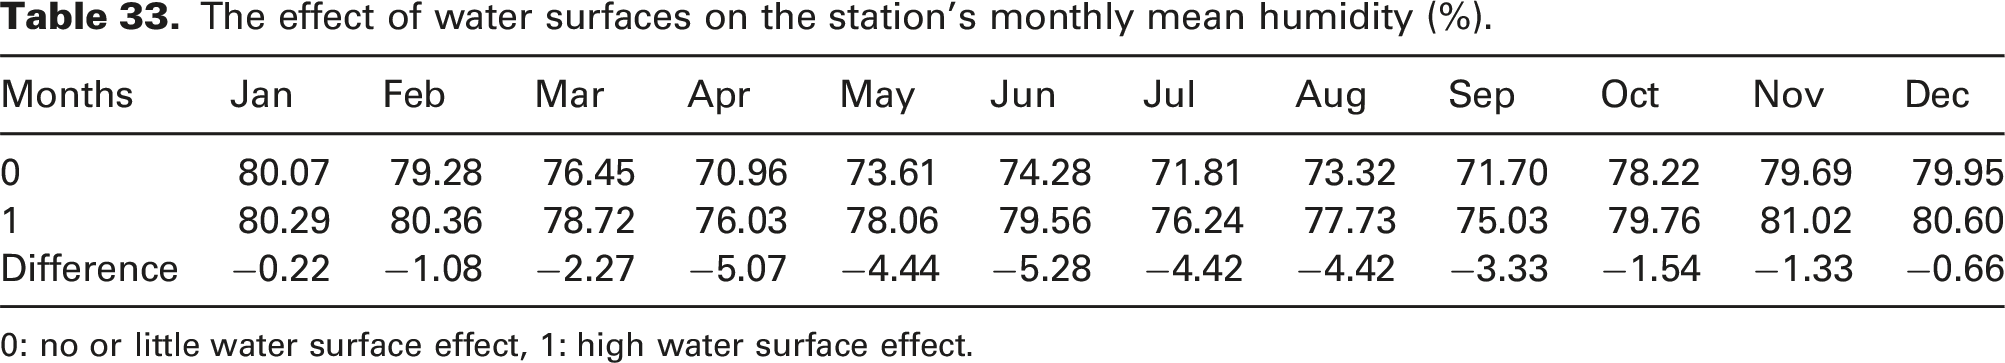
0: no or little water surface effect, 1: high water surface effect.
Discussion
Istanbul Metropolitan Municipality (IMM) stated in its 2050 vision report that it is working on issues such as fighting the climate crisis, improving the quality of life, reducing environmental pollution and greenhouse gas emissions, and providing climate justice in Istanbul. All these efforts are important to make Istanbul holistically more resilient and sustainable, and directly corresponding the United Nation Sustainable Development Goals: Sustainable Cities and Communities (SDG 11) and Climate Action (SDG 13). 62 The report highlights that Istanbul’s UHI effect appears to be concentrated in areas defined as densely built environments.
Considering the two main elements of the research, LULC and LCZ, the effects of these on meteorological data are of vital importance in the formation of the UHI. This situation can be discussed in various ways. For example, mean temperatures are the parameter that shows the difference between day and night in the most balanced way. Detecting the urban heat island effect within mean temperatures can be challenging. However, some significant findings emerged: there was a difference between typology A, which was 0.89°C warmer than typology B, and typology C, which was 1.05°C warmer than typology B, on a yearly basis. Furthermore, built-type LCZs were observed to be 0.75°C warmer than land cover-type LCZs, annually. This proves that the UHI was clearly seen on the monthly mean temperature values, and those values were overlapped with the reports of Istanbul Metropolitan Municipality.63,64
Using the cooling effects of water bodies as a type of helpful service from nature is an important way to reduce urban heat in cities during the daytime. 65 For example, Yang et al. 66 showed that sea breezes could alleviate the urban heat island effect in Shenzhen, China. Moreover, Guo et al. 67 explored the cooling capacity of the sea in Dalian City of China and noted that it can cool the inner city area between 2.5 and 9.2 km. However, the dense urban development in the southern part of Istanbul removes any cooling influence from the Sea of Marmara. 68 The main source of these temperature differences is thought to originate from the dense urbanization located in the southern part of the city. Despite this situation, natural areas within the urban macro-form work like cool air clusters. The most prominent of these areas can be listed as Aydos Hill, Maltepe, Kayışdağı and Alemdağ, respectively. The fact that all these areas are located on the Anatolian side of Istanbul is an important finding.
The monthly minimum mean temperature (°C) values have been pointed out as a highly significant indicator of the UHI effect in this study. The urban heat island is mainly a nighttime phenomenon. 69 This is attributed to the fact that urban materials absorb and retain heat throughout the day, releasing it gradually during the night. In contrast, the cooling process is more rapid in rural areas. Consequently, minimum temperatures have the potential to be higher in urban environments due to the delayed release of accumulated heat, contributing to an elevation in minimum temperatures in urban areas. 70 Accordingly, temperature differences were evident between typologies A and B, and typologies A and C. Typology A was 1.23°C warmer than typology B and was 1.62°C warmer than typology C. In other words, the urban environment was found to be warmer than both rural/suburban and forested landscape, and these differences were statistically significant (p < 0.05). Similarly, Baykara (2023) 71 found the urbanized area of Istanbul to be warmer than rural. Additionally, built-type LCZs were 1.30°C warmer than land cover-type LCZs. When the water surface effect is discussed, the stations with no or less water surface effect in all months were determined to be 0.43°C cooler. This is explained by the slow heating and late cooling of the water surface.
There was a significant output that monthly maximum mean temperature values (°C) of five stations recorded higher values than the others: Fatih-Deniz Bilimleri Enstitüsü (S9), Kadıköy-Rıhtım (S13), Sabiha Gökçen (S16), Samandıra (S17) and Sarıyer-Kumköy (S20) stations. S9 was located in Fatih district, and S13 was located in Kadıköy district. Those are one of the densest districts in terms of building stock. S16 and S17 were in land uses with an airport, that is, the amount of large impermeable concrete surface is high. These stations are likely to stand out in terms of monthly maximum value. S20 was located in the northern part of Istanbul, outside the urban macro-form. Although there is no dense construction in its immediate surroundings, interestingly, it recorded extreme values as well. This phenomenon may be attributed to sea water temperature variations. The Black Sea 24.3°C water temperature was approximately in August between 1970 and 2022. 72 This underscores the significant impact of water as a contributing factor. Furthermore, the monthly maximum mean temperatures were higher in cases where the water surface effect was low or absent (code 0).
Urban form affects the cooling capacity of the sea by affecting the surface temperature and the fluidity of the wind. 67 When the days with 35°C and above values were examined, typologies A, B and C obtained a frequency of 11.16, 9.17 and 6.67 days, respectively. In other words, typology A obtained an average of +2 hot-day frequency compared to typology B and +4 hot-day frequency compared to typology C. Similarly, Wei et al. (2022) 73 discovered in their study that regions characterized by dense built environments exhibited an increased frequency of days with temperatures of 35°C and above. Moreover, stations close to the water surface have a lower tendency to exceed 35°C. This highlights the fact that the areas on the south coast were still warm, despite being cooled by the effects of the sea. However, this effect was not seen in the inner parts of the south coast due to the built environment that cuts the wind. Furthermore, the frequency of 35°C and above values at Tuzla station (S26) between 2016 and 2022 was determined as 48. This situation can be explained by the closeness of the station to the Tuzla Wastewater Treatment Plant and ISTON (Istanbul Concrete Elements and Ready Mixed Concrete Factory).
The wind is a critical parameter for UHI because increasing wind velocity would decrease the UHI effect.74,75 Milelli et al. (2023) 76 indicated that urban areas have less wind velocity than rural. Moreover, Aksak et al. (2023) 77 found a decreasing trend of wind velocity in Istanbul after the 2000s with the effect of urbanization. Our results demonstrated similar outputs. The stations with less wind were seen in urban areas, meaning that typology A obtained 0.33 m/s less wind velocity than typology B, and achieved 0.31 m/s less wind velocity than typology C, yearly. Furthermore, the three stations with the least winds are Istanbul-Bölge (1.46 m/s), Kadıköy-Göztepe (1.61 m/s) and Beykoz (2 m/s). This situation can be explained by the effect of elements that have the potential to block the wind. The stations with higher monthly mean wind velocity (m/s) values were determined at the stations located in open areas: Beykoz Anadolu-Feneri (4.84 m/s), Silivri-Anamendirek (4.57 m/s) and Atatürk Airport (4.54 m/s). The immediate surroundings of these three stations are quite open, and the elements with the potential to block the wind are limited.
The LULC changes shape of the urban microclimate, including UHI effects regarding urban temperature and humidity. 78 Urban areas contain less humidity than their surroundings. 79 This issue can alter the thermal sense of people in urban voids. Because thermal sense of people depends on the temperature and also humidity. Excessive humidity may enhance the latent heat exposure, and this can create a heat-trapping effect especially in the earlier hours in Istanbul. Additionally, Hass et al. (2016) 80 found that relative humidity were found to vary significantly between locations’ vegetation structure. Our results support the findings of these researchers. Typology A achieved 10% less than typology C and 5% less humidity than typology B. In particular, stations such as Istanbul-Bölge and Atatürk Airport of highly urbanized areas recorded the lowest August mean humidity levels, at 64.97% and 64.74%, respectively. These environments are characterized by a higher prevalence of impervious surfaces, and under the absence of a water effect. The monthly mean relative humidity (%) was affected by water surfaces. Especially in the summer months, stations that have the water surface effect high (code 1) achieved around 5% humidity more. In winter, this situation was close to stable.
Conclusion and suggestions
Understanding and mitigating the UHI is crucial for building resilient cities that align with UN Sustainable Development Goals (SDGs). There is no doubt that UHI is strongly related to the sustainable development (SDG 11) and climate action (SDG 13). The significance of climate data in analyzing the UHI has been clearly demonstrated in this study. This study concluded that LULC and LCZ types are influential in formation of UHI in Istanbul with following details: • Typology A (urban) indicated higher temperatures compared to stations located in typologies B (rural/suburban) and C (forested landscape). • The southern part of the city emerges as the most vulnerable to the UHI phenomenon because of the densely built stocks. • Stations located close to water surfaces exhibit a lower tendency to exceed 35°C. • Cool air clusters within the urban macro-form are more diverse on the Anatolian side of Istanbul compared to the European side, where such clusters are relatively limited. • Typology A was found to be less windy than other typologies. • Typology C exhibited higher humidity compared to typologies A and B.
Incorporating data from 30 stations underscores the precision of the results obtained. Overall, despite the cooling influence of the sea, urban areas in Istanbul exhibit higher temperatures than other spatial types. By fostering collaboration and implementing appropriate strategies, it is feasible to cultivate a more sustainable and resilient urban environment that emphasizes the well-being and quality of life of Istanbul’s inhabitants.
In future studies, it is essential to develop a comprehensive local-based urban heat island mitigation strategy that aligns with landscape planning and design principles. Wind emerges as the most significant climate parameter for dispersing the urban heat island effect. Specifically, cooling winds originating from the northeast direction can significantly enhance their effectiveness within the city when channelled appropriately. Thus, advocating for strategies like establishing green corridors oriented in the northeast-southwest direction becomes imperative. These strategies should be strengthened by integrating them with existing cool island clusters within the city and where green corridors are impractical, creating local cool islands. Furthermore, this entails the creation of conducive pathways to harness the morning sea breeze from the south, a consequence of land–sea breezes. Implementing these strategies offers locally appropriate and effective solutions to mitigate the heat island effect in the Istanbul metropolitan area. This study provides valuable insights and serves as a foundation for informed decision-making in landscape planning and design, enabling the development of effective strategies to mitigate the adverse effects of UHI.
Footnotes
Acknowledgements
This article was developed as part of the doctoral thesis of the corresponding author. We extend our gratitude to Prof. Ömer Lütfi Şen (PhD) and Assoc. Prof. Mert Ekşi (PhD) for their invaluable contributions as members of the thesis monitoring committee. We also thank the referees for their insightful and constructive feedback on the article. Additionally, we express our appreciation to the Istanbul Regional Directorate of Meteorology, 1st Region, for providing the data used in this study.
Author contributions
HO and MEK designed the study and developed the methodology. HO collected the secondary data and performed the analysis. MEK contributed to the theoretical framing of the paper. HO and MEK jointly produced the manuscript text, and HO performed later manuscript revisions.
Declaration of conflicting interests
The author(s) declared no potential conflicts of interest with respect to the research, authorship, and/or publication of this article.
Funding
The author(s) received no financial support for the research, authorship, and/or publication of this article.