
Abstract
The use of dynamic mathematical software as pedagogical tools in mathematics education is widely believed to enrich learning experiences and offer enhanced opportunities for learners to reconceptualize mathematical content. However, there is a dearth of empirically supported literature on how these technological tools facilitate learners’ construction of mathematical knowledge. This study employed the Action–Process–Object–Schema (APOS) theoretical lens to explore the utilization of Autograph technology in deepening learners’ conceptualization of hyperbolic functions at a marginalized rural high school in South Africa. The study adopted a descriptive qualitative case study methodology, where data were collected through diagnostic testing and task-based clinical interviews. Qualitative and textual analysis of data revealed compelling evidence that the representational affordance of Autograph facilitates capacity for logical and reflective thinking, which ultimately promotes adaptive reasoning. The participant learners were able to encapsulate the hyperbolic function concept as an object in totality that could be transformed or manipulated, as demonstrated by their flexibility in switching between the algebraic and graphical representations of the function. The study cogently recommends that Autograph, and other relevant mathematical software, should be made available to mathematics teachers, particularly in marginalized schools in South Africa, and targeted efforts be made to develop the teachers’ technical and pedagogical competency. Further research is recommended to explore the use of Autograph technology in the teaching of other problematic topics, such as geometry, measurement, statistics and probability.
1. Introduction
The South African government, through its Department of Basic Education (DBE), has turned to new technologies to help improve teaching and learning and to redress past inequalities in schools (Mlhotshwa et al., 2020; Saal et al., 2019). Sadly, according to the “Action Plan to 2019” report, the DBE conceded that ICT-enhanced learning had not advanced as predicted (DBE, 2024). Studies confirm that there is a disparity between the government's expectations and the actual practices of teachers in schools (Mlhotshwa et al., 2020; Mudaly & Fletcher, 2019). A critical examination of the extent to which integration of digital tools in South African schools has transformed learner outcomes tend to reveal several limitations. Netsianda and Ramaila (2021) found that unfavorable ICT infrastructure and limited access to sufficient network coverage in rural communities was a common hindrance to digital access. Further compounding this deficiency are teachers and learners, particularly in disadvantaged schools, who lag behind in technological expertise to incorporate and utilize modern technologies in teaching and learning (Shava, 2022). While teacher reluctance and limited access to digital resources are widely reported as barriers to ICT integration, COVID-19 experiences proved that South Africa has potential to intensify educational access through digital technologies (Mhlanga & Moloi, 2020). On the background of an education system with an uneven technological landscape, this study was undertaken to explore how the digital potential can be blended into the conventional face-to-face teaching method to improve understanding of mathematical concepts in marginalized rural contexts.
One persistent educational challenge that South Africa is facing is that of learner underachievement in mathematics (Jojo, 2020; Sibanda, 2022; Spaull & Kotze, 2015). The state of mathematics education in South Africa is widely considered as inferior with glaring deficiencies evident across various assessment and grade levels. This problem cannot be ignored given the linkage in the triad of mathematics education, democracy and economic development (Jojo, 2020), and how this connection influence the country's developmental challenges of poverty, inequality, and injustice. At the heart of this debate lies the view that imparting mathematical thinking has the capacity to nurture critical and competent citizens who can participate meaningfully in the growing economy (Mtshali & Ramaligela, 2020). Other critics have placed the ball in the teachers’ court by suggesting that quality mathematics teaching in South Africa remains a phantom unless they (teachers), among other things, make efforts to understand and be responsive to how their learners think and learn (Jojo, 2020). While teachers alone may not address this challenge, the underlying argument is that leveraging technological innovations to revitalize mathematics teaching in schools is critical in order to achieve developmental goals and needs of the impoverished and marginalized communities.
Tracking the National Senior Certificate diagnostic reports from 2020 to 2024, one would observe a steady increase in overall achievement in mathematics, however, there are persistent underlying deficiencies that inevitably lowers the quality of learners’ grades in mathematics (DBE, 2024). The reports further reveal that learners lack fundamental and basic mathematical competencies, especially in important topics like Algebra and Functions. The concept of function in particular, occupies a central and pivotal role in the South African high school mathematics curriculum, yet research has consistently shown that the topic presents pedagogical challenges both to teachers and learners (Makonye, 2014; Ngwabe & Felix, 2020). Studies expose numerous misconceptions that learners exude in dealing with problems under functions (Malahlela, 2017; Sarwadi & Shahrill, 2014). These misconceptions are manifestations of learners’ lack of structural understanding of the concepts involved (Makonye, 2014), and further expose the shortcomings of the traditional teaching approaches, which tend to concentrate more on the manipulation of algebraic expressions (Sarwadi & Shahrill, 2014) at the expense of conceptual understanding. This study focused on the teaching of hyperbolic functions using a dynamic mathematical software called Autograph. Hyperbolic functions were selected because they do possess certain key features which are not inherent in other functions. For example, the asymptotic nature of a hyperbolic graphs and the fractional form of its algebraic equation make them slightly unique from other functions, such as the linear and quadratic (Makonye & Fakude, 2016; Matindike & Makonye, 2023). The study had an intentional bias toward conceptual understanding and sought to explore how learner misconceptions with regard to asymptotes, axis of symmetry, domain, and range of hyperbolic functions could be addressed.
1.1 Hyperbolic functions in the south african mathematics school curriculum
According to the Curriculum and Assessment Policy Statement (CAPS) for mathematics in the Further Education and Training (FET) phase, learners are expected to acquire knowledge on the concept of functions and their inverses (DBE, 2011). The curriculum document specifies that learners should be able to identify the features of a function, including domain, range, intercepts, asymptotes, symmetry, intervals of increase and decrease and be able to convert flexibly between different representations of functions, such as tables, graphs, words, and formulae (DBE, 2011). The types of functions included in the curriculum document are limited to linear, quadratic, hyperbolic, exponential, trigonometric, cubic, and inverse functions. For the reasons discussed above, this study focused on the teaching of hyperbolic functions at Grade 11 level.
Mathematically, a hyperbola is a conic section that is formed when a plane intersects a double right circular cone at an angle such that both halves of the cone are intersected (Kidron, 2011). This intersection of the plane and cone produces two separate unbounded curves that are mirror images of each other called a hyperbola. In mathematical terms, a hyperbola is the set of points, P, in a plane such that the difference of the distance from P to two other points in the plane is a positive constant:
1.2 Autograph technology
Autograph is a dynamic, interactive software package that can be used in teaching a wide range of topics, spanning from pre-Algebra through Calculus (Bakar et al., 2010; Erebakyere & Agyei, 2022). Autograph software operates in three modes, namely, 1-Dimension (1D; Statistics and Probability); 2-Dimension (2D; Graphing, Coordinates, Transformations and Bivariate data); and 3-Dimension (3D; Graphing, Coordinates and Transformations; Morksin, Shahrill, Anshari, et al., 2018). The software allows users to observe, draw, change and animate graphs. It can be used in the teaching of graphs, transformations, and vectors (in 2D and 3D) and is appropriate for enhancing understanding of concepts in calculus, trigonometry, polar and parametric plotting, and differential equations (Erebakyere & Agyei, 2022). The software can also be used for drawing statistical graphs, functions and for transforming shapes. As Bakar et al. (2010) explain, Autograph affords learners an opportunity to change and animate graphs or shapes already plotted to encourage understanding of concepts.
Several studies conducted in other countries have shown that Autograph is a powerful tool that can enhance understanding of mathematical concepts. Moksin, Shahrill, Tan, et al. (2018) explored the use of Autograph technology in teaching junior college students on graphical representation and 3D modeling in calculating area and volume of revolution by integration. The students’ overall achievements in the learning of area and volume by integration improved. Ahmadi et al. (2021) developed learning modules based on a Realistic Mathematical approach with Autograph software. Students and teachers who participated in their study reported that Autograph technology was easy to use, and it was statistically proven that their thinking skills increased. Furthermore, studies have also shown that the use of Autograph for teaching heightens mathematics students’ level of confidence (Ramadhani et al., 2022), bridges achievement gaps between male and female students (Awortwe et al., 2019) and instills learning motivation in mathematics students (Ahmadi et al., 2021). Bina et al. (2021) found that the use of Autograph learning media improved mathematics communication skills. Erebakyere and Agyei (2022) concluded that Autograph technology is an effective instructional tool that motivates and develops positive learning attitudes and enhances active hands-on learning that improves teaching practices and learning. A major affordance that comes out of the use of Autograph in learning is that it increases learner engagement through discussions, improves their proficiency in mathematical language, and empowers them to interpret mathematical data in the form of pictures or graphics.
According to research, GeoGebra is unquestionably the most widely used mathematical application in South Africa. Although GeoGebra is free and open-source, has many tools, and is powerful in geometry and dynamic geometry characteristics, it also has drawbacks. Among GeoGebra's weaknesses are that its 3D plotting is not as sophisticated as Autograph's, and some users have expressed worry that its interface is difficult to use and comprehend for specific tasks. Despite being a commercial software, Autograph has an intuitive user interface made especially for educators, enhanced 3D plotting features, and a powerful graph and transformation visualization tool. In order to overcome some of GeoGebra's drawbacks and the difficulties that some teachers face while using it, this study sought to show that Autograph provides a credible alternative for GeoGebra. The availability of Autograph software also played a role in its selection for this study. The district Curriculum Advisors (CAs) who led a district workshop on ICT integration in mathematics promised to give the software away for free to any school that might need it.
1.3 The APOS theory
The fulcrum of this study was to explore how Autograph technology can be utilized as a pedagogical tool to deepen or strengthen learner understanding of concepts under hyperbolic functions. In order to explain the development of the targeted concepts in learners, the APOS theory was employed to provide a theoretical lens through which data on learners’ conception of ideas could be analyzed. Thus, the APOS theory provided the analytical framework upon which the learners’ conceptualization of concepts imbedded in hyperbolic functions could be investigated and established. The APOS theorists argue that concept formation is achieved through developmental mental activities of actions, processes and objects of mathematics which are eventually organized into a schema (Dubinsky, 2000; Dubinsky & McDonald, 2002; Nagle et al., 2019).
The action-conception involves familiar objects of numbers and repeatedly carrying out manipulations on numbers (Dubinsky & McDonald, 2002). At this stage, the learner is limited to procedural operations involving formulae, substitution, and manipulation of algebra (Watson & Moritz, 2000). When an action is repeated by an individual, the individual reflects upon it and makes an internal construction called a process (Dubinsky, 2000). The process-conception stage is perceived as internal, in the sense that it has meaningful connections to the individual's other mathematical knowledge (Nagle et al., 2019). The individual will now be able to produce a mental image of the object being transformed, together with other quantities that are related to the mathematical notion. Drawing on Sfard (1991), the transition from action to process is referred to as interiorization. When an individual becomes aware of the process as a totality and realizes that transformations can act on it (Dubinsky & McDonald, 2002), then an object-conception is constructed. What this means is that an individual begins to perceive or imagine the process as an entity, where actions can be applied. Piaget used the word encapsulation to describe the transition from process to object (Arnon et al., 2014). Finally, an individual makes a collection of actions, processes and objects linked by general principles to form a cognitive framework called a schema (Arnon et al., 2014; Dubinsky & McDonald, 2002). Tall and Vinner (1981) used the term “concept image,” referring to the total cognitive structure associated with a concept.
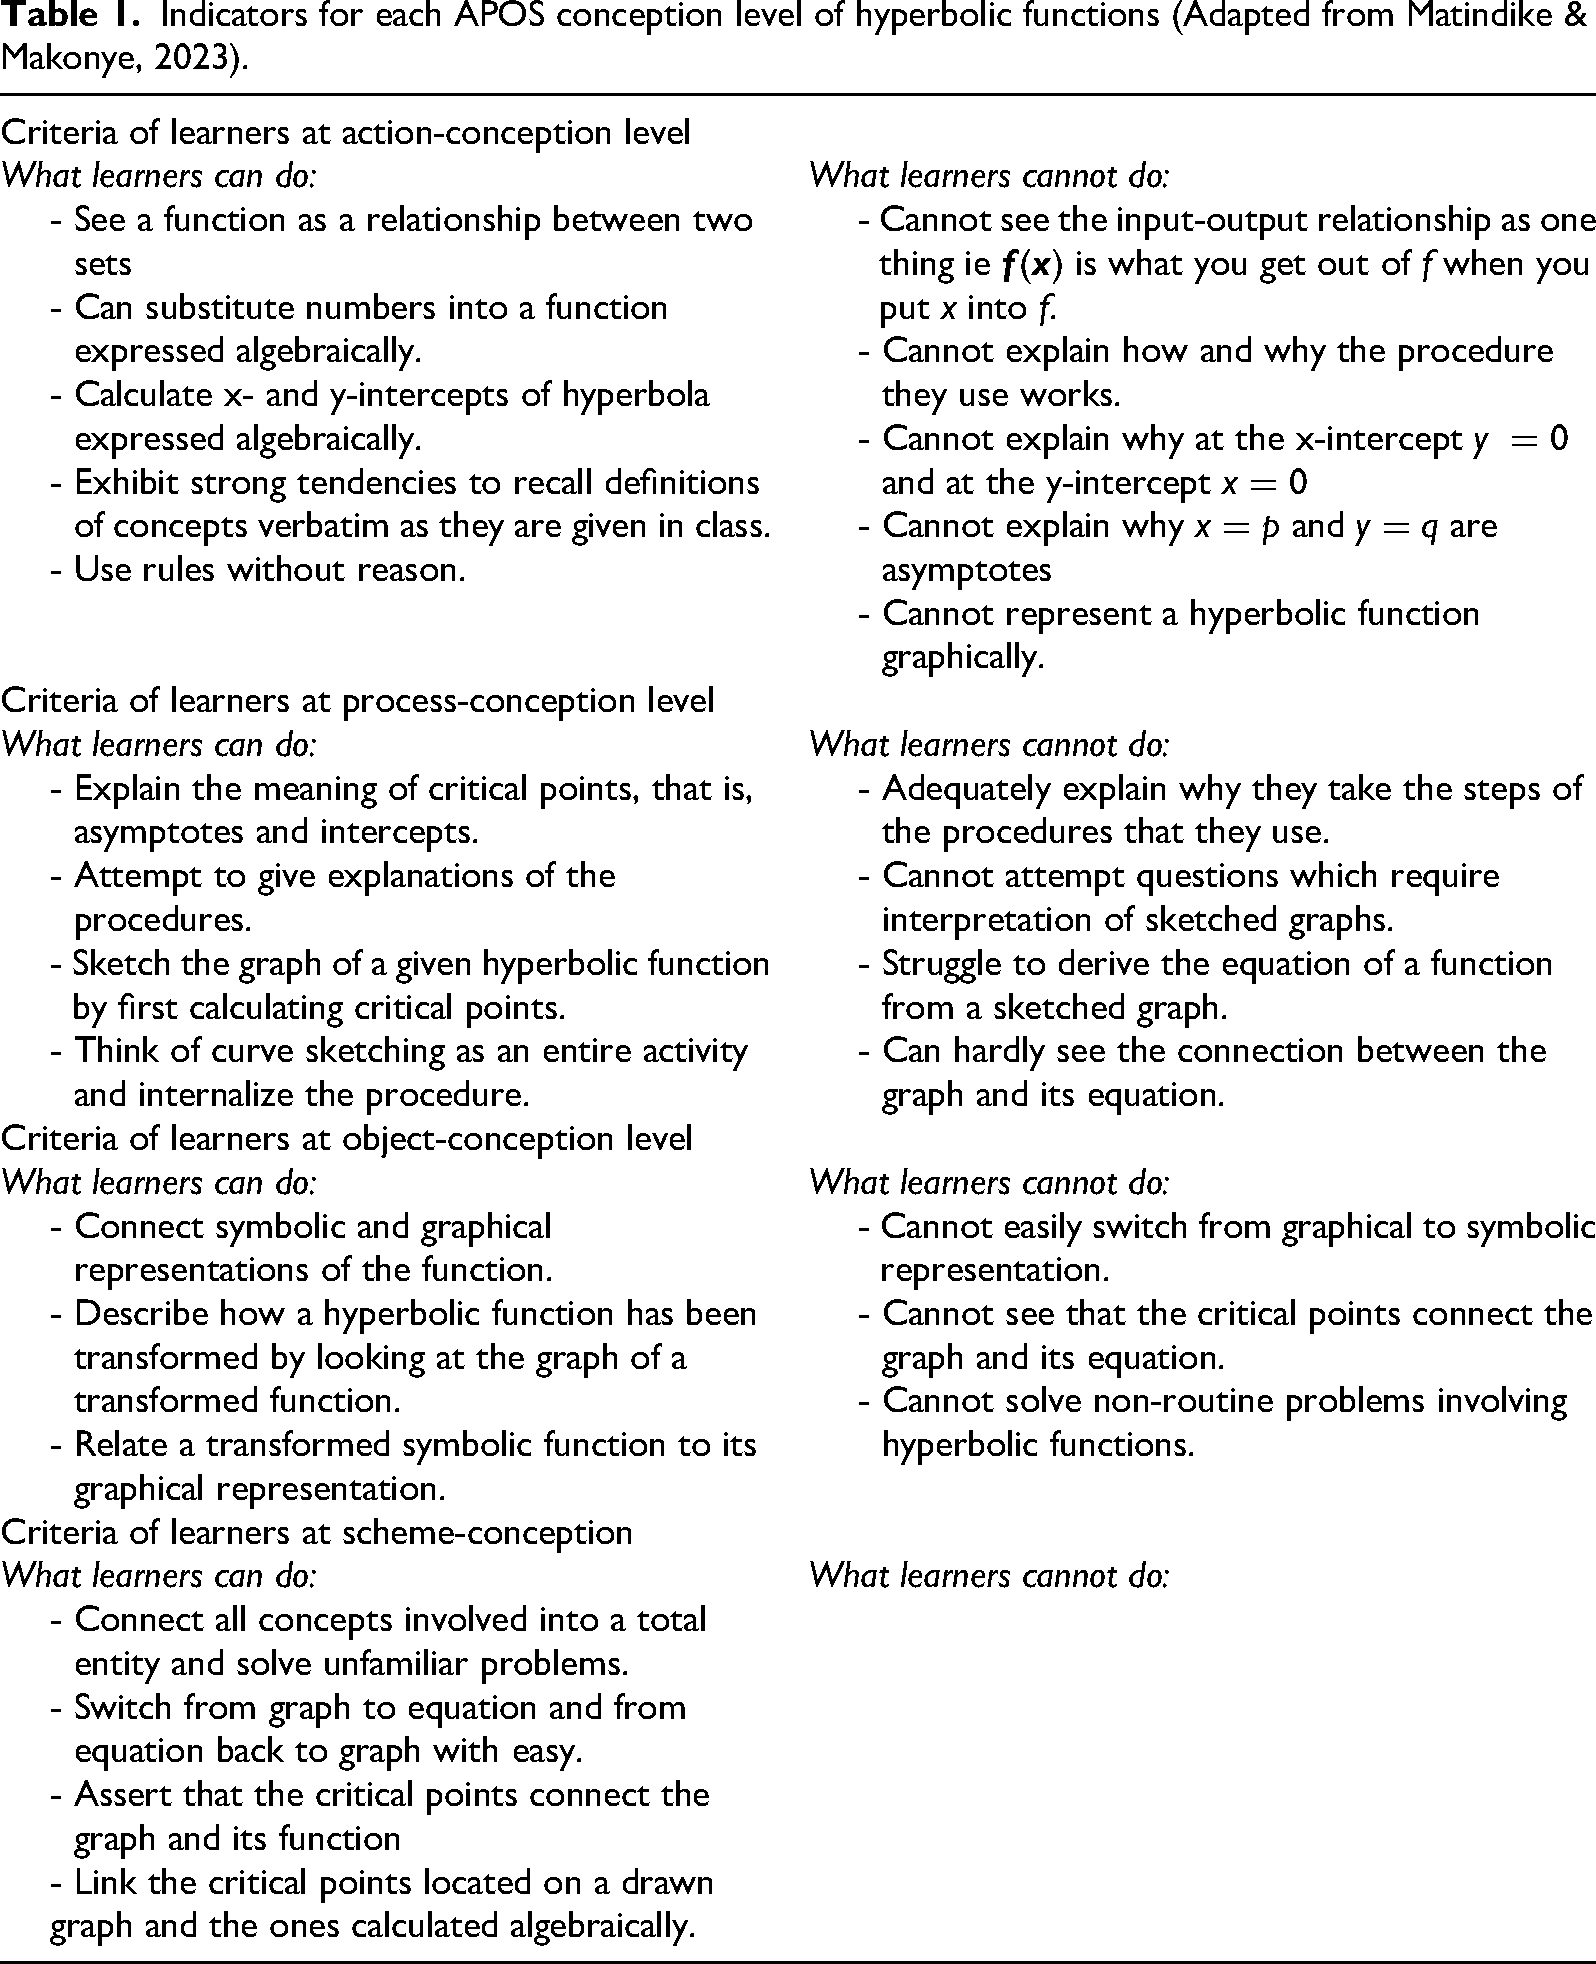
The APOS theory was adapted with a clear understanding that the theory does not claim to provide an exhaustive account of how students learn a particular mathematical concept. However, the theory provides a credible theoretical explanation to the complex and invisible mathematical mental processes. The challenge in applying the theory is that though it suggests a simple, one-directional progression from Action to Process to Object and then to having different actions, processes, and objects organized in schemas, the mental processes are more like a dialectical progression where there can be partial developments, passages and returns from one type of conception to another (Arnon et al., 2014). What this means is that when confronted with a mathematical problem situation, the way in which learners attempt to resolve it will vary, depending on their action, process or object-conception of the concepts involved in that problem. To ameliorate this challenge, a model of APOS conception levels in hyperbolic functions was adopted, expressed in terms of actions, processes, objects, and schema. The four conception levels and their indicators are explained in Table 1, with specific reference to the hyperbolic function.
Indicators for each APOS conception level of hyperbolic functions (Adapted from Matindike & Makonye, 2023).
2. Research questions
The study was guided by the following questions:
What impact does Autograph-mediated instruction have on enhancing learners’ conceptual understanding of concepts under hyperbolic functions? In what ways does Autograph-mediated instruction facilitate the learners’ mental construction of hyperbolic functions from one APOS conception level to another higher level?
3. Methodological aspects
A qualitative case study design was adopted for this study. This research design was most appropriate because it allowed the researcher to integrate a variety of data sources and to analyze them as a collective whole to provide a rich description of the pedagogical phenomenon. The central focus of this study was to explore and investigate in detail the learning processes within an ICT-mediated social instructional context.
3.1 The research site
The study was carried out at a rural secondary school in the Limpopo province of South Africa. At the time of data collection, the school had a total enrollment of 250 learners. Of these, 130 were girls and 120 were boys. The school is located in an underprivileged rural community, serving three villages. Some learners reside over 5 km away from the school. In terms of ICT infrastructure, the school had received a donation of fifty laptops and two overhead projectors, among other ICT equipment specifically for teaching and learning purposes. However, the mathematics educator at the school indicated that he had not used the ICT tools for teaching. The mathematics teacher was qualified with a university degree and had more than five years of experience in teaching mathematics at FET level.
3.2 Sampling
Purposive sampling was adopted for the study. Thirteen (13) Grade 11 learners (eight boys and five girls) at the school were conveniently sampled for the study. These learners were selected out of a total of 41 learners in Grade 11 on the basis that they were studying pure mathematics, while the others were studying Mathematical Literacy. Coincidentally, the small sample was appropriate for this study as it allowed for an in-depth exploration of the learners’ experiences during the lessons (Ahmad & Wilkins, 2025). Instead of aiming for broad generalizations, the study prioritized rich, detailed data and nuanced understanding of the learners’ development of concepts learnt (Douglas, 2022). Grade 11 mathematics class was chosen for the study because, according to the CAPS document, much of the content on functions is covered in Grade 11.
3.3 Data collection and instruments
Data collection was done in three phases. The first phase was the administering of a prediagnostic test (Cohen & Manion, 2007; see Supplemental Appendix A). Each question item in the diagnostic test targeted a specific APOS level and were informed by the APOS-hyperbola conception levels (see Table 1). The pretest enabled us to establish the learners’ conception levels (in APOS terms) on hyperbolic functions before the intervention program. To have an in-depth understanding of the learners’ written responses, task-based interviews (see Supplemental Appendix B) were undertaken during analysis of learners’ written responses. The interviews were done on a one-to-one basis, and the questions were based on the learner's written responses in the pretest. The interviews were audio-taped and later transcribed for analysis. During the interviews, nonverbal communications made by the learners were also recorded. These were recorded in a reflexive diary, that is, a notebook which was used to write down the daily reflections during data collection. The second phase of data collection was the implementation of the ICT-mediated teaching (intervention) program on hyperbolic functions. The third phase of data collection involved administering the postdiagnostic test (see Supplemental Appendix C). The posttest was written under the same conditions as the pretest. Task-based interviews were carried out during analysis of written responses in the posttest. The aim was to establish if there were any qualitative changes in learners’ level of conception after the intervention program. To ensure credibility of data, the study employed triangulation of data collection methods, which included observation, task-based interviews and document analysis. The data sources gave room for probing, iterative questioning, and allowed for follow-ups for further clarification. The inclusion of a detailed description of the context under which data was collected helped to increase dependability of the study.
3.4 Autograph-mediated teaching program on hyperbolic functions
Informed and guided by the learners’ errors and misconceptions on functions identified in the pretest, an Autograph-mediated intervention program on hyperbolic functions was developed. In developing the intervention program, the researcher solicited expert guidance from the district CA and other experienced teachers. The CA provided valuable input on developing learning activities based on the Autograph software. The first two lessons were dedicated to the introduction of Autograph. All the lessons were presented by the author. Each learner participant had a desktop computer installed with the Autograph software. All the lessons were video-taped for analysis. The instructional intervention program was structured as outlined below.
3.4.1 Introduction to autograph
The purpose of the introductory lessons was to introduce the Autograph application to the participants and to ensure that they possess the basic computer skills needed during the teaching program. Basically the participants were taken through five steps which involved; launching Autograph, selecting the level option, plotting points and drawing graphs, changing scale on the axes and saving their work on the computer. The steps are briefly explained below.
Step 1: How to launch Autography
To launch Autograph, double-click on the desktop Autograph icon:

Or you can launch Autograph from:
Step 2: The level selector
Autograph can be used at two levels, the Standard or Advanced levels. The user would first be required to select the level from the two options as indicated by the screenshot of the Autograph dialog box below.
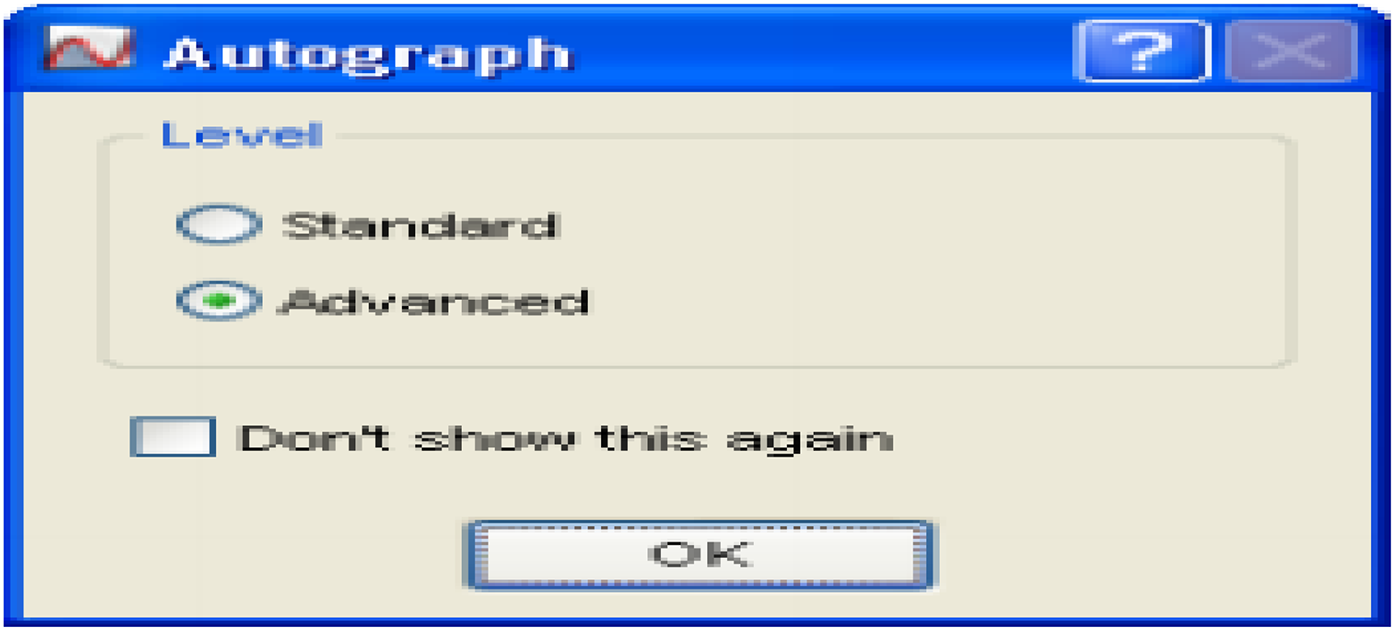
Figure 1 is a screenshot of the toolbar for both the standard and the advanced levels.
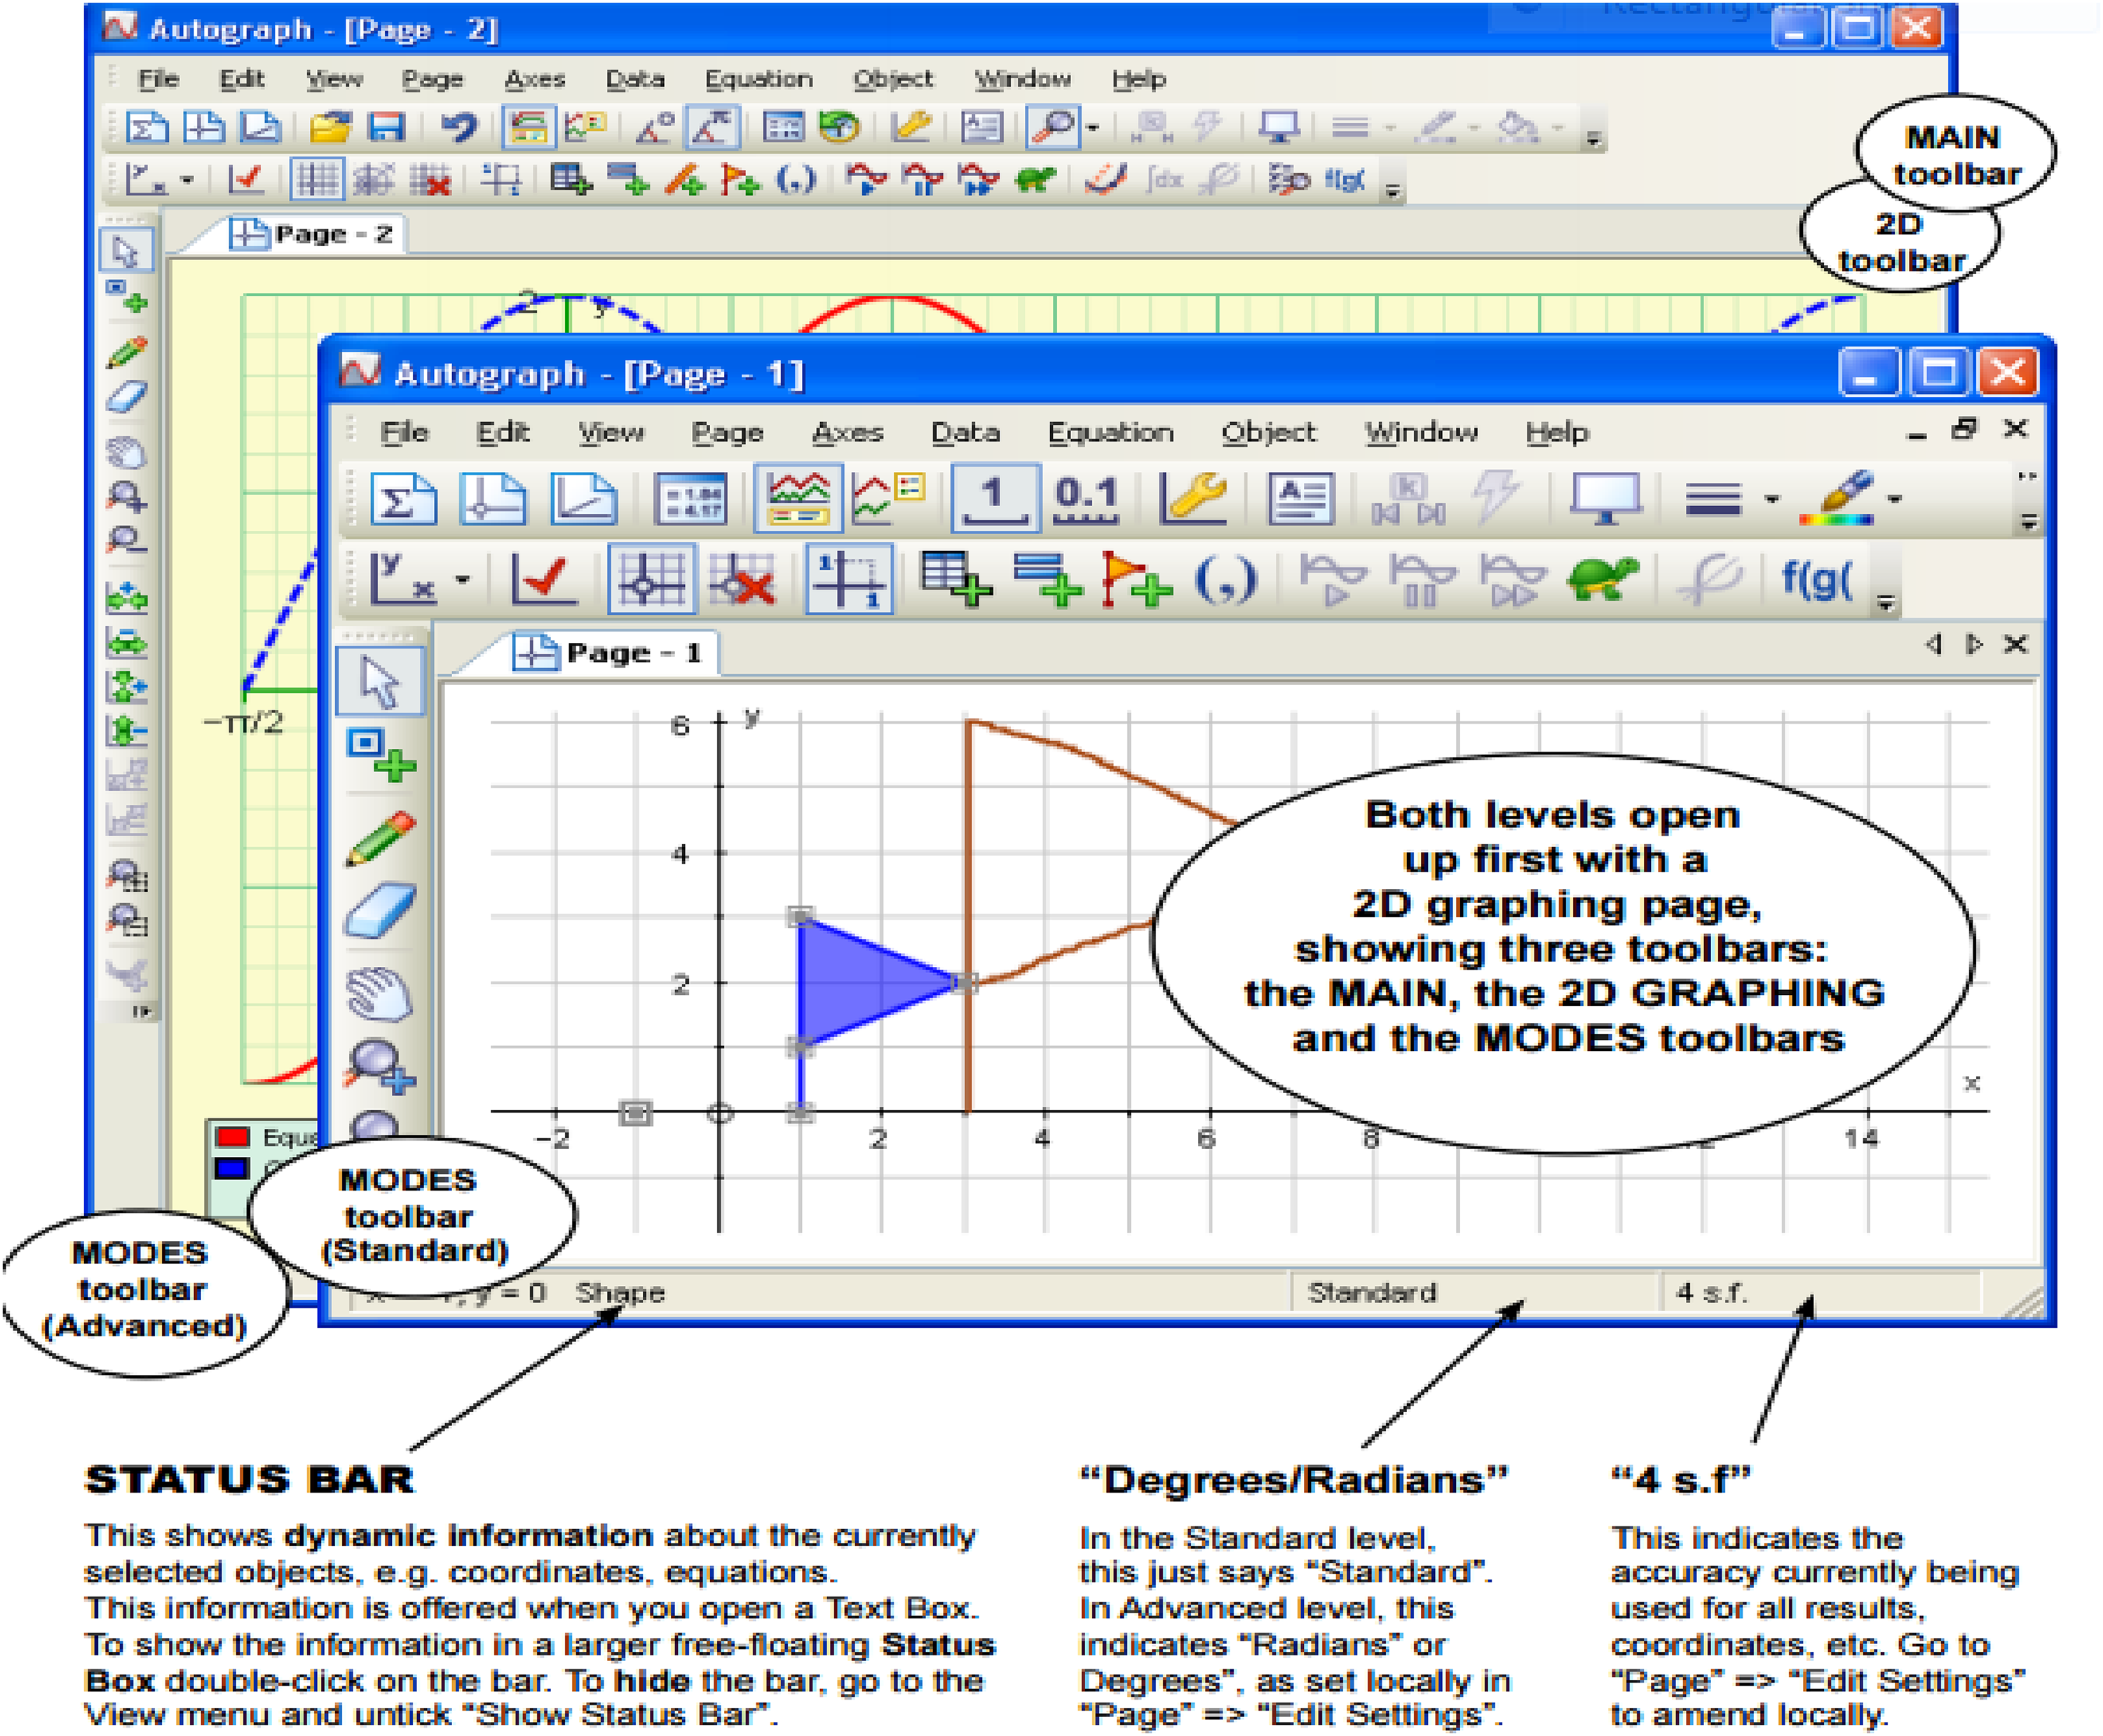
The main toolbar for both standard and advanced levels.
For purposes of the teaching program, learners were selecting the standard level option. This option was chosen because it's more user-friendly and its toolbar is less confusing, especially for beginners.
Step 3: Plotting points and drawing graphs
Autograph allows one to plot points on the Cartesian plane and draw graphs of the form Step 4: Changing the scale for axes.
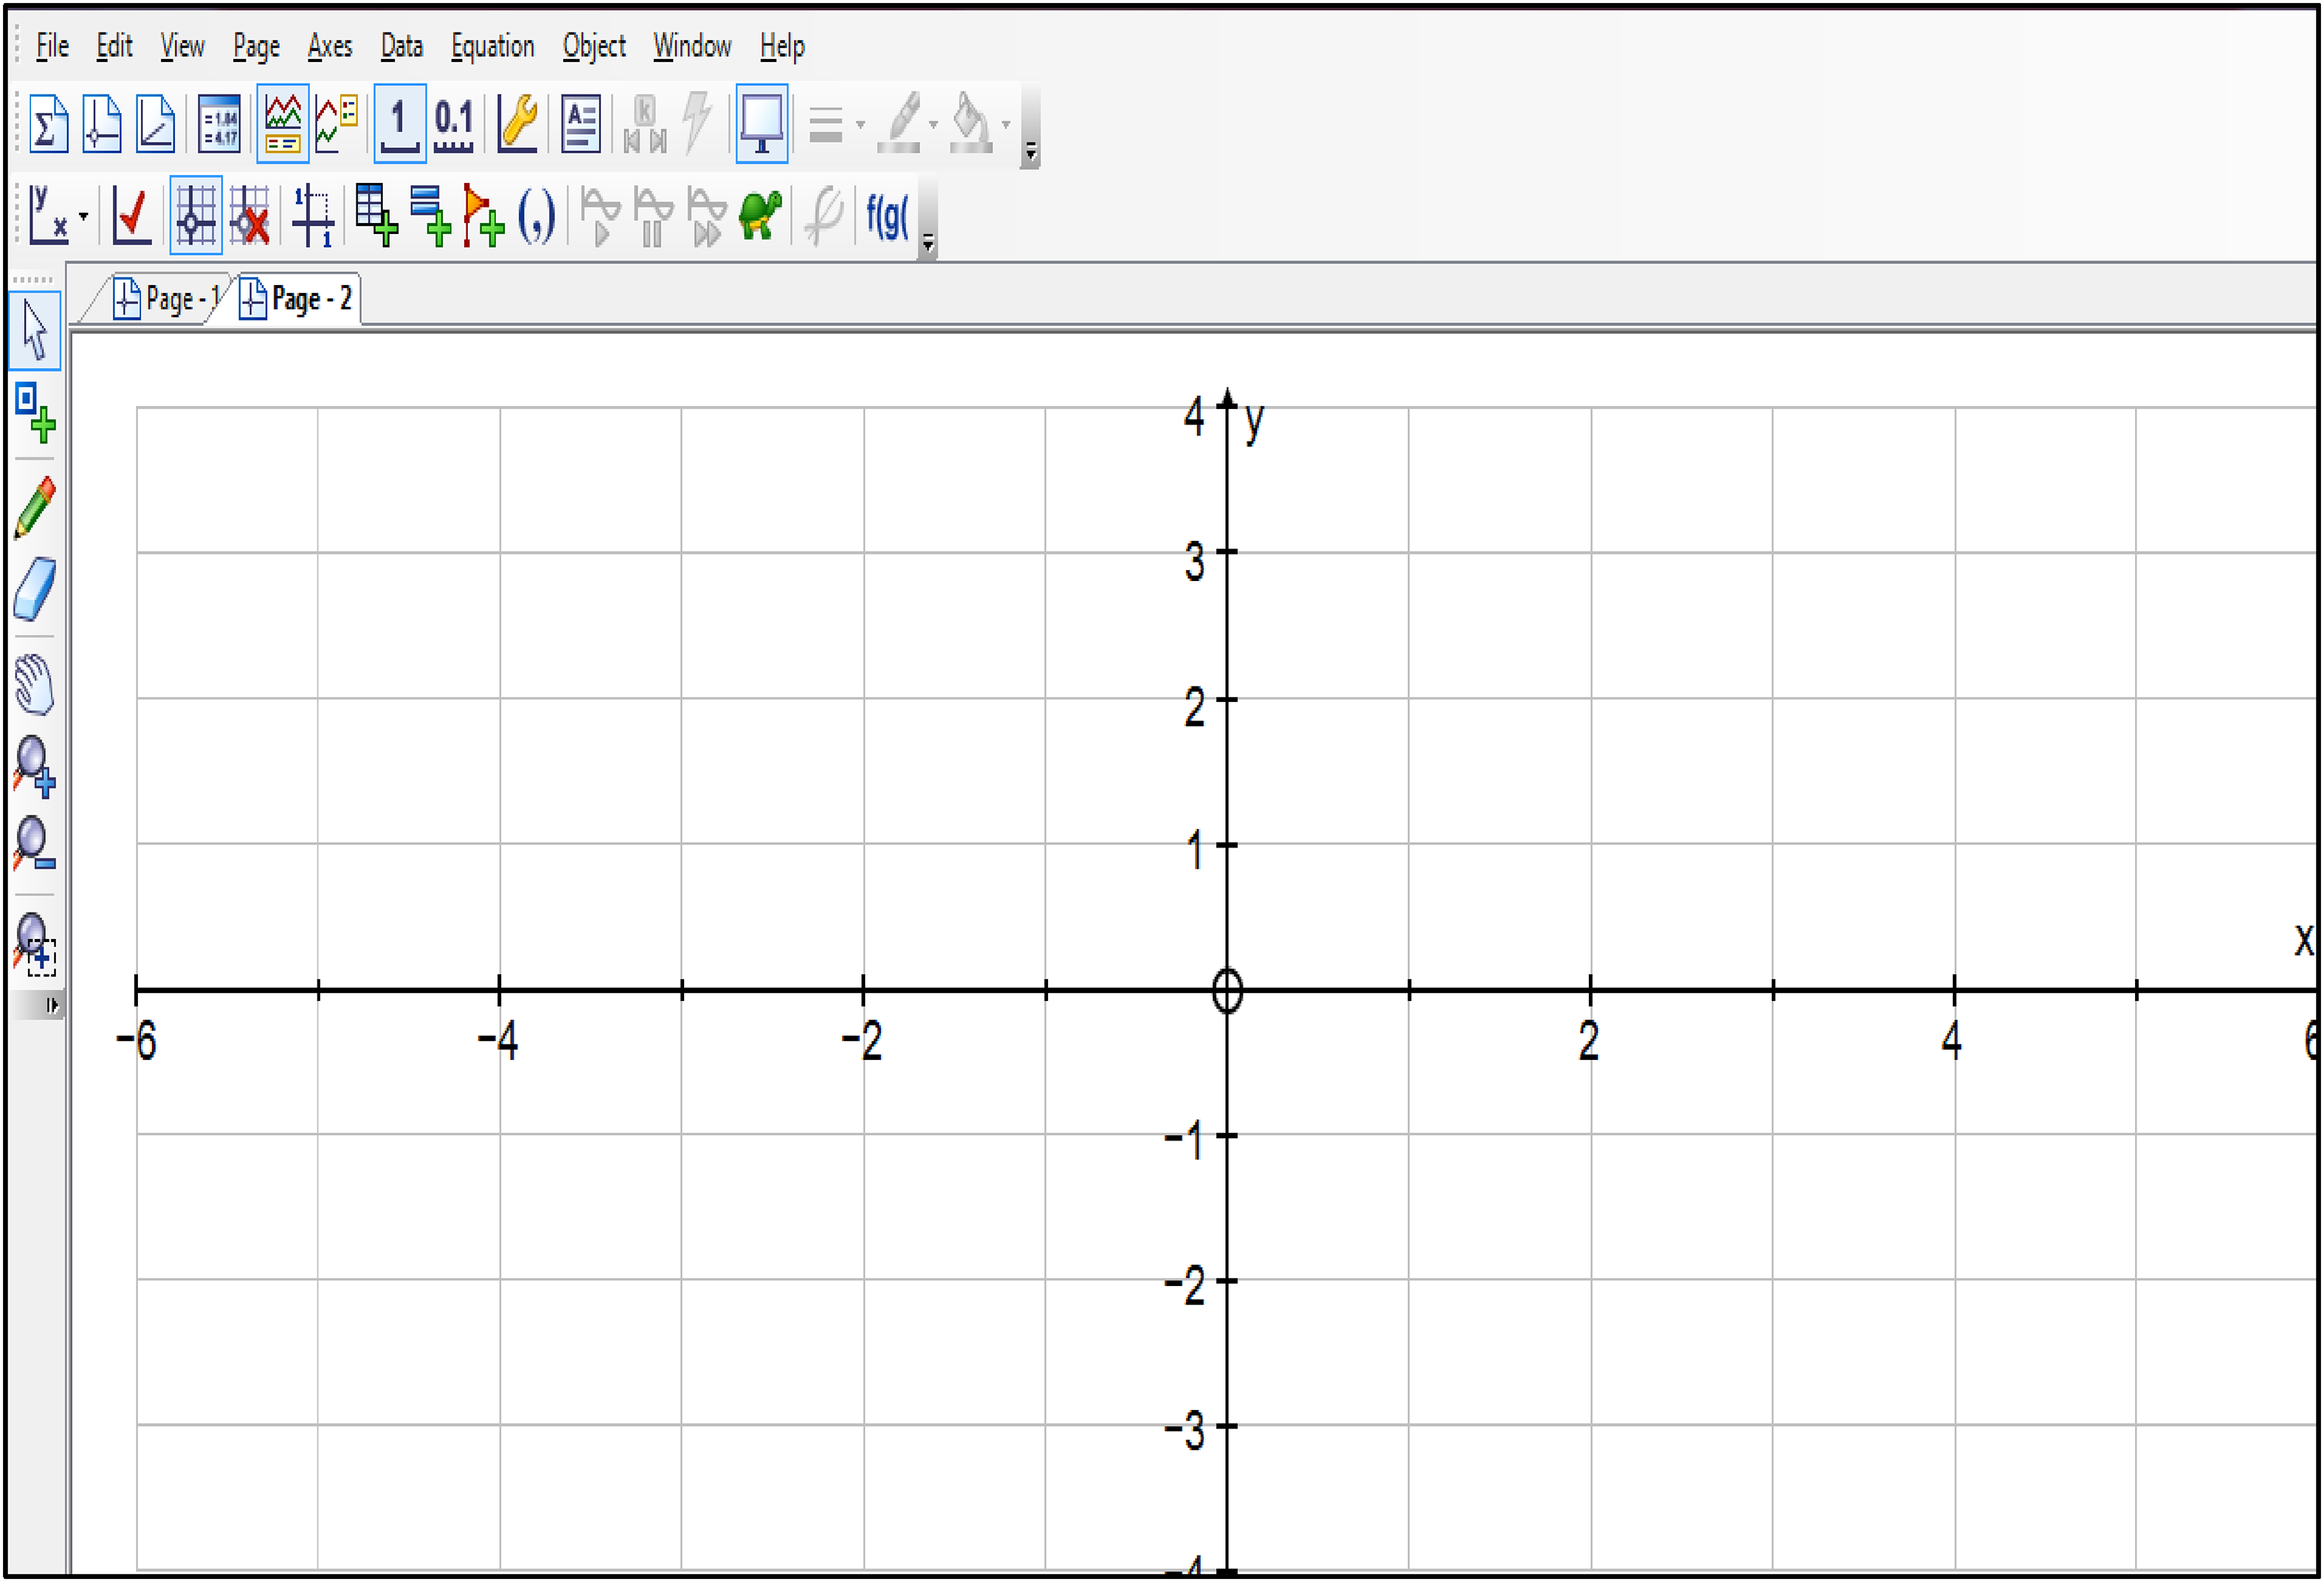
Autograph 2D page with its toolbar and the standard x – y axes.
It was important for the learners to be able to change the scale for the axes to suit the range of values or the type of graph they were drawing. To adjust the scale for the axes, choose the icon
Step 5: Saving your work EDIT AXES to bring out the dialogue box displayed below. Adjust the ranges and spacing to suit your need. Figure 3 is the Autograph display of the dialogue box for changing scale for the axes.
Comparison of learners' written responses to questions under the action–conception level in the pre– and posttest (n = 26).
It was important for the participants to be able to save their work. This allowed them to continue with their work later if they could not finish during the lesson or recap on the work they had covered in the previous session. To save their work, learners were instructed to choose the saving icon
 , name their work and save it under a named folder which each of them created in their computer.
3.4.2 Outline of the autograph-mediated lessons
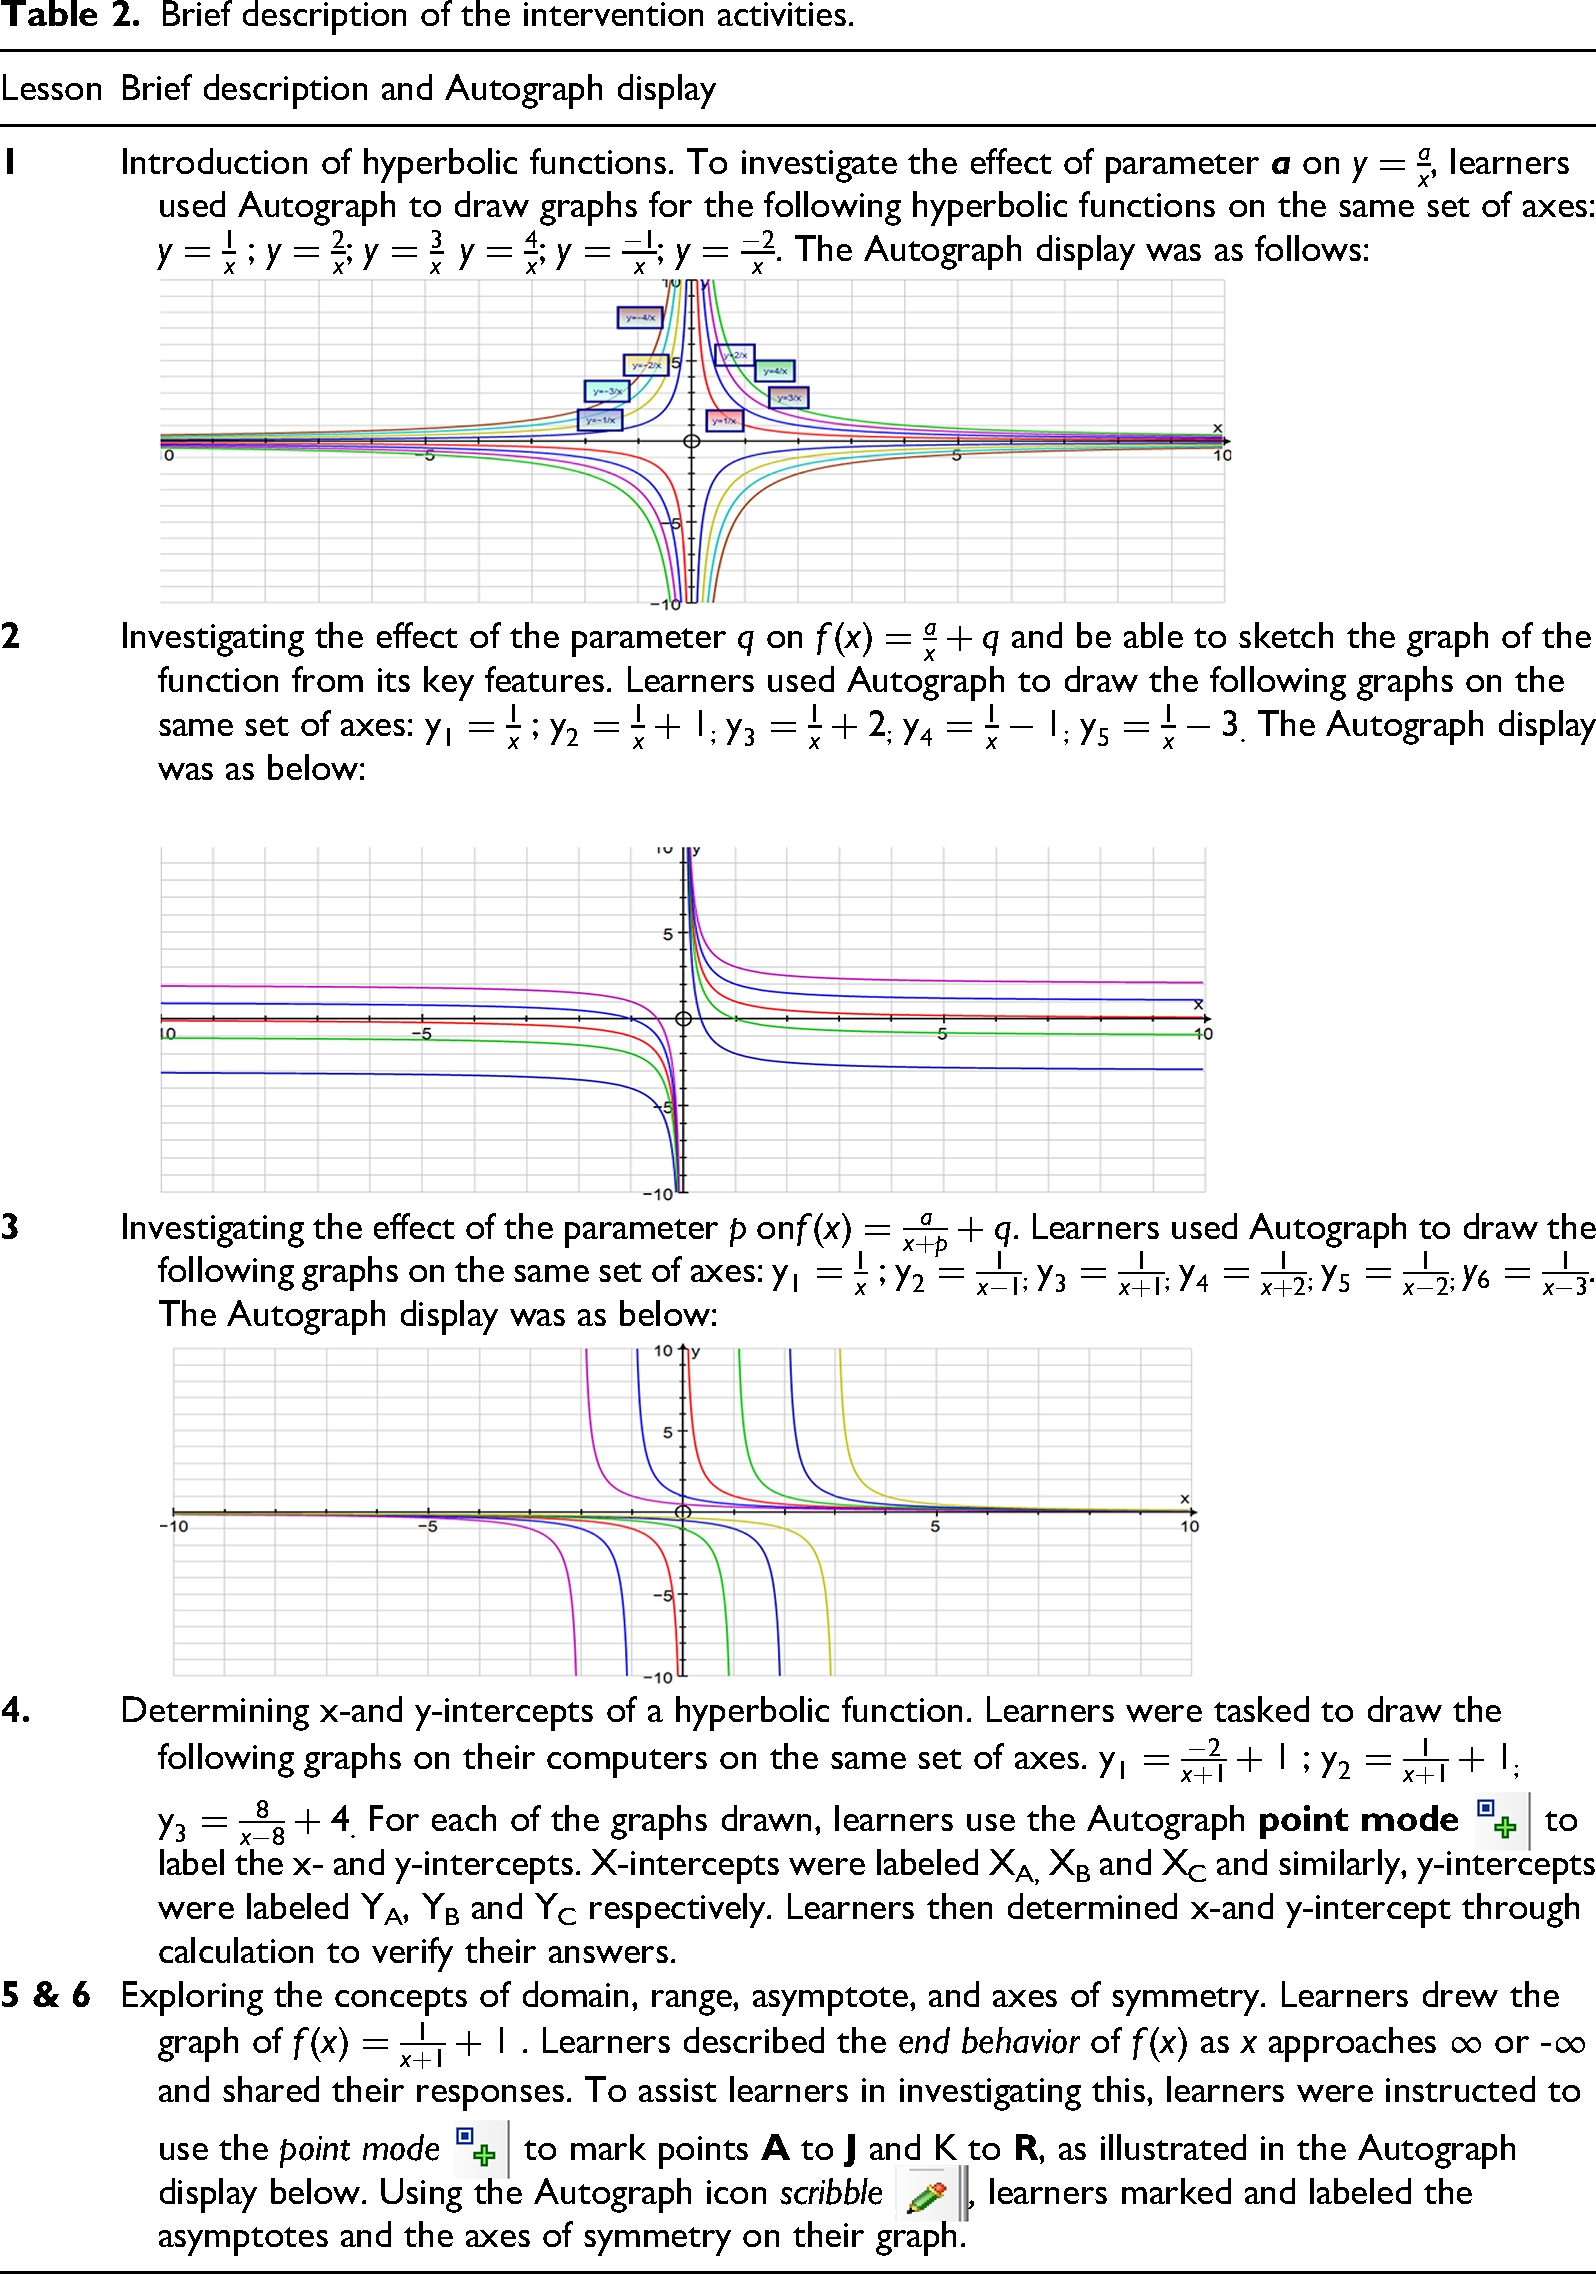
Basically, the teaching program engaged the participants in structured and targeted step-by-step learning activities with intermittent guidance from the teacher. The learners were given a number of activities and exercises involving drawing hyperbolic graphs using the Autograph software, investigating the effect of the parameters
Brief description of the intervention activities.
3.5 Data analysis
The data collected from the pre- and posttests and the task-based interviews were analyzed qualitatively. The APOS theory provided the analytical framework upon which the study could establish whether there were any changes in the learners’ conception of hyperbolic concepts after the instructional intervention. The APOS mental constructions were viewed as developmental layers that depicted the level of conception or depth of understanding of a concept. The genetic decomposition, as presented under the theoretical framework, specified indicators under each APOS conception level in relation to hyperbolic functions. Each learner's response for each question item across the pre- and posttests was categorized under one of the four categories: “No attempt,” “Incorrect,” “Partially correct,” or “Perfectly correct.” “No attempt” meant the question item was left blank. “Incorrect response” was when the approach used to answer the question was wrong and the working did not in any way lead to the solution of the problem. A “partially correct” response was when some steps of the working were done correctly, or some parts of the question were answered correctly, but some were incorrectly done. A “perfectly correct” response was when the most appropriate approach was used to solve the problem and the working was correctly done. Of paramount importance in the analysis was an attempt to establish any evidence of whether the instructional intervention facilitated the mental processes of interiorization (from action to process), encapsulation (from process to object) and thematization (from object to schema).
Since the study fed to a broader project that involved two other coresearchers, analysis of data was done collectively by a team of three researchers. To minimize bias, each of the researchers initially did the analysis and classification of the participants’ written and oral responses independent of each other, before merging the findings. In cases where we differed, particularly on conception levels, we transparently and critically reflected on the analytical framework until we reached a consensus. This brought in a variety of perspectives to the study and subdued the influence of researchers’ preconceived ideas. Learners’ written responses were triangulated with their oral responses to the task-based interview to ensure consistency.
4. Results and discussion
The APOS mental constructions and processes provided the theoretical base to establish if there was any qualitative change in the learners’ conception of concepts under hyperbolic functions before and after the instructional intervention. Firstly, a qualitative comparative analysis of the learners’ responses in the pre- and posttest is presented. The author admits that it is difficult to determine with certainty a learner's conception level of a concept at any given point. Even Dubinsky and Harel (1992) reported the difficulty they encountered in determining whether an individual's function concept was limited to action or had a process conception. Thus, any interpretation of individual responses may not be made with absolute reliability. To counter this challenge, the analysis of the learners’ written responses was triangulated with their oral responses to task-based interview question as they explained or justified their written responses.
4.1 A Qualitative comparison of learners’ written responses in the pre- and posttest
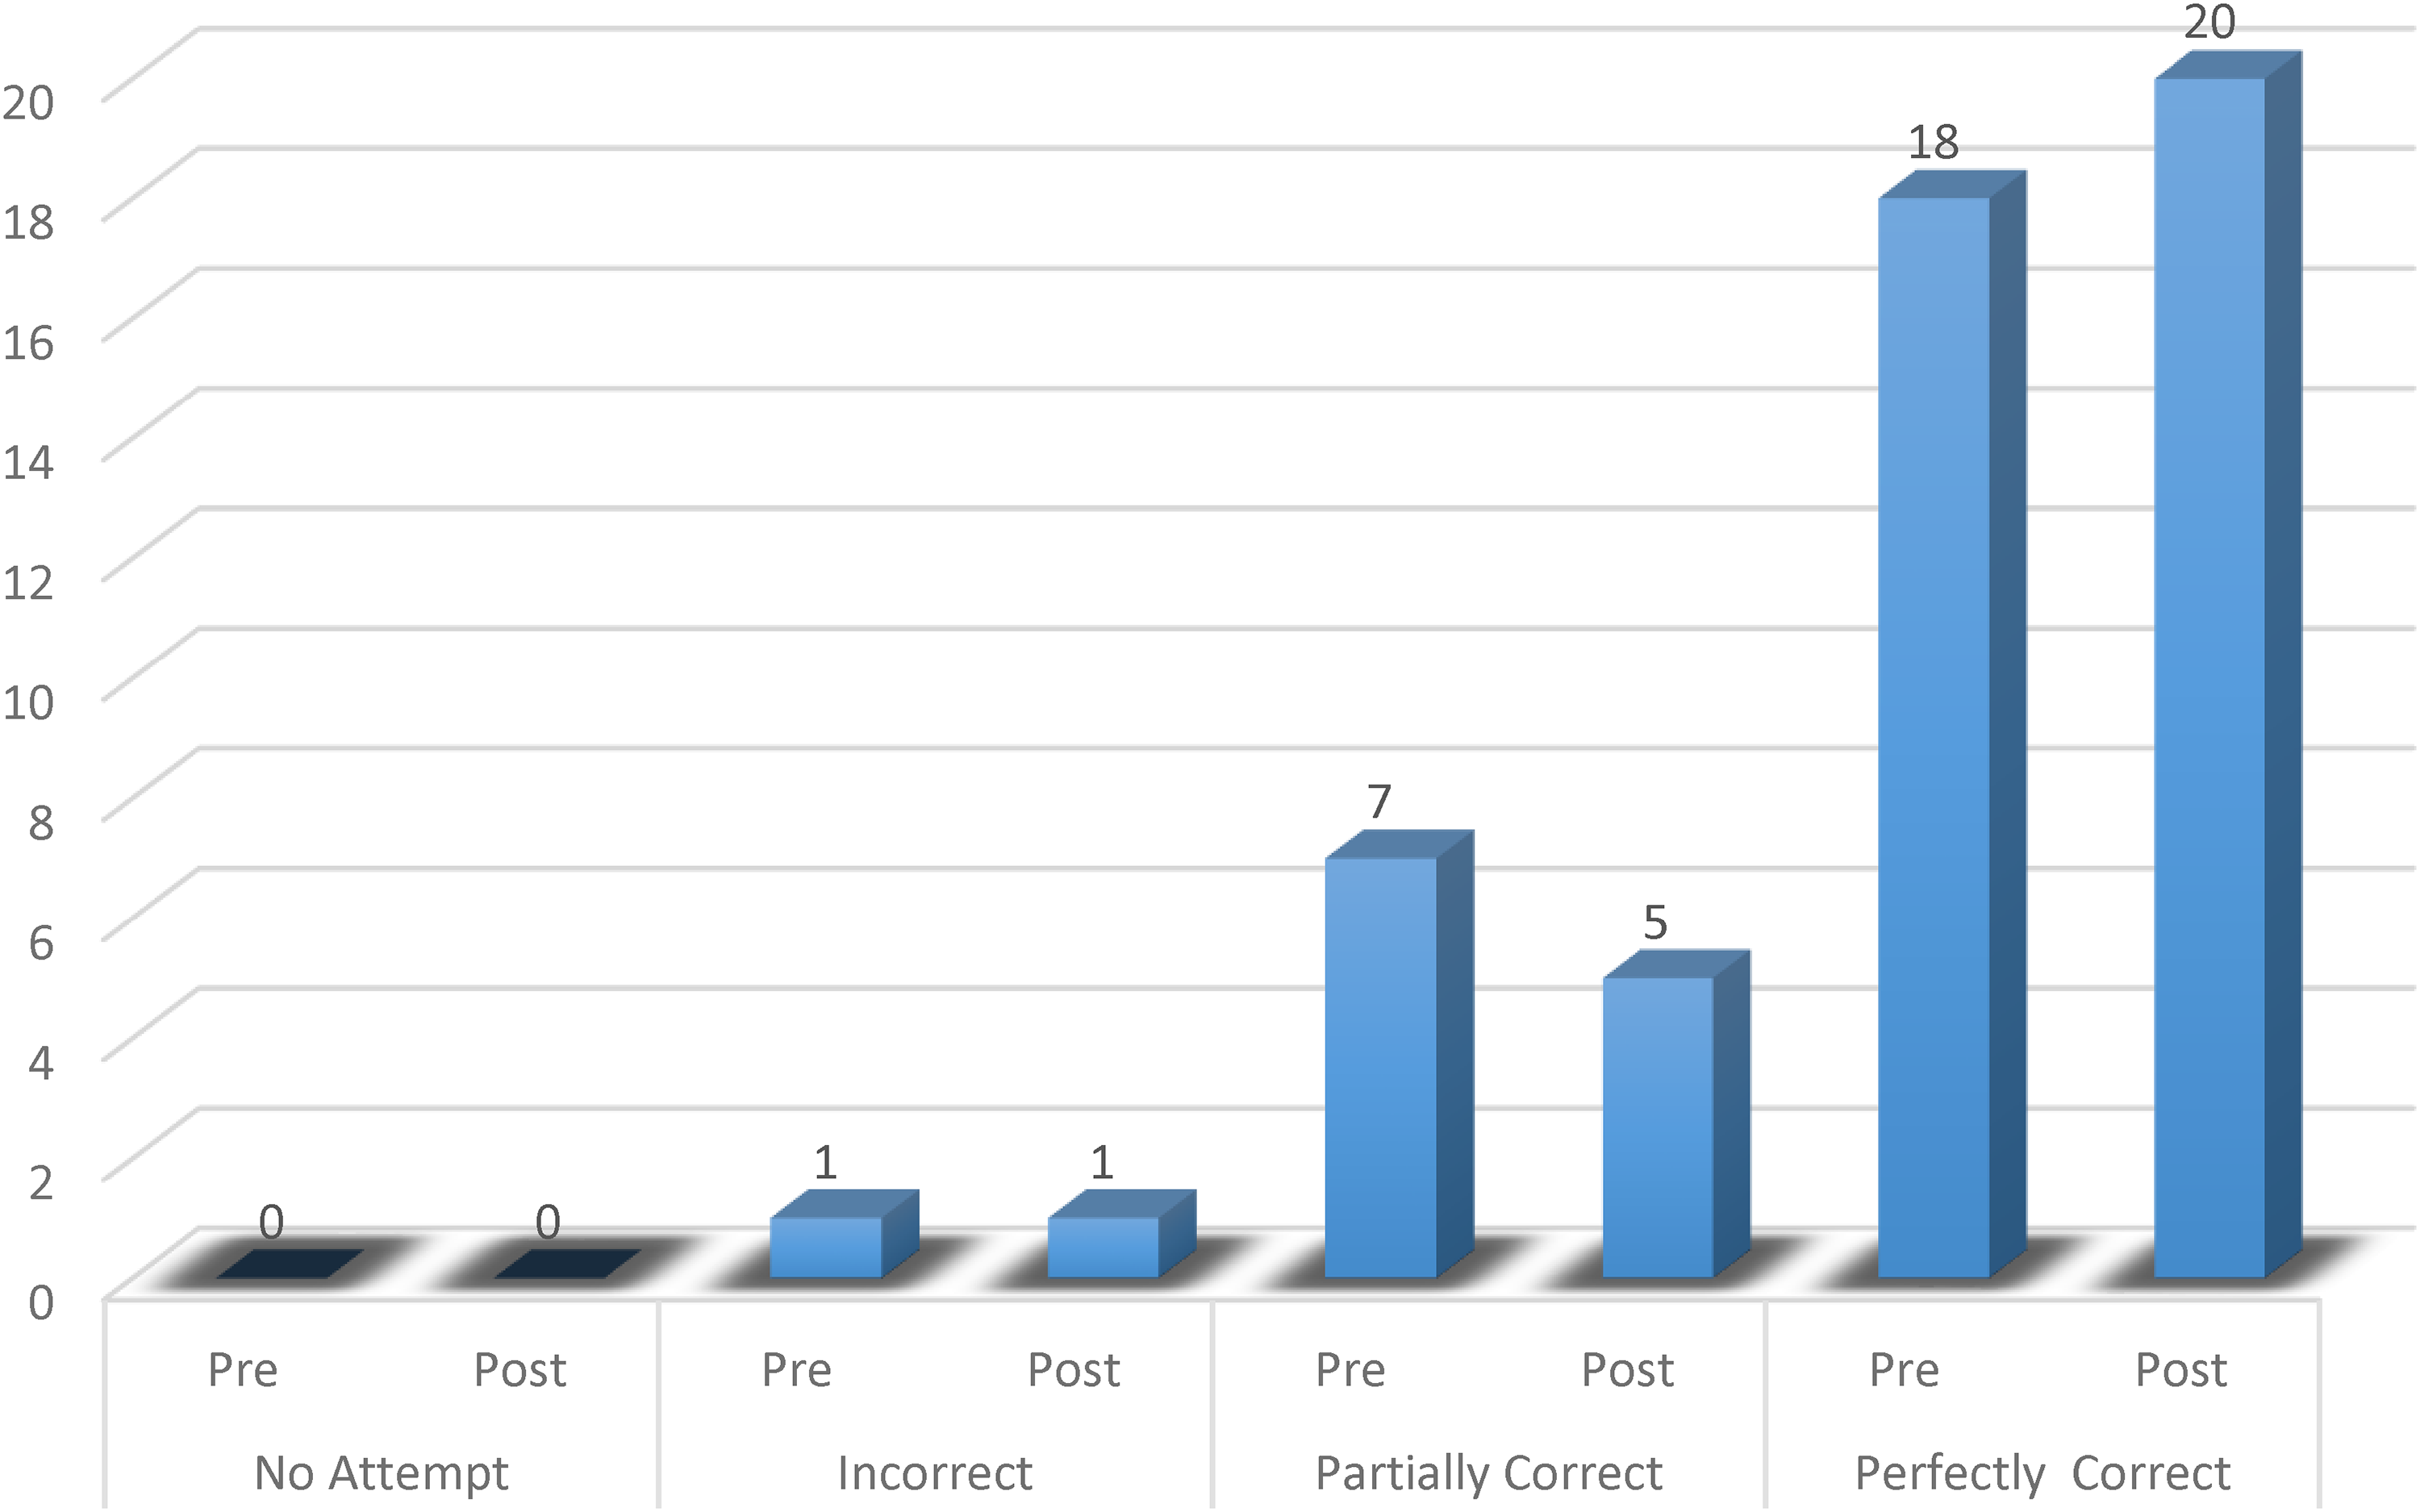
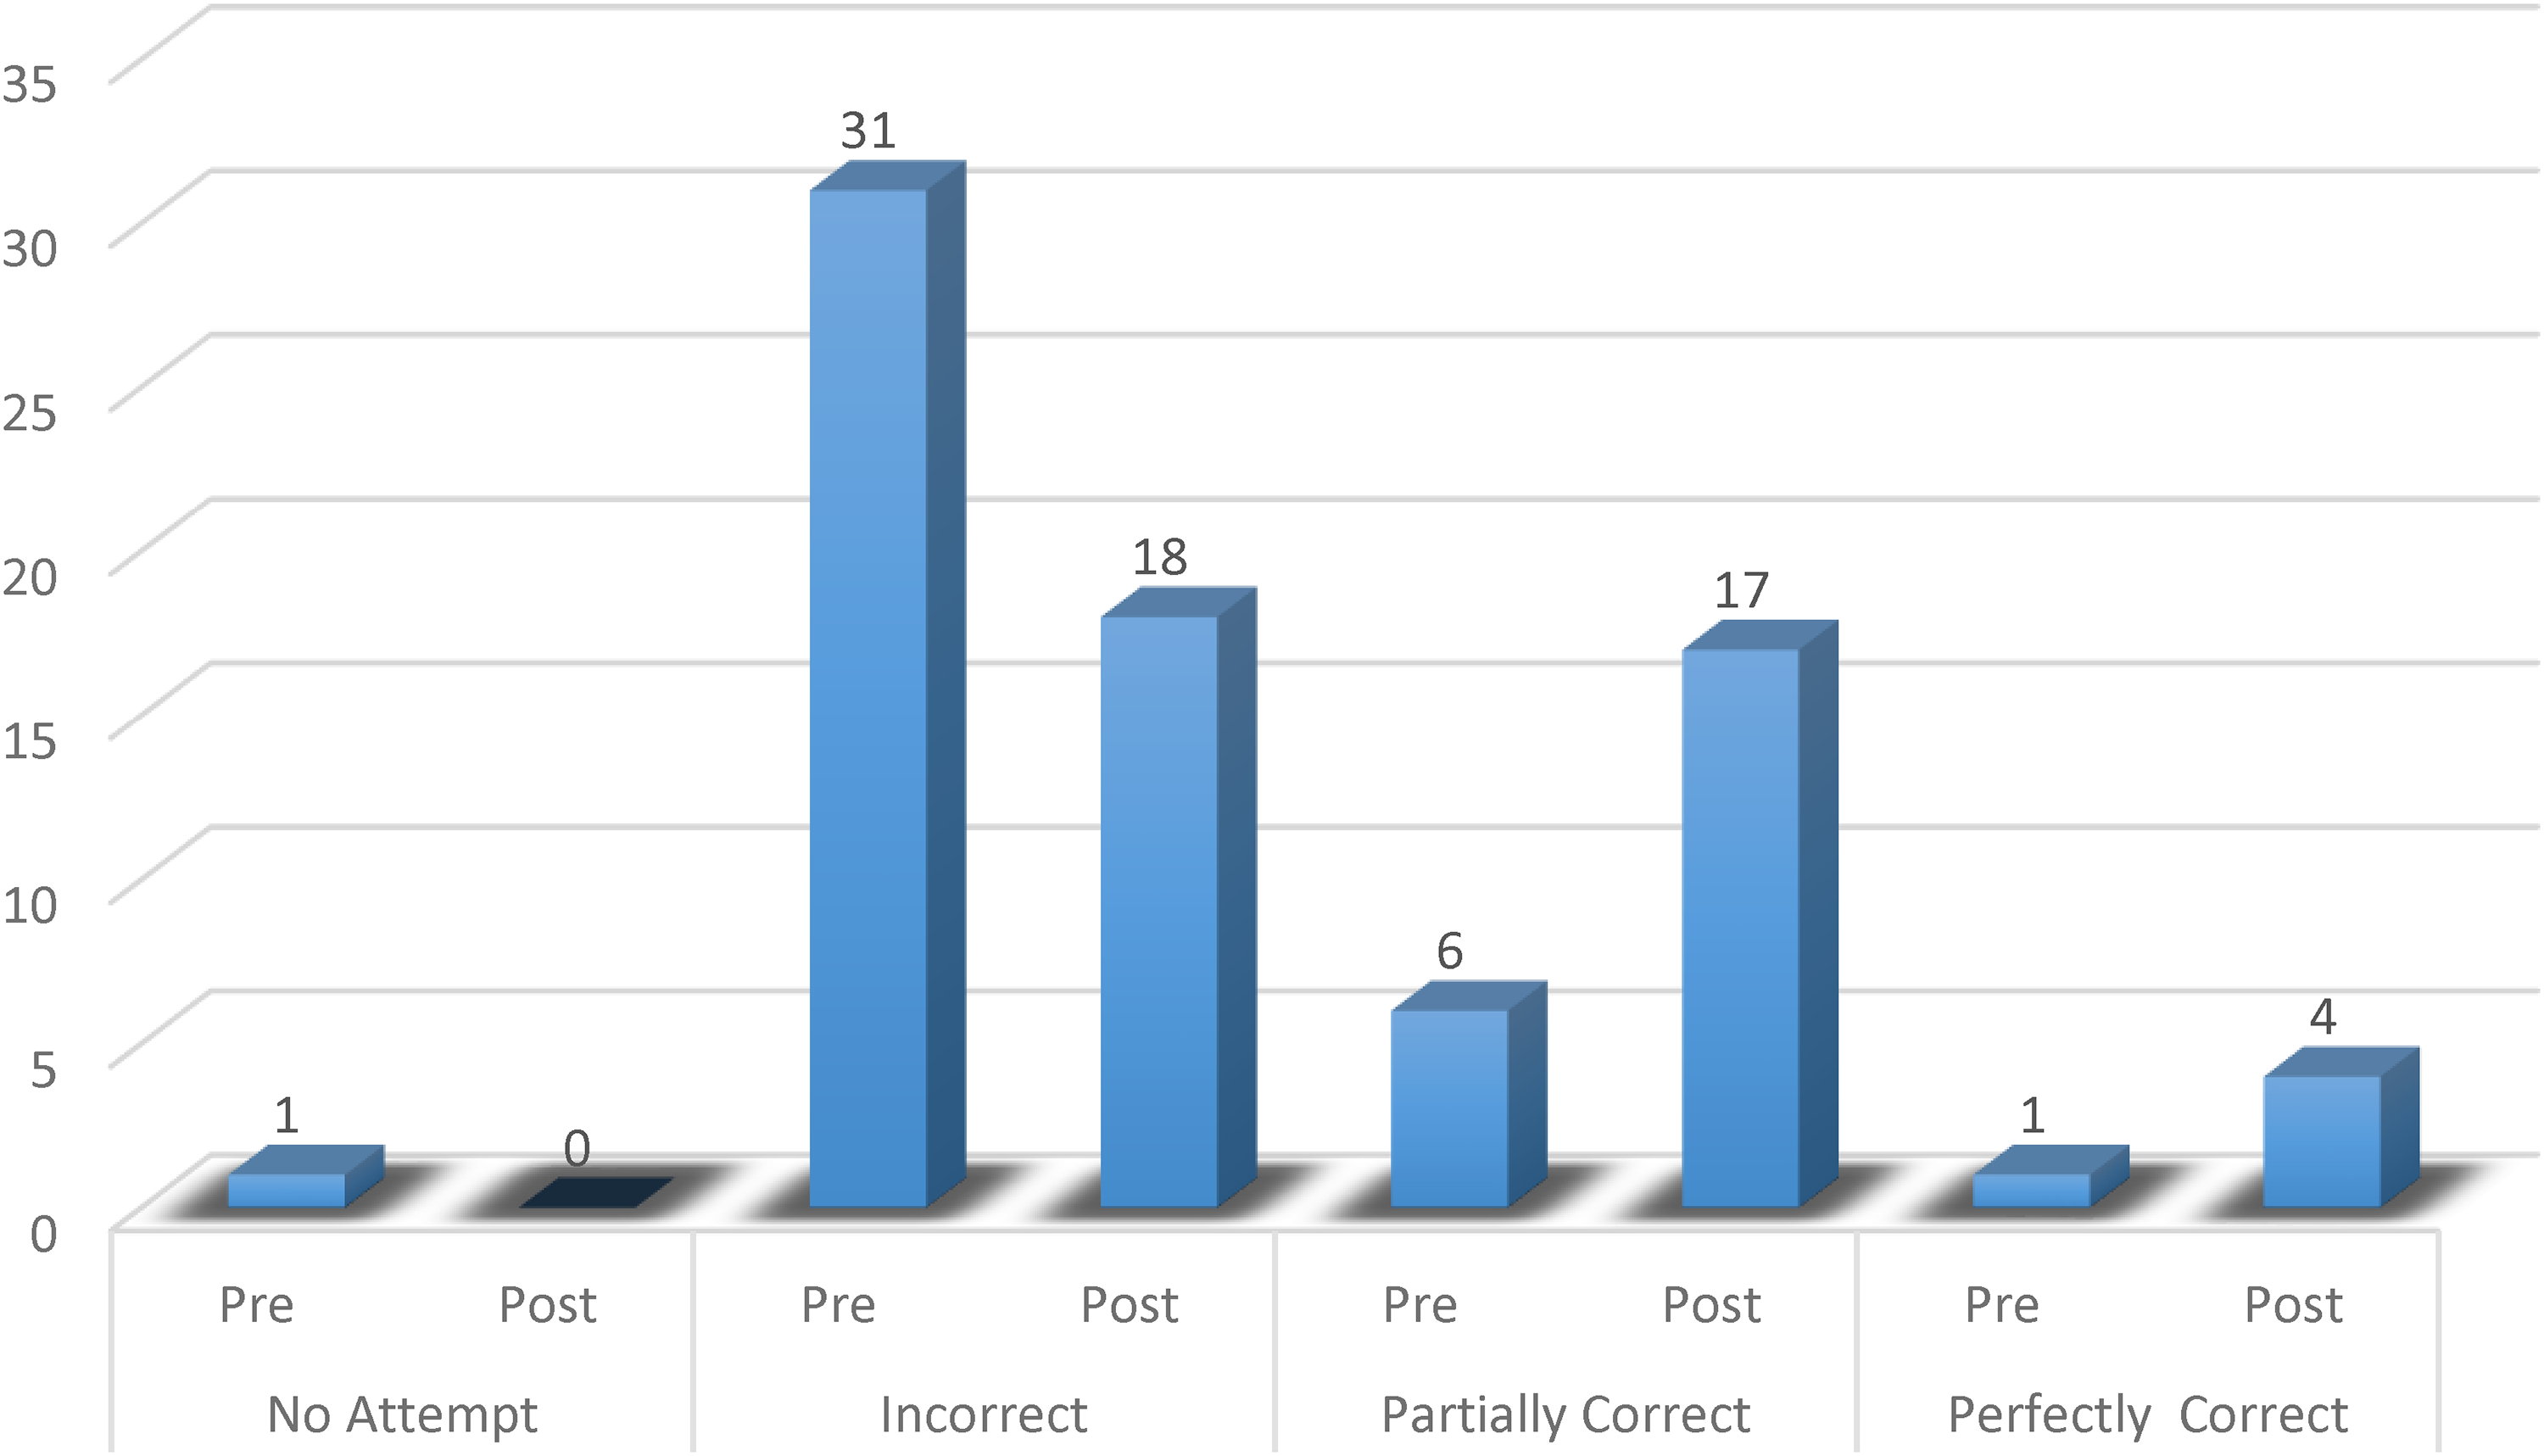
To have a clearer picture of what is depicted in Table 3, the responses were analyzed per each APOS conception level. There were two question items under the action-conception level. This means a total of 26 responses were received in the pretest and the same number of responses was received in the posttest. Figure 3 shows a comparison of the number of responses in each response category under the action-level questions, for the pre- and posttest.
Comparison of the number of learners' written responses for each question item under each APOS level in the pre- and posttest.
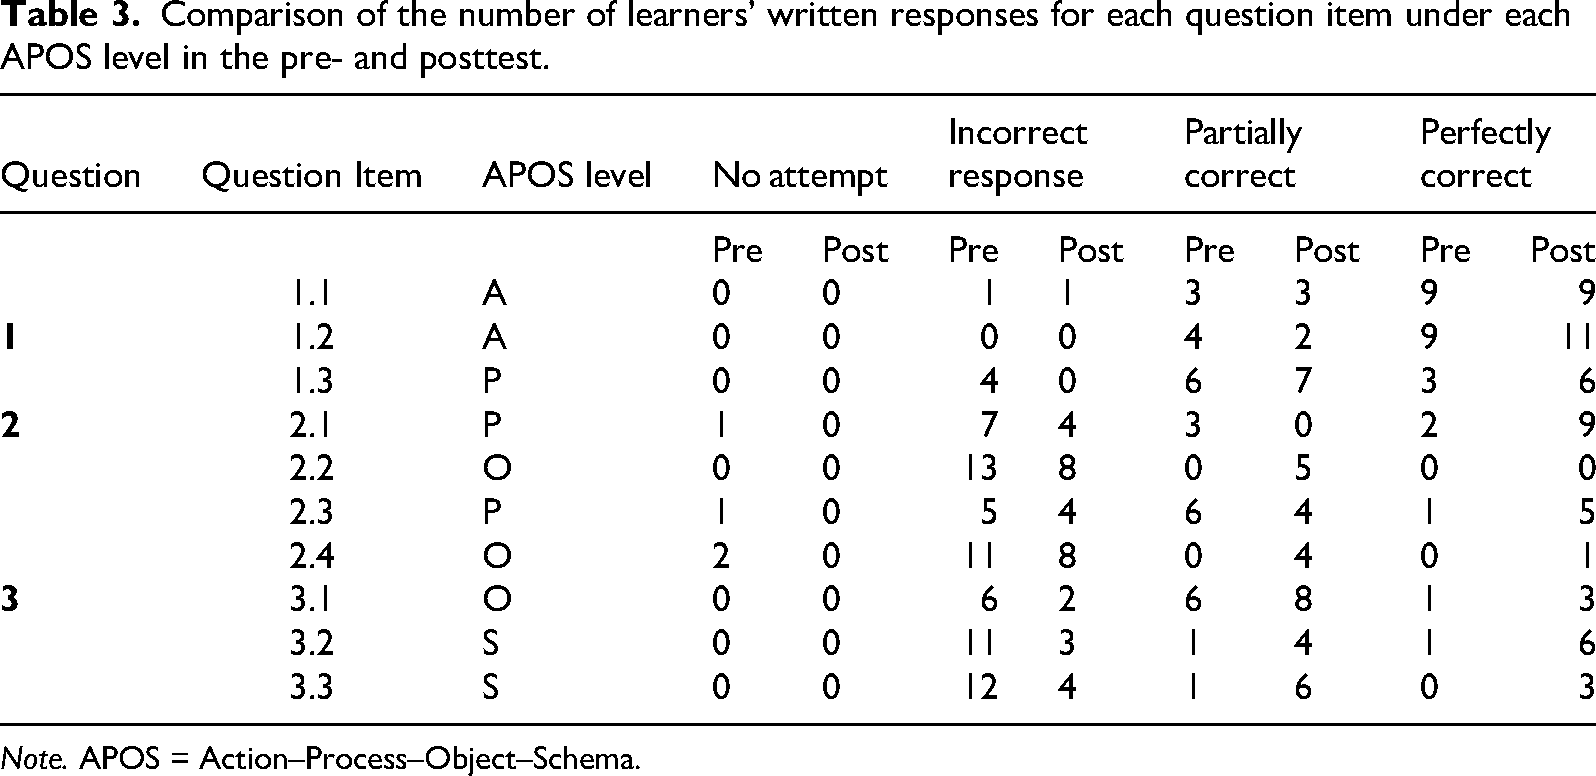
Note. APOS = Action–Process–Object–Schema.
What can be gleaned from both Table 2 and Figure 3 is that for the question items under the action level, there was a slight difference in the quality of learner responses in the pre- and posttest. For Question Item 1.1, there was no change in the number of responses under each response category. This finding was not surprising considering that the question item tested the learners’ procedural fluency. What came out later during task-based interviews was that the intervention lessons failed to correct some algebraic misconceptions that the learners were having. In Question Item 1.2, the number of partially correct responses dropped from four before the intervention to only one in the posttest. Consequently, the number of perfectly correct responses rose from nine to 12. This positive change suggested that learners were better able to identify the asymptotes on the given graph after the intervention. Though the intervention lessons might have strengthened the learners’ action conception of hyperbolic functions, but they were not successful in eradicating algebraic errors in some learners.
Moving on to the question items under the process-conception level, there were three question items under this conception level. A total of 39 responses were received from both the pretest and the posttest. Figure 4 compares the number of responses under each response category in the pre- and posttest.
Comparison of responses to questions under the process–conception level in the pre– and post-test (n = 39).
Questions items under the process conception showed an improvement in the quality of the learners’ responses across all response categories. There was a noticeable drop in the number of “No attempt,” “incorrect,” and “partially correct” responses. On the other hand, the number of “perfectly correct” responses increased noticeably. The question items required the learners to sketch the graph of a hyperbolic function using its critical features and be able to identify intercepts and asymptotes from a given hyperbolic graph. Generally, the learners’ responses reflected a considerable rise in their process-conception of the concepts under hyperbolic functions. After the intervention lessons, learners demonstrated better flexibility in their ability to switch between the algebraic and graphical representations. This improvement suggested that learners’ conception levels might have developed from action to process. Further analysis in the next section confirmed this observation.
The next set of question items was targeted toward the object-conception level. Under these question items, the learners were required to apply the vertical translation
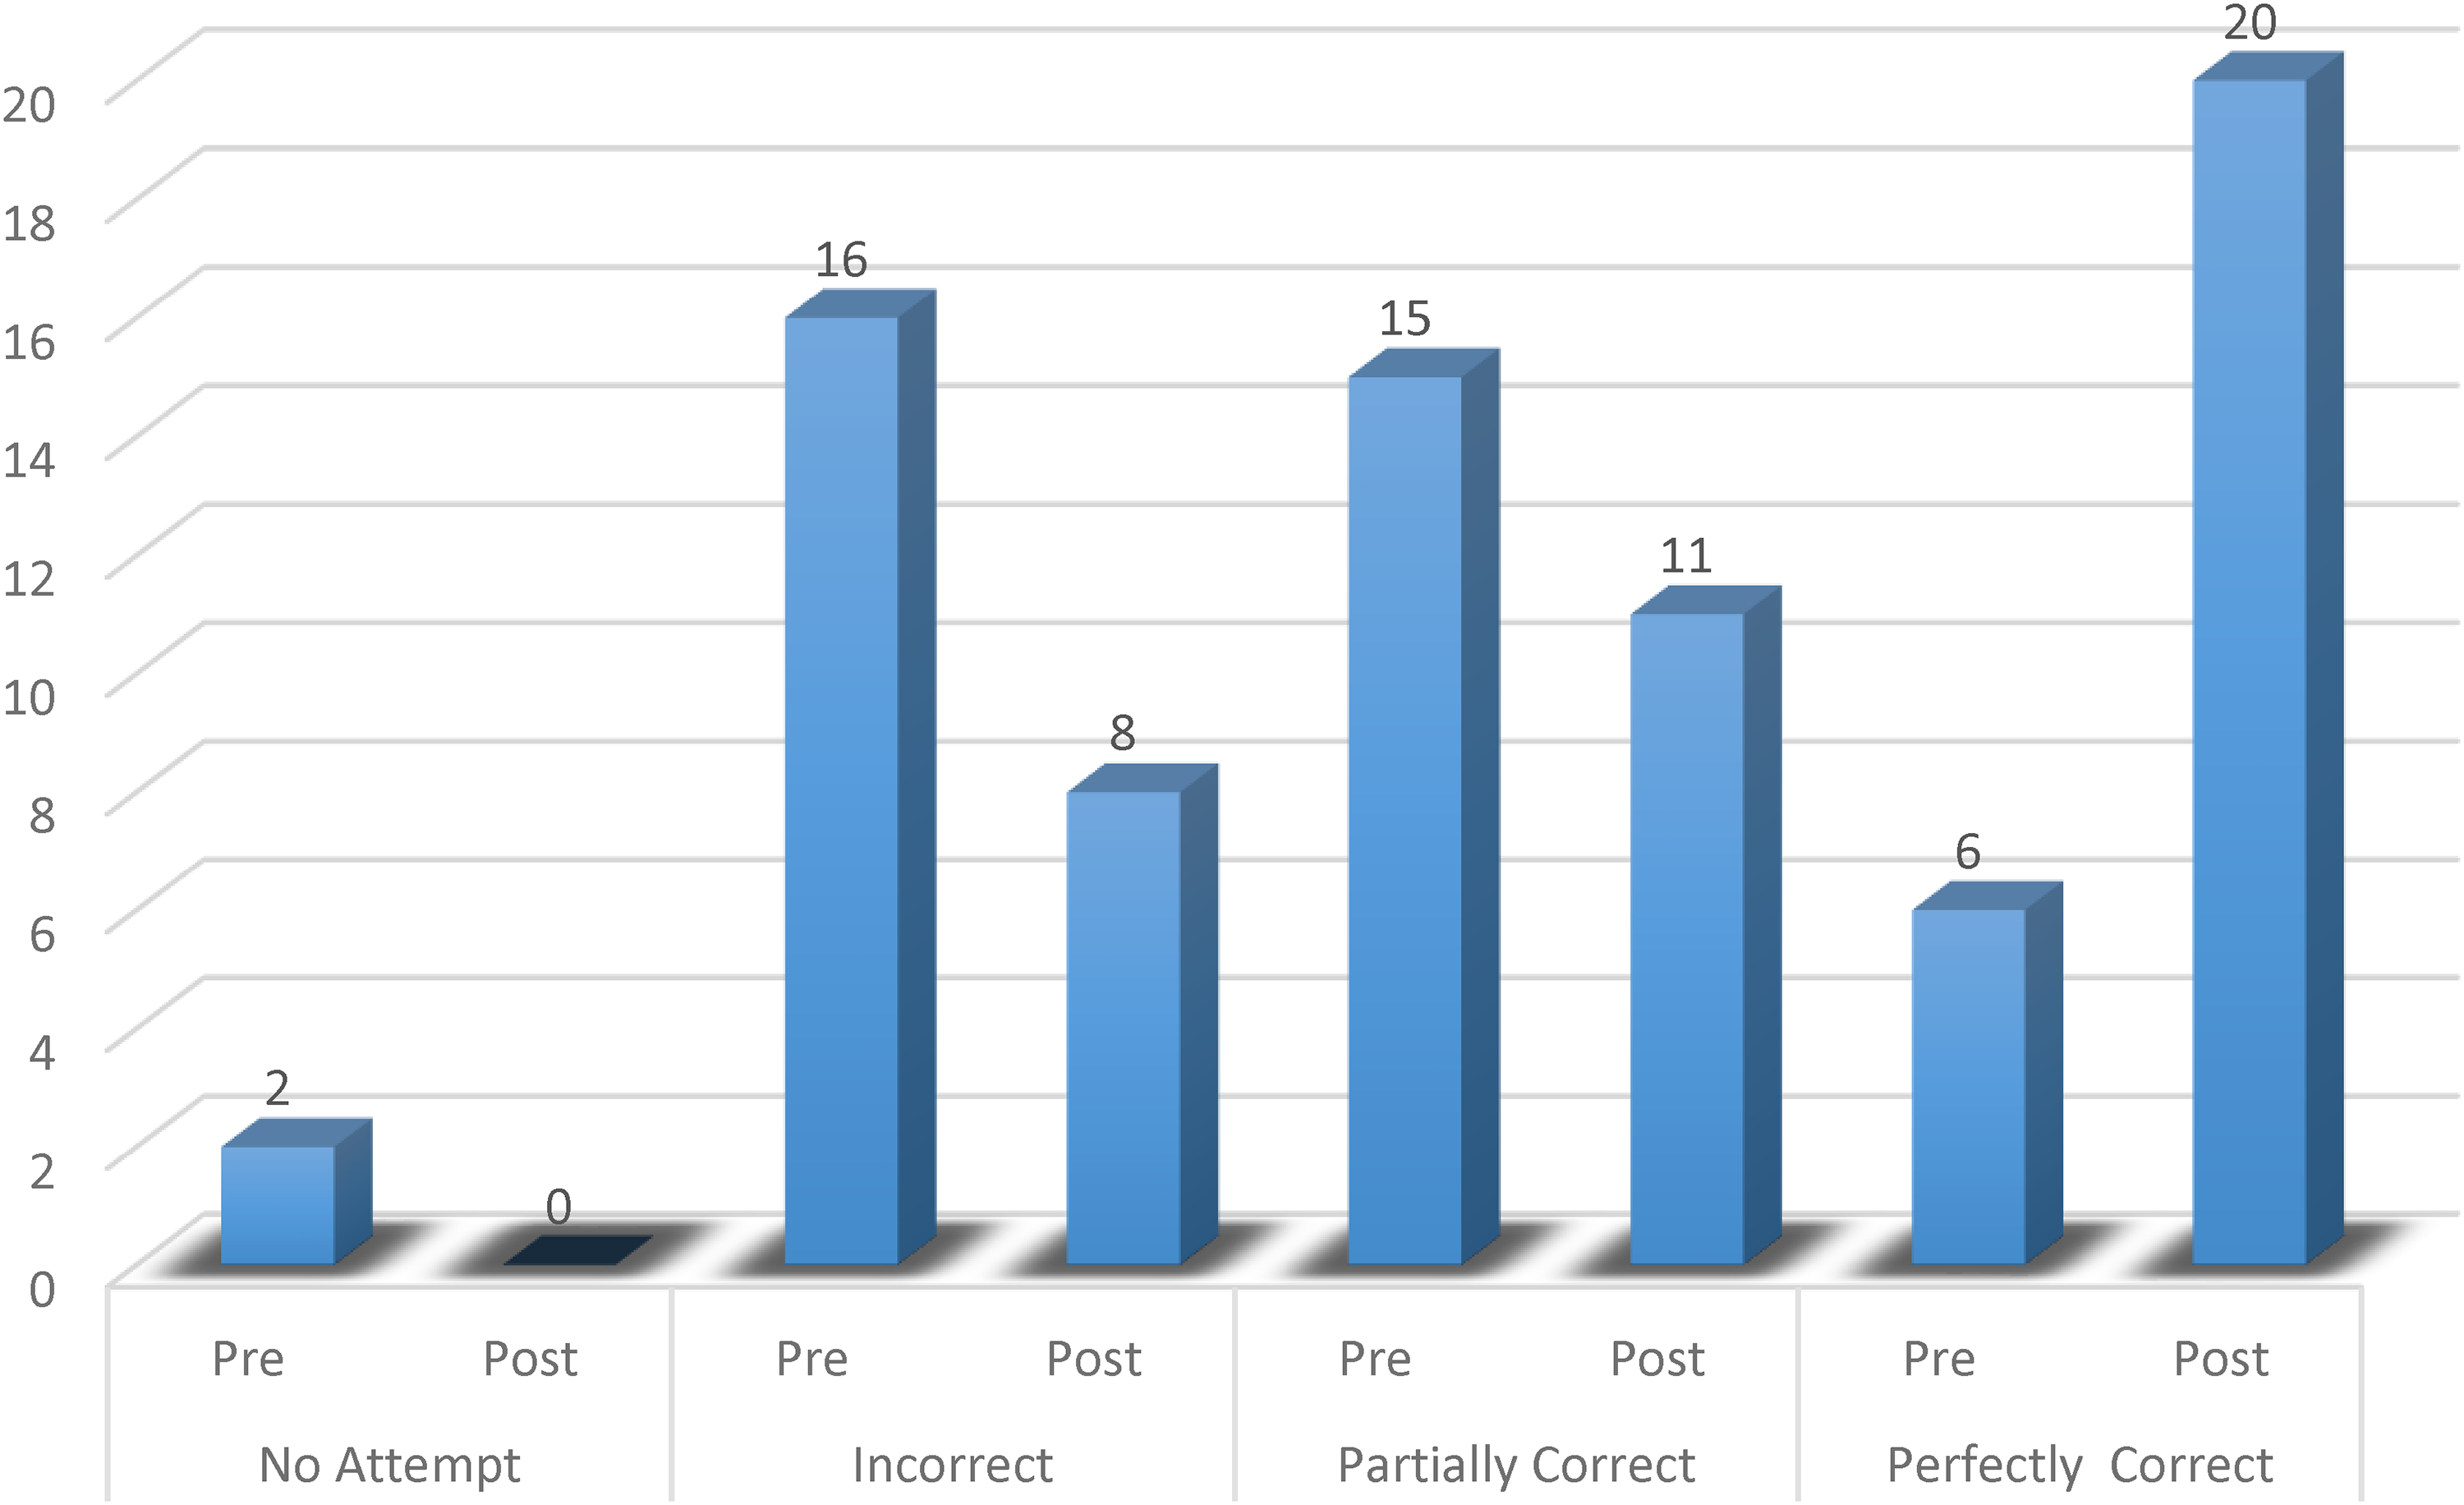
A compound bar graph comparing learners' responses to object–level questions in the pre– and post-test (n = 39).
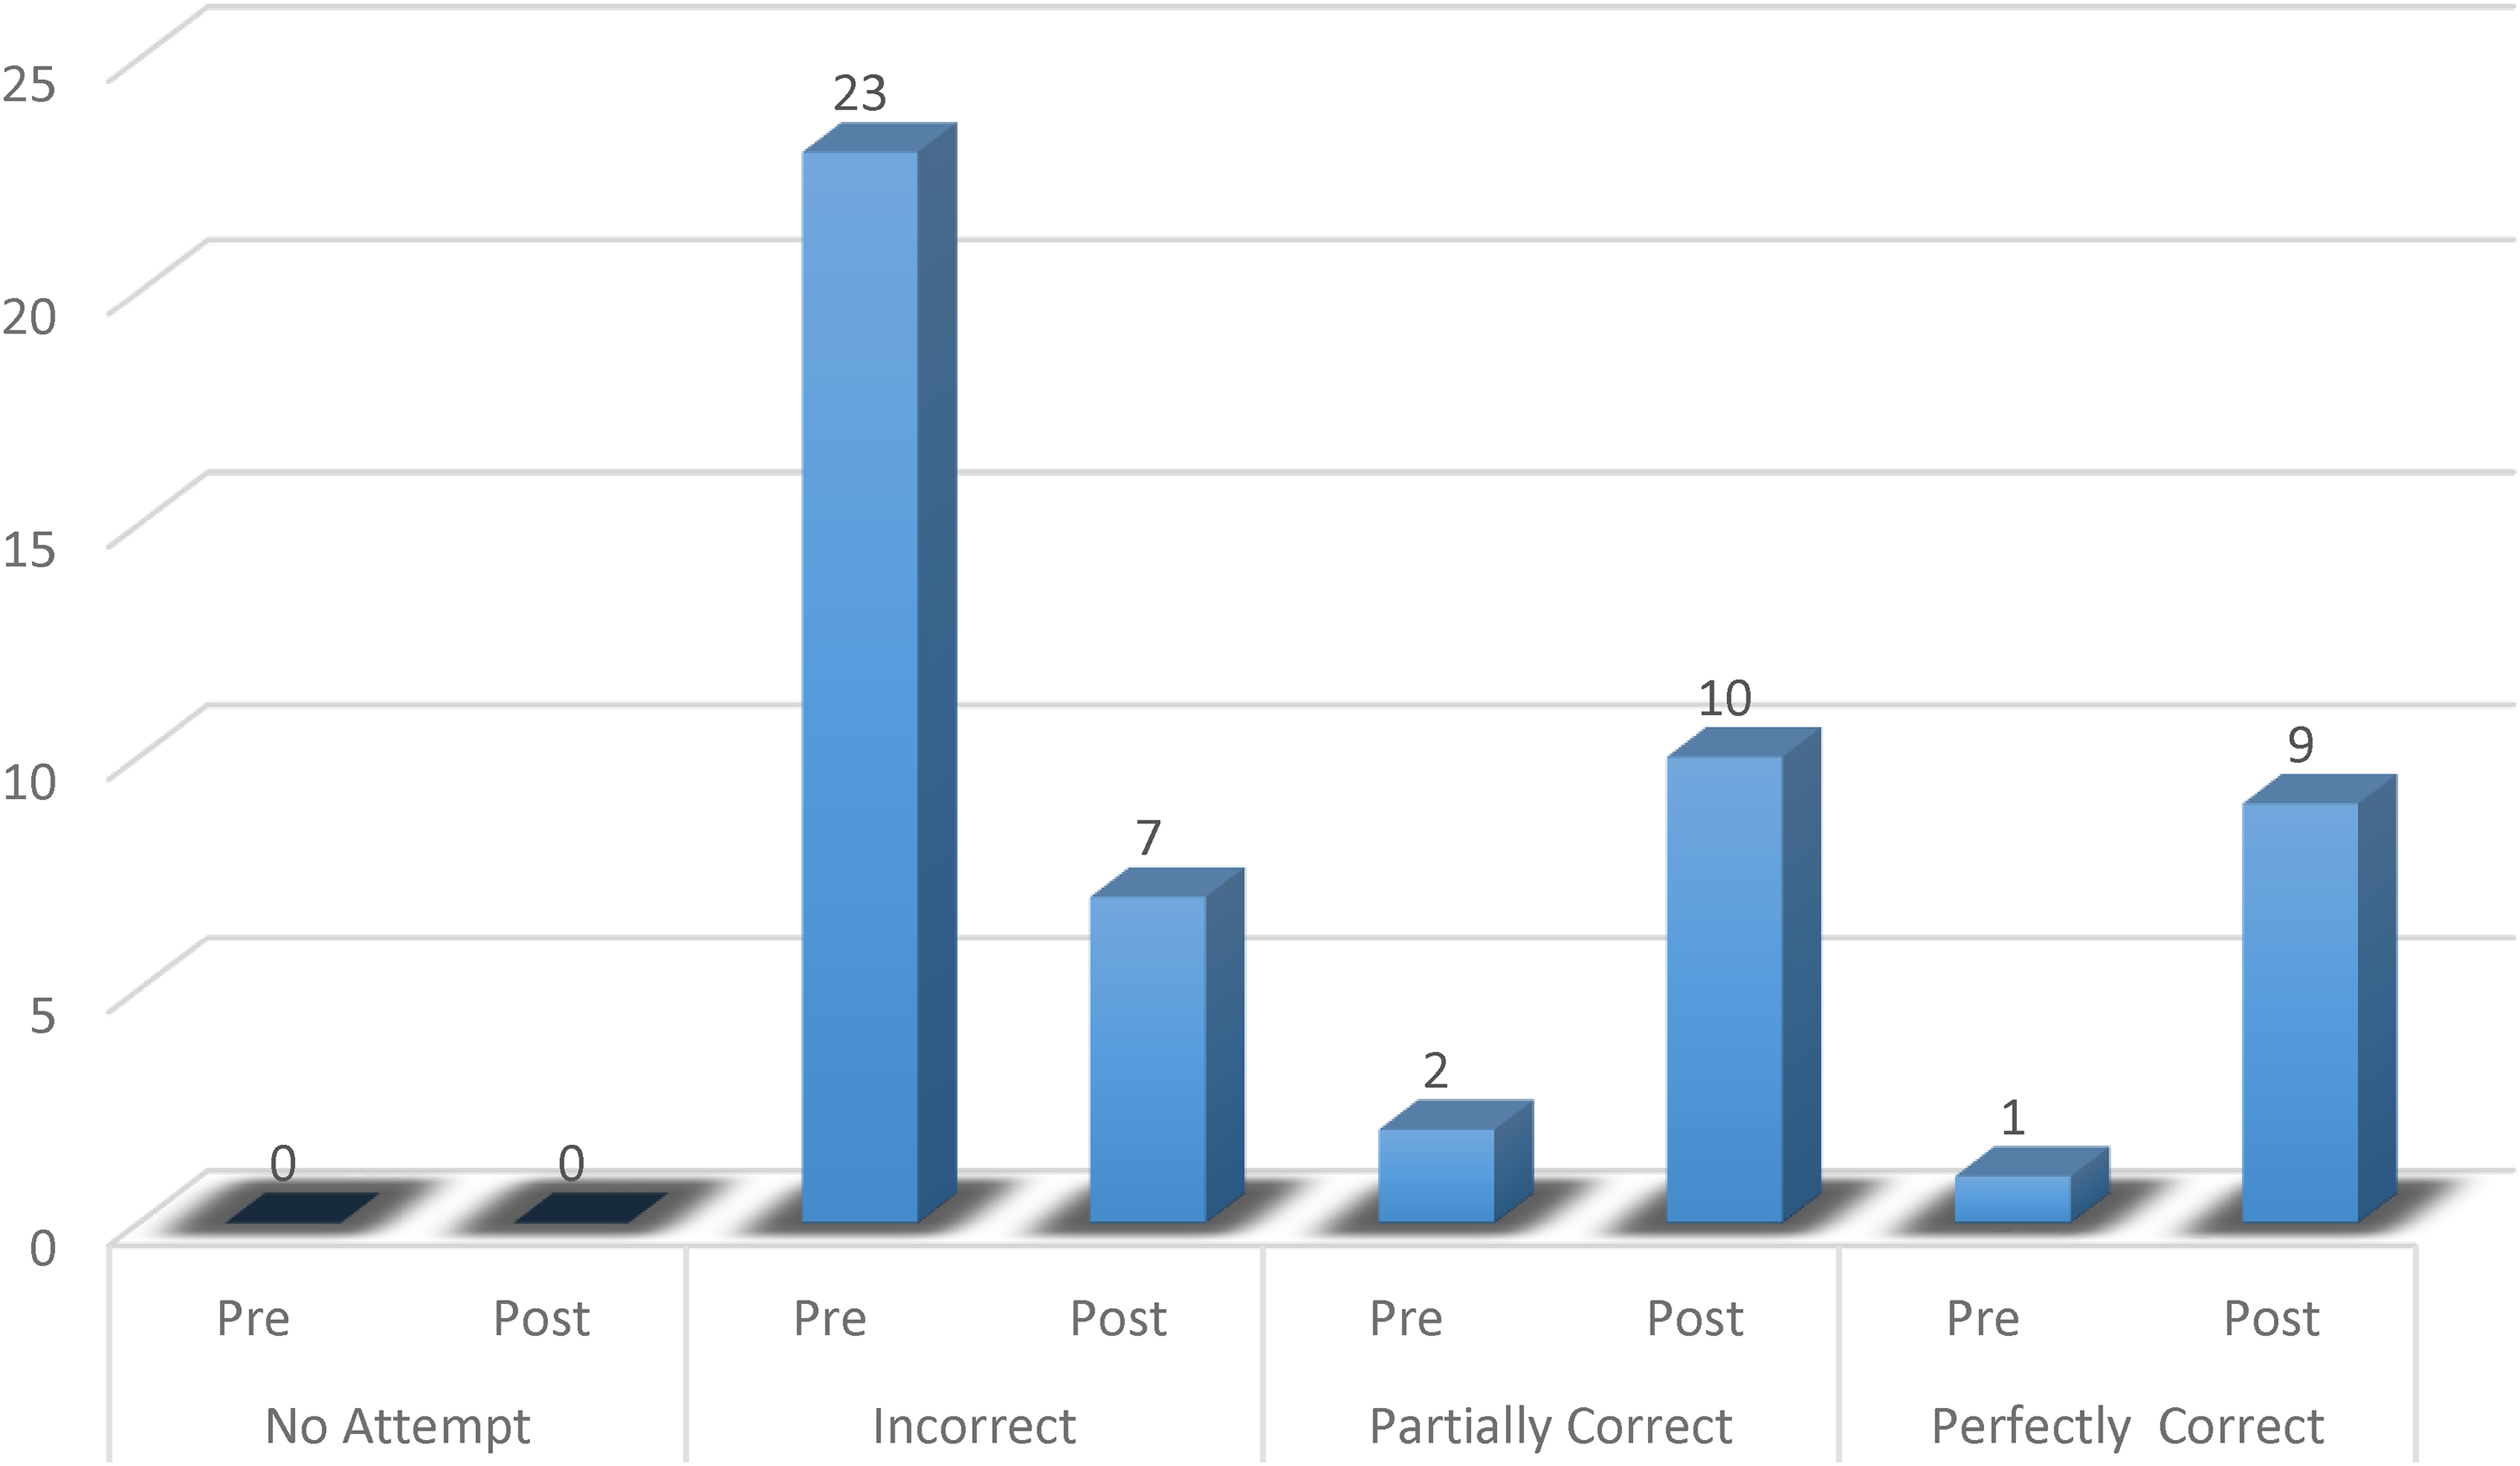
In the pretest, the Figure 5 clearly shows that most of the responses were either “incorrect” or “partially correct,” and some learners did not even attempt to answer the questions. When compared to the posttest, there is a significant drop in “No attempt” and “Incorrect” responses. On the other hand, there was an increase in “Partially correct” and “Perfectly correct” responses. This picture provided some evidence that the learners’ object-conception had improved. However, a relatively high percentage of “Partially correct” responses was also evidence that some learners’ object-conception was either weak or still developing. The general improvement in the quality of learners’ responses at this level was sufficient to suggest that learners had transitioned from a process to an object conception level. Further analysis is presented later in this article to elaborate on this assertion.
The final set of question items were under the schema-conception level. These comprised higher-order questions that required learners to connect all concepts learnt into a total entity, which they could apply to solve unfamiliar problem situations. More specifically, the learners were expected to demonstrate their ability to link the concepts of asymptote, domain, range, and axis of symmetry in the context of hyperbolic functions. Two question items were designed for the schema-conception level and a total of 26 responses were received from the pretest and from the posttest. Figure 6 illustrates a comparison of the number of responses under each response category in the pre- and posttest.
A compound bar graph showing learners’ responses under schema level questions in the pre- and posttest (n = 26).
There is evidence from the graph that the questions proved very difficult for the learners in the pretest. Those who attempted the questions presented mostly incorrect responses. Again, the picture changed in the posttest. The percentage of incorrect responses dropped considerably, adding on to the partially and perfectly correct responses. In the posttest, the responses suggest that that the learners were able to see the link between the critical points and this enabled learners to interpret and respond to the questions meaningfully. While these results did not necessarily imply that these learners had attained schema-conception level, they did reflect some growth in the learners’ understanding of concepts in a more connected and coherent way. The above comparative analysis of the learners’ written responses in the pre- and posttest generally showed that there was an improvement in the quality of the learners’ responses after the intervention lessons. The learners’ oral responses during the task-based interviews were further analyzed based on each of the question items. The oral responses provided deeper insights into the learners’ conception of the concepts in question. The analysis compared the learners’ oral responses before and after the intervention program, and the discussion attempts to bring out any observable indications of the mental processes of interiorization, encapsulation, and thematization.
4.2 Evidence of transition from action to process (Interiorization)
In the context of this study, interiorization would be evident if a learner was able to move away from mechanically calculating
Below is an extract from a transcribed conversation with Mmathapelo before the intervention program:
A similar observation was made regarding the concept of asymptote. In the pretest, learners had memorized that when given the standard equation:
After the intervention program, there was an improvement in the learners’ description of an asymptote. Gabriel provided a graphic example of an improved concept image of an asymptote, though he was still struggling to accommodate it. He explained that an algebraic expression is undefined when the denominator is zero, but he could not use the same argument to justify the horizontal asymptote. Gabriel still portrayed some conceptual gaps. His description of an asymptote as a ‘… a dotted line …’ may lead to misconceptions. The above extracts depict some conceptual growth as learners progressed from an action conception to a process conception, where they could explain the meaning behind the rules and procedures. During the intervention lessons, learners were afforded an opportunity to use Autograph to draw several hyperbolic graphs on the computer. They were then engaged in group and individual activities to identify critical features and relationships. Autograph becomes very useful in such activities because learners take less time in drawing graphs and spend more time on interpretation of graphs and discovery of patterns. The graphs are presented more accurately, unlike when learners draw them using freehand. Such activities facilitated the interiorization of the concepts such as intercept and asymptote.
4.3 Evidence of transition from process to object (Encapsulation)
Encapsulation condenses the processes into a cognitive object that one can change, manipulate, or transform (Chimhande et al., 2017; Maharaj, 2010). This study found that, after the intervention program, learners were better able to flexibly switch from algebraic to the graphical representation of the function or vice-versa. They were able to apply vertical and horizontal translations on the given function, which they struggled to do before the program.
To exemplify the above finding, Question Item 1.3 of the diagnostic test was developed to test the learners’ ability to sketch the graph of a hyperbolic function given its algebraic equation. They were expected to use the critical points of the function to come up with its graph. The equation of the function was given as:
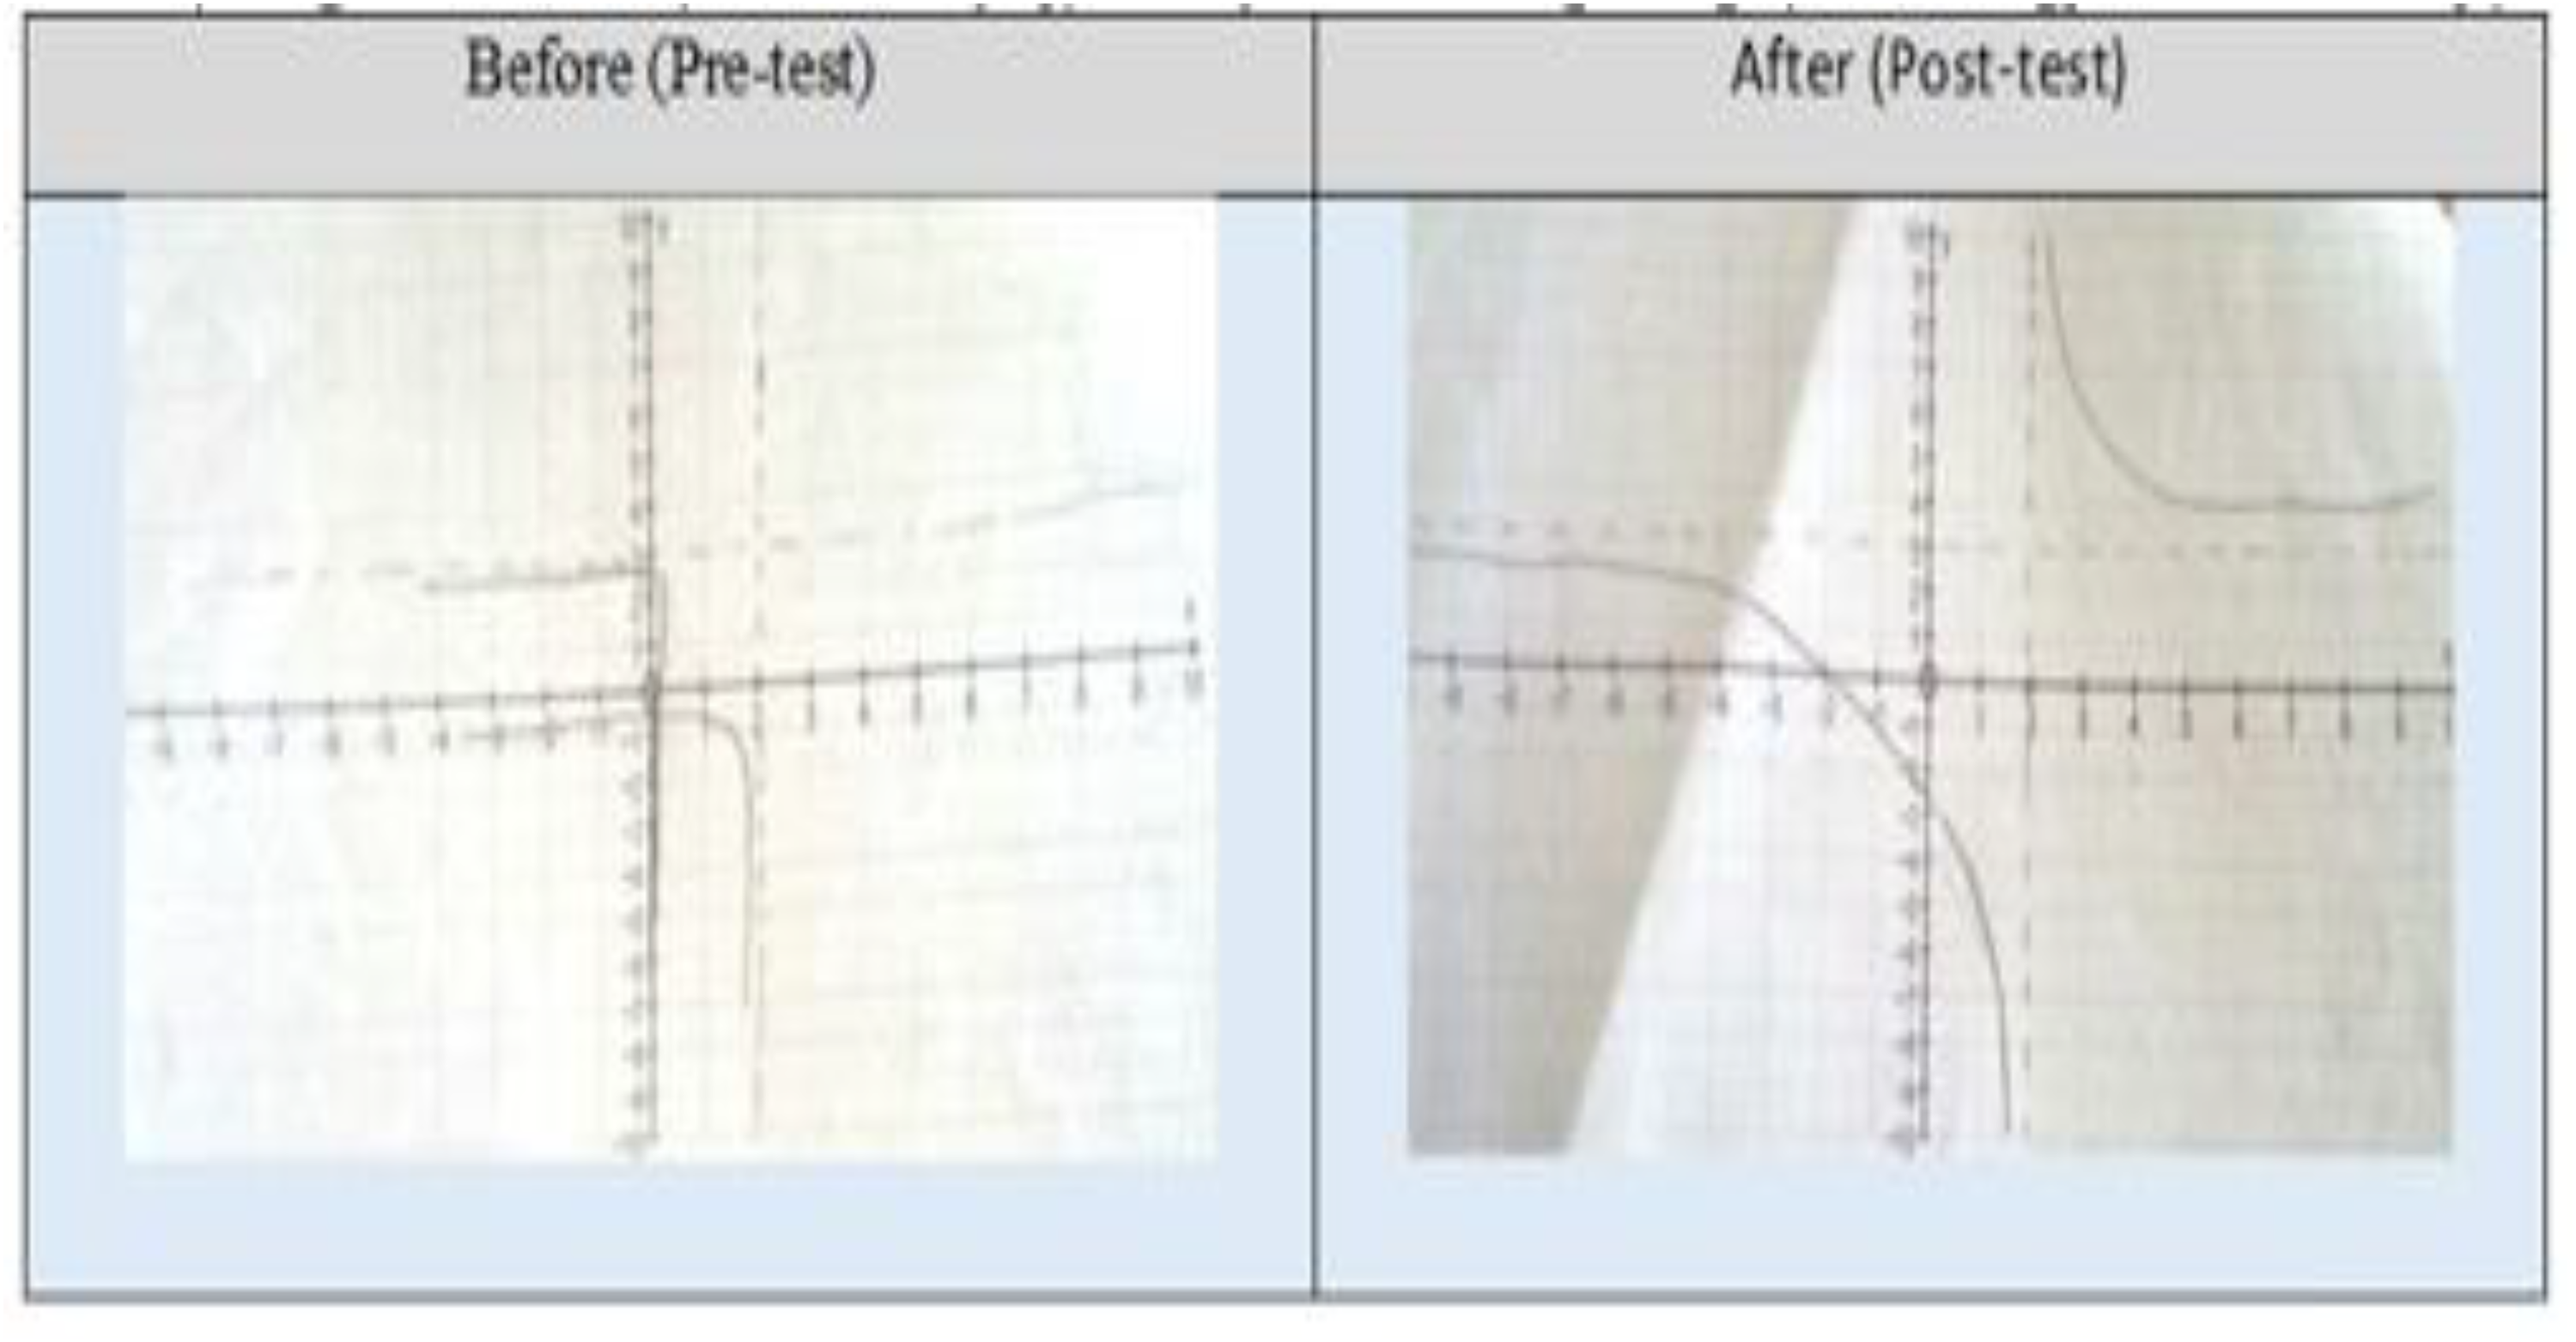
Comparison of Sekgobela's sketch graphs before and after the intervention lesson.
Sekgobela's sketch graph in the pretest portrayed a muddled understanding of the graphical representation of the hyperbola function. The graph had no connection between the critical points calculated and the graph itself. Though the vertical and horizontal asymptotes were correctly drawn, they were not correctly linked to the curves. This lack of coordination was evidence enough that the learner failed to view the algebraic equation and the graph as two different representations of the same function. In the posttest, the sketch had improved drastically, though it was not perfect. The curves were placed in the correct quadrants, and Sekgobela demonstrated a better understanding of the behavior of the graph as it approaches the asymptotes. This indicated a conceptual shift from a “process-orientated” conception, where critical points were calculated and viewed as isolated features of the function, to a more “object-oriented” conception, where the critical points were seen in totality, that is, as integrated parts of one object. This distinction is like Even's (1998) “pointwise” and “global” approaches to functions. Even (1998) explains that the pointwise approach is limited to plotting, reading and dealing with discrete points or values on a given graph. On the other hand, the global approach to a graph focuses on the behavior of the graph as a connected entity. The flexibility in switching from one representation of a function to another allows one to see rich relationships, broaden and deepen conceptual understanding and strengthen one's ability to solve problems (Even, 1998).
Another indicator of encapsulation was noted in the way learners dealt with transformations on functions. The curriculum document requires learners to deal with transformations such as
After the intervention, it was encouraging to note that most of the learners used the graphical approach. They were able to correctly interpret the meaning of
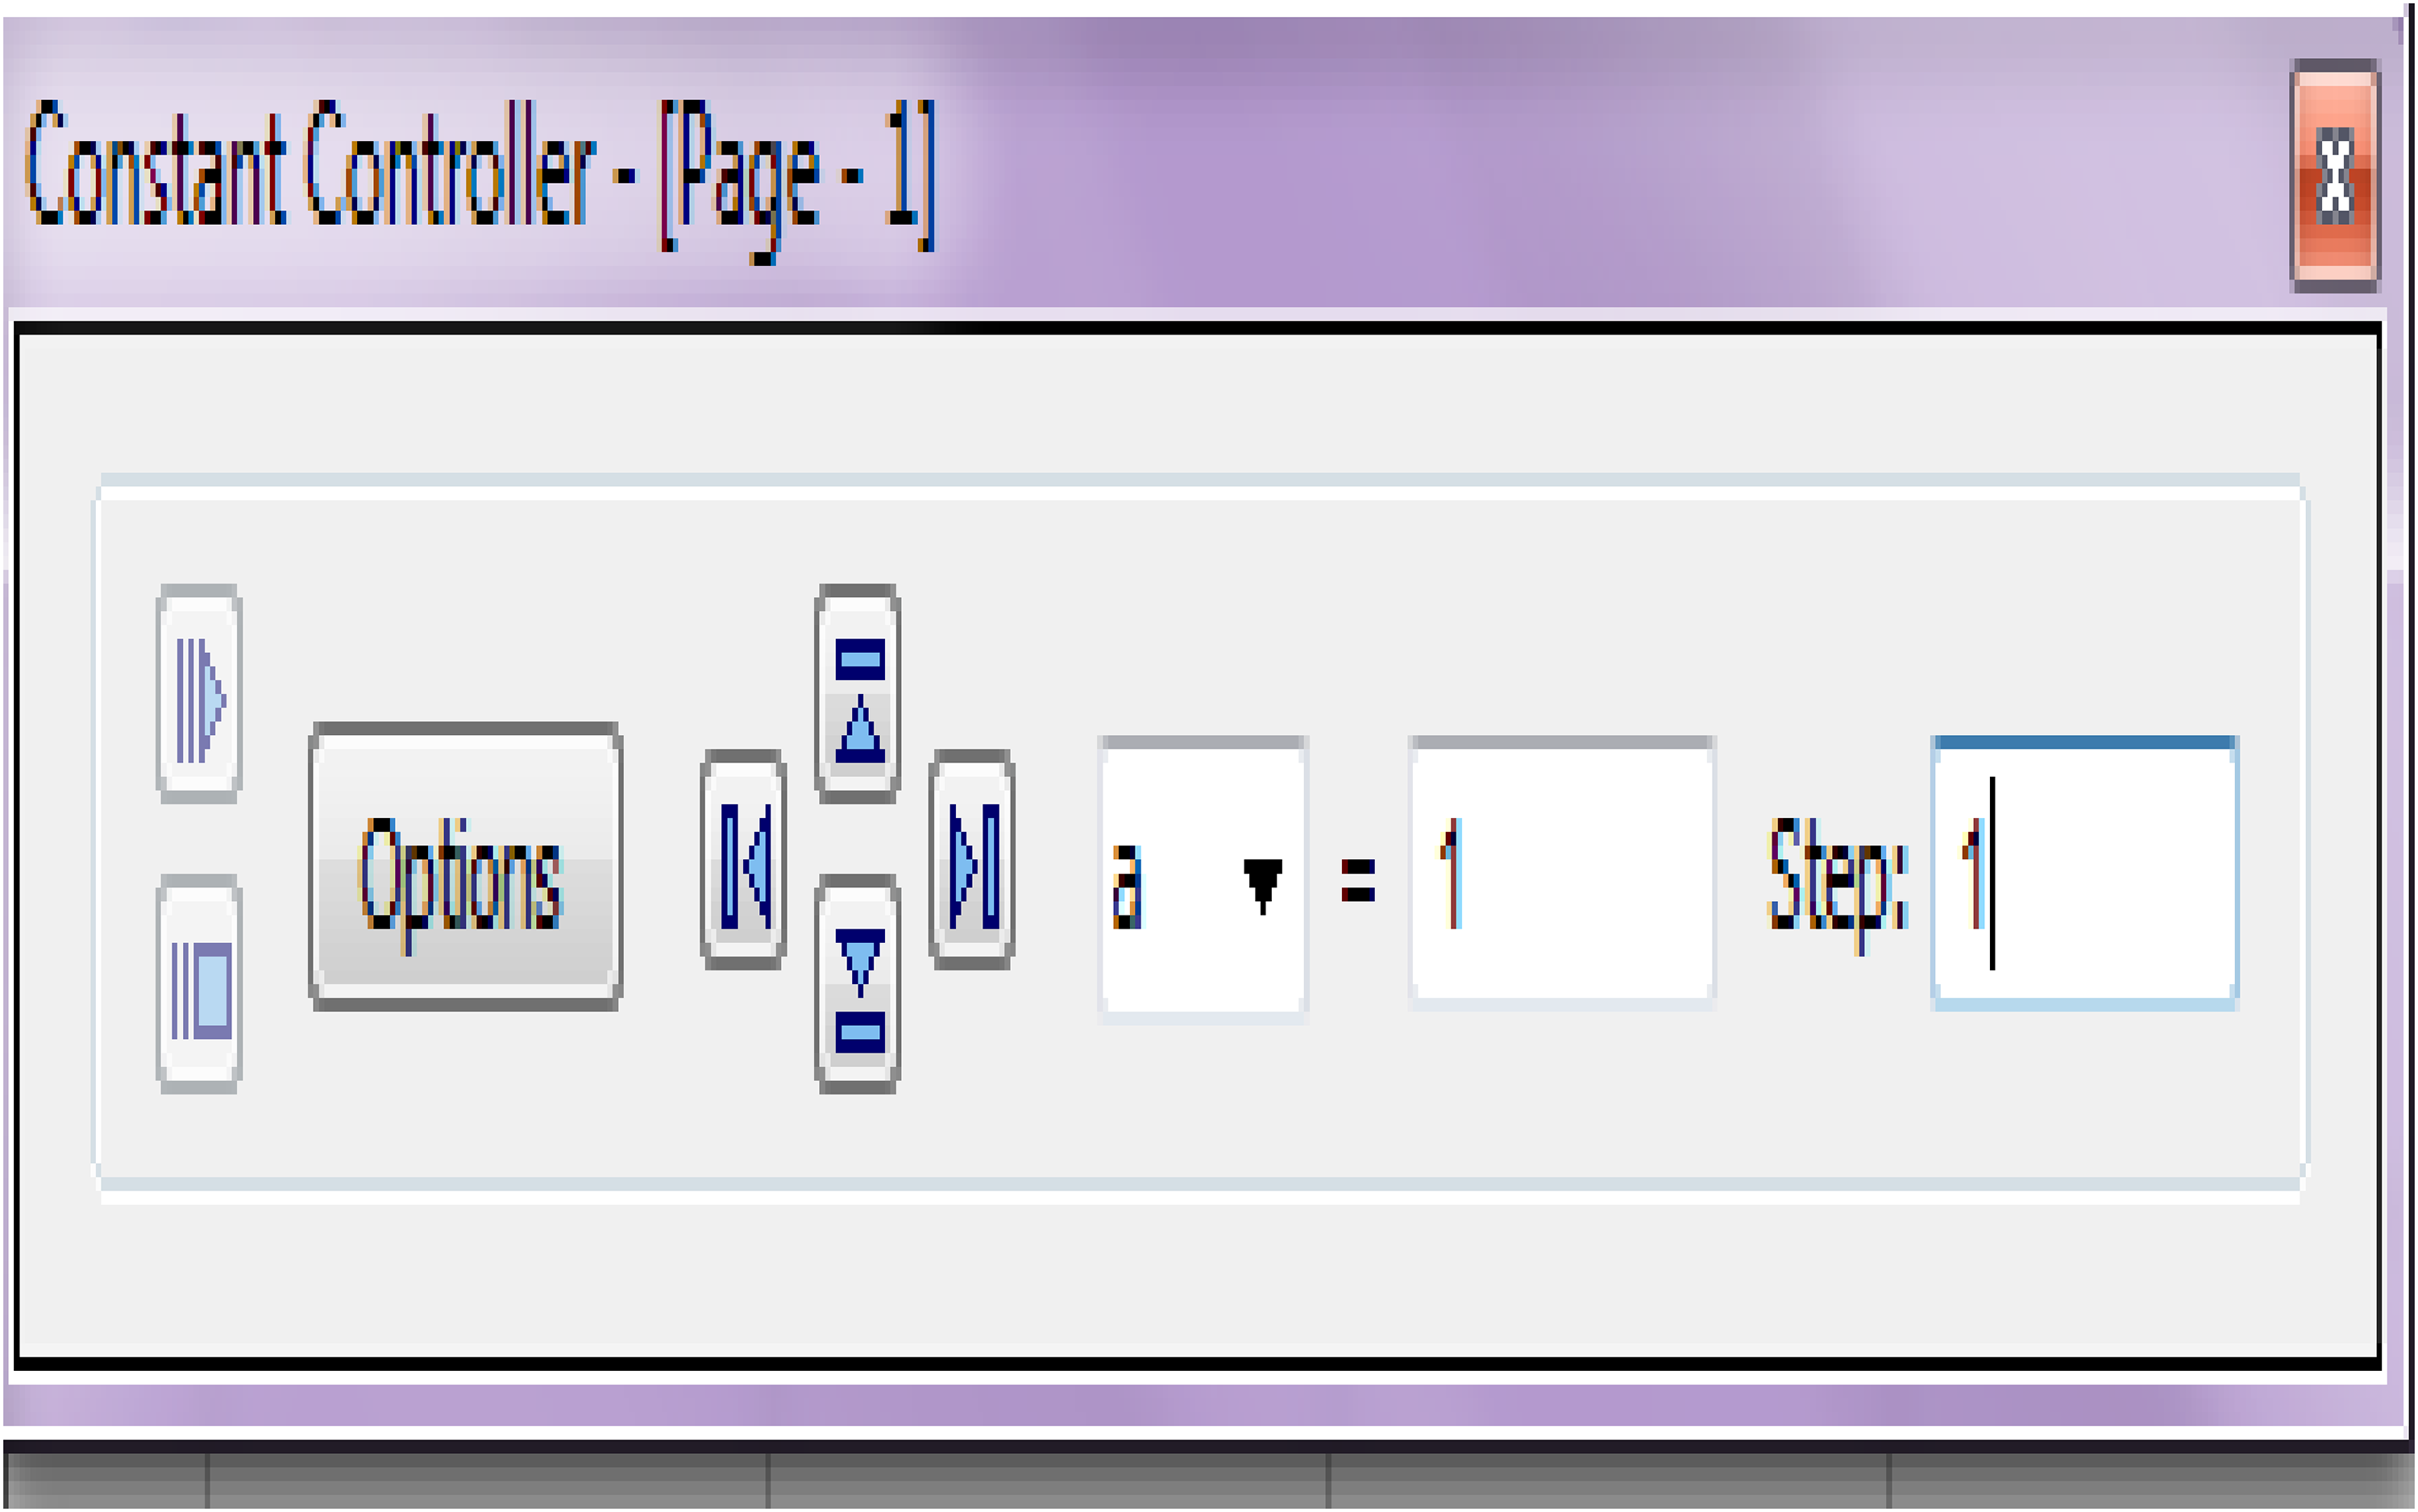
Autography display of constant and animation controller.
Such visual impact may be difficult and time-consuming to achieve when learners are investigating by drawing the graphs using free hand.
4.4 Evidence of transition from object to schema (Thematization)
The question to determine if learners had reached the schema level of conception was phrased as follows:
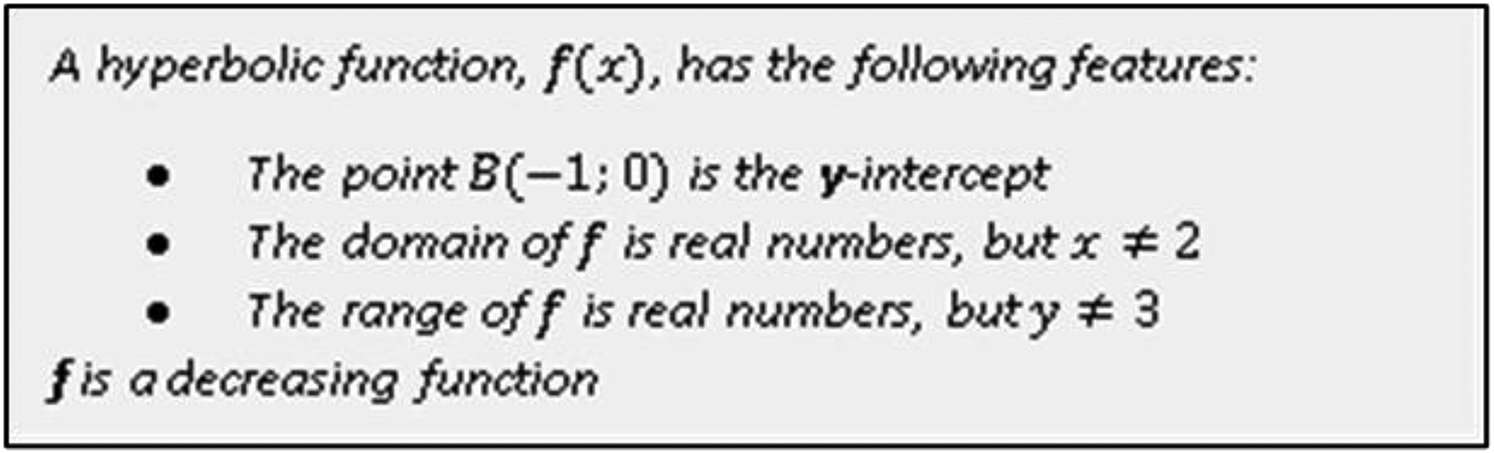
Analysis of the learners’ written responses in the pretest exposed shortcomings in their ability to link concepts like asymptote, domain, range, and intercept. Nearly all the learners failed to connect the asymptotes to the given domain and range. Only three of them tried to identify the asymptotes from the domain and range, but their substitution was flawed and marred with several executive errors. When asked to explain their approach to this question during task-based interviews, common responses were:
After the intervention, the learners were presented with a similar question, but phrased as below:
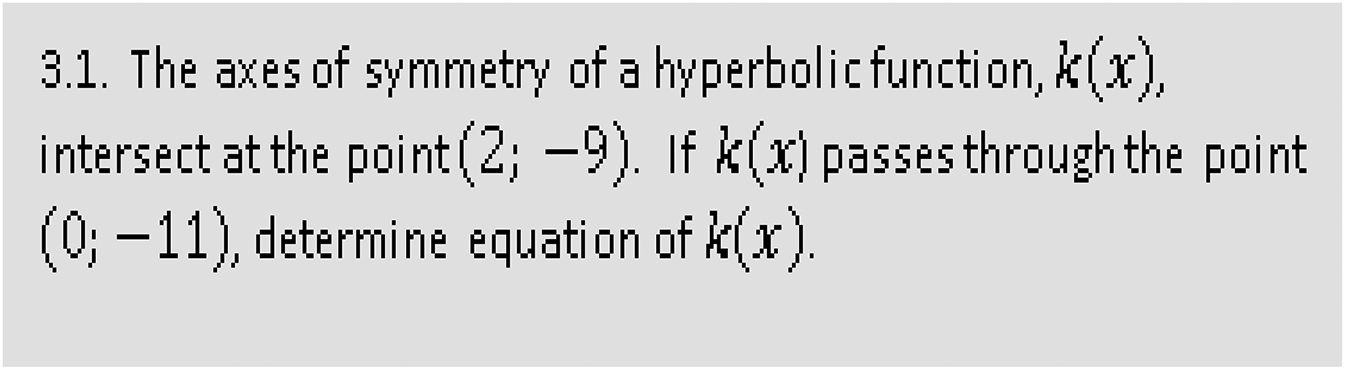
The quality of responses showed a remarkable improvement, but with little evidence of them having thematized the hyperbolic function schema. Only three learners displayed clear evidence of thematization of the concepts. Not only did these learners present perfectly correct written responses in the posttest, their oral responses during the task-based interviews demonstrated that they had crystallized the concepts into a malleable concept image. For example, Gabriel went a step further to make a rough sketch diagram to illustrate his explanation. Figure 9 shows the sketch diagram that Gabriel produced.
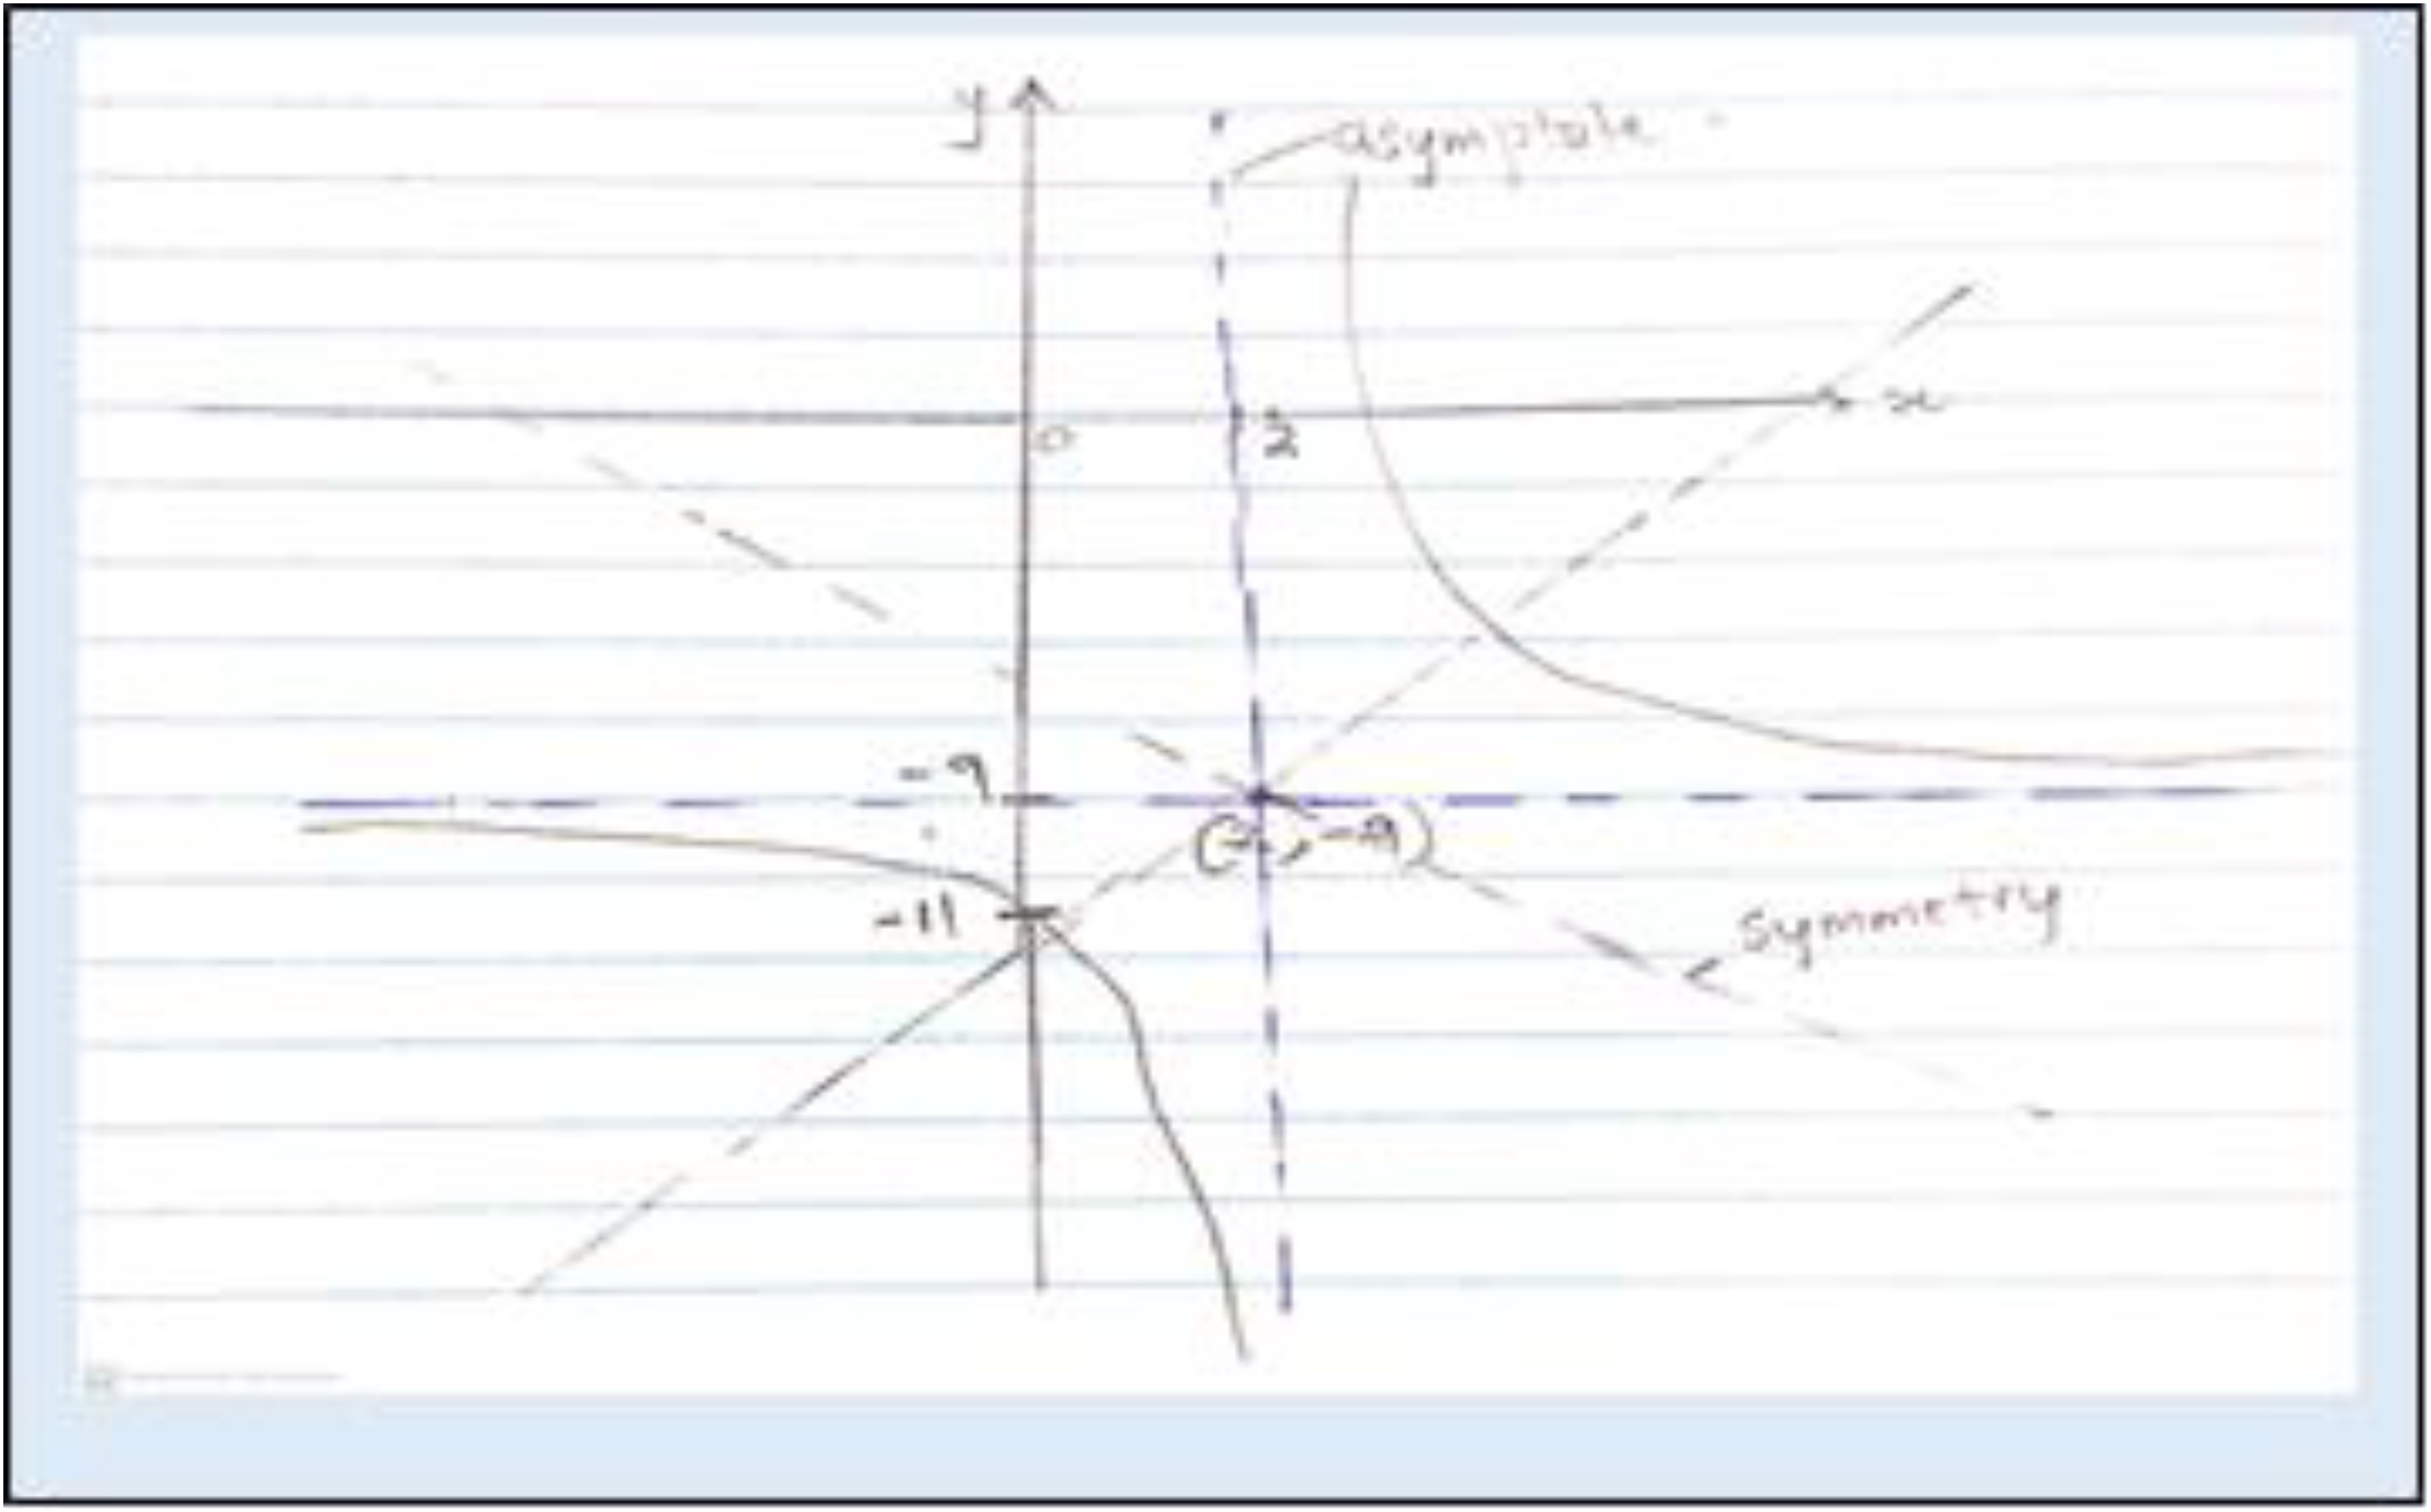
Gabriel's rough sketch in response to question item 3.1.
What was most encouraging was that most of the learners attempted to link the graphical properties of a hyperbolic function and used them in totality to solve the problem. Given the point of intersection of the axes of symmetry, they were able to connect this to the vertical and the horizontal asymptotes. This evoked their graphical schema to visually imagine how the given features are connected. Gabriel, in the above example, drew a graphical illustration of the problem scenario and constantly switched between the algebraic and graphical representations of the function as he grappled to solve the problem. Drawing on Piaget and Garcia (1989), it was concluded that the representational affordance of Autograph facilitated the mental construction and reconstruction of a hyperbolic schema. The ability to display a coherent and complete coordination of the given properties of a function brings out the capacity for logical thought, reflection, explanation, and justification. Kilpatrick et al. (2002) identified this mathematical proficiency as adaptive reasoning, which is very essential in solving unfamiliar problem situations.
5. Conclusion and recommendations
This study used the APOS theoretical lens to explore the impact of using Autograph technology as a pedagogical tool in the teaching of hyperbolic functions to Grade 11 learners. What stood out quite prominently from the study was that Autograph provided a new learning experience, which was enriching, exciting, and motivating for the learners. The technology provided a quick, clear, and easy graphical representation of multiple hyperbolic functions. This afforded learners an opportunity to collaboratively engage in discussions that enhanced their ability to connect functions to their graphs. Before the introduction of Autograph, most of the learners were evidently stuck at the action-conception level of hyperbolic functions. They mechanically followed procedures with no understanding of the meaning behind the calculations. In APOS terms, this means their understanding of hyperbolic functions was restricted to the symbolic or algebraic representations. The study provided compelling evidence that the use of the graphical software had deepened and broadened the learners’ understanding of concepts such as asymptote, intercept, and axis of symmetry. Learners demonstrated during task-based interviews that they had interiorized procedural actions by explaining the processes involved. This was made possible by engaging learners in a series of collaborative and task-oriented learning activities involving the drawing of graphs, aided by Autograph, identifying, and comparing their critical features. It was evident from the findings of this study that these activities enabled learners to develop mental prototypes of features such as intercepts, asymptotes, and axis of symmetry. The use of Autograph technology enabled learners to view a hyperbolic graph as an object in totality, which could be manipulated or transformed. This was evidenced by the learners’ ability to flexibly switch from algebraic to graphical representation or vice-versa. Schema, in APOS terms, is the highest level of understanding a concept and is connected to other existing schemas. The process by which a concept matures into a schema in the learner's mind is complex and not easy to explain. Learners acquire and develop different levels of conception in unique stages, and the process of thematizing these conceptions results in different schemas of the same concept. What was established from this study was that learners who managed to thematize the hyperbolic function into some forms of schema were able to connect, coordinate, synthesize the critical features of a hyperbola, and use them in totality to tackle higher order problem situations.
This study was highly contextualized and involved a small sample, hence the generalizability of its findings to other contexts is limited. The focus of the study was not on generalizing the findings, but on in-depth understanding of how learning could be enhanced through integration of Autograph technology. Despite this limitation, the study provides valuable insights to the mathematics education community. The study recommends that Autograph software should be made available to mathematics teachers, particularly in marginalized schools in South Africa, for use in their teaching. Some rural high schools in South Africa have desktop computers that are either lying idle or just locked up in strong rooms. The DBE, through the provincial and district mathematics subject advisors, can facilitate the installation of Autograph software on these computers. It is further recommended that the Department of Education should intensify its teacher development initiatives, by rolling out district workshops aimed at improving teachers’ technical and pedagogical skills in using mathematical applications such as Autograph. This study has shown that the use of mathematical graphical software requires teachers who are capable of designing didactical activities that can develop learners’ visual and connectional fluency. Proper use of mathematical software, such as Autograph, should aim to promote understanding of concepts and development of correct schemas, and should not be limited to representing information, like projecting notes or diagrams on the whiteboard. Mathematics teachers are urged not to use digital tools to reinforce their antiquated instructional methodologies, which are not yielding the intended outcomes. While ICT resources in marginalized schools may be limited, the little technological resources available should be taken out of the strong rooms and be utilized to enrich pedagogical contexts.
Supplemental Material
sj-docx-1-mea-10.1177_27527263251375522 - Supplemental material for Deepening Learners' Conceptualization of Functions Using Autograph Technology: An APOS Theory Perspective
Supplemental material, sj-docx-1-mea-10.1177_27527263251375522 for Deepening Learners' Conceptualization of Functions Using Autograph Technology: An APOS Theory Perspective by Fanuel Matindike in Asian Journal for Mathematics Education
Footnotes
Acknowledgements
The author wishes to thank all the learner participants, their parents and/or guardians, the School Governing Body, the Limpopo Department of Education, and all other collaborators for making it possible to undertake this research study. I thank the team of Mathematics subject advisors in the Limpopo Department of Education for their technical and professional assistance throughout the study.
Ethical Considerations
Permission to undertake the study in the province was officially sought and a written permission was granted from the Limpopo Department of Education. This was done through the school, circuit, district, and provincial education offices. Permission was officially sought from the School Governing Board to use school facilities and resources for purposes of the study. Since the participants were minors, informed consent was sought from their parents and guardians which was granted in writing. Strict confidentiality and anonymity were exercised by removing any identifying features from the collected data. Pseudonyms were used throughout analysis and reporting of collected data.
Consent to Participate
Consent to participate in this study was sought and granted in written form from all the parents/guardians of the learners who participated in this study.
Consent for Publication
Informed consent for publication was provided by the parents of the participating learners, the School Governing Body and the Limpopo Department of Education.
Informed Consent
Permission to undertake the study in the province was officially sought and a written permission was granted from the Limpopo Department of Education. Consent to participate in this study was sought and granted in written form from all the parents/guardians of the learners who participated in this study.
Funding
The author received no financial support for the research, authorship, and/or publication of this article.
Declaration of Conflicting Interests
The author declared no potential conflicts of interest with respect to the research, authorship, and/or publication of this article.
Availability of Data and Materials
The datasets used and/or analyzed during the current study are available from the author on reasonable request.
Supplemental Material
Supplemental material for this article is available online.
Author biography
References
Supplementary Material
Please find the following supplemental material available below.
For Open Access articles published under a Creative Commons License, all supplemental material carries the same license as the article it is associated with.
For non-Open Access articles published, all supplemental material carries a non-exclusive license, and permission requests for re-use of supplemental material or any part of supplemental material shall be sent directly to the copyright owner as specified in the copyright notice associated with the article.