
Abstract
This study expands the work that has been done in Germany developing the theory of grundvorstellungen, or basic mental models, and applying them to the definite integral. Using an existing survey instrument, we administer questions related to the basic mental models of the definite integral to 342 university students in India and Sri Lanka. By conducting a quantitative analysis of the data, we are able to determine whether students are more inclined to view the integral in terms of an area, an average value, an accumulation, or the construction/reconstruction of a quantity under different scenarios. Compared with earlier studies, we find a smaller gap between the preference for the area model and the other three described, indicating a greater propensity for students in India and Sri Lanka to interpret the definite integral in a variety of ways. We then interpret the results in terms of the teaching that the students receive and the differences in the curriculum.
Introduction
There is a large body of work looking at student perceptions of the main concepts described in an introductory calculus class, namely limits, derivatives, and integrals. In this article, we look at definite integrals and extend the work predominantly done in Germany using established basic mental models to analyze the results of a survey instrument given to students in India and Sri Lanka. This allows comparisons to be made with previous studies and the results explained by considering the teaching methods and curriculum design in the different countries.
Greefrath et al. (2016) define a basic mental model, or grundvorstellung, of a mathematical concept as a “conceptual interpretation that gives it meaning” (p. x). While they have been used to explain student understanding of mathematical constructs for over 200 years in the German academic literature, basic mental models have gained traction more recently as a theoretical framework for distinguishing between student understanding of the theoretical and procedural aspects of a mathematical process such as differentiation or integration, and their understanding of what the procedure represents in a meaningful way. However, to this point, basic mental models have rarely been used to consider the perceptions of students in other countries.
In this study, we consider how the four basic mental models of area, average value, accumulation, and construction/reconstruction coincide with the understanding of students when applied to eight common scenarios that require a definite integral to be used to determine the correct answer. While students are generally comfortable with the procedural aspects of calculating integrals using the antiderivative, several studies (Jones, 2013; Orton, 1983; Serhan, 2015) have revealed a much more limited comprehension when connecting the symbolic manipulation required to the underlying concepts. Given that calculus plays such an important role in mathematics education at the higher secondary and tertiary level in India and Sri Lanka, it is important to look beyond calculational proficiency and consider how students conceptualize fundamental concepts such as the definite integral to guide future improvements to the curriculum and the training that teachers receive.
Literature review
The theory and discussion of grundvorstellungen, or basic mental models, has been developed almost exclusively in the German literature. Originally applied to mathematics by Vom Hofe (1992), it speaks to a wider issue of students translating the theory in ways that give them a better understanding of the underlying practical applications. This study, with its focus on student perceptions in India and Sri Lanka, attempts to bring the didactic theory developed by Greefrath et al. (2016, 2021a, 2021b, 2023) and others in Germany to a wider audience, as well as demonstrating the commonalities and differences between student perceptions in the newly considered countries with regard to the fundamental concepts in calculus.
A lot of work has already been done looking at student perceptions of the definite integral through the lens of the four basic mental models created by Greefrath et al. (2016), those being area, average value, accumulation, and construction/reconstruction. Kontorovich and Li (2023) examined in detail how students leverage the concept of area to find the value of definite integrals where the integral functions are represented graphically and change from being positive to negative between the limits of integration. They found that although it is common for students to associate definite integrals as representing an area, they still struggle to calculate their value when presented with a problem that requires geometric reasoning. Kouropatov and Dreyfus (2013) favor the accumulation grundvorstellung of the definite integral, contending that it emphasizes the connection with the concept of derivative, while Thompson and Silverman (2008) state that by emphasizing how definite integrals represent an accumulation, it pays off when considering other aspects of calculus such as rates of change and functions of multiple variables. Nilsen (2020) uses a semiotic approach to determine how student interpretations of the symbolism used to denote definite integrals affects their perceptions of integration in general. He surmises that “the neglect of integrals as an accumulation function enforces the suspicion that the potential of Riemann sums is not sufficiently utilized in teaching” (p. 256). Jones and Ely (2023) provide a comprehensive catalogue of the work that has been done in looking at how quantitatively based teaching approaches to integration often involve accumulation, either by adding up values of a target quantity according to a given partition (in a manner similar to the accumulation models described in the scenarios given in Appendix) or by adding the variations of a rate function.
With respect to the regional aspect of this paper, the role of mathematics education in India has been somewhat marginalized, partly because, as noted by Ramanujam (2012), “the idea of research providing solutions to curricular conundrums or pedagogic trauma remains outside the framework of decision making in education” (p. 9). However, in his introduction to the 10th Mathematics Education and Society (MES10) conference held in Hyderabad, Subramanian (2019) wrote that “If India really cares to realize its slogan of ‘mathematics for all’ it would be obvious that it must invest in mathematics education research” (p. 17).
Although there have been no large-scale empirical studies of learning outcomes, it should be noted that some research has been done looking at the teaching and learning of calculus in India. Alam (2020) conducted an extensive study of calculus teaching, collecting data from 142 experienced teachers at the secondary and postsecondary level. He found that while more Indian students are now taking calculus and taking it earlier in their education—often in secondary school—they would be better served gaining a firmer foundation of algebra, geometry, and functions, rather than rushing into what he described as “half-baked calculus being served to relatively under-prepared students” (p. 433). Alam also suggested that there is a dire need for an extensive modification to the calculus curriculum and that teaching methods have to adapt from those of the twentieth century to incorporate technological advances and the way in which today's students study. He proposed that “A large scale government funded project needs to be initiated to move calculus in a direction that is more conceptual, applications-oriented, and technology intensive” (p. 427). This complaint about the overemphasis on rote memorization and lack of application to the material is widespread throughout the Indian research literature in mathematics education. Kumar et al. (2012) stated that this is “a reflection of teachers’ own education which valued only rote memorization of procedures on the one hand and lacked opportunities to re-learn mathematics in a meaningful way during professional education and during the course of their career on the other hand” (p. 166). This comes in spite of the fact that almost a decade earlier the National Curriculum Framework (NCERT, 2005) specifically targeted these issues with regard to mathematics and teacher training.
It is a similar story when we look at research in mathematics education in Sri Lanka, with few faculty working in the discipline, an absence of journals that promote national discourse, and only the occasional conference (the biennial International Conference on Mathematics and Mathematics Education, organized since 2019 by the University of Peradeniya, being a noteworthy exception). Over 20 years ago, Sri Lanka's National Education Commission (NEC, 2003) identified problems in mathematics education and proposed ways to address them. As in India, they centered on a lack of qualified teachers, a scarcity of textbooks and other resources, and orienting the curriculum in a way that makes mathematics more appealing and students more employable. However, a subsequent report by Aturupane et al. (2011) found that although some progress has been made, many of the same problems still existed, with significant regional disparities. They noted that “high quality mathematics education will ensure that students develop the skills that are essential … in everyday life and the workplace” (p. 9).
Related to the current study, only a very small number of articles have looked at student perceptions of calculus-related concepts in Sri Lanka. The most recent, by Rathnayake and Jayakody (2023), describes how the national curriculum (NIE, 2017) advocates that teachers provide only an intuitive idea of the concept of limit using tables and graphs before directly evaluating them using the “limit laws.” They found that when interviewing teachers there is a “danger in borrowing words randomly from colloquial language to explain terms in the mathematical register” (p. 262) and that as a result the curriculum should be modified to present teachers with a predetermined set of examples to avoid and correct common errors and misconceptions.
The research described above inspired us to use the German concept of grundvorstellungen to investigate the way in which students in India and Sri Lanka perceive the definite integral. By translating an existing test instrument from German to English, we are to do this in a manner that allows us to make direct comparisons with previous studies. Given that student perceptions are a reflection of what is taught in the classroom, the results also yield insight into the way that the topic is described by teachers, allowing us to make suggestions with regard to the training that they receive.
Theoretical frameworks
From a broad perspective, this study is based on the epistemological triangle relating concept, notation, and context first developed by Steinbring (1989—see Figure 1). In this instance, the concept that is being studied is the definite integral, which is placed into various contexts using the four chosen grundvorstellungen. The typical notation to denote the definite integral is
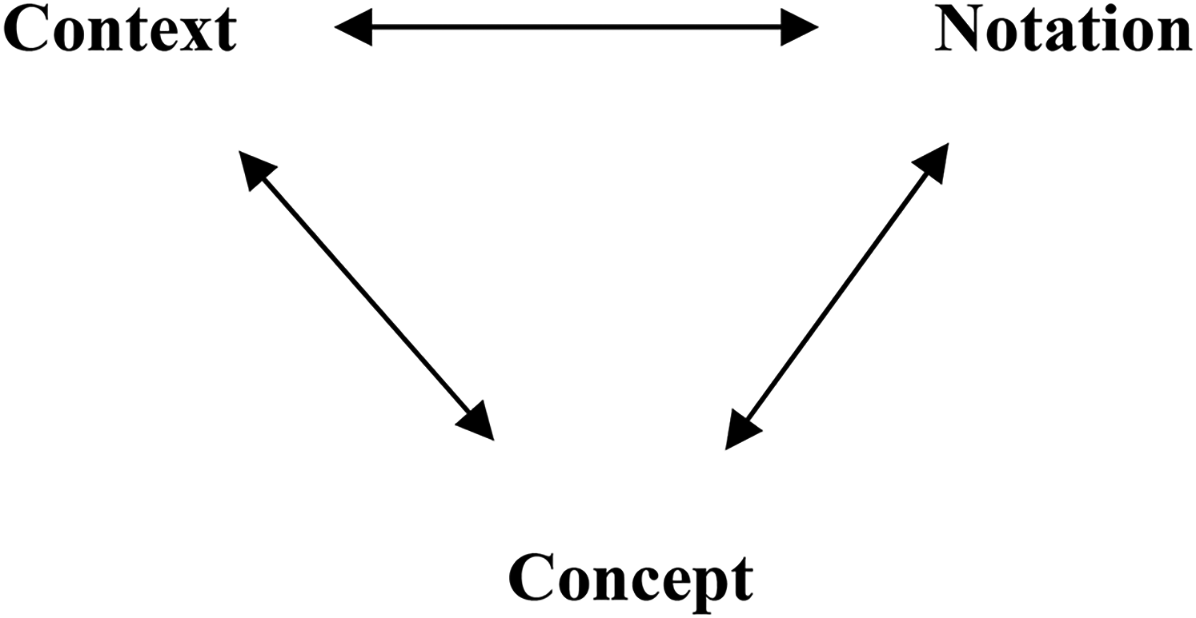
Epistemological triangle.
In a narrower sense, this study uses a modified version of the theoretical framework created by Greefrath et al. (2021a) to describe the relationships between an individual's basic mental model, the concept image, and the personal concept definition (see Figure 2). As noted earlier, a basic mental model is an interpretation of a mathematical concept that gives it meaning. According to Greefrath et al. (2021a), this basic mental model is comprised of and is a part of a concept image, which incorporates all the mental images, properties, and processes that a student associates with the mathematical object. Furthermore, the concept image gives meaning to and is expressed by a personal concept definition that may or may not coincide with the formal mathematical definition of the object in question, which in this case is the definite integral.

Relations between basic mental models, concept images, and concept definitions.
To assess how students perceive definite integrals, and thus for teachers to be able to promote a better understanding of them, Greefrath et al. (2016, 2023) focused on four basic mental models that are typically associated with the concept: area, average value, accumulation, and construction/reconstruction. They created a survey instrument (Greefrath et al., 2021b—see Appendix) to measure how student's thinking corresponded with each one when presented with eight different scenarios where the meaning of a corresponding definite integral can be interpreted in different ways. The same survey instrument was used with permission in this study, with the authors carefully and collaboratively translating it into English from the original German in a way that preserved the original meaning and minimized issues of misinterpretation by the students.
Data from 342 participants were analyzed for this study. 200 of the participants were students at a highly rated private university in India, with 12.5% being female, and 142 from a highly rated public university in Sri Lanka, with 35.2% being female. Using purposive sampling, the Indian cohort consisted of second-year engineering students who had been exposed to the definite integral in a previous class of introductory calculus, both at the higher secondary and university level, while the students in Sri Lanka were second-year mathematics students who also had previous exposure to calculus, both in preparation for their Advanced Level studies and during their first year at university.
The survey instrument (detailed in Appendix) was disseminated and collected in the classroom. The survey was faculty-proctored, with students taking between 25 and 50 minutes to carefully assess the eight scenarios presented. In each scenario, participants were asked to use a 5-point Likert scale to determine the extent to which four interpretations of the definite integral aligned with their own perspective.
The four interpretations corresponded in a random order to the four basic models considered by Greefrath et al. (2021a), namely area, average value, accumulation, and construction/reconstruction. The basic mental model of area refers to an interpretation of the definite integral of a function as being the net area between the function and the x-axis, whereby areas above the x-axis are added to the total and areas below the x-axis are subtracted. The basic mental model of average value refers to an interpretation whereby the value of the integral of a function over an interval divided by the length of the interval yields the average value of the function. The basic mental model of accumulation regards the definite integral as the limiting value of the sum of products. These products involve rectangular regions of narrow width and height determined by the function. Finally, the basic model of construction/reconstruction refers to an interpretation of the definite integral of a function as measuring the total variation of a given quantity over an interval using the rate of change, which allows us to reconstruct the antiderivative and its associated physical meaning.
The survey instrument (Greefrath et al., 2021b—see Appendix) was rigorously developed by its German creators to ensure that the four basic mental models could be reliably measured. Tests for validity and reliability were carried out, with the statistical analysis yielding acceptable values. As a result, the survey instrument was applied to their main study group consisting of 428 students, and it is that same survey instrument, carefully translated into English, that we use here. Data from the participants in this study were then quantitatively analyzed in a way that allowed direct comparison with the students in Germany (Greefrath et al., 2021a). Along with descriptive statistics of the four basic mental models, measures of internal consistency and reliability were also considered.
Results
While the results from the two countries will be discussed in the next section both individually, collectively, and comparatively with those of Greefrath et al. (2021a), they are presented individually in this section given that we assume them to be independent.
Results from India
At first glance, the analysis of the data gathered from students in India reveals noticeable consistency with the descriptive statistics published in Germany by Greefrath et al. (2021a)—see Table 1. In both cases, the basic mental models (BMM) related to area (AR) proved to be the closest match to the students’ way of thinking about the scenarios presented, with the basic mental models related to average value (AV) being the least likely to correspond with the perceptions of the students.
Results from students in India (all questions).
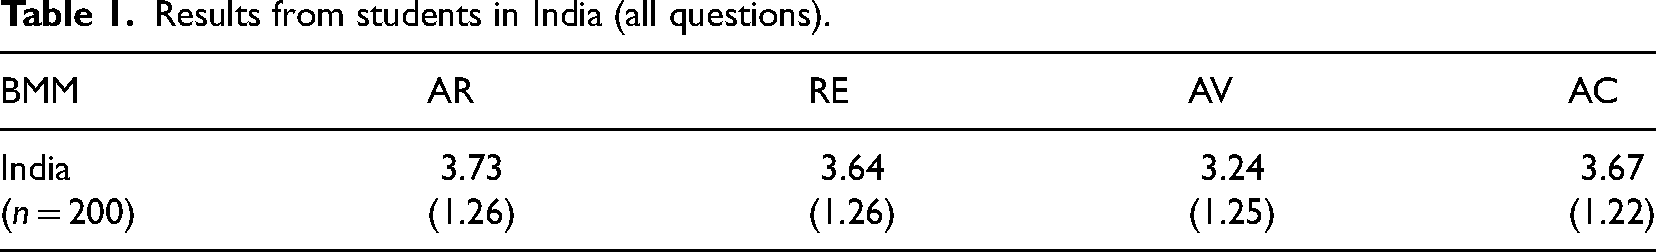
Results from students in India (all questions).
However, when we look more deeply at the results, there are several differences with the German data. Firstly, the gap between the mean value of the area basic mental model and those for the accumulation (AC) and construction/reconstruction (RE) basic mental models is much smaller. Indeed, when we conducted an item analysis of the eight questions, there were only two in which the area basic mental model ranked in first place—see Table 2. With the exception of the average value basic mental model, which often ranked last among the four scenarios, the other three were almost equally favored. It is also worthy of note, however, that the first scenario presented was ranked top in seven of the eight questions, suggesting that students were likely to support the first scenario that resonated with their way of thinking and hence not consider the alternatives as deeply.
Rank ordering of the four basic mental models by question.
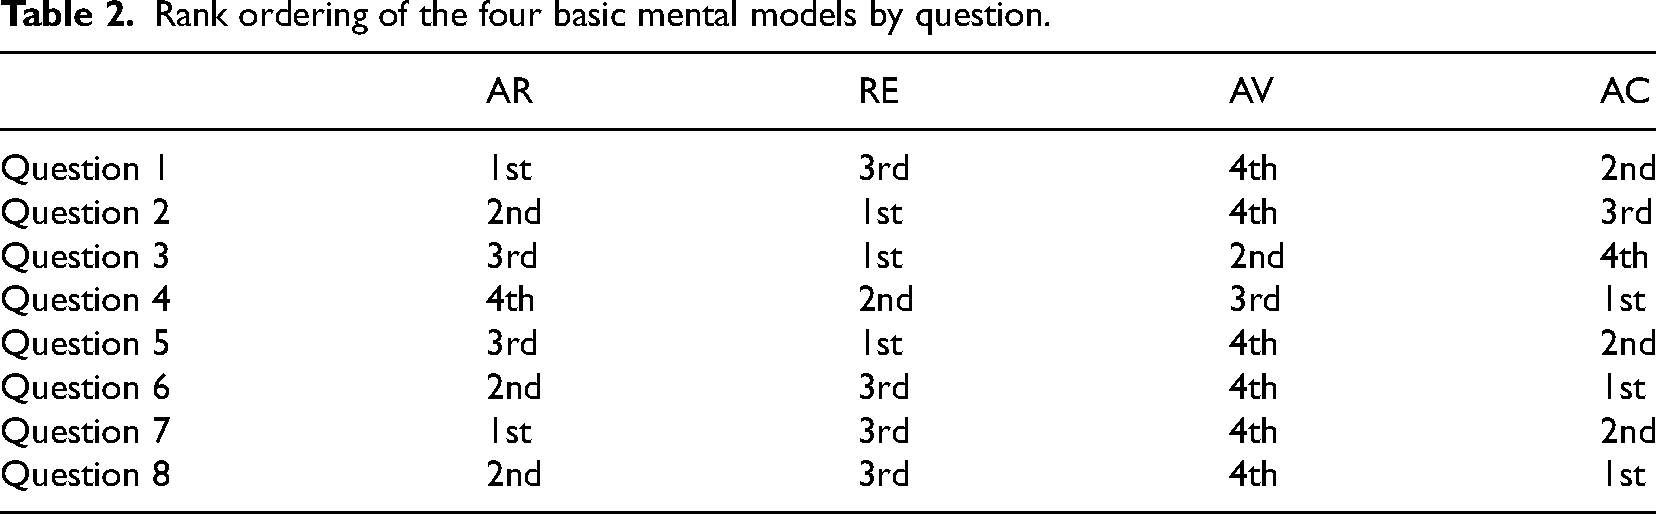
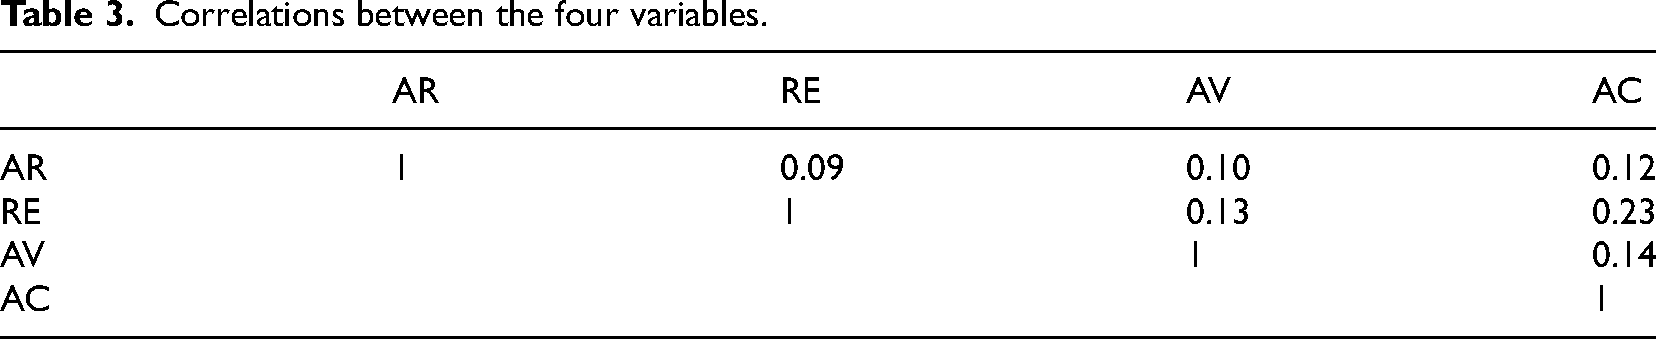
The fact that students were seemingly able to interpret the scenarios in different ways is encouraging. Whereas the corresponding German study found that the area basic mental model was strongly favored by the students at the expense of the other three, here we see much less of a consensus, with three of the basic mental models chosen as being the most popular depending on the scenario presented, with only the average value basic mental model being consistently ranked lower. We also found less correlation (and hence greater independence) between the four basic mental models than was the case in the German study—see Table 3.
Correlations between the four variables.
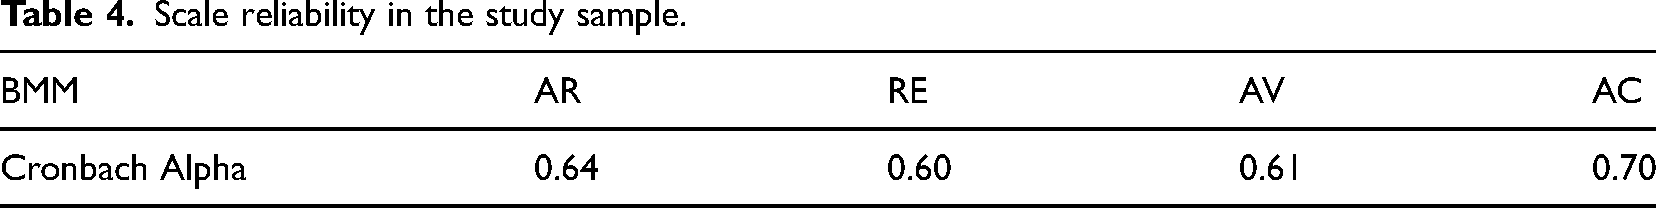
When we look at the Cronbach alpha values to assess reliability (Table 4), we see that all four of the basic mental models have a value of 0.6 or above. These are higher than those reported in the German study, and meet the threshold suggested by Bagozzi and Yi (1988).
Scale reliability in the study sample.
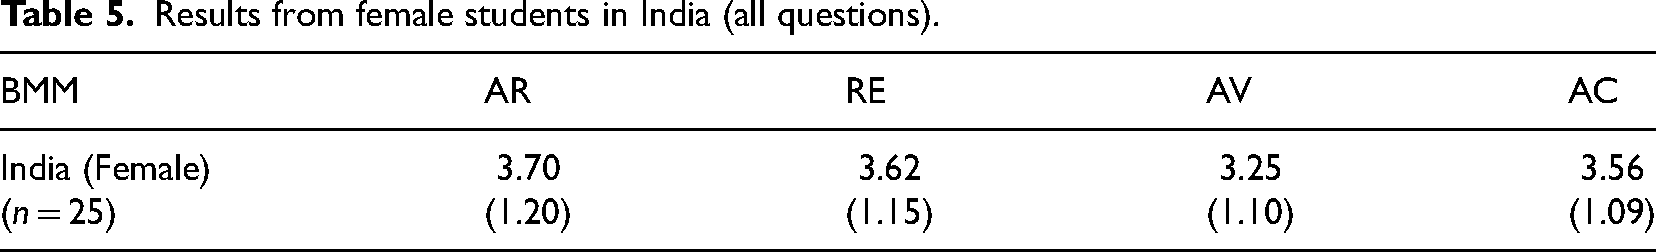
Finally, although the number of female students in the study was relatively small (n = 25), as is typical among those studying engineering in India, we looked to see if there was any indication that they had a different interpretation of the scenarios presented. However, as can be seen in Table 5, the results were consistent with the group as a whole.
Results from female students in India (all questions).
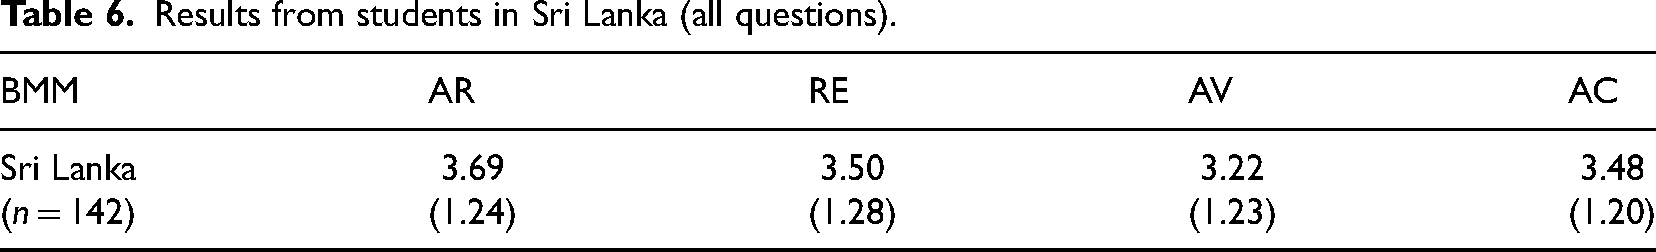
When we look at the descriptive statistics from the survey of students in Sri Lanka, we again see consistency with those from the initial study of Greefrath et al. (2021a) in Germany—see Table 6. The overall rank ordering of the four options remained the same as those surveyed in India, with basic mental models related to area again proving to be closest match to the students’ own way of thinking about the scenarios presented and the basic mental models related to average value being the least likely to correspond with the interpretation of the students.
Results from students in Sri Lanka (all questions).
Results from students in Sri Lanka (all questions).
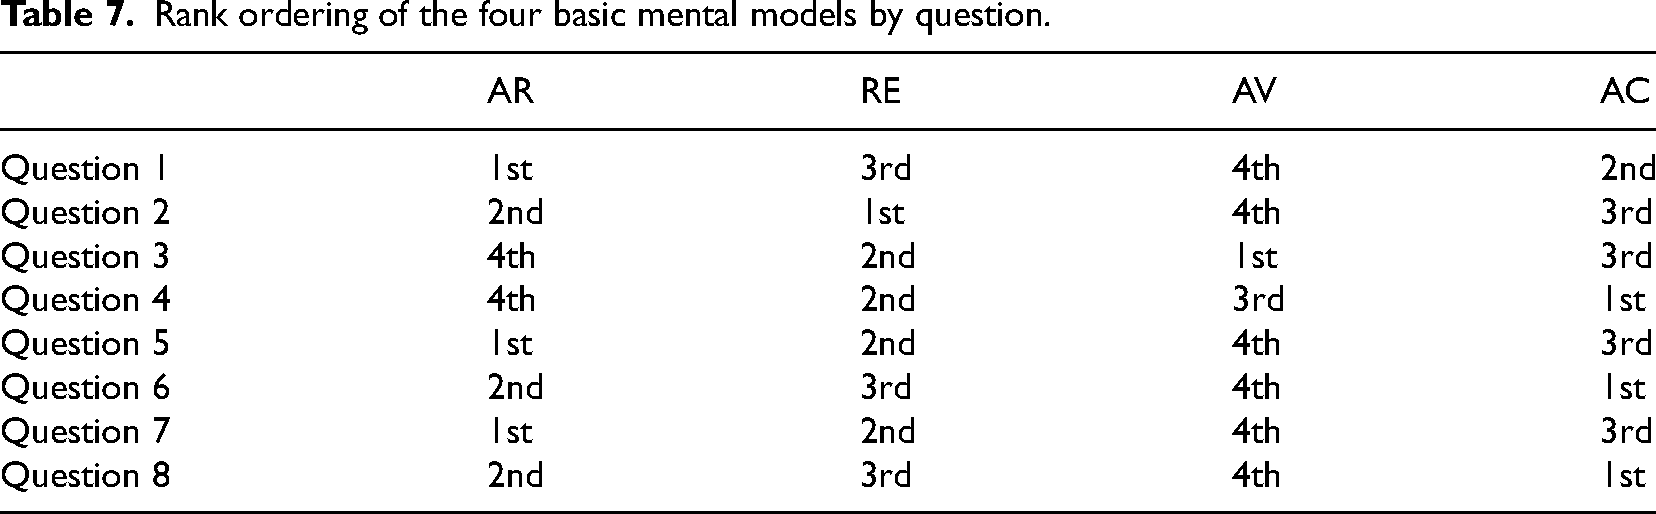
It is noticeable that all four mean values are slightly lower than the corresponding values in Table 1. However, this should perhaps be expected given that most of the eight scenarios presented reflect the broad practical applications of the definite integral favored by engineering students, rather than focusing on a theoretical understanding which might favor those studying mathematics. Also, the gap between the mean value of the area basic mental model and those for the accumulation and construction/reconstruction basic mental models was larger than for the students in India, and similar to the strong preference for the area model described in the German study. This is reflected in the rank ordering by question shown in Table 7, with the area model being one of the top two choices for six of the eight questions. Again, the average value model was least favored, ranked last by the students in all but two of the scenarios presented.
Rank ordering of the four basic mental models by question.
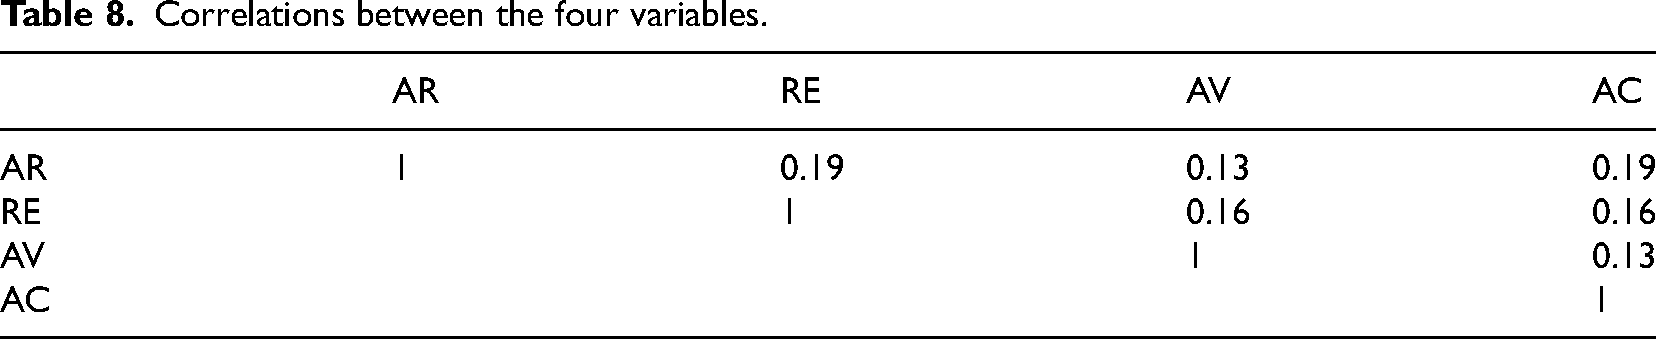
As was the case with the data from India, the correlation between the four basic mental models was very low and much lower than in the German study—see Table 8. This is interesting given that the descriptive data in Table 6 might lead one to believe otherwise and suggests that students were clearly able to distinguish between the scenarios presented and consider them independently.
Correlations between the four variables.
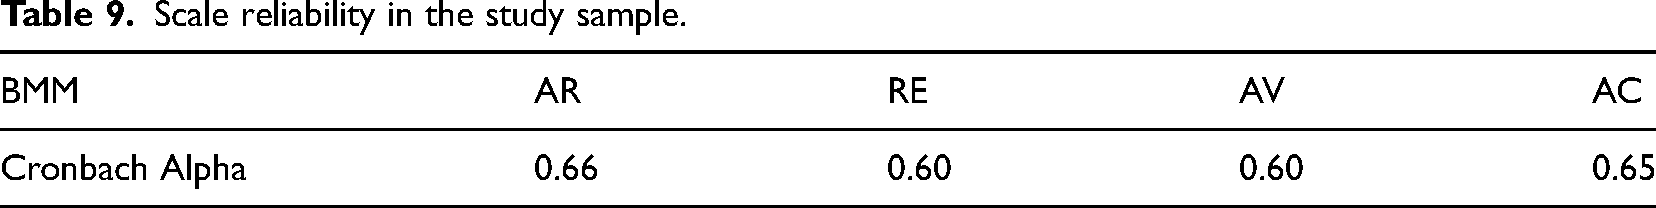
When considering the Cronbach alpha values to assess reliability (Table 9), we again see that all four of the basic mental models have a value of 0.6 or above. These are in line with the results from the Indian students shown in Table 4, and meet the threshold suggested by Bagozzi and Yi (1988).
Scale reliability in the study sample.
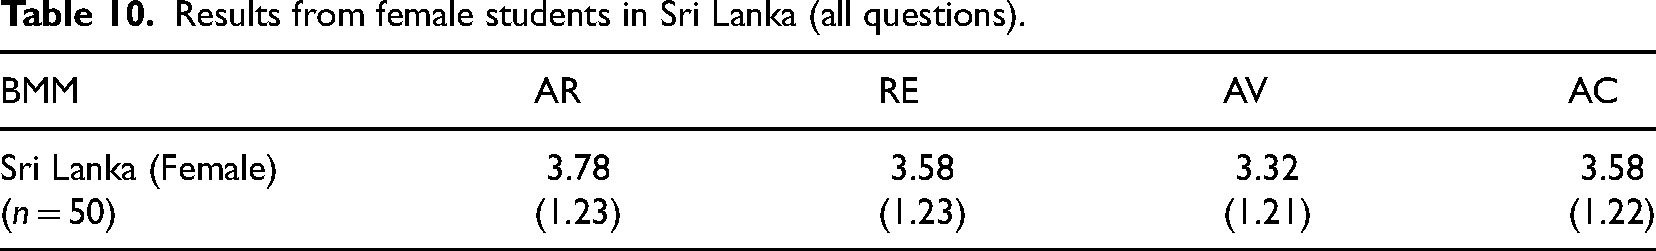
Finally, it was noticeable when considering the female students (n = 50) that the average values for all four basic mental models was higher than the overall averages, though not by a significant margin. We can also see from Table 10 that the results were consistent with the rank orderings described earlier, with the area model strongly favored and the average value model least likely to correspond with the students’ way of thinking about the given scenario.
Results from female students in Sri Lanka (all questions).
Although, as might have been expected, the students in India and Sri Lanka determined that the explanations of the definite integral related to area correlated most closely with their own way of thinking about the scenarios given (see Tables 1 and 6), the gap between the area basic mental model and the accumulation and construction/reconstruction basic mental models was much smaller than was the case in the study done by Greefrath et al. (2021a), especially in India. Indeed, as can be seen from Table 2, the Indian students preferred other explanations in six of the eight questions. This is encouraging given that Bezuidenhout and Olivier (2000) caution that an inappropriate conception of the definite integral as an area (which hence must have a positive value) can arise if the student fails to recognize that it stems from a special case where the function in question is non-negative over the domain. As a result of this, Greefrath et al. (2016) recommend that “area should not be used as the first grundvorstellung for introducing integrals in school lessons” (p. 12).
The results of this study are also consistent with those of Greefrath et al. (2021a) in finding that, of the four basic mental models presented, students are least likely to think of definite integrals in terms of an average value. This might lead the reader to suggest that more emphasis should be given by teachers to this interpretation, but Greefrath et al. (2016) caution that overemphasizing the average value grundvorstellung “may render other possible applications more difficult to understand” (p. 13).
Any similarities between the results from this study and the work done in Germany by Greefrath et al. (2021a) is likely indicative of an overlapping pedagogical approach by teachers in different countries, as it is undoubtedly true that the way students perceive integrals is a reflection of the conceptual structure described by their teacher. Ural (2020) coded the views of prospective teachers according to the six categorizations described by Oberg (2000) and found that most of those surveyed associated integrals with the procedural aspect of calculating an antiderivative (the primitive function) or viewed it as representing an area. In trying to interpret the results in the context of the curriculum and pedagogical training received by teachers, we note that India, Sri Lanka, and Germany have similar teacher education programs for accredited public-school teachers (Cortina & Thames, 2013; Ramchand, 2020), consisting of a bachelor's degree (often in education), followed by up to two years of on-the-job training at a school. Each phase is followed by a teaching certification exam. While education in Germany is virtually all public, there are growing numbers of private and international schools throughout India and Sri Lanka as the number of people moving into the middle classes increases (Kingdon, 2020; Pallegedara, 2012).
As noted, there were also differences between the results found here and those from previous studies. Although the students broadly favored the four basic mental models in the same order, the mean values displayed in Tables 1 and 6 are all higher than those in the German study and have a lower dispersion, suggesting that the students in India and Sri Lanka were more comfortable with the different interpretations given, and could perhaps detect that all the explanations given were equally valid. Indian, Sri Lankan, and German students are first introduced to calculus in high school, and then later more extensively and rigorously in university. In each country, national exams granting university admission are taken at the end of their high school career, although Indian and Sri Lankan students often attend additional coaching classes to help with their preparation, as well as attending a regular school. While the issues associated with attending two schools at the same time are numerous, by doing so, students gain the advantage of receiving multiple viewpoints on the same subject. Moreover, instructors at these private coaching centers are often encouraged to use innovative and engaging pedagogical tools. These coaching centers not only prepare students for the national exams but also impart necessary skills to better analyze multiple-choice questions. While this does not necessarily lead to a deeper understanding, it does expose students to a large variety of calculus problems, thereby allowing them to develop conceptual connections. The fact that students in India and Sri Lanka, especially those who enroll in highly ranked universities, have often had a multifaceted exposure to calculus, and training for multiple-choice questions similar to those included in the survey instrument, may help explain the results of the current study.
Conclusion
Although the study of mathematics education has flourished in recent decades, in particular work done involving courses taken at the beginning of the undergraduate curriculum, there has been a relative scarcity in the amount of research done involving students in India and Sri Lanka. There are many contributing factors to this anomaly, notably the small number of journals and conferences in South Asia devoted to mathematics education, which in turn stems from the precedence given to research in theoretical mathematics. While this paper is only a small step in redressing the balance, it does show how previous studies and theories developed (predominantly) by researchers in Europe and North America can be assessed and reformulated in the context of higher education elsewhere.
Our study takes a fundamental concept in mathematics that is studied at the secondary and tertiary level, namely the definite integral, and uses an existing test instrument to consider which of the various ways in which it can be interpreted most closely aligns with student understanding. By doing this we gain new insight into the way that integrals are introduced by the instructor, how they are internally processed by the student, and how the results obtained compare with previous studies.
The results of this study confirm that students can contextualize the concept of the definite integral in several different ways but prefer some of the basic mental models presented over others, particularly the area model. This is in keeping with the results from Germany, though our data show a smaller gap between the preference for the area model and the other three described, which indicates a greater propensity for students in India and Sri Lanka to interpret the definite integral in a variety of ways. We believe it is important for all calculus educators, including classroom teachers, administrators, and textbook authors, to continue stressing a broad range of approaches in order to enhance the conceptual understanding of fundamental topics. By doing so, they avoid the situations described by Martínez-Planell and Trigueros (2020), whereby students are capable of successfully performing calculations when asked to solve exercises related to the integration of functions of one or multiple variables, but “reveal confusion when trying to explain their understanding” (p. 24).
There are several directions in which future studies can proceed. We could extend our work by obtaining longitudinal data to see if students gain a broader understanding of the definite integral as they progress through their undergraduate studies. Further analysis would also be possible if students were interviewed in a manner akin to that used in the paper by Stevens and Jones (2023). This would allow us to explain the results in a more concrete manner rather than interpreting them based on informed speculation, in particular regarding the teaching that the students received and the underlying curriculum in the countries involved. Finally, by conducting a similar study in more countries, we can establish deeper connections between the work that has been done looking at student perceptions of the definite integral in Europe, North America, and the rest of the world.
Footnotes
Availability of data
The data sets are kept securely by the corresponding author and are available upon request.
Contributorship
Ashish Bhatt and Mangalagama Dewasurendra gathered the data and assisted in drafting the manuscript. Barry J. Griffiths designed the experiment, analyzed the data, and drafted the completed manuscript. All of the authors approved the final article.
Declaration of conflicting interests
The authors declared no potential conflicts of interest with respect to the research, authorship, and/or publication of this article.
Ethical approval
The IRB determined this study to be human subjects’ research that is exempt from regulation.
Funding
The authors received no financial support for the research, authorship, and/or publication of this article.
Informed consent
Participants provided informed consent, having been informed about the use of the collected data and assured of the anonymity of their responses.
Author biographies
Appendix – Survey instrument
The following questions were taken from the paper by Greefrath et al. (2021b) and translated into English by the authors.
1. The definite integral
Please select how well the explanations below match with your own thinking:
– –: "The explanation definitely does not match my way of thinking"
++: "The explanation exactly matches my way of thinking"– –
–
o
+
++
The definite integral is the signed area of the curve between the graph of the function
and the
-axis in the interval
.
□
□
□
□
□
The definite integral is the total change of a quantity in the interval
whose rate of change is described by
.
□
□
□
□
□
The definite integral is the mean value of function
in the interval
multiplied by the length of the interval.
□
□
□
□
□
The definite integral is the limit of many sums of products formed from a function value and the length of the subintervals of
.
□
□
□
□
□
2. Consider the equation
Please select how well the explanations below match with your own thinking:
– –: "The explanation definitely does not match my way of thinking"
++: "The explanation exactly matches my way of thinking"– –
–
o
+
++
If
represents the rate of change of a quantity, the increase during the first half of the interval is equal to the decrease during the second half of the interval. So, the total change is 0.
□
□
□
□
□
An integral is a limit of sums. For every positive summand, there is a negative summand of equal amount. Overall, the integral is 0.
□
□
□
□
□
The graph creates two equal areas with the
-axis, one above and one below. Since one is counted positively, the other negatively, the result is 0.
□
□
□
□
□
On average, the function values in this interval are 0, because for each positive function value there is a corresponding negative function value.
□
□
□
□
□
3. Graph 1 and Graph 2 show the water flow in litres per minute into two identical containers. The containers were empty at time zero.
There are different ways to explain why at time t = 5 the two containers are equally full.
Please select how well the explanations below match with your own thinking:
– –: "The explanation definitely does not match my way of thinking"
++: "The explanation exactly matches my way of thinking"– –
–
o
+
++
The average water inflow in the interval [0, 5] is identical for the two containers.
□
□
□
□
□
For both graphs, the area between the graph and the horizontal axis is equal on the interval [0, 5].
□
□
□
□
□
We can imagine the inflow being constant during a small interval of time and add the total volume of water during all the intervals. By the time t = 5, the same value is obtained from both graphs.
□
□
□
□
□
The volume function can be determined from the graph, which describes how much water t is currently in the basin. At t = 5, the two volume functions have the same value.
□
□
□
□
□
4. The function
Please select how well the explanations below match with your own thinking:
– –: "The explanation definitely does not match my way of thinking"
++: "The explanation exactly matches my way of thinking"– –
–
o
+
++
The expression allows us to approximate the distance travelled during the hour being considered using the speed function and the small time intervals.
□
□
□
□
□
The expression can be used to approximate the average speed of the car during the hour being considered.
□
□
□
□
□
The expression approximately calculates the distance travelled during the hour being considered.
□
□
□
□
□
The expression approximates how large the area is between the graph of f and the horizontal axis during the hour being considered.
□
□
□
□
□
5. An object with a height of 2 metres is placed on the ground. If the object is cut parallel to the ground at height
What is the meaning of the expression
Please select how well the explanations below match with your own thinking:
– –: "The explanation definitely does not match my way of thinking"
++: "The explanation exactly matches my way of thinking"– –
–
o
+
++
The expression calculates the volume of the object.
□
□
□
□
□
The expression calculates the area enclosed by the graph of
and the horizontal axis.
□
□
□
□
□
The expression corresponds to the average cross-sectional area of the object multiplied by the height.
□
□
□
□
□
The expression is the limit of the sum of the volumes of the horizontal slices.
□
□
□
□
□
6. A circle with radius
Please select how well the explanations below match with your own thinking:
– –: "The explanation definitely does not match my way of thinking"
++: "The explanation exactly matches my way of thinking"– –
–
o
+
++
The area of a circle is composed of many thin washer shaped rings. The integral adds up the area of these rings.
□
□
□
□
□
The circumference is equal to the rate of change of the area of the circle. Therefore, the area can be calculated from this rate of change using the integral.
□
□
□
□
□
As we go around the perimeter of the circle, the circumference increases from 0 to
, with an average value of
. The integral is equal to this average multiplied by r, the length of the interval.
□
□
□
□
□
The area of a circle is equal to the area under the graph of the circumference function.
□
□
□
□
□
7. In a hydroelectric power plant, the water flowing through it is used to generate electricity. It flows into a reservoir at high tide and out again at low tide. The figure below shows the flow rate d of the water (in millions of cubic metres per hour) during a 12-hour period. At the beginning of the observation, the storage of the power plant is empty.
What is the meaning of the expression
Please select how well the explanations below match with your own thinking:
– –: "The explanation definitely does not match my way of thinking"
++: "The explanation exactly matches my way of thinking"– –
–
o
+
++
The expression is the signed area between the graph of d and the horizontal axis during the interval
.
□
□
□
□
□
The expression is the average flow rate during the interval
multiplied by 12.
□
□
□
□
□
The expression indicates how the inflows and outflows add up to give us the cumulative water volume of water after 12 hours by considering very short time periods.
□
□
□
□
□
The expression determines the volume of water in the storage tank at the time t = 12 using the flow rate.
□
□
□
□
□
8. Consider an object falling with speed
Please select how well the explanations below match with your own thinking:
– –: "The explanation definitely does not match my way of thinking"
++: "The explanation exactly matches my way of thinking"– –
–
o
+
++
The integral corresponds to the product of the average speed and the duration.
□
□
□
□
□
The path of the object consists of many small pieces of length
. The integral adds all these pieces to give the total distance.
□
□
□
□
□
The integral determines the distance travelled from the velocity
.
□
□
□
□
□
The integral corresponds to the area between the graph of the function
and the horizontal axis.
□
□
□
□
□