
Abstract
In this paper, we explore changes in secondary school mathematics students’ (age 12–13, N = 203) confidence calibration (i.e., the correlation between accuracy and confidence) across a sequence of six low-stakes (i.e., not-for-credit) formative assessments administered over 2 months during normal classroom teaching. For each item in each of the assessments, students were asked to state on a 0–5 scale how sure they were that the answer that they had given was correct. Afterwards, they calculated their total score in a manner intended to incentivize improved calibration: the sum of the confidence ratings on the items that they answered correctly, minus the sum of the confidence ratings on the items that they answered incorrectly. Students broadly improved their calibration across the assessments, and a qualitative analysis of their views on the practice of confidence assessment was overwhelmingly positive.
Keywords
Introduction
School students’ confidence in their learning of mathematics is an area of increasing interest within the mathematics education literature (e.g., Foster, 2016, 2022; Foster et al., 2022; Hannula, 2014). Student confidence in mathematics is positively associated with attainment (Mullis et al., 2020), and this is underpinned by a reciprocal, bidirectional relationship (Ganley & Lubienski, 2016; Pinxten et al., 2014). Success breeds confidence, and how confident students feel about their learning of mathematics influences their happiness at school (Hannula, 2014; Morsanyi et al., 2019) and their success in mathematics and predicts their future career choices (Franz-Odendaal et al., 2020; Paulsen & Betz, 2004).
However, students’ confidence is not always accurately placed, with unwarranted under-confidence and overconfidence both potentially problematic in the school mathematics classroom. Under-confident students may be more likely to develop negative perceptions of mathematics, be less inclined to engage in whole-class mathematical discussions and may choose not to pursue study of mathematics or mathematics-related subjects beyond the compulsory school years (Morsanyi et al., 2019). Students may choose to focus excessively on content which they have in fact already mastered, at the expense of more challenging material, and be likely to experience stress and unhappiness during their compulsory mathematics education.
On the other hand, overconfidence may lead students to devote insufficient attention to content that they do not know as well as they think that they do, engage in less practice of procedures than they need to in order to attain fluency, and think less deeply than they should about important concepts (Foster, 2016, 2017). Many authors across diverse cultures have stressed the dangers of illusory superiority effects, such as the Dunning–Kruger effect (see Ehrlinger et al., 2008), in which individuals who are less competent display greater overconfidence.
Accurate self-awareness of a student's specific strengths and weaknesses corresponds to high confidence calibration, by which is meant a strong correlation between a student's accuracy (obtaining the correct answer) and their confidence rating (Fischhoff et al., 1977). High confidence calibration (hereafter “calibration”) would seem likely to facilitate more effective deliberate practice (Ericsson, 2006), enabling students to target their attention efficiently on accurately identified areas of difficulty. Many sources extoll the benefits of accurate self-knowledge for personal development. For example, the Daodejing stated that “To know that one does not know is best; Not to know but to believe that one knows is a disease.” The aim of addressing students’ mathematical confidence is explicitly not to try to raise each student's confidence level but to enable students to become better calibrated, so that under-confident students become more confident but overconfident students reduce their overconfidence to more realistic levels, combatting self-deception, which has the potential to undermine their progress in learning.
Confidence assessment (Foster, 2016, 2022; Foster et al., 2022; Gardner-Medwin, 1995, 1998, 2006, 2019) is a technique that has been proposed as a self-correcting method to achieve improved calibration. Implemented regularly as part of ordinary, low-stakes (i.e., not-for-credit) formative assessments, students indicate alongside each assessment item how sure they are that the answer that they have just given is correct (e.g., on a scale from 0 to 5). After completing the assessment, students themselves calculate their total confidence score as the sum of the confidence ratings on the items that they answered correctly, minus the sum of the confidence ratings on the items that they answered incorrectly. Used in this way, confidence assessment is designed formatively to incentivize increasingly well-calibrated confidence ratings, since students cannot in the long run expect to “game” a confidence assessment score by either exaggerating or understating their “true” confidence levels (Foster, 2022). It is considered important that students self-mark and calculate their own confidence scores, since, as well as being more in line with typical formative assessment practices in schools, it underlines and makes transparent to students the impact of their confidence ratings on their total score (Foster, 2016).
Previous research has established that confidence assessment is easy to implement in school mathematics lessons (Foster, 2016, 2022; Foster et al., 2022). However, studies have not yet shown an effect of repeated, systematic use of confidence assessment over time on students’ calibration, and this has been identified as a priority for future research (Kinnear et al., 2022). In this paper, we present tentative evidence of improvement in Year 8 (age 12–13) students’ (N = 203) calibration across a sequence of six low-stakes, formative assessments, administered over 2 months during the normal classroom teaching of linear equations. We investigate gender differences and also survey the students’ opinions on confidence assessment after the six assessments were completed. We conclude that confidence assessment provides a low/no-cost, easy-to-implement modification to typical low-stakes, in-class formative assessments that has the potential to improve students’ calibration and thus their awareness of their own capabilities, potentially facilitating their future learning.
Confidence assessment as a formative tool
Confidence in mathematics
Within mathematics education, confidence has been explored at multiple levels. Broad, subject-level constructs, such as mathematics confidence (Pierce & Stacey, 2004), encompass mathematical self-efficacy (Bandura, 1977), which captures a student's ex ante (prior) prediction about whether they will succeed with a specified mathematical task. Bandura (1977) argued that this could affect whether a student will even attempt a particular task, how much effort they will likely invest in it, and how they will respond when difficulties present themselves. Confidence in mathematics is generally found to be lower for girls than for boys (Foster et al., 2022; Frost et al., 1994; Ganley & Lubienski, 2016; Mullis et al., 2020), even when girls show equal or higher attainment (Pomerantz et al., 2002). Students characterized as socioeconomically disadvantaged also tend to show lower confidence in mathematics (OECD, 2013, 2019), even after accounting for their attainment (Foster et al., 2022). Students’ confidence in mathematics is also known to reduce with age across their school years (Foster et al., 2022; Galton et al., 2003; Greany et al., 2016; Mullis et al., 2020; Zanobini & Usai, 2002).
In addition to these global notions of mathematics confidence, there are also multiple confidence constructs at the fine grain size of individual items on an assessment (see, e.g., Clarkson et al., 2017; Dirkzwager, 2003; Marsh et al., 2019; Stankov et al., 2012). Researchers have sometimes focused on predictive confidence, which students report before they attempt the item. For example, Tobias et al. (1999) developed and evaluated a knowledge monitoring assessment, which measures how accurately students distinguish between what they know and what they do not know by comparing their knowledge predictions to their performance on a test. Alternatively, as in the present study, confidence can be elicited after the item has been answered and the student has had opportunity to reflect on what was involved in answering it. A student's “confidence of response” can be defined as “how certain they are that the answer that they have just given is correct” (Foster, 2016, p. 274). This can be conveniently captured on a scale from 0 (completely uncertain; i.e., just guessing) to 5 (completely certain).
Confidence assessment
In general, it is difficult to assess students’ confidence reliably, since there may be incentives for students to claim overconfidence relative to what they actually feel. Exaggerating their true confidence may win approval for the student from the teacher or at least may avoid drawing unwelcome attention their way. It may also raise the student's status in the eyes of their peers (Hannula, 2003). The practice of confidence assessment seeks to overcome perverse incentives toward exaggerating confidence by incentivizing truthful confidence ratings through penalizing both under-confidence and overconfidence. Since students calculate their total scores by summing the ratings for the correct answers and subtracting the ratings for the incorrect answers, it is usual to treat this as a linear scale (Foster et al., 2022), and we assume that students seek to maximize their total (positive) score.
Building on previous research carried out with students in higher education (e.g., Gardner-Medwin, 1995, 1998, 2006, 2019), Foster (2016) found that school students (age 11–14, N = 336) readily understood the process of confidence assessment and showed an average calibration of r = .546 for an assessment on directed (positive and negative) numbers. The vast majority of students expressed positive views about using confidence assessment, believing that it promoted deeper thinking, increased their confidence, and contributed to formative assessment. However, this study was carried out over the course of just one mathematics lesson, and so any warrants for generalizability are limited.
A subsequent quasi-experimental trial of confidence assessment in mathematics lessons in four secondary schools (N = 475 students) did not find a difference in attainment after using confidence assessment, compared to business-as-usual control conditions (Foster, 2022). This study was opportunistic, and the confidence assessment intervention took place across time periods ranging from 3 weeks up to one academic year. There was no associated professional development, and the fidelity of the intervention was not assessed. Due to the design of this study, data at the level of students’ individual confidence scores was not available, and so students’ calibration could not be tracked across the intervention, only the distant outcome measure of general mathematics attainment. No study has yet explored how secondary school students’ calibration might vary across a consistent series of low-stakes confidence assessments.
Improving calibration with confidence assessment
Repeated use of confidence assessment over time has tended to improve university students’ calibration (Gardner-Medwin & Curtin, 2007), and a possible feedback mechanism by which this could take place is shown in Figure 1. Since students are rewarded by a higher score for accurate confidence ratings and penalized for inaccurate ratings (whether too high or too low), a feedback loop should be created which promotes improved calibration. Repeatedly presenting students with data effectively showing the extent to which they misjudge their confidence should enable them to adjust and gradually become better calibrated over time. The purpose of the present study is to see whether this happens for school students when engaging in six formative confidence assessments over a period of 2 months. We also seek to determine any gender differences and to find out students’ perceptions of confidence assessment following this intervention.
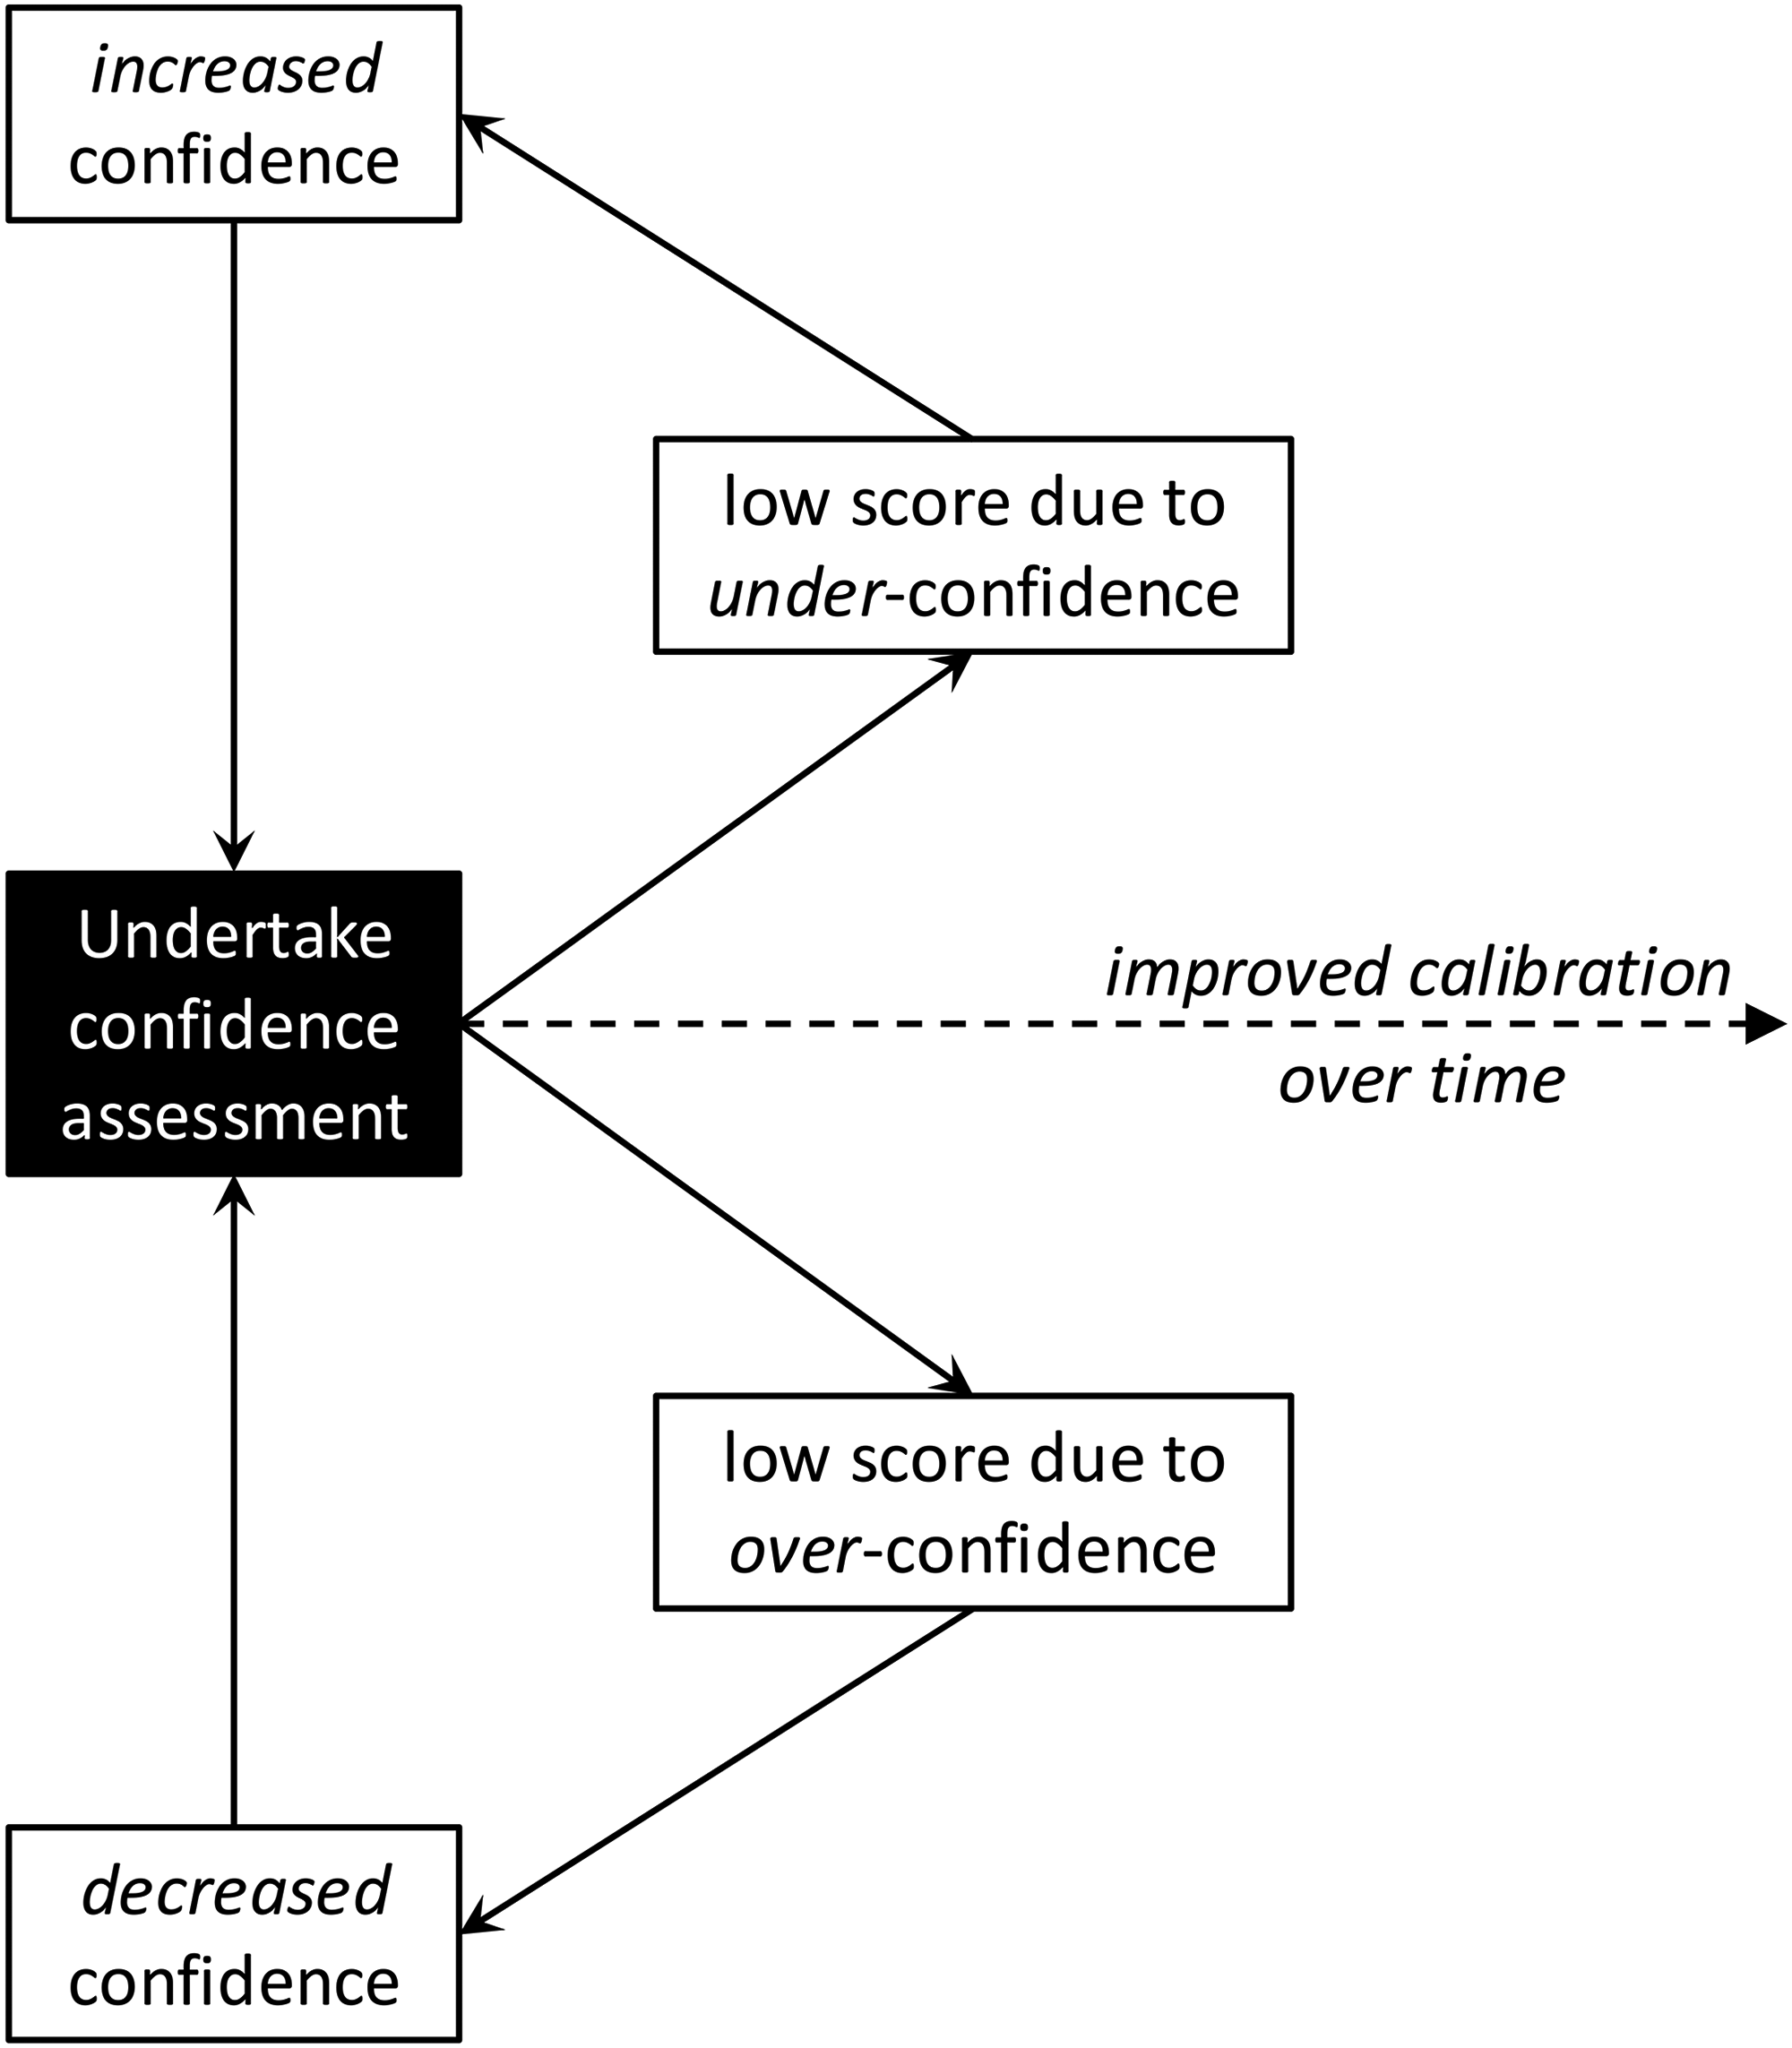
Model for how feedback from confidence assessment could improve calibration over time.
The research questions for this study are:
Do students become better calibrated after six uses of confidence assessment over a period of two months? Do girls and boys show different profiles in their calibration over this period? What are students’ opinions on confidence assessment after using it over a period of two months?
Method
Ethical approval for this study was obtained from Loughborough University's Ethics Review Sub-Committee.
A mixed-methods study was conducted, in accordance with a methodologically pragmatic research design (Foster, 2024). A research team consisting of an academic researcher (Foster) and a school head of middle years programme mathematics (Renie) collaborated to design a study with high ecological validity (Robson & McCartan, 2015) by incorporating confidence assessment into the normal teaching activities of one year group within the school. The research design was correlational and longitudinal, to measure students’ confidence over a 2-month period of successive uses of confidence assessment. As discussed later, this research design limits our ability to make causal claims.
The purpose of the study was to determine whether this style of assessment would lead to students improving their calibration. The rationale, illustrated in Figure 1, was that if students observed that they lost many points because they mistakenly expressed too high or too low confidence, and then discovered that they were wrong, they might reflect on this and show a better calibrated response to subsequent assessments.
Quantitative data of students’ mathematical responses and confidence ratings were analyzed to answer the first and second research questions, and text responses to a survey item were analyzed qualitatively to answer the third research question.
Participants
Participants were Year 8 (age 12–13) students from an international secondary school at which Renie is Head of Middle Years Programme Mathematics. This year group was chosen for the study because they were currently learning about solving linear equations in which the unknown appears on both sides, and this was regarded as an important and substantial enough topic to devote a considerable period of lesson time to studying. The study took place while students were learning this content for the first time, and students were taught in their usual classes with their usual class teachers. There were 291 students in this year group, but 12 students did not complete the test, and during automated scanning of the completed scripts, the scanner destroyed six scripts, leaving 273 completed scripts available for initial analysis.
Instruments and procedure
Over a period of 2 months, each student was given six assessments, written by Renie, each consisting of four items requiring solution of a linear equation. The assessments were designed as three pairs of increasing difficulty, but with both assessments in each pair intended to be of similar difficulty. Assessments 1 and 2 were used after reviewing the previous year's algebra curriculum, Assessments 3 and 4 were used after introducing for the first time linear equations with unknowns on both sides, and Assessments 5 and 6 were used after introducing for the first time equations involving expansion of brackets. Although brackets appeared in Assessments 3 and 4, students would solve these equations by dividing both sides by the factor outside the brackets, rather than by expanding the brackets.
The purpose of having pairs of similar assessments was formative: to see if students who made errors on the first assessment of the pair would answer a similar item correctly on the second assessment of the pair. Assessments 1–2 covered solution of 1- and 2-step equations, with a similar range of numbers used. Assessments 3–4 covered 2-step equations, involving collection of like terms, and with the unknown on both sides. Finally, Assessments 5–6 included expanding brackets and simplifying, and each assessment had one question with no solution. The second assessment in each pair required one more use of negative numbers than the first. These assessments were produced by the Renie as part of normal teaching to complement the school curriculum and have ecological validity, but we do not have reliability data on these assessments.
Each teacher had some flexibility over how the two assessments in each pair were used, in order to serve the needs of their students as they judged best. If the teacher noticed that the class did well on the first of a pair of assessments, then they would discuss errors with the whole class and then assign the second assessment in that pair during the same class period. Alternatively, if the teacher noticed that the students struggled with the first of the two assessments, they would devote more time to practising and re-teaching the content before the second assessment of the pair was used. The variability of implementation is a potential threat to internal validity. However, this was a constraint for ethical and practical reasons, as mentioned above. Since this was a naturalistic study in a real classroom context over an extended period of time, we could not ask teachers to stick rigidly to the assessments if in their professional judgment the students were finding them much too easy or much too difficult. Although the teachers’ actions could indeed have an impact on how students’ accuracy developed over time, it is unclear why the actions of the teacher would affect how well the students could accurately assess their own level of confidence and how that skill develops over time.
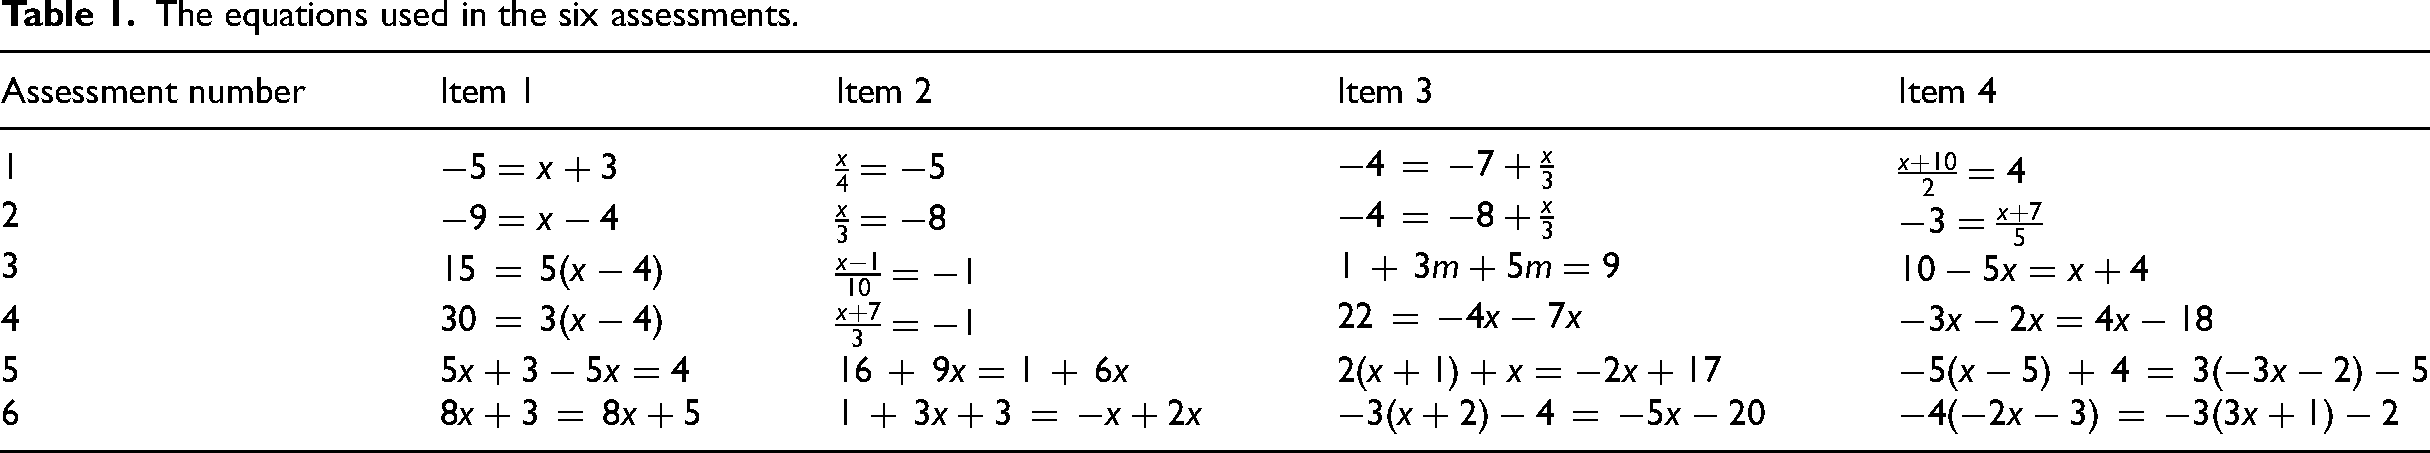
After the students had answered each item in each assessment, but before they discovered if their answers were correct or incorrect, the students were asked to give confidence ratings from 0 to 5 to indicate how sure they were that each answer that they had given was correct. They did this by circling a number from 0 to 5 on a scale placed on the right-hand side of each item. Assessment 1 is shown in Figure 2, and the other five assessments were designed in the same style. (All materials are available at https://doi.org/10.6084/m9.figshare.27302682.) The four equations used in each of the six assessments are given in Table 1. Note that these deliberately included some equations which do not have a solution, and students were taught in their lessons about how to determine if an equation has no solutions.
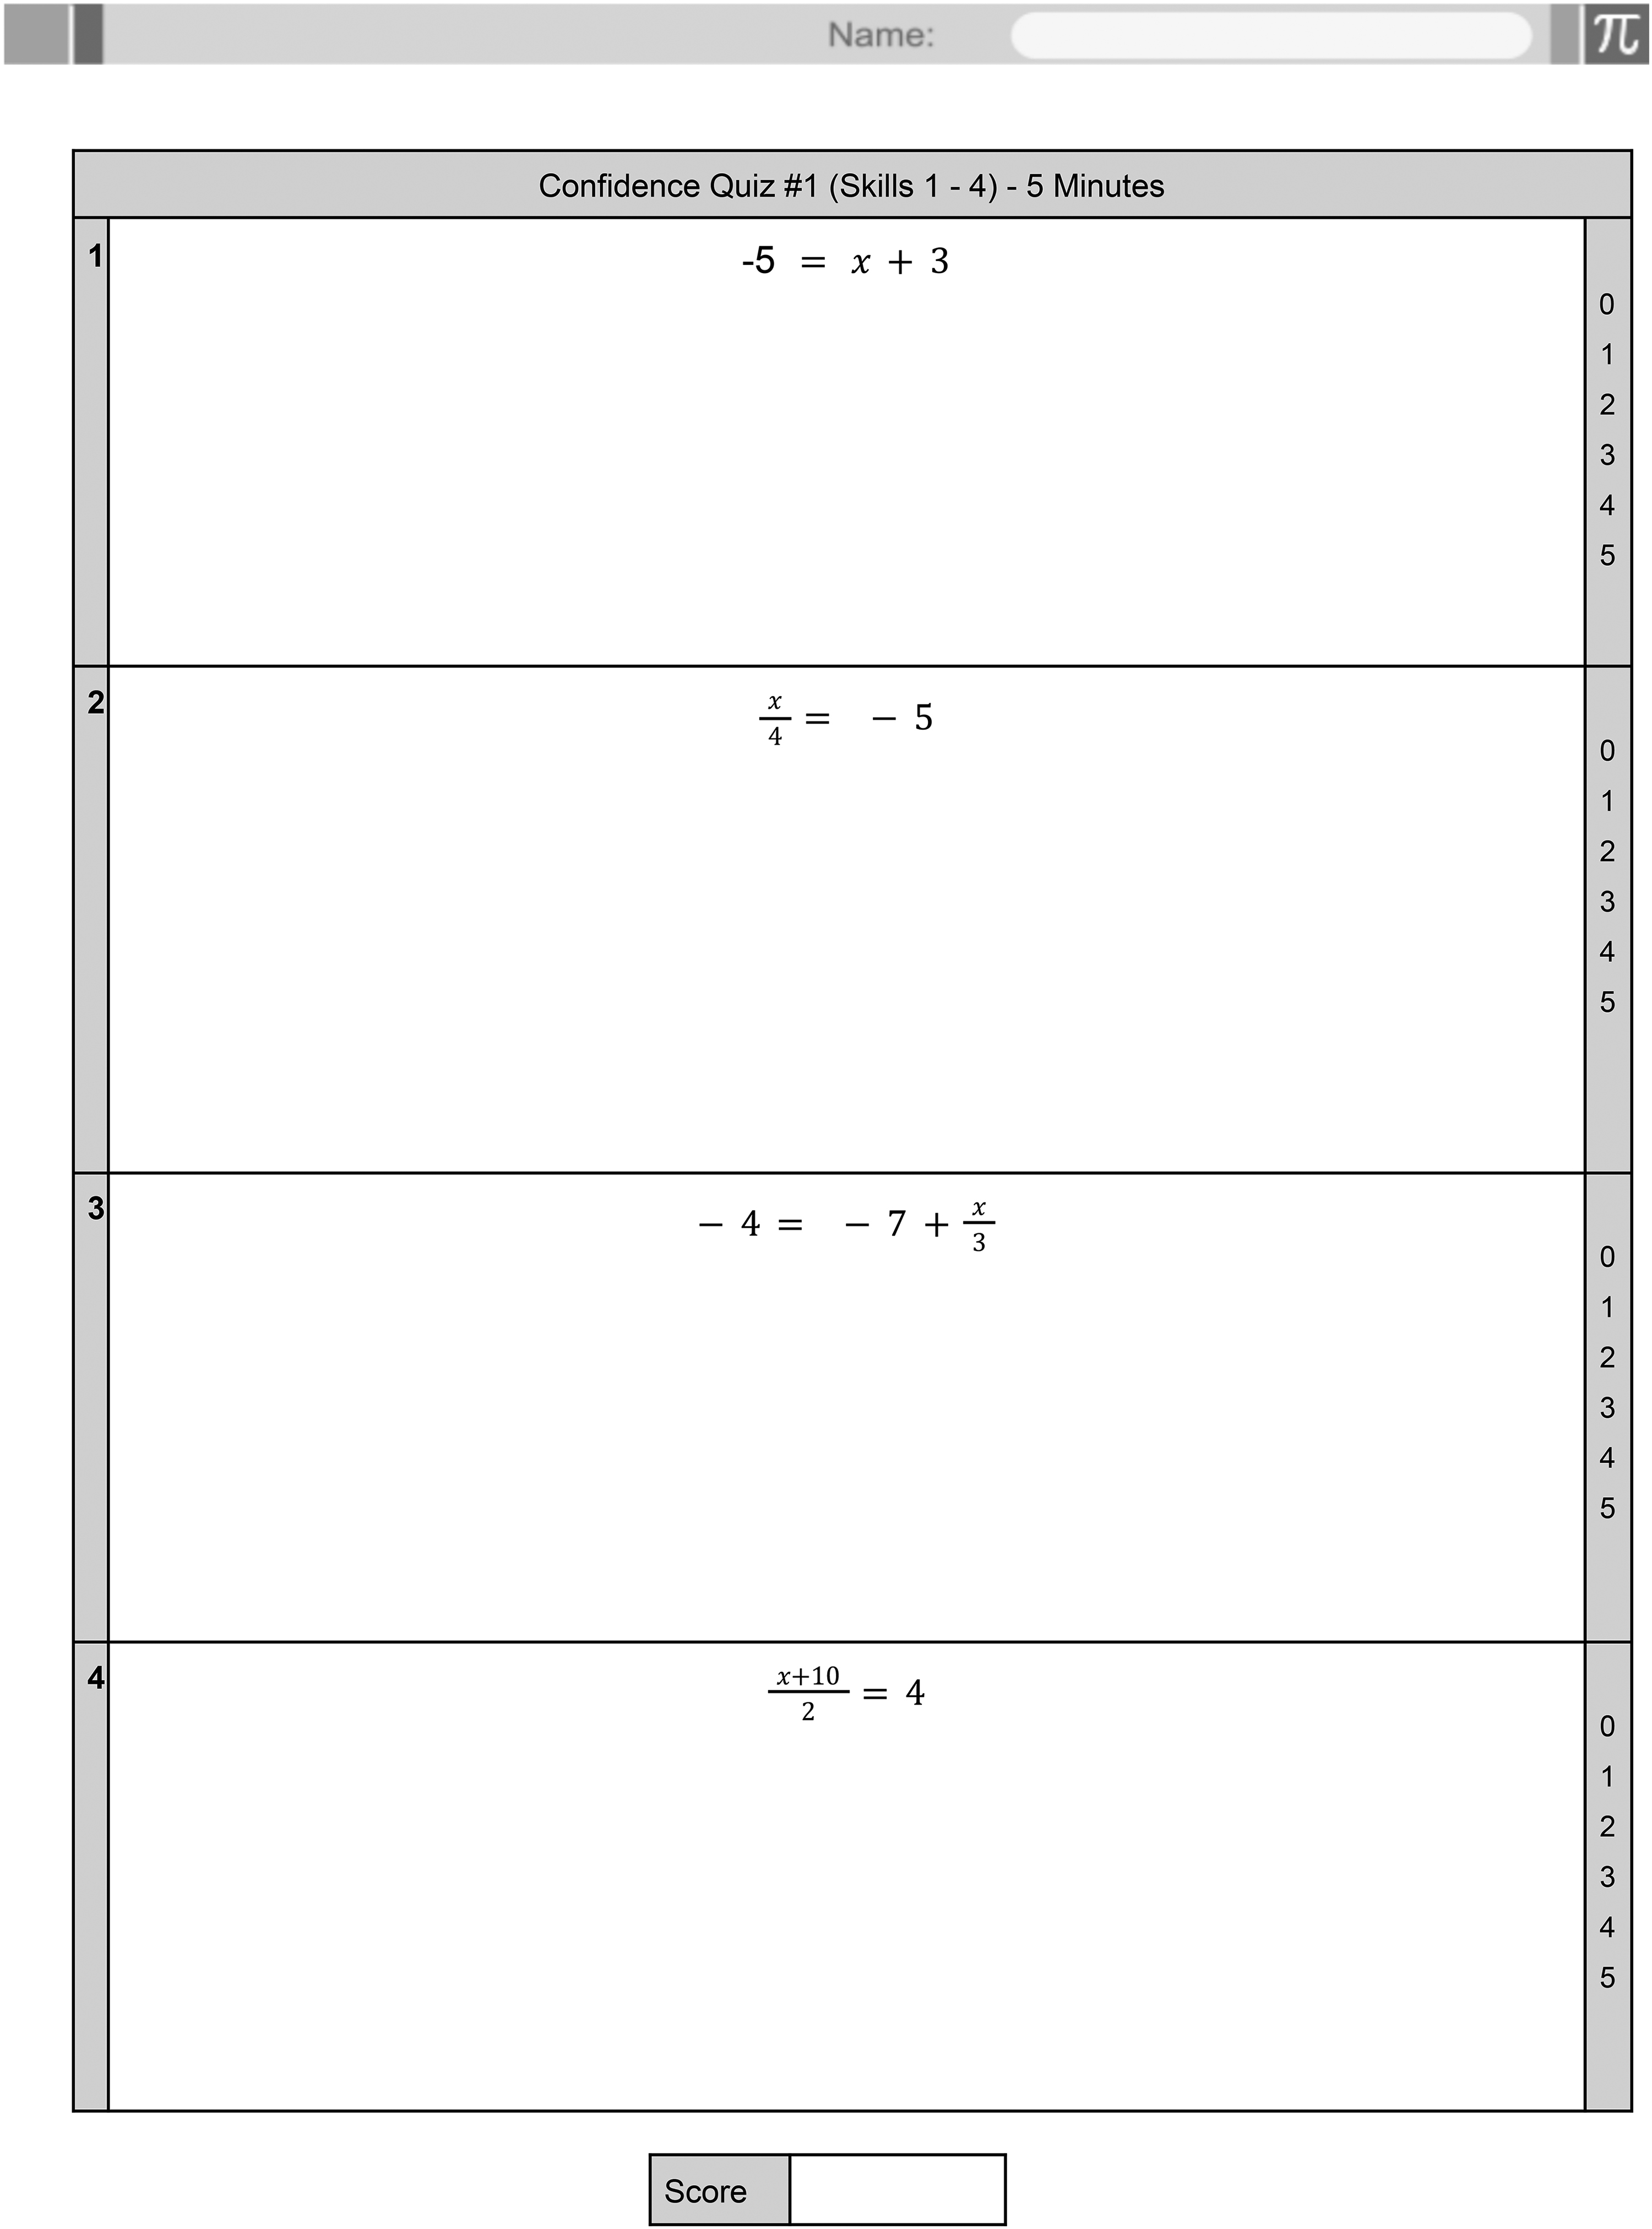
The format of Test 1 (the other tests were similar).
The equations used in the six assessments.
Before Assessment 1, the teachers explained to the students that their score on each assessment would be determined by how confident they were in their correct and incorrect answers. For each question, each student circled a confidence rating between 0 and 5. If a question was answered correctly, then they would add their confidence rating to their score, and if it was answered incorrectly, then they would subtract their confidence rating from their score. The teachers walked students through an example assessment which contained some correct and incorrect answers in order to show students how the confidence ratings would be added and subtracted. The students then discussed the idea that the maximum score for each assessment would be 20 points (from giving a maximum confidence rating of 5 on each of the 4 items, and answering every item correctly) and that the lowest possible score would be −20 (assigning a maximum confidence rating of 5 to each of the 4 items, but answering each item incorrectly).
Immediately after the students had finished each assessment, the teachers talked through the answers, and the students marked their own scripts and calculated their own confidence scores. It was stressed to the students that these assessments were formative and no/low-stakes, and the teachers believed that there was little to no incentive for students to cheat by changing answers afterwards. Nevertheless, the teachers oversaw this process closely and did not observe this happening. They did observe that students occasionally failed to add or subtract their confidence levels correctly, and they sometimes intervened to correct this. This was also checked during data processing.
Following Assessment 6 (the final assessment), the students were asked to complete individually a one-item online survey, which asked for an open response to the question: What do you think of using confidence assessment in mathematics?
Responses were collected and immediately anonymized by removing the students’ identifying email addresses before analysis.
The equations unit began in February 2023 and the data collection was completed by the end of March 2023.
The students’ scripts from each assessment were anonymized before analysis by obscuring the child's name from each script with a thick black marker pen. As the teacher did this, they also indicated gender as M or F (male or female), and all of the anonymized scripts were scanned before analysis. Data was collected at item level as the confidence rating, along with whether the item was answered correctly or incorrectly.
The qualitative survey data was analyzed using reflexive thematic analysis (Braun & Clarke, 2022). This began with reading all of the responses several times to ascertain possible themes, followed by detailed coding of each student's response, looking for themes that appeared several times. An overall “positive” or “negative” view of confidence assessment was also coded whenever this was unambiguously stated. Complete anonymized data, quantitative and qualitative, is available at https://doi.org/10.6084/m9.figshare.27302682.
Results
We present three analyses, each addressing one of the three research questions stated above (RQ1–3). Data preparation and cleaning were carried out using spreadsheet software, and quantitative data analysis was conducted using JASP 0.17.2 (JASP Team, 2023). Qualitative thematic analysis was conducted using spreadsheet software.
Calibration analysis (RQ1)
This analysis addresses RQ1: Do students become better calibrated after six uses of confidence assessment over a period of two months?
Scripts were obtained from 273 students and were coded as described above. Data from a total of 70 students were removed because these students had omitted more than two items across all of the assessments (mostly these were students who were absent for one or more of the assessments). This resulted in N = 203 for the main quantitative analysis. The overall attrition of 26% is less significant than it may seem, as this is cumulative across six assessments, with any student who was absent for one or more assessments having their entire data removed from the study. For example, hypothetically, 95% attendance distributed randomly at each assessment would lead to
On each assessment, each student answered four items. In order to make accuracy directly comparable with confidence, on the same 0–5 scale as the confidence scores, students’ accuracy scores were entered as 0, 1.25, 2.5, 3.75, or 5, for students who obtained 0, 1, 2, 3, or 4 items correct, respectively. This is a uniform 5-point scale across the 0 to 5 interval.
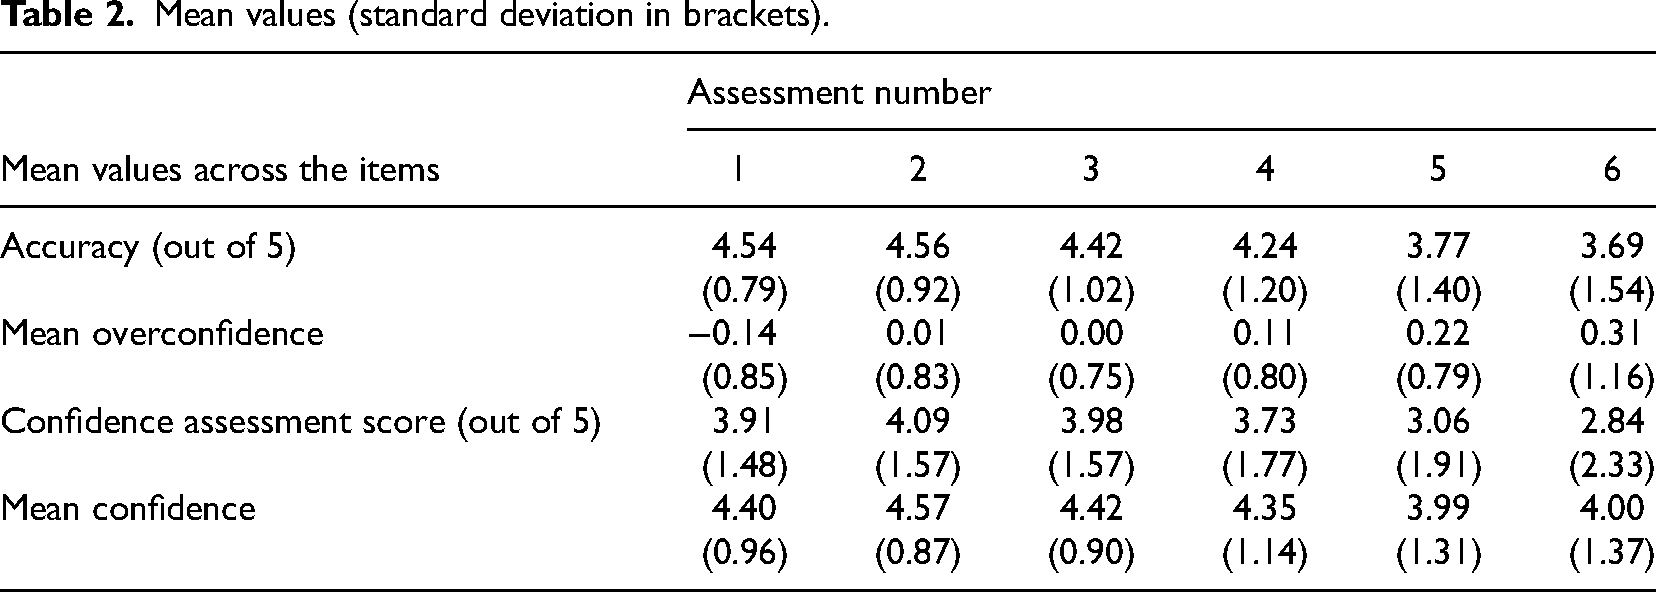
We calculated the (signed) mean overconfidence for each participant in each assessment by subtracting their accuracy from their confidence on each item and dividing by 4 (the number of items in each assessment). This indicates the mean discrepancy between accuracy and confidence for each student across all four items in the assessment. Negative values correspond to under-confidence and positive values to overconfidence.
Table 2 shows these values, along with the means of the following:
The confidence assessment scores that the students calculated (i.e., the confidence ratings of the items that were correct minus the confidence ratings of the items that were incorrect); The mean of the confidence ratings on all of the items in each assessment, regardless of whether the items were correct or incorrect.
Mean values (standard deviation in brackets).
Mean values (standard deviation in brackets).
Table 2 reveals an overall downward trend in both accuracy and confidence as the assessments became more challenging.
We judged students’ calibration in three complementary ways:
First, we calculated the Pearson’s product moment correlation coefficient between the accuracy and the mean total confidence for each assessment. This gives a measure of average calibration, with stronger correlation corresponding to better calibration.
Second, we calculated the absolute difference between the accuracy and mean confidence for each participant in each assessment. This quantity represents another way of attempting to capture students’ calibration; this time, smaller absolute differences correspond to better calibration. These values are given in Table 3 and are presented in scatterplots in Figures 3 and 4.
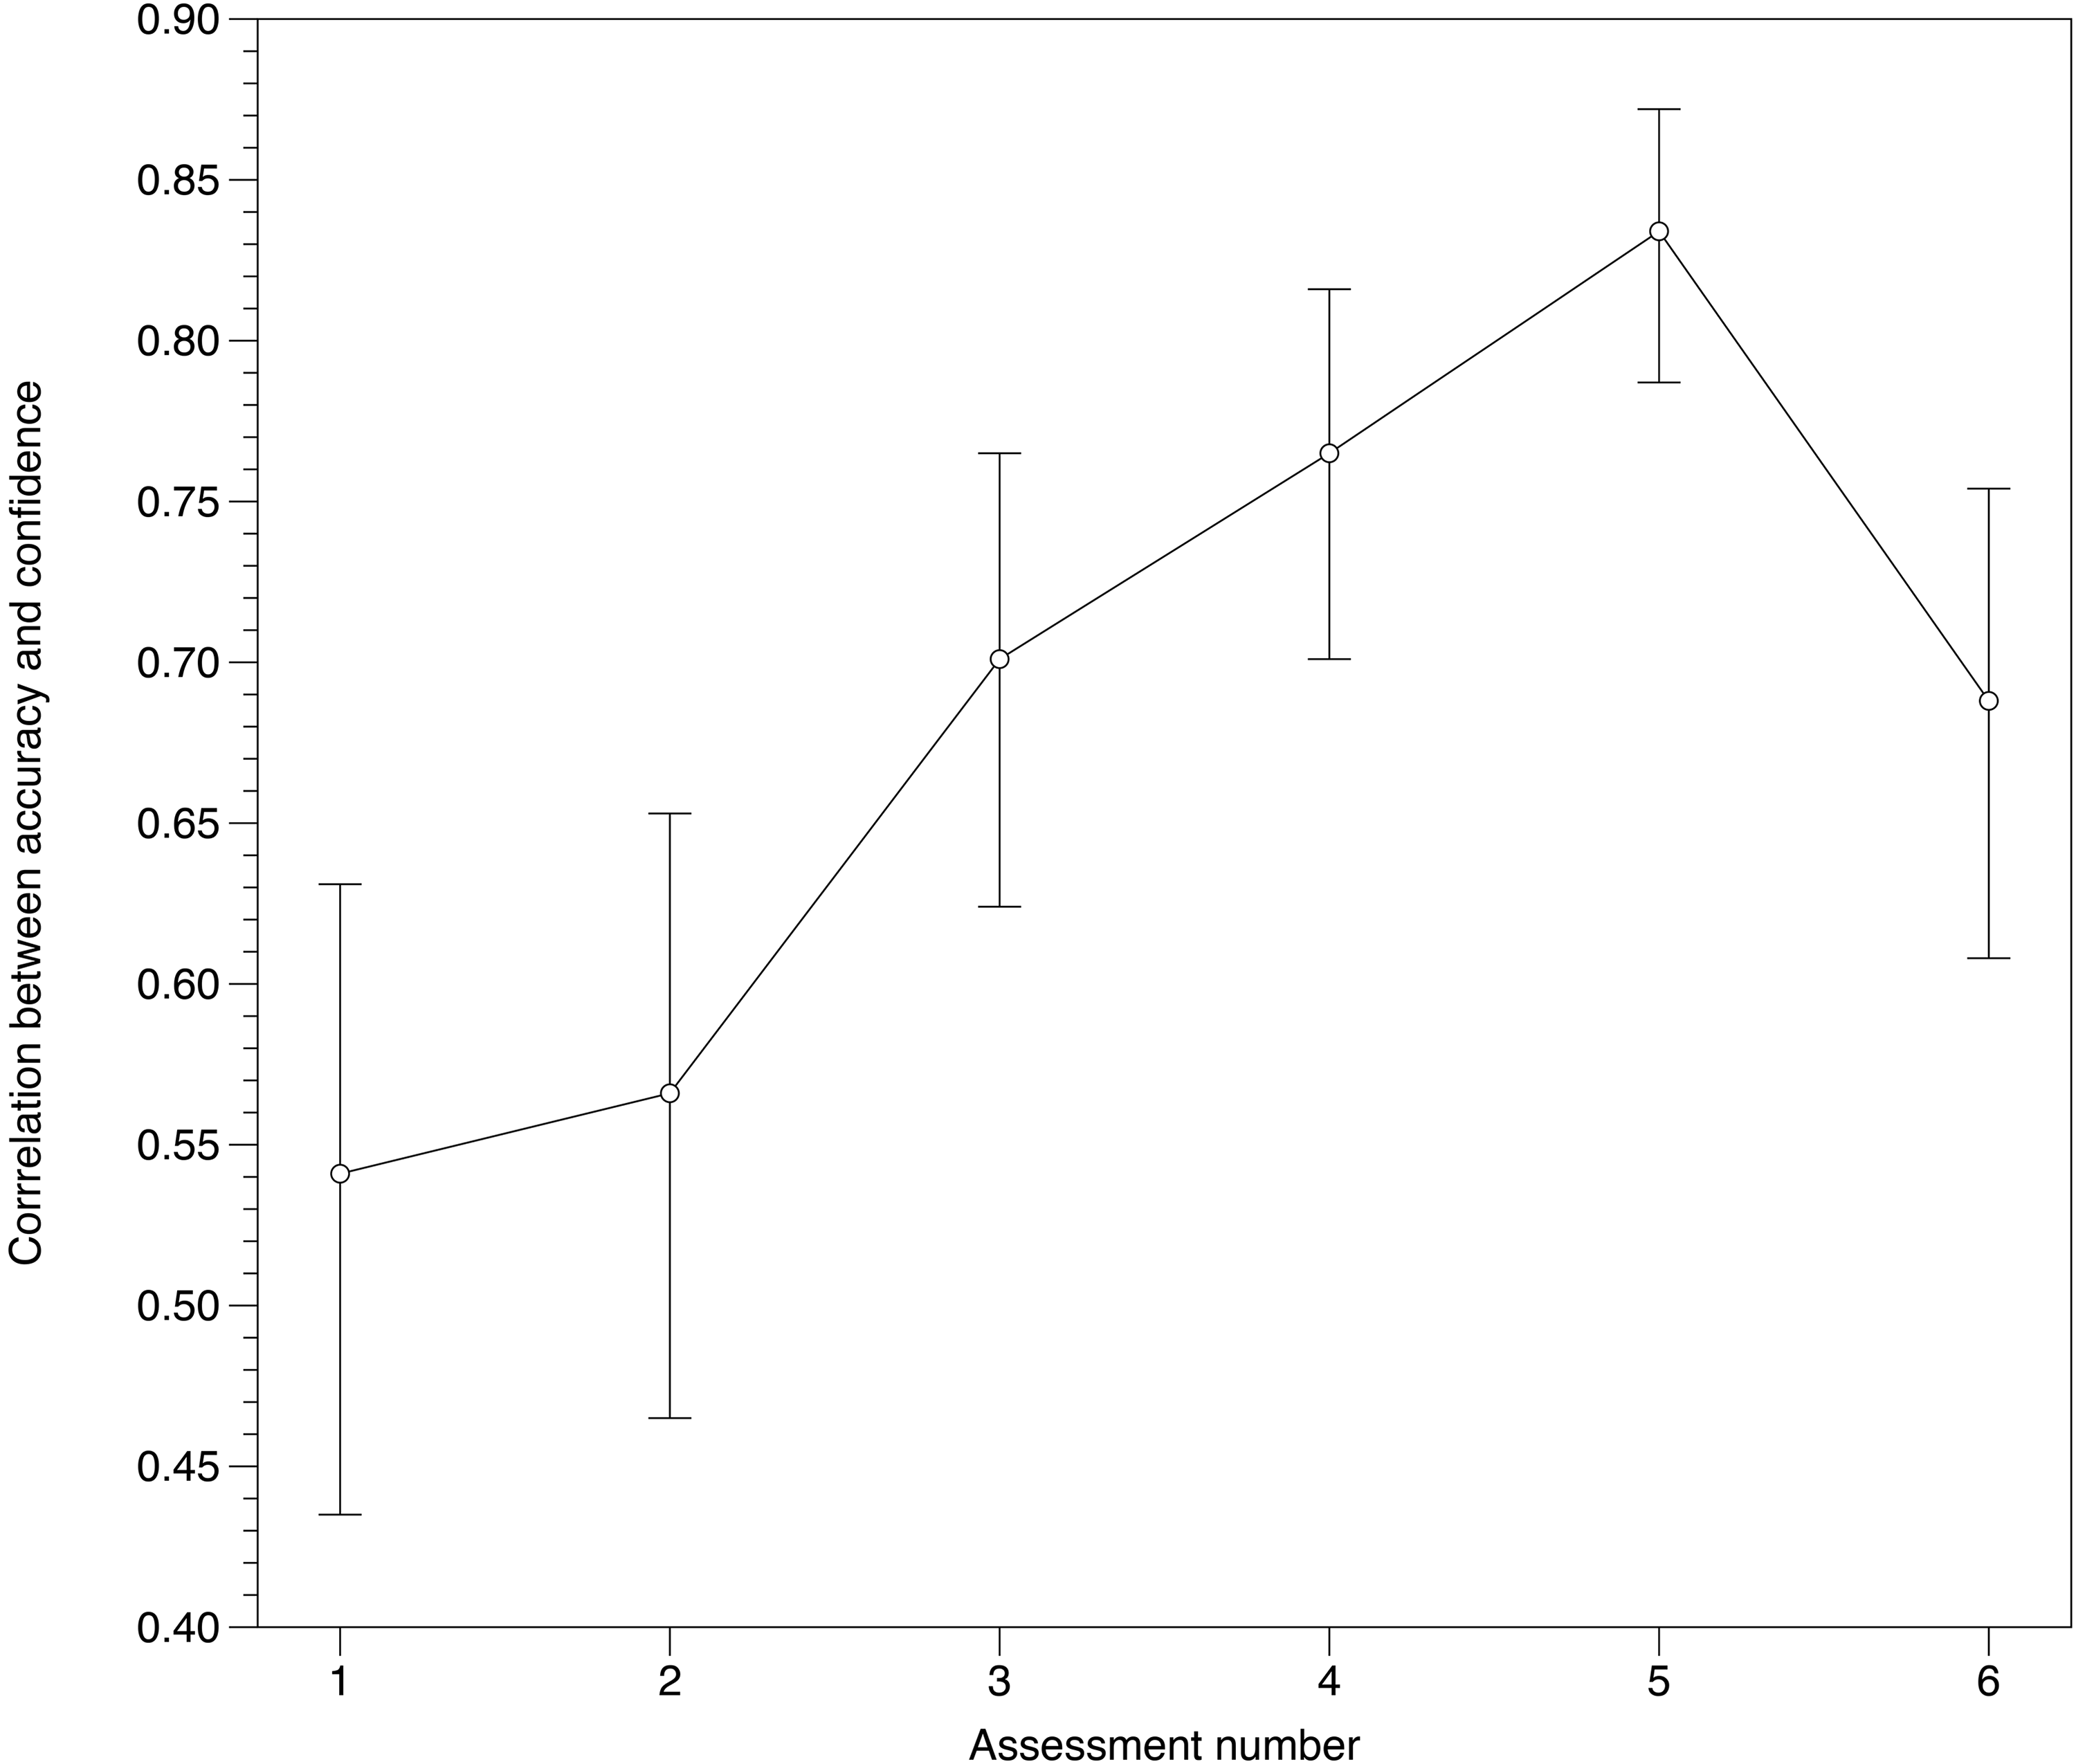
The correlation between accuracy and confidence across the six assessments (larger values indicate better calibration) (error bars show 95% confidence intervals).
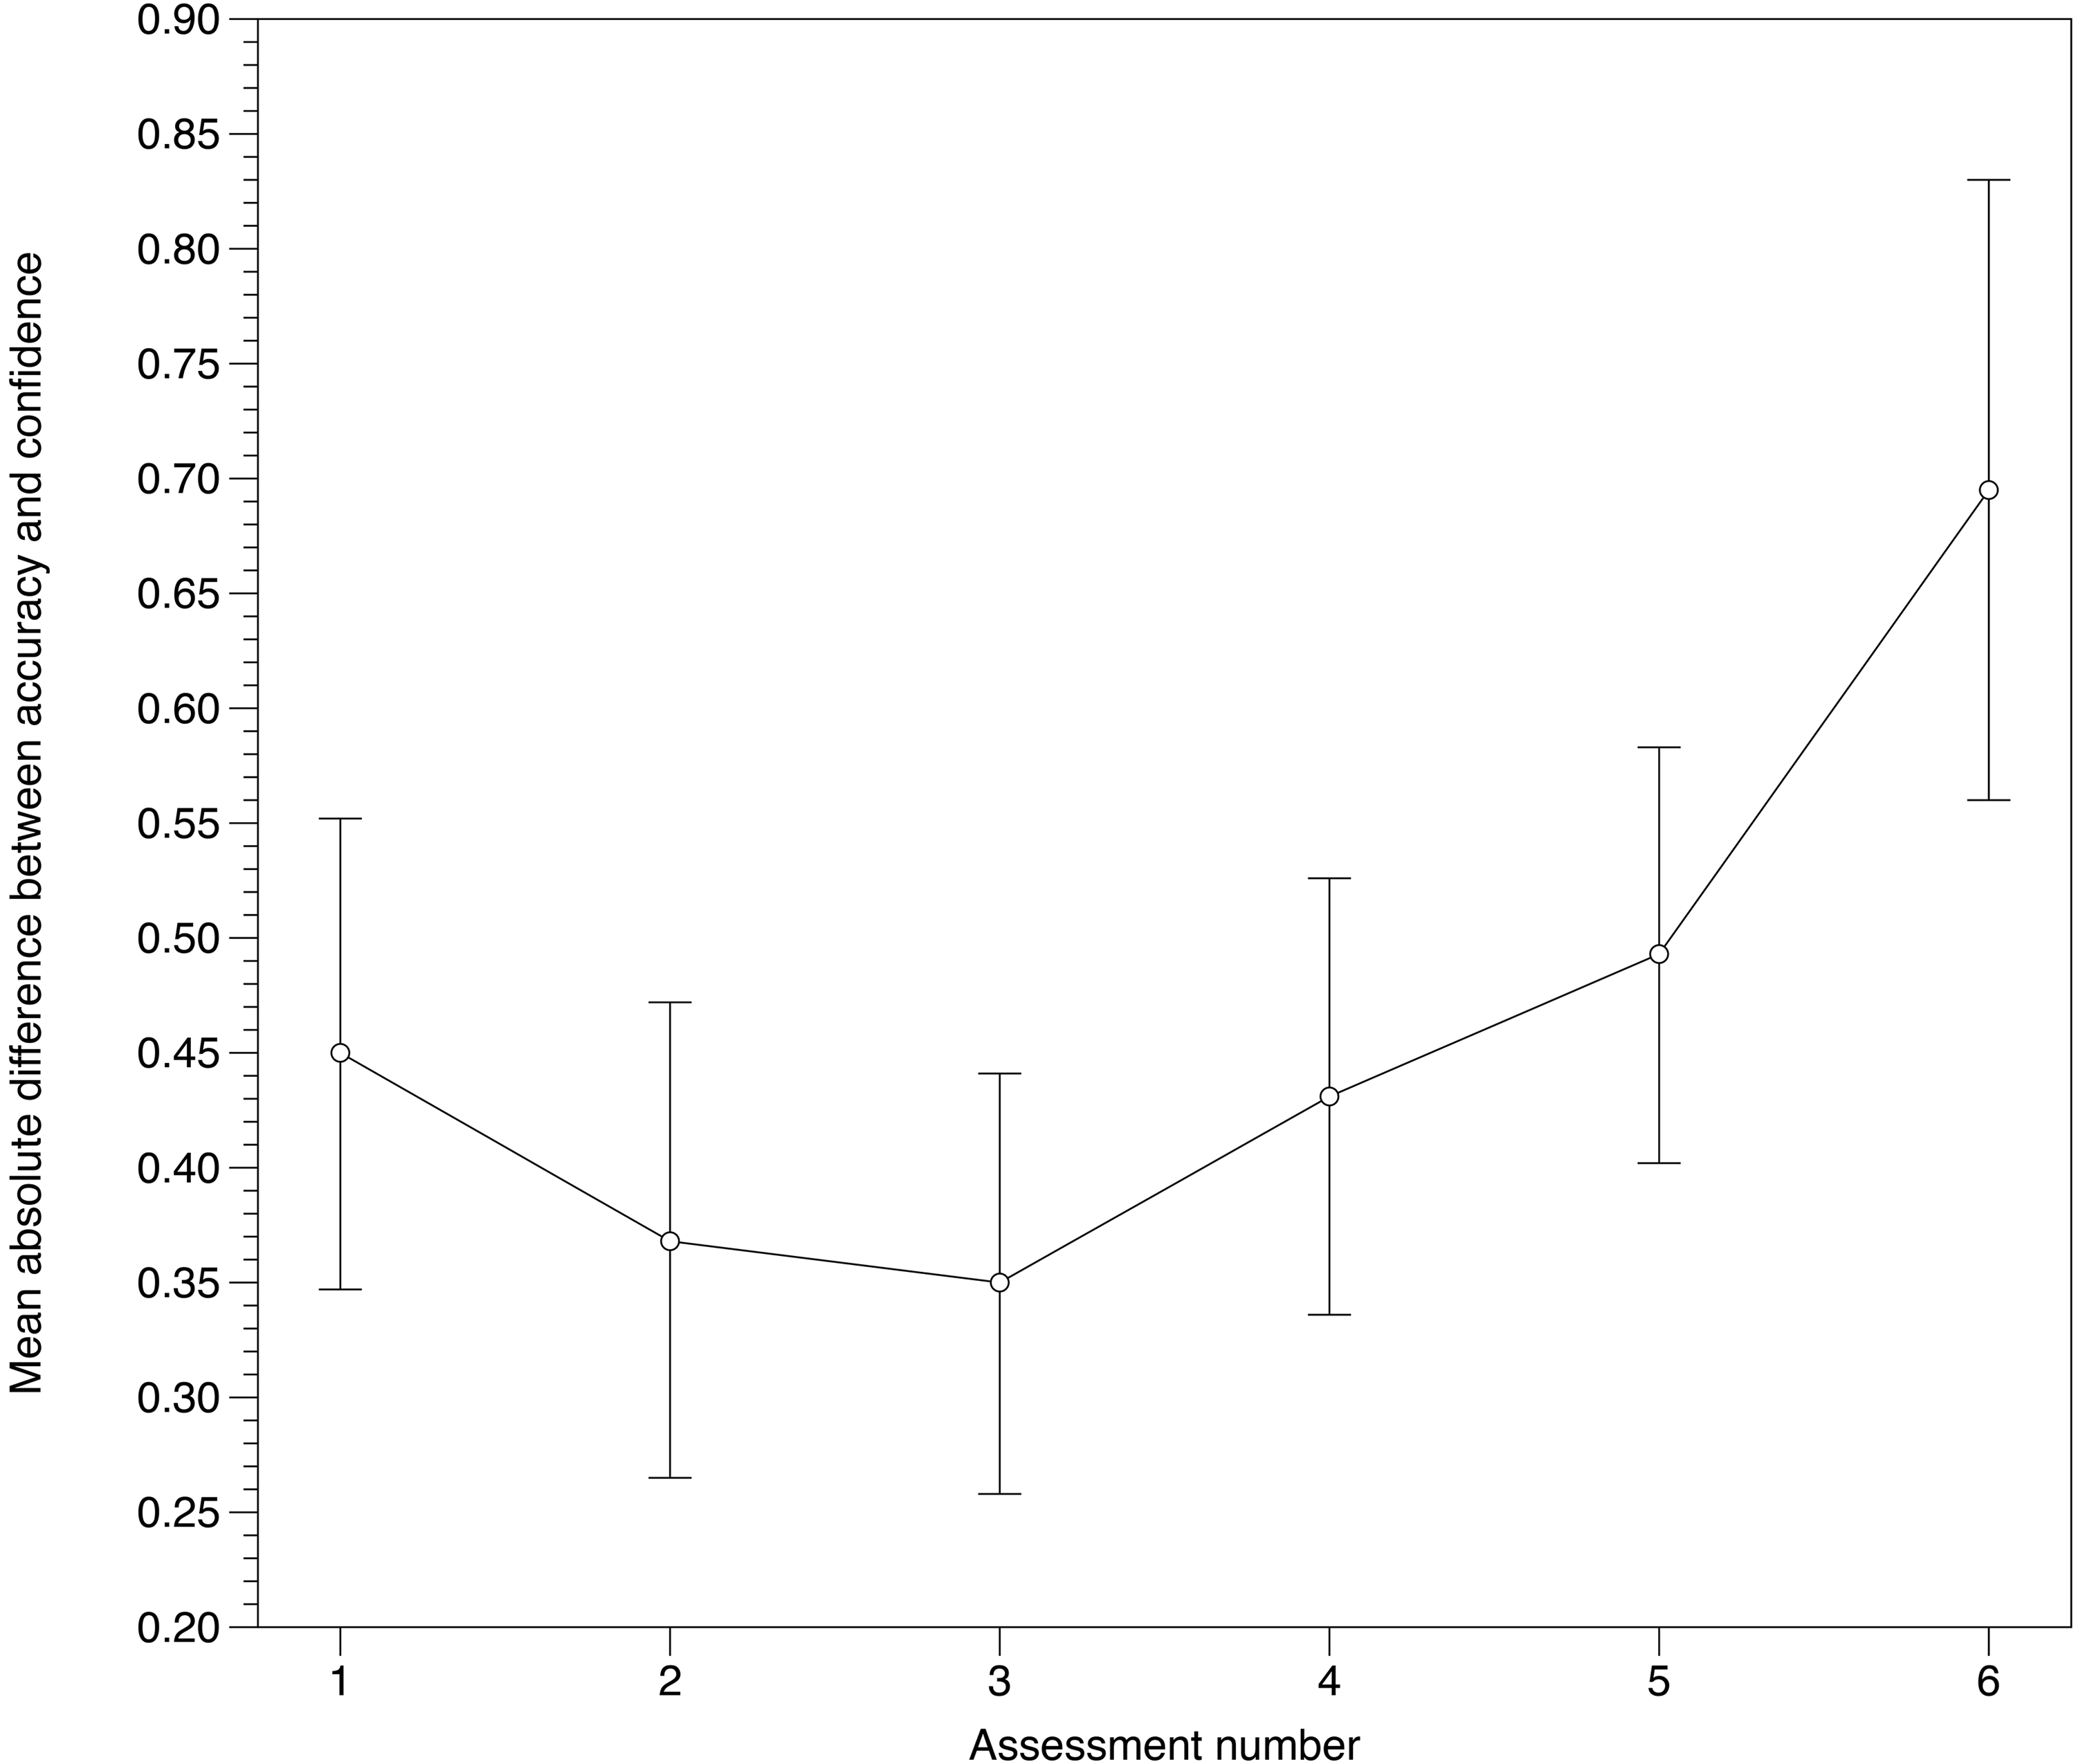
The mean absolute difference between accuracy and confidence across the six assessments (smaller values indicate better calibration) (error bars show 95% confidence intervals).
Measures of calibration (standard deviation in brackets).
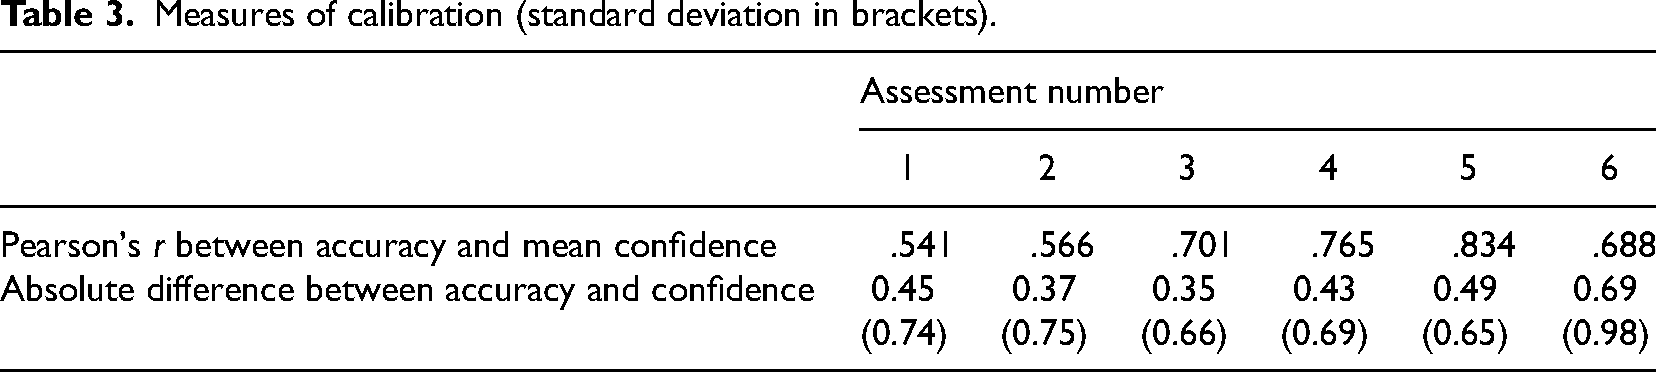
All of the values for both of these calibration measures were statistically significantly different from zero. Both measures indicate some initial improvement in calibration, followed by later deterioration, particularly in the final assessment. Figure 3 shows the correlation increasing until Assessment 5, indicating improved calibration, and then dropping for Assessment 6. Figure 4 shows the mean absolute difference between accuracy and confidence decreasing until Assessment 3, indicating improved calibration, and then increasing for the remaining assessments.
Our final way of exploring changes in students’ calibration across the six assessments was to investigate the (signed) mean overconfidence. This increased from −0.144 (SD = 0.854) in Assessment 1 to 0.219 (SD = 0.787) in Assessment 5 (t(202) = 4.825, p < .001, Cohen's d = 0.339 [95% CI 0.197, 0.480]). (We used Assessment 5 as the end-point measure for this, rather than Assessment 6, because of Assessment 6's unusual properties in the other analyses, but similar results were obtained when replacing Assessment 5 with Assessment 6.) The scatterplot in Figure 5, showing the relationship between overconfidence in the two assessments, shows that students with more extreme over- or -under-confidence moved closer toward calibration (the center). The slope of the regression line is 0.136 (SE = 0.064, t =2.120, p = .035), which is considerably smaller than 1, showing that the difference between two students’ over-confidence in Assessment 5 is on average considerably smaller than it was in Assessment 1.
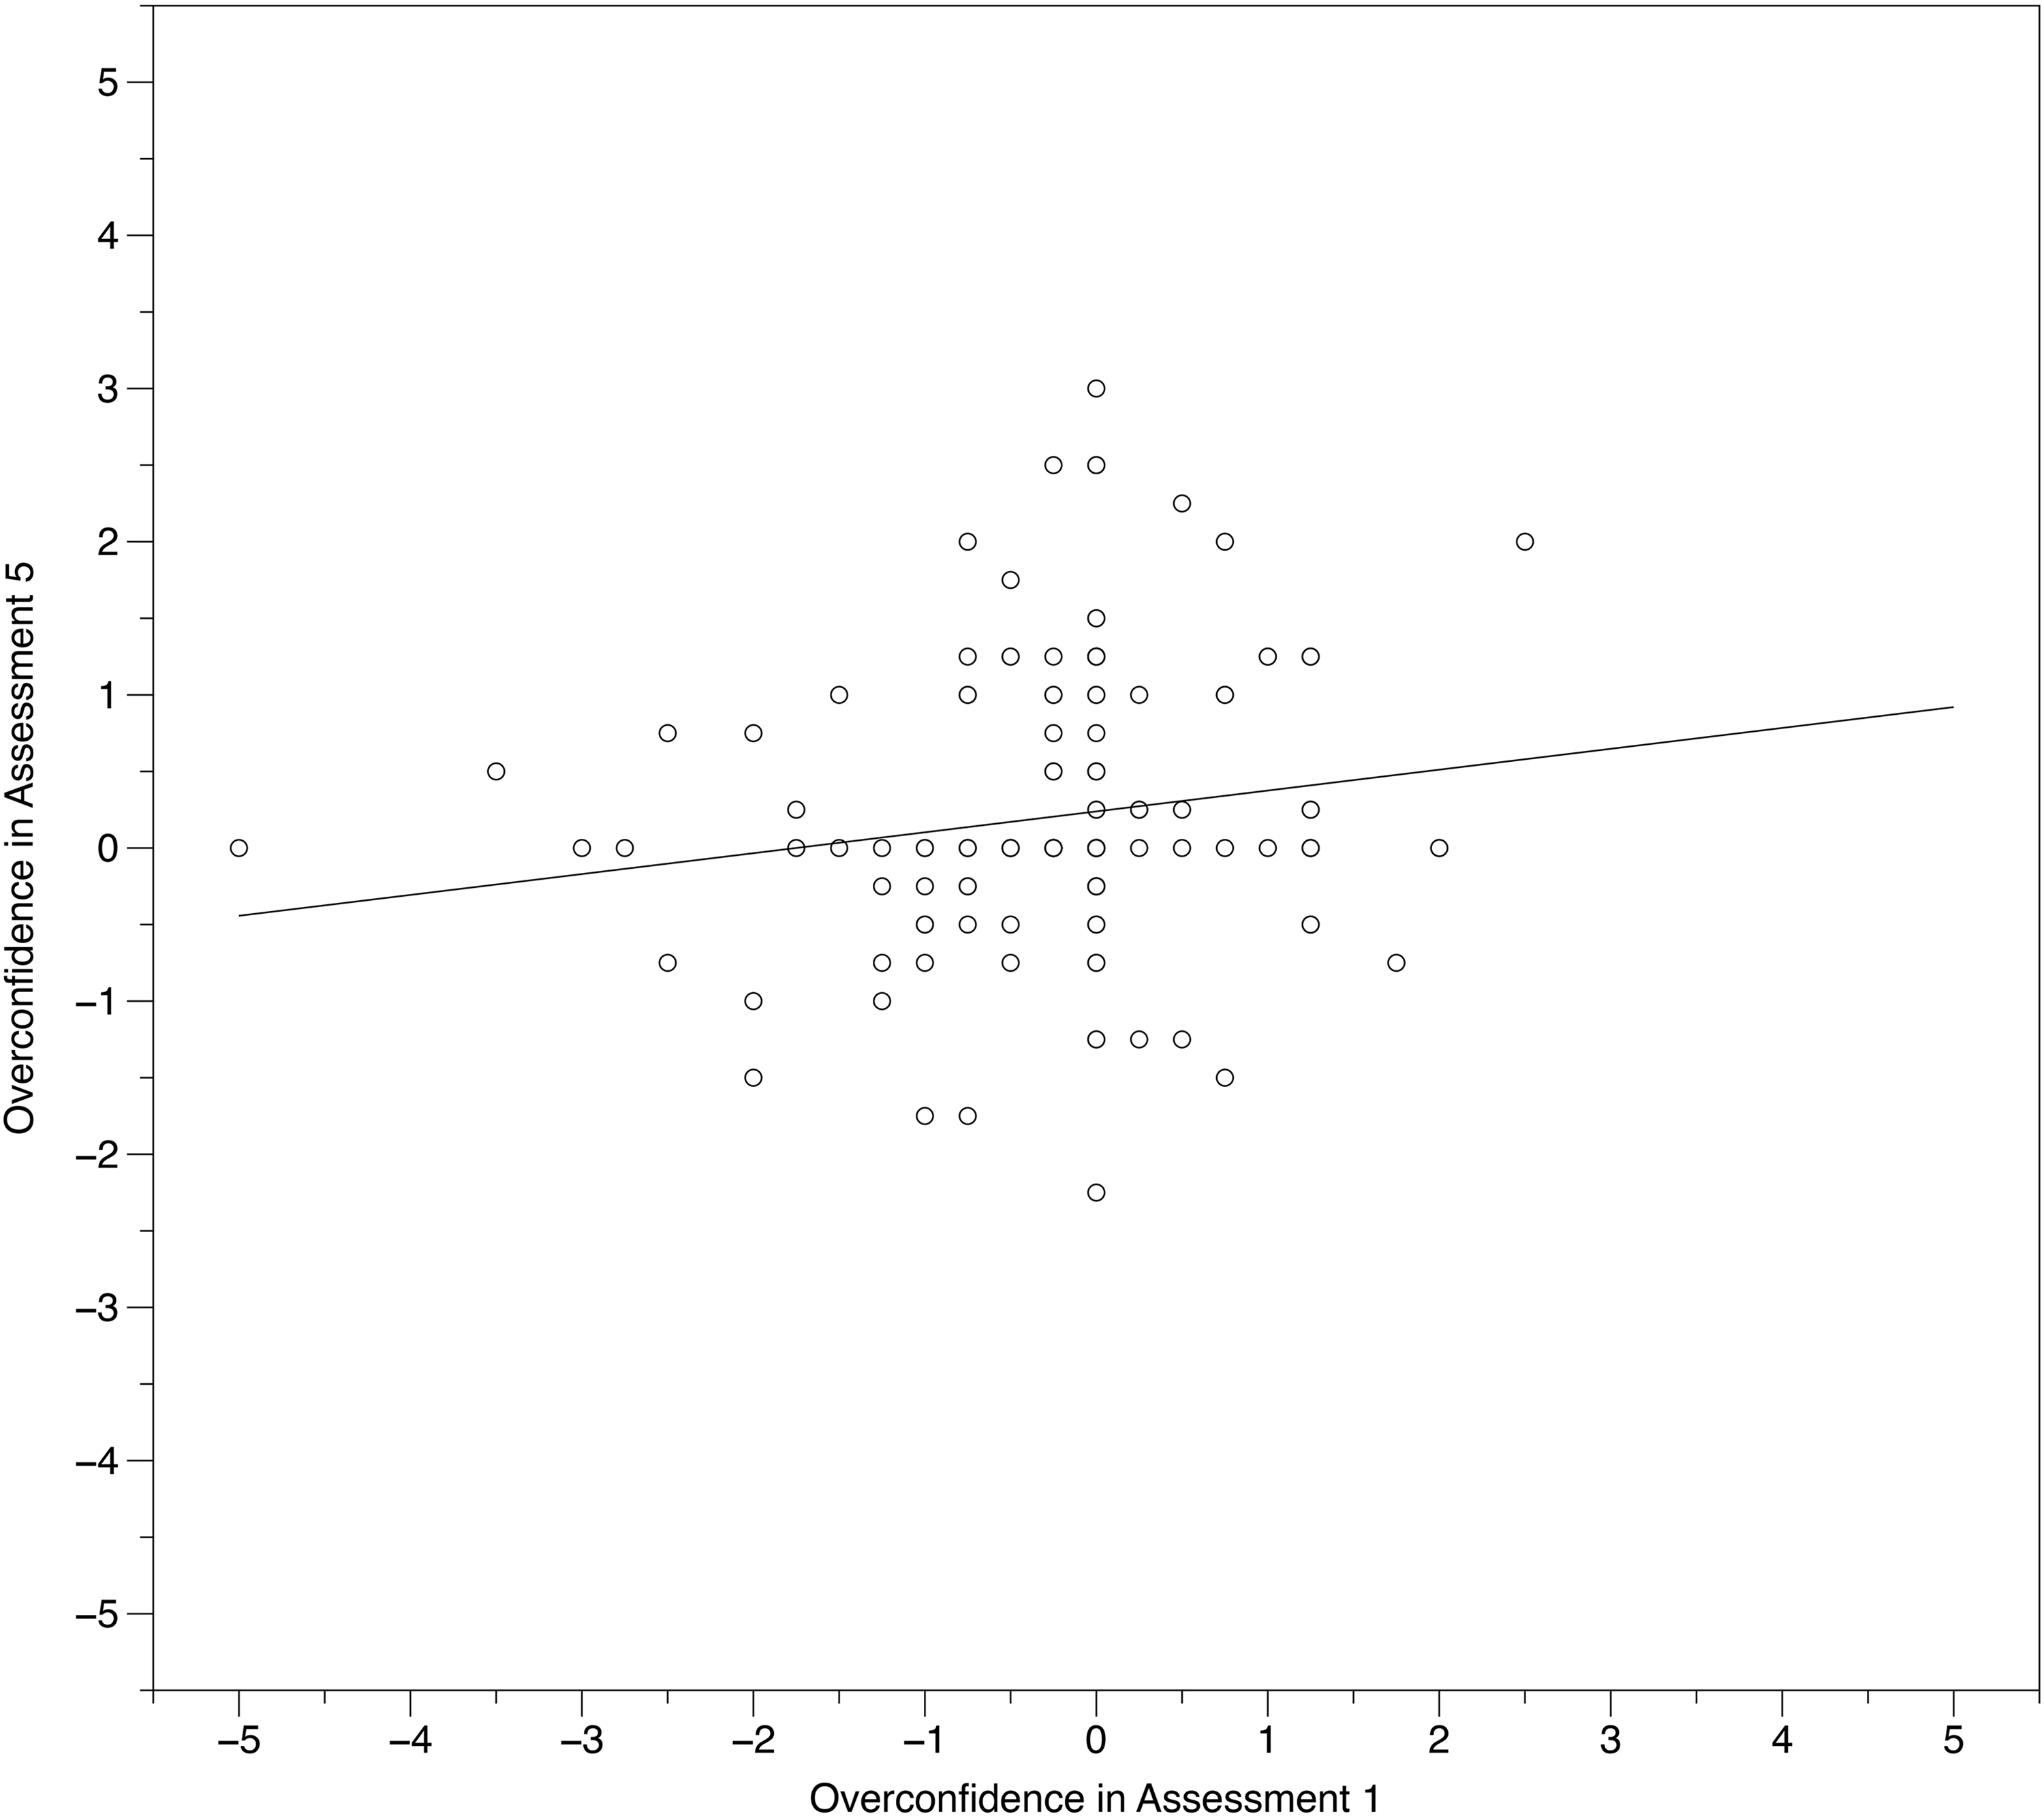
Scatterplot of overconfidence in Assessment 5 against overconfidence in Assessment 1.
Overall, we conclude that there was a general improvement in students’ calibration across the first 5 assessments, but this reversed by Assessment 6.
This analysis addresses RQ2: Do girls and boys show different profiles in their calibration over this period?
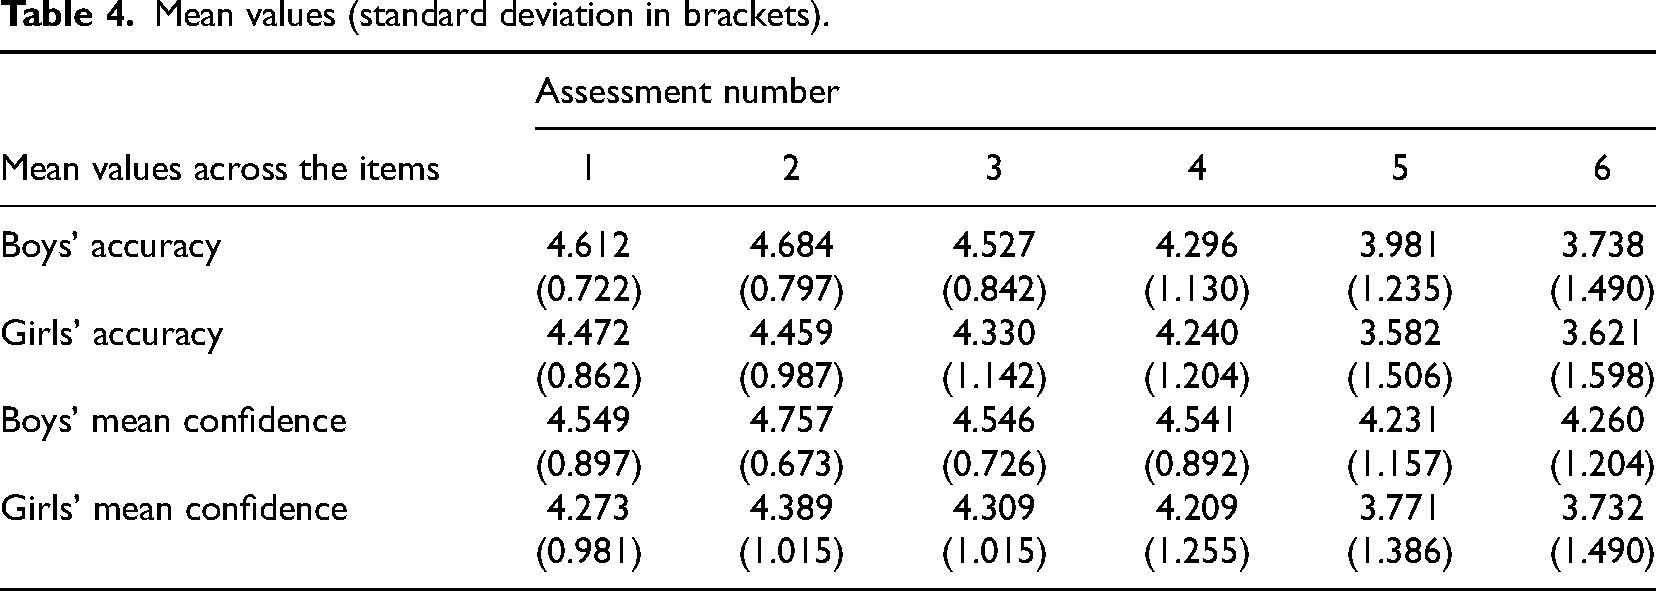
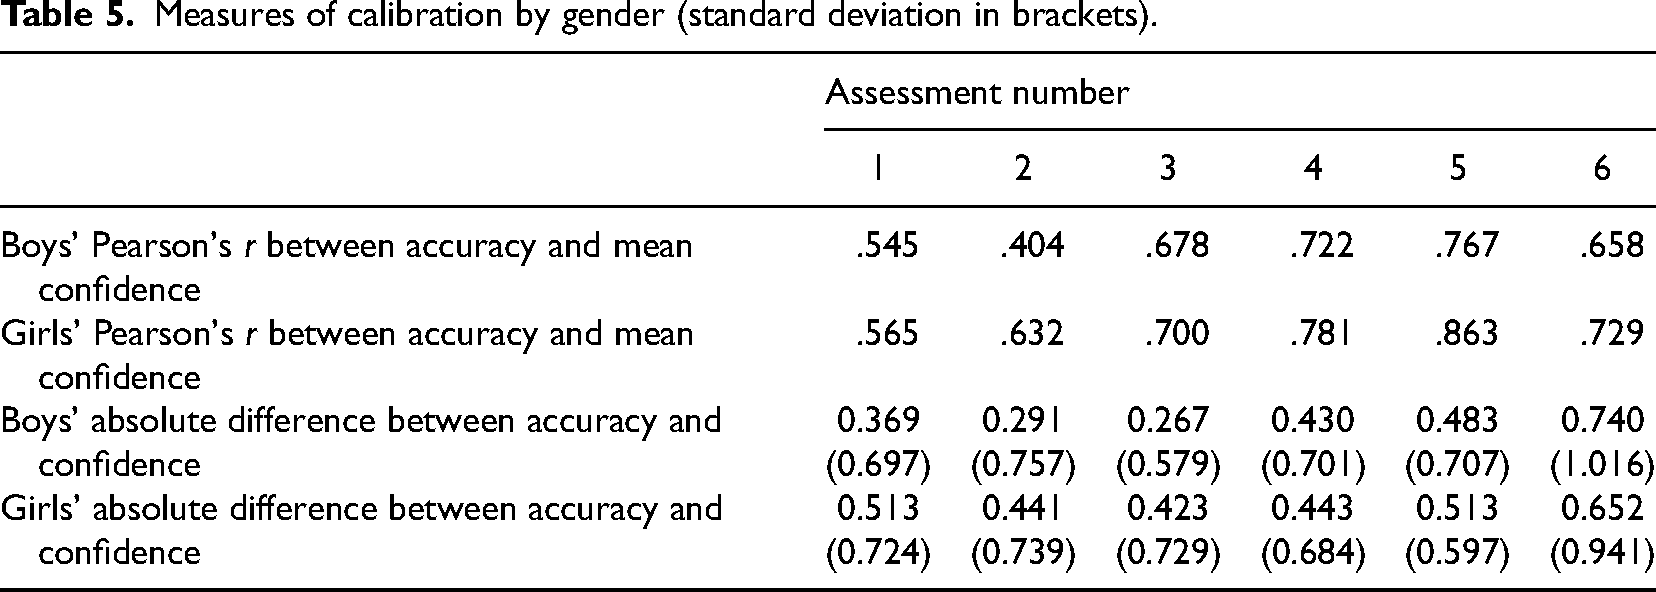
Of the 203 scripts used in the main quantitative analysis, 3 did not state gender, leaving N = 200 for the gender analysis, of whom 103 identified as girls and 97 as boys. Table 4 shows accuracy and confidence by gender, and Table 5 shows the correlations and absolute differences, exactly as in the analysis for RQ1, but by gender. Figure 6 plots the correlations between accuracy and confidence for each gender and Figure 7 shows the mean absolute difference between accuracy and confidence for each gender.
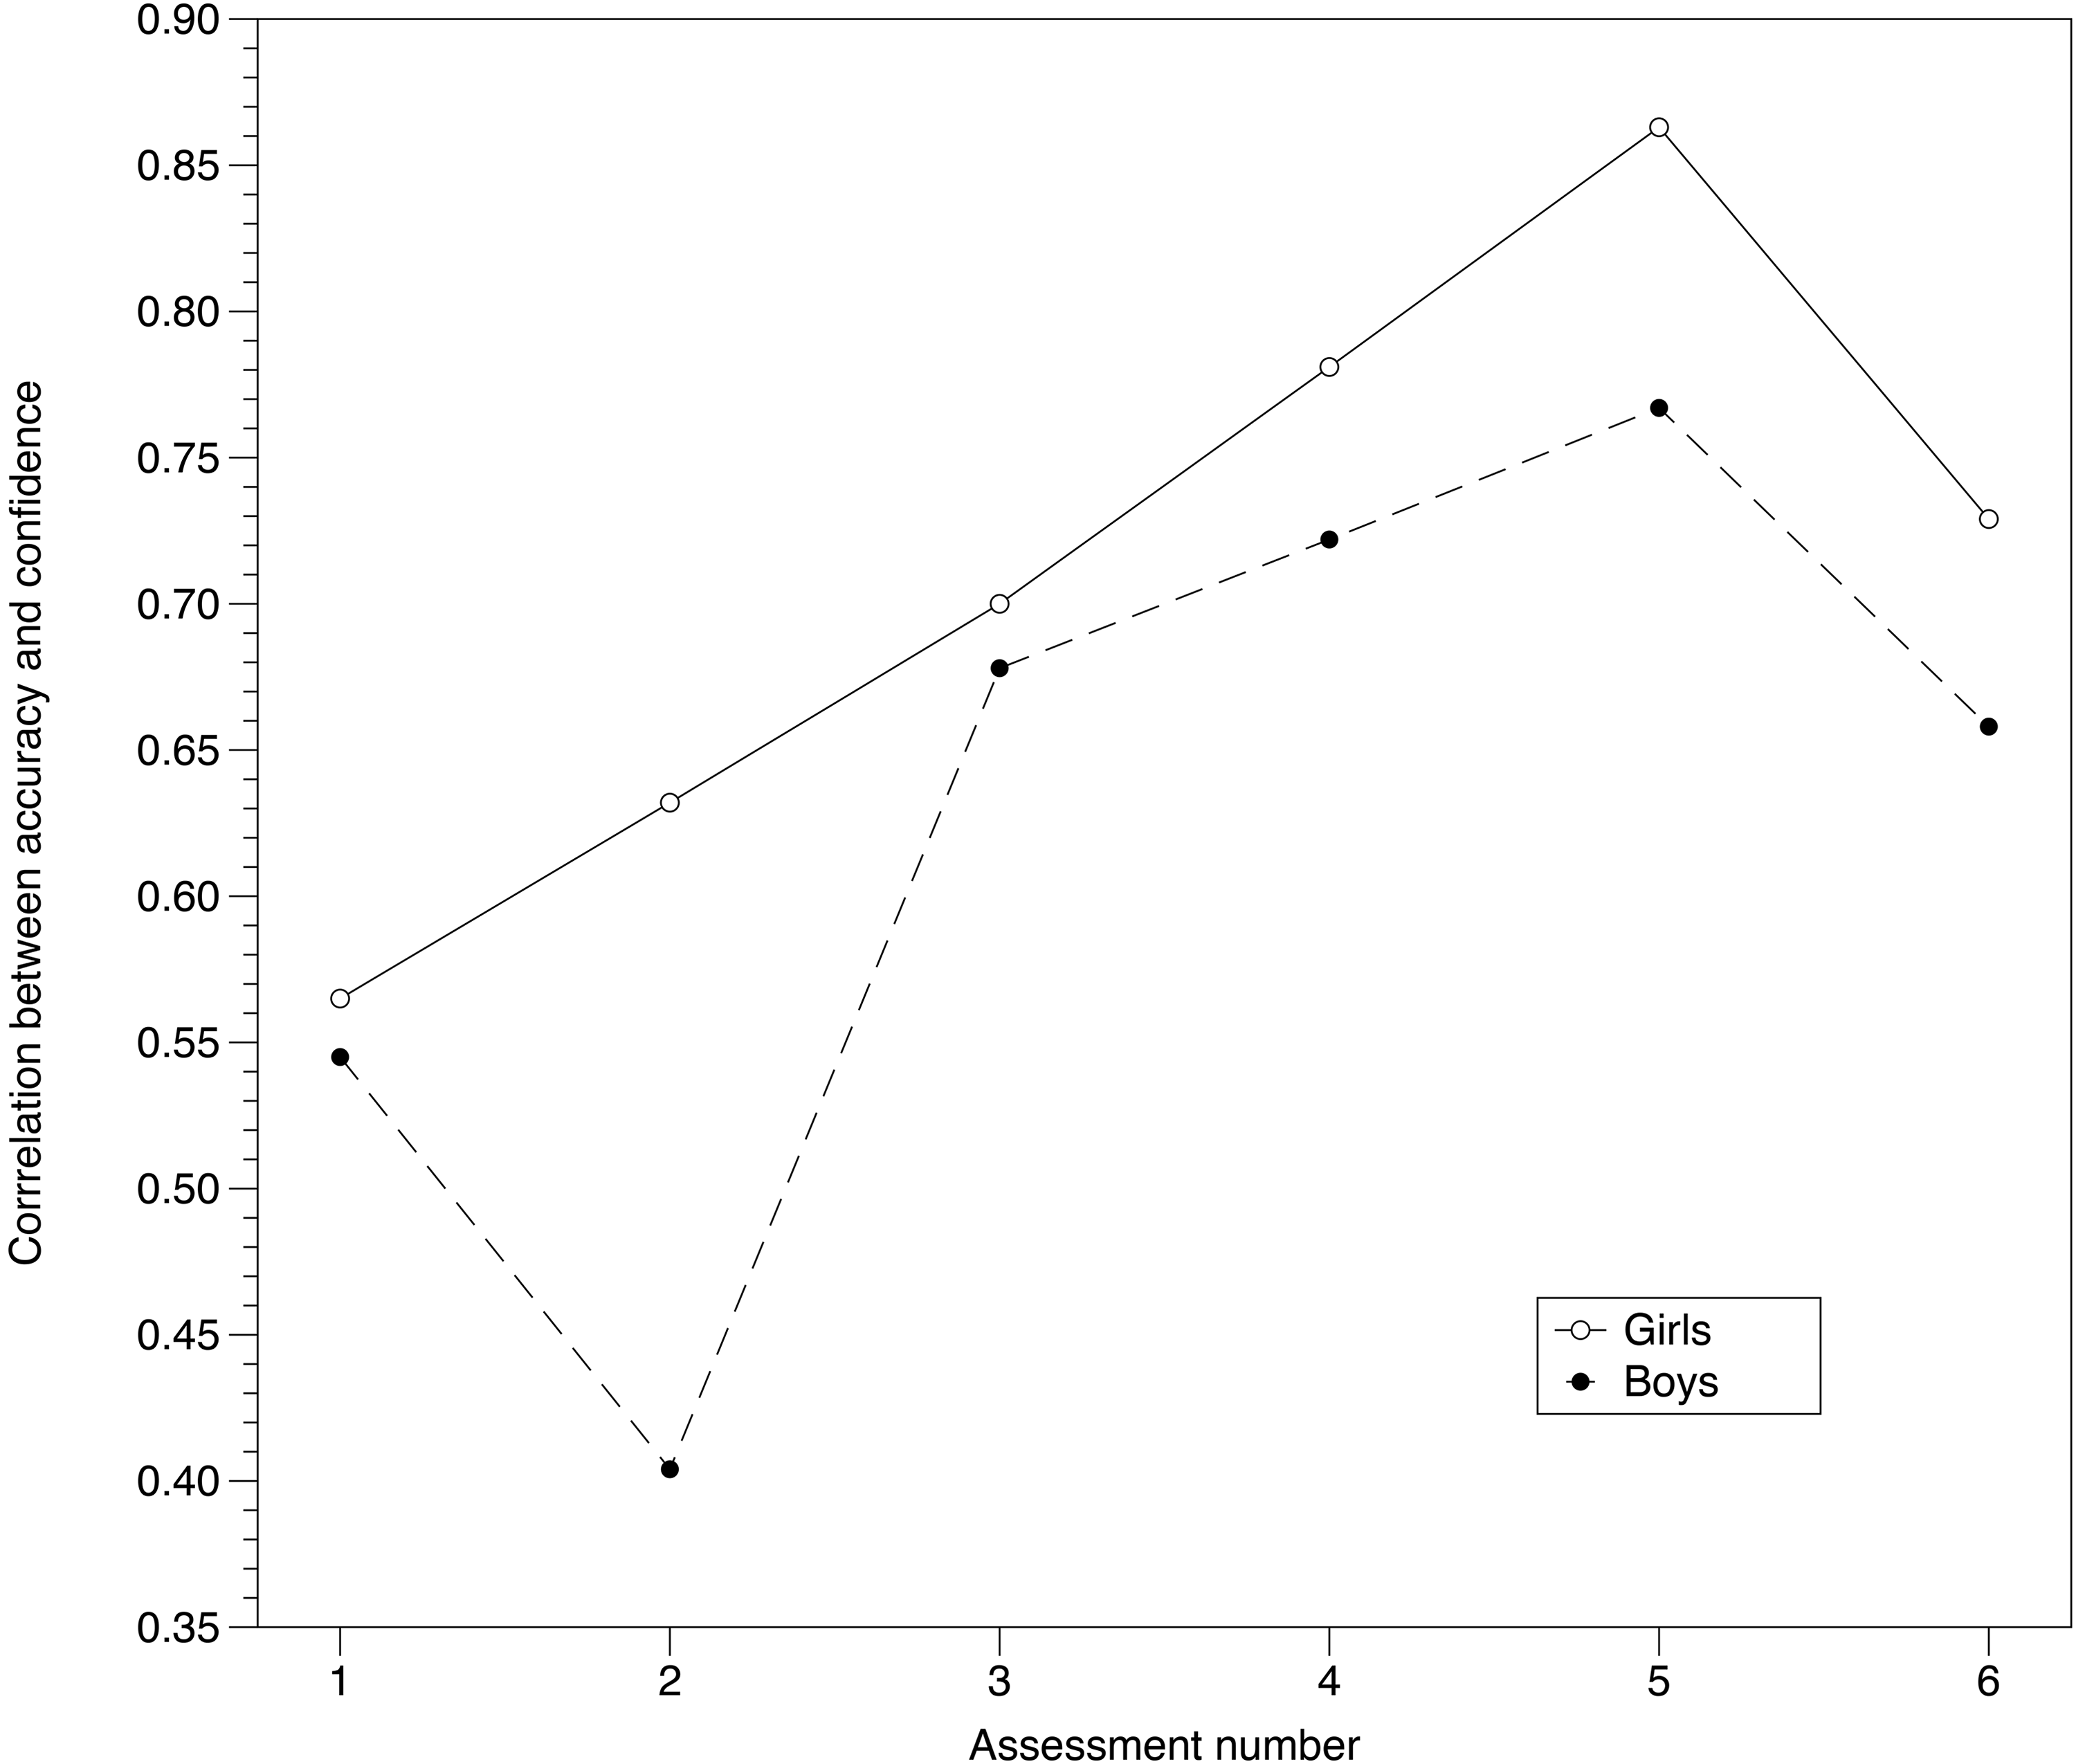
The correlation between accuracy and confidence for each gender.
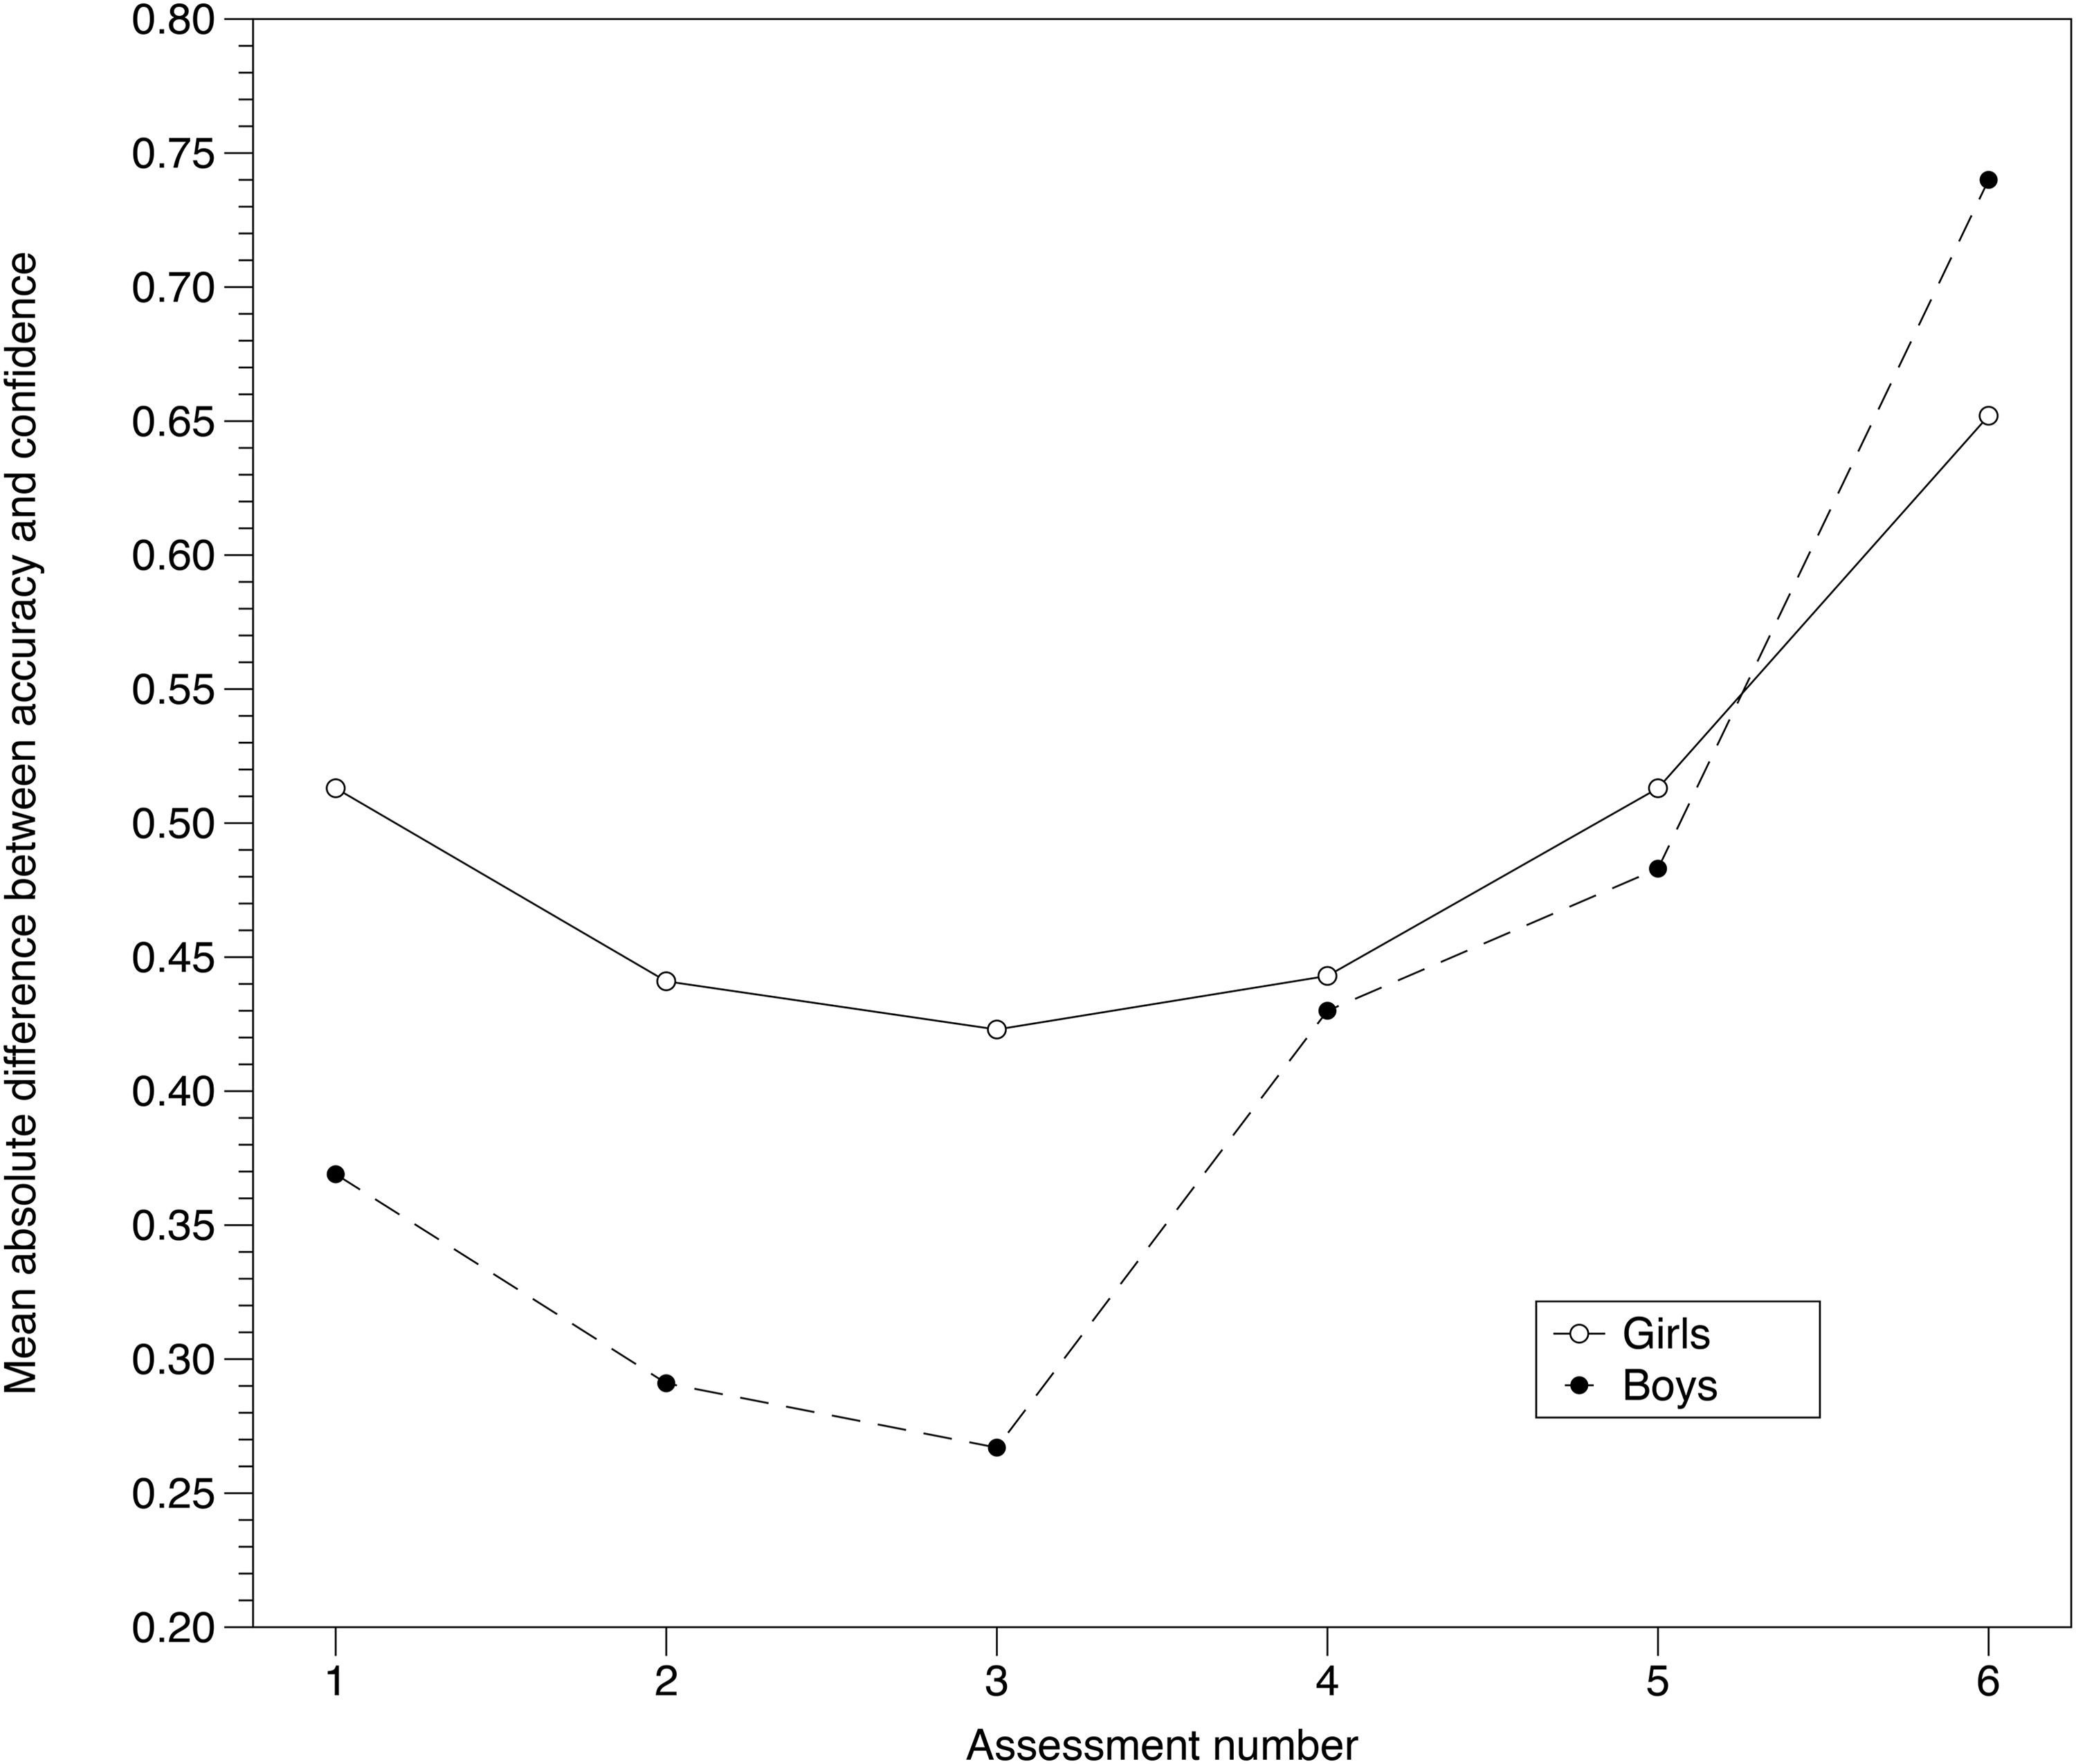
The mean absolute difference between accuracy and confidence for each gender.
Mean values (standard deviation in brackets).
Measures of calibration by gender (standard deviation in brackets).
Mean accuracy across the six assessments was not significantly different between boys (M = 4.306, SD = 0.731) and girls (M = 4.117, SD = 0.902), t(198) = 1.632, p = .104. However, mean confidence across the six assessments was higher for boys (M = 4.481, SD = 0.706) than for girls (M = 4.114, SD = 1.031), t(198) = 2.950, p = .004), with Cohen's d = 0.417 (95% CI 0.137, 0.697).
We conclude that there is no evidence for a gender difference in accuracy but there is a gender difference in confidence, with boys showing greater confidence on average. Both boys and girls show similar calibration trends, generally involving improvement followed possibly by deterioration in the later assessments.
This analysis addresses RQ3: What are students’ opinions on confidence assessment after using it over a period of two months?
Qualitative methods were used to analyze the responses to the single-item survey question, which asked: What do you think of using confidence assessment in mathematics? Anonymized responses were received from 150 of the original N = 273 students (55%). The comments made ranged in length from 1 word to 142 words (M = 24.6 words, SD = 21.8 words). These were coded for overall positive or negative perception of confidence assessment, and the overwhelming majority of the comments were positive (N = 127, 84.7%), with only N = 14 (9.3%) explicitly negative.
Typical positive comments included: it's a good process. It helps students convey how confident they are in the topic, and allows the teachers to clearly see where the students need to improve, and where the students are confident/good in. It's overall a very effective method of judging a students’ skill. (#30) I think the confidence quizzes are a great way to test your knowledge and also how well you think your doing in each level. its important to know where your at so that you can wok on the questions that your not confident in or got wrong. (#45) i think we should use them more often because they are a good learning excersise. (#58) I think it's sad because when i get them right my confidence is low but when i get them wrong my confidense turns out to be high ???? (#48) I'm always very confident for some reason and each time I lose 5 points. I do not know the purpose of the confidence quiz and why we do it. (#70)
It was clear from the comments that students overwhelmingly understood why their teachers were using confidence assessment in their lessons and that the vast majority of those who responded were supportive of the practice.
Discussion
We now consider the results under the headings of the three research questions presented above.
Do students become better calibrated after six uses of confidence assessment over a period of two months?
We found statistically significant positive correlations between confidence and accuracy for all six assessments. Correlations ranged from .541 to .834, with an overall upward trend, although Assessment 6 showed a drop, which could indicate something anomalous about that particular assessment. Perhaps students approached this assessment differently in some way because it was the final assessment in the series. The importance of these assessments formatively had been stressed by the teachers throughout, which might be harder for students to perceive in a terminal assessment. Consequently, it could be that students were less risk averse in providing their confidence ratings in this final assessment, since they knew that they would be moving on to a new topic afterwards. They might also have unconsciously wanted to end the unit “positively” by inflating their true confidence.
The initial level of calibration found in Assessment 1 was r = .541, which compares closely with the baseline value of r = .546 previously found by Foster (2016) with students aged 11–14 (N = 336) when working on the topic of directed (positive and negative) numbers. The peak of .834 by Assessment 5 suggests considerable improvement in calibration by that point. Our analysis of the participants’ mean overconfidence showed an increase from Assessment 1 to Assessment 5; however, Figure 5 showed that the differences between students’ over-confidence reduced considerably. Improvements in students’ calibration included both overconfident students becoming less confident as well as under-confident students gaining in confidence. It is important to note that, due to the non-experimental design, we cannot demonstrate that these trends are causal; students could have become better at assigning confidence due to their increasing familiarity with the topic, for instance, or due to other causes external to the confidence assessment intervention.
We note here that the findings from the analysis of mean absolute difference between accuracy and confidence were less clear, with an improvement in calibration appearing to be more short-lived with an earlier deterioration. We do not have an explanation for this.
Do girls and boys show different profiles in their calibration over this period?
Consistent with previous research (Foster et al., 2022; Frost et al., 1994; Ganley & Lubienski, 2016; Mullis et al., 2020), we found that boys’ confidence was higher than girls’, and across the six assessments the mean difference showed a Cohen's d effect size of 0.417. Similar general patterns in the changes in calibration were seen for boys and girls, but with somewhat more variation in boys’ calibration than in girls’. This is despite no gender difference in accuracy.
What are students’ opinions on confidence assessment after using it over a period of two months?
As was found previously (Foster, 2016), the vast majority of students who answered the survey (84.7%) were positive about confidence assessment, with fewer than 10% overtly negative. Students felt that confidence assessment had a formative function, helping them to know what to focus on in their learning (e.g., “allows the teachers to clearly see where the students need to improve, and where the students are confident/good in,” Student #30). Some students said that they felt that confidence assessment improved their confidence and some described it as “fun.” The rare negative comments focused on the disappointment associated with losing marks for poor calibration, which is an inevitable feature of an intervention based on “negative marking.”
Although only 55% of students responded to the survey, we think it likely that students who had particularly negative views might be especially motivated to complete it, in order to attempt to discourage the teacher from persisting with the practice, and given that the survey was anonymous. The fact that fewer than 10% of the respondents mentioned anything negative suggests that confidence assessment may be generally popular and perceived as unproblematic from a student perspective. It could be argued that social desirability bias would push students toward answering positively, despite knowing that the survey is anonymous, and effort justification bias could be an additional push in this direction. More research on students’ views of confidence assessment is needed to inform this. By themselves, these comments might not be sufficient to recommend use of confidence assessment in the classroom. However, it would seem that if a decision were made on other grounds to introduce confidence assessment, based on this study it is unlikely that teachers should anticipate that it would be strongly opposed by their students.
Conclusion
Confidence assessment has been proposed as a low-cost, easy-to-implement way to improve students’ calibration as a means to enhancing their future learning (Foster, 2016, 2022; Foster et al., 2022; Gardner-Medwin, 1995, 1998, 2006, 2019). An essential aspect to learning in any field of knowledge is being able to distinguish between those aspects that the student knows and can do successfully and those with which they need support. Strong calibration implies that students can reliably distinguish between what they know and what they do not yet know. Optimal teacher responses to student errors will depend on whether the error is likely to represent a strongly held belief/misconception or a mere guess, and so knowledge of students’ confidence is likely to be beneficial to the teacher as well (Foster, 2017).
This paper presents the first attempt to explore changes in students’ calibration across a consistent series of confidence assessments, implemented naturalistically as part of ordinary, in-class, low-sakes formative assessments, over a period of two months. Broadly, students’ calibration improved across this period, at least as measured by correlation between accuracy and stated confidence. However, measurement based on mean absolute difference between accuracy and confidence showed a more mixed picture, and even using the correlation measure the trend was not completely monotonic. Further, larger-scale, controlled studies are needed to confirm these findings.
We found that students who expressed a view were overwhelmingly positive about confidence assessment, and many stated that they wished to continue with it.
Interventions using confidence assessment are in their infancy (Foster, 2016, 2022; Foster et al., 2022), and stronger, more reliable improvements in students’ calibration might be seen with modifications to the intervention described in this study. For example, it is possible that in this study some students may have calculated their confidence ratings but not attended much to the values, and therefore not derived the potential benefit from them that was hypothesized in Figure 1. Possible modifications to the intervention could be to stimulate students to reflect explicitly on their confidence ratings, perhaps by writing a sentence about their score (Guo, 2022). In future work, it could be helpful for students to be supported in keeping track of their scores and being asked to reflect (orally or in writing) on any patterns they become aware of. This could support the mechanism proposed in Figure 1 to strengthen the feedback loop to improve calibration. Encouraging students to compare with their peers might also help them to identify better and worse confidence-placement strategies, such as to see why putting a confidence rating of 5 every time is sub-optimal if the student believes that their competence is non-uniformly high.
Student self-marking may be viewed as a threat to internal validity (Panadero et al., 2016). However, we see this as an unavoidable feature of confidence assessment, since if someone else (e.g., teacher or researcher) marked the students’ responses and calculated the confidence score for them, this would be much less immediate for the student, and their engagement in the process would be much less profound. We hypothesize that any effect of confidence assessment would consequently be much harder to detect. The teacher provided the answers to the students and then students marked their own answers, under supervision, as is normal practice in many schools (Harris & Brown, 2013). We have no evidence of students altering their scores; however, for more control in the future, the assessments could be automatically and instantly graded through an online platform, such as Google quiz, with instant feedback to the students.
The lack of a control/comparison group in this study prevents us from drawing causal conclusions. We could not have a control group who reported their confidence judgments, as this would be expected to trigger the same mechanism as targeted for the intervention students. In principle it would have been possible to have had a parallel class respond to the same six assessments over the same time period without making confidence judgments. Alternatively, the parallel class could have made a confidence judgment only for the first and last assessments, allowing us to compare a class that had six experiences to a class that had only two. Unfortunately, as this was a classroom-based study, for practical and equity reasons the school did not permit us to vary the treatment across the classes, so all classes were given the full intervention of confidence assessment within every assessment.
We do not have data on whether correct confidence judgments might for some reason have been easier to make on some of the assessments than on others, and this also limits our ability to draw firm conclusions. The questions were carefully constructed to be similar in the ranges of numbers used, skills, and the reliance on negative number skills, and so we think this unlikely. However, we do not have empirical evidence for the comparability of the assessments.
The pairing of the assessments also constitutes a potential confound. Students might have used what they learned about their judgments from the first assessment in each pair and mapped this onto the judgment on the parallel items on the second assessment without really reconsidering their “true” confidence judgments. We cannot rule out this possibility, because putting the assessments in parallel blurs the line between improving “understanding” and simply improving “performance” (in the sense of Soderstrom & Bjork, 2015). However, this is a broader issue than the parallel assessments, since there is also some overlap among the items in the other assessments. The last two skills on each pair of assessments appear again in the first two items on the next pair of assessments. For example, items 3 and 4 on Assessment 4 have variables on both sides, and then items 1 and 2 on Assessment 5 repeat this. It is hard to avoid this issue with a sequence of related Assessments on progressing content.
Another possible limitation to this study is that some students, rather than seeking on average to maximize their score, may have been overly concerned with obtaining at least one maximum score of 20 out of 20, severely discounting the value of anything lower. This may have meant that those students adopted the high-risk approach of prioritizing confidence ratings of 5, even when they were far from completely sure. It would be hoped that this strategy, like any other sub-optimal strategy, would eventually be extinguished by the repeated feedback loop of Figure 1, and this is something that could be tested in future research by examining students who repeatedly score −5 on many items. Qualitative interview work could also ascertain students’ reasoning about their confidence ratings and the strategies that they describe being aware of employing. For example, some students might have assumed that the later questions in each assessment would be harder and so may have developed strategies such as offering decreasing confidence ratings across each assessment, such as 5, 4, 3, and 2, regardless of their actual perceptions of individual item difficulty.
Finally, a possible limitation of this study is that the topic of solving equations may be unlike some other mathematics topics, in that it can be relatively straightforward for a student to use substitution to verify that their answer is correct. Indeed, this topic was selected by the school for this very reason, since the intention was to use confidence assessment as a mechanism for incentivizing students to check their work carefully. Consequently, caution is needed before generalizing these findings beyond this particular content area.
Footnotes
Contributorship
Renie designed the assessments and conducted the study. Foster led on the analysis and drafted the manuscript. Both authors read and approved the final manuscript.
Data availability
The six confidence assessments used, along with complete anonymized data, both quantitative and qualitative, is available at https://doi.org/10.6084/m9.figshare.27302682.
Declaration of conflicting interests
The authors declared no potential conflicts of interest with respect to the research, authorship, and/or publication of this article.
Ethics statement
Ethical approval for this study was obtained from Loughborough University's Ethics Review Sub-Committee.
Funding
The authors received no financial support for the research, authorship, and/or publication of this article.
Informed consent
Opt-in informed consent was not required for this study, since all activities were undertaken as part of normal classroom teaching. If they wished, participants were able to request that their data were not included in the analysis.