
Abstract
In this study, 176 Turkish seventh-grade students were asked to pose three problems for each of the swimming and purchasing tasks to examine how the solvability and complexity of the problems changed depending on the order of responses. The purchasing task required to pose a problem to derive a specific answer before posing new problems, whereas the swimming task required to pose problems based on existing data. The findings indicated that students performed poorly in terms of posing solvable problems in both tasks. The majority of solvable responses in the purchasing task were at the high complexity level, but most in the swimming task were at the low complexity level. No evidence of a relationship between the order of the responses and any of the analysis units (solvability and complexity) was found. Furthermore, when comparing the groups that posed and did not pose solvable problems for the specific answer in the purchasing task, the former group had a stronger tendency to maintain the complexity points in their other responses compared to their first response.
Introduction
Problem posing is an important intellectual activity in scientific research (Cai et al., 2015). Einstein and Infeld (1967) stated that posing new problems requires creative imagination and is essential for real advances in science. Moreover, within the mathematics education community, problem posing is viewed as a key component of mathematics classroom practices (Cai et al., 2015; English, 1997; Yao et al., 2023). Silver (1994) described problem posing as a natural and frequent occurrence in classrooms where students are encouraged to be autonomous learners. Problem posing is handled together with problem solving in the Turkish middle school mathematics curriculum (Ministry of National Education [MNE], 2018), and students are asked to pose mathematical problems, which also includes the aim of associating mathematical concepts with daily life.
Providing challenging situations for students is also a challenge for teachers (Vale & Pimentel, 2011). Mathematics educators tended to view problem posing as a challenging task because “problem posing often requires posers to reflect on the broader aspects of structure and goal.” (Zhang & Cai, 2021, p. 962). Generation of problems by students based on the given situation is the main goal of problem-posing tasks. It could not be possible to build learning environments where “mathematical thinking is the norm” (National Council of Teachers of Mathematics [NCTM], 2000, p. 18) through problem posing if students are unable to pose complex mathematical problems. Indeed, at this point, teachers point out students’ inability to pose interesting and complex problems as one of the main obstacles to teaching through problem posing (Cai et al., 2020; Li et al., 2020).
When discussed in the classroom, students’ noncognitively demanding and unsolvable responses can offer opportunities for learning because learning through problem posing occurs when students pose mathematical problems and/or have discussions about them in the classroom (Zhang & Cai, 2021). However, encouraging students to pose complex problems might force them to think about the conditions and constraints of the task. It might also stimulate students to make connections between the problem-posing situation and mathematical concepts that are not addressed in the given situation. Therefore, attempting to pose complex problems might result in the creation of learning environments that address a broader range of mathematical ideas and go deeper into them. In this regard, mathematics educators recommend teachers to push students to pose problems at different difficulty levels in order to better integrate problem posing into school mathematics (Cai & Hwang, 2021, 2023).
Teachers affect tasks and thus students’ learning by setting specifications for outcomes or explaining the processes that can be used to accomplish work (Doyle, 1988). In this sense, we can argue that the specifications on the problem-posing prompts influence the quality of the problems (i.e., whether the responses are complex or irrelevant), as they reflect the expectations for the problem to be posed. For example, Cai and Hwang (2023) noted that if students are asked to pose problems based on a bar graph where teaching linear equations is the focal point, posing problems irrelevant to lesson goals can be avoided by adding a constraint such as “pose mathematical problems based on the data that can be solved using linear equations” (p. 126) to the prompt. In a similar vein, mathematics educators consider asking for multiple problems to be posed as one of the precautions suggested in the prompts to encourage the generation of complex and interesting problems (e.g., “pose three problems” or “pose as many problems as possible”; see, for example, Silver & Cai, 1996; Van Harpen & Sriraman, 2013), and “pose three problems” prompt is used as one of the generic prompts in this context (Cai et al., 2023). However, the field of mathematics education is still far from having a comprehensive understanding of the kind of prompts that encourage students to pose difficult mathematical problems (Cai & Hwang, 2023). The purpose of this study is to investigate the potential of this generic prompt for generating complex problems through different problem-posing situations. More specifically, we utilized mathematical solvability and complexity criteria to investigate how the problem-posing performances of seventh-grade students change based on response order through the generic prompt “pose three problems.”
Literature review
Mathematical problem posing
The literature on mathematical problem posing includes reports of research trends in problem-posing studies (Cai & Leikin, 2020; Liljedahl & Cai, 2021), definitions of problem posing from different perspectives (Baumanns & Rott, 2021, 2022; Cai & Hwang, 2020; Silver, 1994; Stoyanova & Ellerton, 1996), and various classifications of problem-posing tasks (Baumanns & Rott, 2021; Silber & Cai, 2017; Stoyanova & Ellerton, 1996). These research strands help elucidate the theoretical underpinnings and orientation of our study.
Cai and Leikin (2020, pp. 288–289) identified four categories of problem-posing studies based on how it is viewed: problem posing as a tool for mathematics instruction, problem posing as a goal of mathematics instruction, problem posing as a tool to investigate other phenomena of interest, and problem posing as a research goal that is itself the object of study. Research in the last category focuses on the characteristics of the problems posed (e.g., type, quality, and quantity) as well as the examination and evaluation of factors that enable productive problem posing. The present study considered problem posing as a research goal because we examined how the students’ problem-posing performances changed according to the order of responses.
Problem posing has been defined from different perspectives. Some researchers have proposed definitions by considering the roles of teachers, students, or both in the problem-posing process (Cai & Hwang, 2020; Stoyanova & Ellerton, 1996). According to Stoyanova and Ellerton (1996), problem posing refers to interpreting a given situation based on mathematical experiences and formulating them as meaningful mathematical problems. This definition from the student perspective places emphasis on the interplay between the problem poser and problem-posing situation (Baumanns & Rott, 2021). In the present study, we adopted this definition as we asked students to pose problems based on given situations using their knowledge and experience.
Christou et al. (2005) divided problem-posing tasks into four categories based on the involvement processes: translating (posing problems based on a table or graph), comprehending (posing problems based on mathematical expressions), editing (posing problems based on open-ended situations), and selecting (posing a problem towards a specific answer based on open-ended situations). Furthermore, they found empirically that tasks requiring the last two processes are more demanding than other problem-posing tasks and identify students who achieve them as high problem-posing performers. In the present study, we utilized editing and selecting processes as a theoretical framework for the preparation of tasks. The thinking processes required in such tasks are considered as the distinguishing feature of students with high problem-posing performance (Christou et al., 2005). Therefore, the tasks created for these components had the potential to provide detailed results showing how the students’ problem-posing performances changes according to the order of responses.
Measuring the complexity of problems
The quality of the problems posed by students may be evaluated from various perspectives, one of which is complexity (Silver & Cai, 2005). Complexity reflects students’ cognitive processes, including their mathematical understanding and problem-solving skills (Kwek, 2015). Mathematics educators assert that posing complex problems provides opportunities for students to develop conceptual understanding (Cai et al., 2015; English, 2020; Zhang & Cai, 2021) and more robust problem-solving skills (Kilpatrick, 1987).
Some studies classify complexity according to the cognitive requirements that the problem imposes on the solver (Kwek, 2015; Stein & Lane, 1996). For example, Kwek (2015) categorized the problems posed by students as low, moderate, and high and pointed out that these levels include aspects of knowing and doing mathematics, such as reasoning, performing procedures, understanding concepts, and problem solving. However, the complexity of the solution depends on the students (Yeo, 2017), and problem posers are not always asked to solve their problems in problem-posing tasks (Leung & Silver, 1997). In fact, as Lowrie (2002) argued, problem posers do not always have to solve the problem in order to benefit from problem posing. Therefore, there is a need for classifications that focus on the complexity of the problems posed regardless of their solutions.
Silver and Cai (1996) operationalized the complexity of the problems posed by students according to the presence of assignment, relational, and conditional propositions in the problem statements. In assignment propositions, one of the variables presented in the task is requested. For example, these categories can be exemplified by the following driving situation: “Jerome, Elliot, and Arturo took turns driving home from a trip. Arturo drove 80 miles more than Elliot. Elliot drove twice as many miles as Jerome. Jerome drove 50 miles” (Silver & Cai, 1996, p. 525). In this situation, without analyzing the mathematical structure of the task, a student might directly ask the amount of distance Arturo, Elliot, or all of them drove. This request represents the basic level of complexity. Relational propositions involve comparing the amounts of quantities assigned to the variables in a task. For example, in the driving situation, comparing the distances driven by two people or comparing the total distance driven with the distance driven by one person are within the scope of relational propositions. In conditional statements, new conditions or restrictions are added to the given data in the task. (e.g., “If the average speed is 100 miles per hour, how many hours do they drive, and how long it will take to go home?” Peng et al., 2022, p. 6). Students tend to have more difficulty in solving problems involving relational or conditional propositions than problems involving assignment propositions (Silver & Cai, 2005). Peng et al. (2022) examined the complexity of problems posed by teachers and coded the difficulty levels as 1 (low), 2 (medium), and 3 (high) according to the presence of assignment, relational and conditional propositions in the posed problem, respectively.
In the present study, we needed an analytical framework that focused on the posed problem, as students were asked to pose but not solve problems. Therefore, we followed Silver and Cai's (1996, 2005) conceptualization of complexity to observe how the complexity of the problems changed according to the order of responses.
Relationship between response order and problem-posing performance
The choice of the prompt influences both students’ mathematical focus and the level of difficulty of the problem-posing task (Cai & Hwang, 2023). Depending on the goal of the problem-posing task, adjustments to the prompts can be made, including altering the number of problems required to be posed (Cai, 2022). Due to the prompt asking to pose only one problem, a problem-posing situation may lead to the emergence of less cognitively demanding problems, even though it allows the generation of mathematically rich and complex problems. Empirical evidence points to the tendency of individuals to generate easily identifiable problems from their experiences in their first attempts. For example, Koichu and Kontorovich (2013) examined the problem-posing processes of two college students and found that their initial reaction to the problem-posing task was to generate quickly formulated or recalled problems.
Students may be further encouraged to come up with original and mathematically complex problems if they are asked to pose more than one problem. For example, individuals are asked to pose as many problems as they can in the studies that use problem-posing as an assessment tool for evaluating creative thinking skills (Van Harpen & Sriraman, 2013). The rationale for selecting this particular prompt stems from an assumption that the growing quantity of problems requested from participants to pose in the task could require an investigation of more complex and creative problems in addition to the prototype problems. However, we should note that the quality of the problems posed is influenced by a variety of factors, such as knowledge base, task organization, or individual considerations of aptness (Kontorovich et al., 2012). Therefore, the request to increase the number of problems in the prompts does not always guarantee the generation of mathematically rich and complex problems.
We do not have enough empirical data to support the common belief among mathematics educators that encouraging individuals to pose numerous problems will push them to pose more complex ones (Cai & Hwang, 2002; Silber & Cai, 2017; Silver & Cai, 1996). Cai and Hwang (2002) asked US and Chinese sixth-grade students to pose an easy, a moderate, and a difficult problem for pattern tasks (i.e., dots and doorbell tasks). They classified responses as extension and nonextension according to whether they asked for a situation beyond the given figures or terms in a pattern. For example, in the doorbell task, the most common sequences provided by Chinese students began with the nonextension problem, and more than half of these progressed towards a final problem that extended the given information. In contrast, US students’ most common sequence started with an extension problem and ended with another extension problem. Furthermore, in most of these sequences, the final problem was more complex. The fact that the prompt asked for three problems at different difficulty levels, from simple to complex, may have caused the final problem to be more complex.
Silver and Cai (1996) asked more than 500 middle school students to pose three problems based on a driving situation. Regarding the mathematical validity of the responses, while about one-third of them were statements or nonmathematical questions, almost all of the remaining mathematical questions were solvable. Furthermore, students tended to be consistent with respect to response types because approximately three-quarters of them generated three mathematical questions, three nonmathematical questions, or three statements.
Regarding the complexity of the responses, nearly 60% of the mathematics questions included only assignment propositions, about 35% involved relational propositions, and only 5% included conditional propositions. Regarding the number of relationships among the variables in the responses, approximately 16% of the solvable responses contained zero relations, slightly more than 20% contained one relation, and approximately 60% contained two or three relations. Furthermore, the study found that the subsequent responses had more relations and were therefore more complex than their first responses.
Research on problem posing in the literature suggests that the task format affects the relationship between complexity of the problems and response order. For example, Silber and Cai (2017) found that preservice elementary teachers pose the most complex problem in a different order according to the task format. For example, in the driving situation, they posed equivalent or more complex problems for each response after their first posed problems. However, this pattern was not followed in a different format of the driving situation, in which problems were posed after posing a problem for a specific answer. Silber and Cai (2017) emphasized that the specific answer presented in the driving situation may have influenced these results. In such tasks, participants were asked to pose a problem for the specific answer as the first response, and then they were asked to pose more problems. In this respect, the high number of relationships among the data in the problem for a specific answer might lead to the most complex problem being the first response. In another study supporting this argument, Peng et al. (2022) examined the characteristics of the problems posed by elementary school mathematics teachers and asked them to pose as many mathematical problems as possible on two situation-given tasks (i.e., doorbell and driving tasks) and two mathematical expression-given tasks (i.e., 13/4 + 1/2 and 6x + 5 = 25). The complexity of problems was examined according to the presence of assignment (low difficulty), relational (medium difficulty), and conditional (high difficulty) propositions in the problem statements. The complexity levels of the problems were mostly at the low and medium levels, with only a few at the high level. The level of complexity varied between the situation-given tasks and mathematical expression-given tasks as the teachers posed a higher percentage of problems with low complexity level in the situation-given tasks.
Besides the abovementioned studies examining the problems posed, studies explaining the problem-posing processes show that individuals tended to think about posing more complex problems in their later responses compared to earlier ones. For example, Koichu and Kontorovich (2013) reported that two college students started posing problems by coming up with prototype problems, but they saw these as departure points for more complex and interesting problems. Öçal et al. (2021) examined the thinking processes of sixth-grade students through a task that asked them to pose problems based on an open-ended story. The findings indicated that different students may have different views regarding whether a problem should be more complex than the previous ones. For example, a student stated that he posed the first problem in a simple way in order to better understand the problem-posing situation, and that also helped him come up with the ideas to pose other problems. Another student split the task's data into three parts and presented a problem for each as he was asked to pose three problems.
Individuals’ perception of posing complex problems does not always guarantee generating more complex problems in subsequent responses than earlier ones. For example, Erkan and Kar (2022) noticed that even though some university students considered posing more complex and different problems in their subsequent responses, they generated mathematically less demanding problems because of the constraints in their mathematical background related to the problem-posing situation.
Rationale for research and research questions
There are several reasons why we were motivated to carry out the current study. First, knowledge of how individuals pose problems and of the factors affecting their problem posing is limited (Cai et al., 2022; Silber & Cai, 2017). Teachers state that students’ inability to create interesting and complex problems is one of the main difficulties in teaching through problem posing (Cai et al., 2020; Li et al., 2020). Therefore, examining how the quality of the problems posed by students changes over successive responses could contribute to endeavors to integrate problem posing into mathematics classroom practices. Second, the majority of the investigations of the quality of the posed problems in relation to the order of responses were conducted with in-service or preservice teachers (Peng et al., 2022; Silber & Cai, 2017). The only relevant study we found was Silver and Cai's (1996) examination of the relationship between the quality of the problems posed by middle school students and the order of multiple responses. Therefore, we sought additional empirical evidence to support the assumption that the complexity of the problems students pose varies with the order of the responses.
Third, after Silver and Cai's (1996) study, various theoretical and experimental studies on problem posing have been conducted (Baumanns & Rott, 2021), special issues in mathematics education journals have been published (Cai & Hwang, 2020; Cai & Leikin, 2020), and books have been published (Singer et al., 2015). Consequently, problem posing has become more common in mathematics curricula, textbooks, and teaching materials. For example, the Turkish middle school mathematics curriculum supports the use of problem posing in a way that contributes to problem solving and encourages teachers to get their students involved in problem-posing activities (MNE, 2018). The compatibility of all textbooks with the middle school mathematics curriculum is monitored by the Turkish Education Board, and teachers are required to use these textbooks. The textbooks include a variety of problem-posing activities, though they are still quite low when compared to other activities (Ev Çimen & Yıldız, 2017; Mersin & Kılıç, 2021). Following a relatively long period of efforts aimed at integrating problem posing into mathematics teaching, it is also intriguing to see how students’ problem-posing performances change according to the order of responses.
Last but not least, although this study appears to be a repetition of Silver and Cai's (1996) study, there are some differences, including the number and type of tasks as well as the sample's composition. Silver and Cai (1996) used only the driving situation as a problem-posing task in their study. Considering the effect of the task format on problem posing (Leung & Silver, 1997; Özgen, 2019; Zhang et al., 2022), a task format that was different from the one used in Silver and Cai's (1996) study was also included in this study. Thus, our study aimed to examine the relationship between the solvability and complexity of the posed problems and the response order from a broader perspective. By comparing the degree of freedom, they provide in creating the problem, Silber and Cai (2017) labeled problem posing based on an open-ended story as free posing and posing a problem for a specific answer before posing new problems based on an open-ended story as structured posing (We will refer to them as such from now on). In their earlier study, Silver and Cai (1996) had used only the free posing. Structured posing requires understanding the mathematical relationships between the pieces of information provided in the context and making choices to arrive at a specified answer (Christou et al., 2005). The basic assumption behind structured posing is that starting with a specific answer can allow students to deeply probe the given situation, enabling them to pose more complex problems subsequently. Therefore, in the present study, we also examined how the students’ problem-posing performances changes in relation to the order of responses in structured posing. Thus, we had the opportunity to determine how problem posing for a specific answer affects the complexity of subsequent problems.
The study conducted by Silver and Cai (1996) did not have a homogeneous sample because it involved students in the sixth and seventh grades. Furthermore, student responses were not analyzed separately for each grade level. Therefore, it would be interesting to observe whether students in the same grade level will show similar results for the relations found between the order of responses and the complexity and solvability of the problems. The following research questions guided the study:
How does the mathematical solvability and complexity of the problems posed by seventh-grade students in free posing change according to the order of their responses? How does the mathematical solvability and complexity of the problems posed by seventh-grade students in structured posing change according to the order of their responses?
Methodology
Settings and participants
The study involved 176 seventh-grade students in seven public middle schools in a city in Türkiye. All participants were native Turkish students. In some schools we included more than one classroom. We informed the teachers of the participating classrooms about the purpose of the study and obtained their consent to administer the data collection tool. All relevant clearances (from the ethics committee and local national education directorate) were acquired, and the students in these classrooms participated in the study voluntarily.
Five of the middle schools were located in areas of medium or high affluence in provincial and local hubs. They were regarded as high-performing schools. On the other hand, one school was considered low-performing even though it was located in the district's hub, and the other middle school, which was located in a disadvantaged area in the rural part of the province, was also considered a low-performing school. Only 17 students from these two schools participated in the study.
As Türkiye has a centralized education system, all teachers follow the same curriculum for their grade and subject area that is prepared by the MNE (2018). The middle school level comprises grades five through eight, each with its own mathematics curriculum, serving students aged 11–14. There are five learning domains in the middle school mathematics curriculum: (1) numbers and operations, (2) algebra, (3) geometry and measurement, (4) data processing, and (5) probability. In the fifth-grade mathematics curriculum, there is no standard for algebra. In the sixth grade, students learn basic concepts such as variable, unknown, term, and coefficient. In the seventh grade, they learn algebraic expressions, perform operations with algebraic expressions, look for patterns, and solve first-degree algebraic equations. They also learn the mathematical content of operations with integers, rational numbers (i.e., ordering rational numbers, displaying rational numbers on a number line, and relating rational numbers with decimal numbers), operations with rational numbers, ratio and proportion, and a certain percentage of a quantitative value. In relation to the scope of our study, the numbers and operations standards in the curriculum indicate that students should be able to understand number sets (e.g., natural numbers, rational numbers, and integers), perform operations on number sets, and solve problems in relation to the context of number sets (MNE, 2018).
Data collection
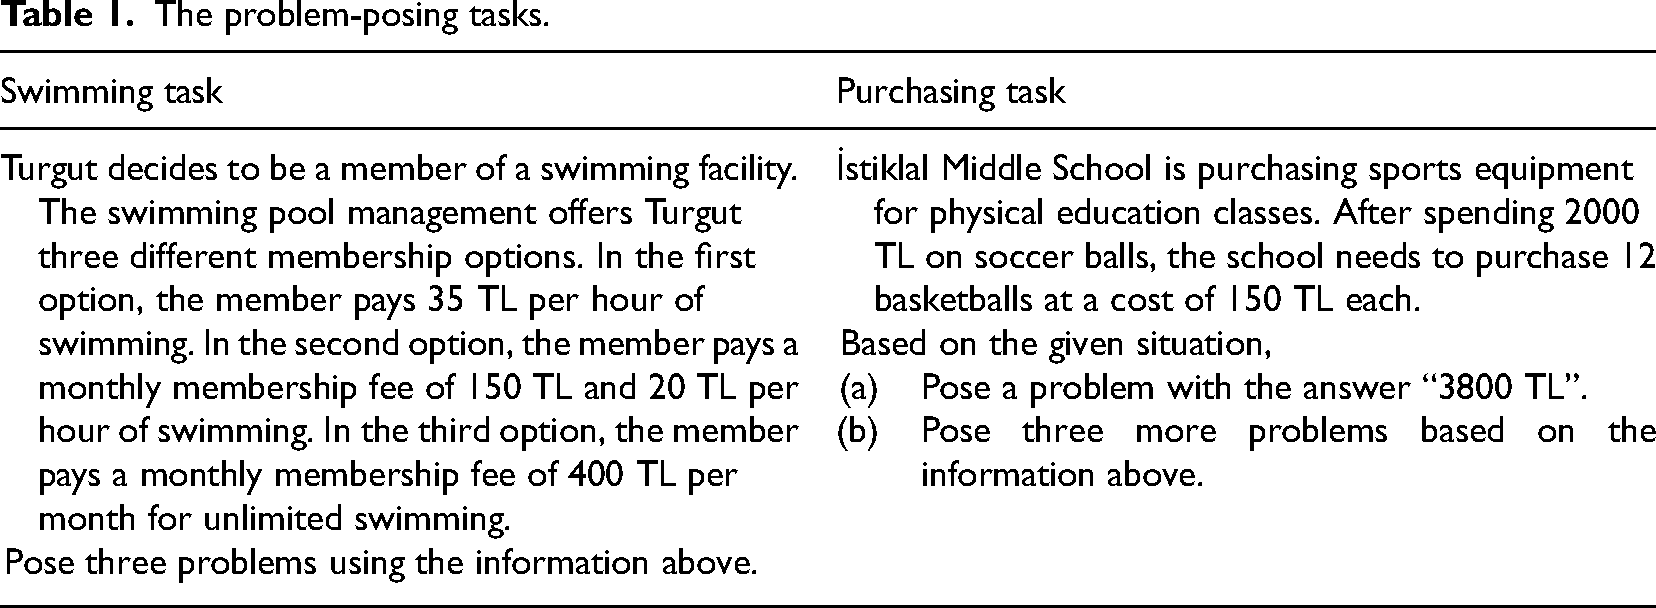
As a data collection tool, we prepared two tasks: the swimming task and the purchasing task, for free and structured posing, respectively (Table 1). Such tasks are widely used for research purposes, including investigations of the complexity of problem posers’ responses. Our tasks were evaluated by two experts—a researcher in mathematics education and a middle school mathematics teacher who had seven years of teaching experience. They confirmed that the tasks were suitable for seventh-grade students.
The problem-posing tasks.
The problem-posing tasks.
In the swimming task, three payment options for membership in a swimming facility are described, which we presumed would provide opportunities for students to pose problems at various levels of complexity. We adapted the purchasing task, which involves purchasing athletic equipment, from Zhang et al.'s (2022) study. These tasks were implemented to students during one hour of a regular school class. The data collection tool provided to the students included the swimming task first, followed by the purchasing task, and they completed the tasks individually. Under each task, enough spaces were left for problems 1, 2, and 3, and students were instructed to write their problems in this order.
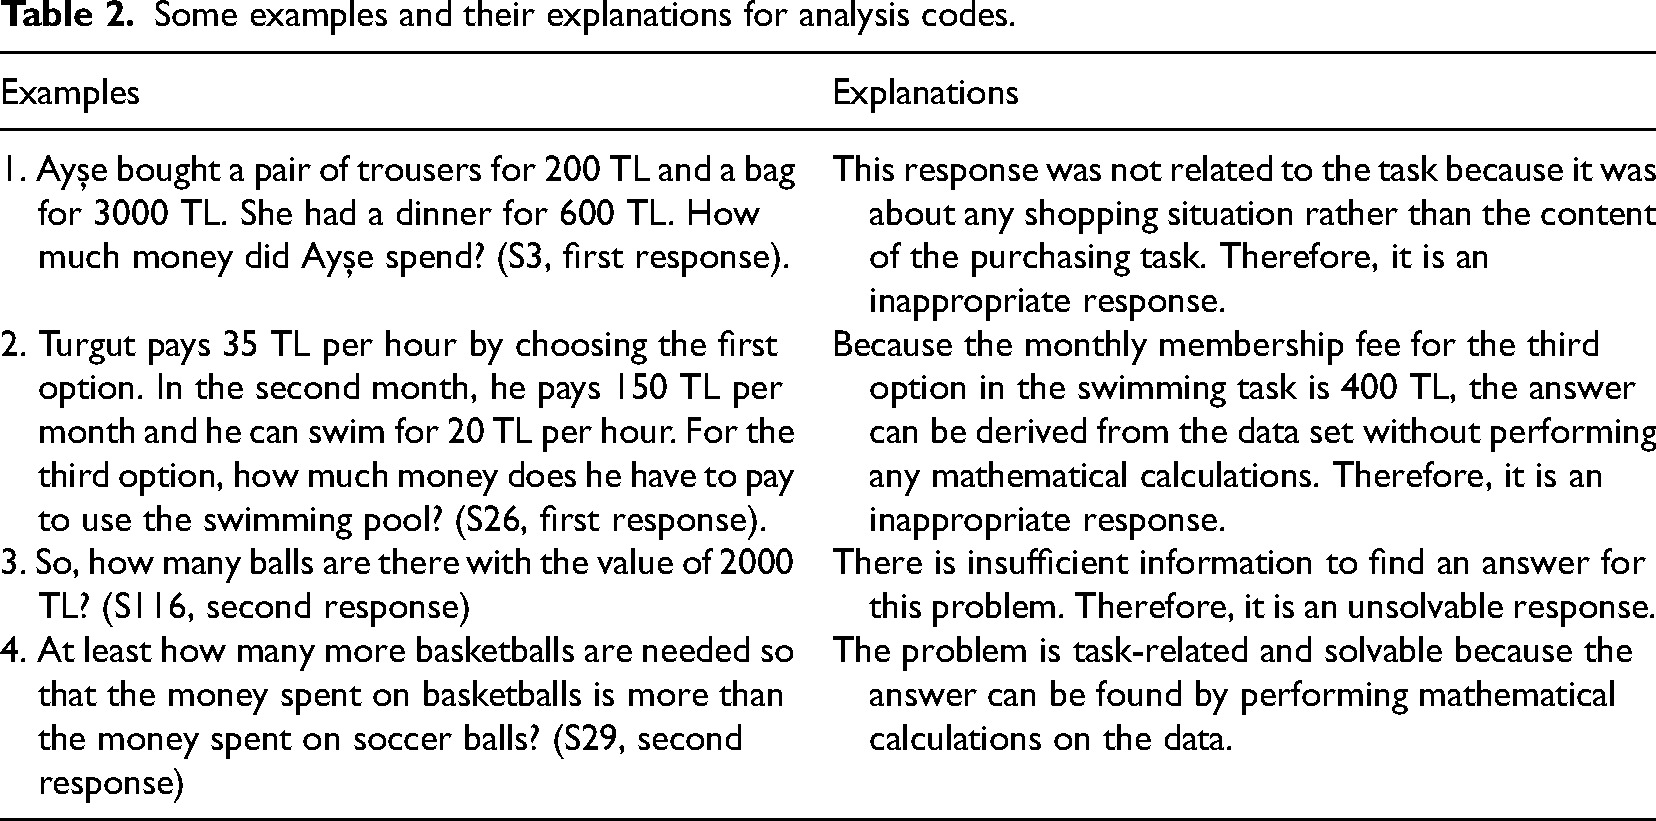
The unit of analysis was each response of each student. The data were analyzed utilizing the coding schemas of previous studies (Peng et al., 2022; Silver & Cai, 1996). First of all, students are expected to pose mathematical problems compatible with the problem-posing situation. Therefore, students’ responses were initially categorized according to whether they were task-related and mathematical problems. In this regard, the following responses were considered inappropriate: (i) nonmathematical responses, (ii) responses that did not contain a question statement, (iii) responses that were not related to the task, (iv) responses that did not require mathematical procedures to find the answer, and (iv) responses that were left blank. In the first situation, it is not possible to answer the problem mathematically. The third situation does not consider the data included in the task. Instead, students attempt to write any problem related to the context of the task (see the first example in Table 2). In the fourth situation, the answer of the problem can be inferred directly from the data set without requiring mathematical operations (see the second example in Table 2).
Some examples and their explanations for analysis codes.
Some examples and their explanations for analysis codes.
A solvability and complexity analysis was then performed on the appropriate responses. Whether the appropriate problem provides sufficient data for the solution was considered in the solvability analysis. If the posed problem could not be solved based on the given data, it was evaluated as “not solvable.” (see third example in Table 2).
To facilitate statistical analysis, each student response was coded with 0 or 1, based on solvability. Inappropriate responses were also coded with 0 in this coding. This gave us the opportunity to test how the solvability of the problems changed depending on the response order. Solvability points for the three responses are represented by ordered triplets for each student. We calculated the frequency values for the following situations to better describe how the response order affected the solvability of the problems: (1) Getting the same point for all three responses [i.e., (0,0,0), (1,1,1)], (2) the first response was unsolvable but the second and third responses were solvable [i.e., (0,1,1)], (3) the first and second responses were unsolvable but the third response was solvable [i.e., (0,0,1)], and (4) one of the first or second responses was unsolvable, but the third response was solvable [i.e., (0,0,1), (1,0,1), (0,1,1)].
For the purchasing task, students were first asked to pose a problem with the answer “3800 TL.” We analyzed the problems posed by the students for the specific answer according to whether they were solvable or not, based on the solvability analysis. If the problems were related to the task and had the answer “3800 TL,” they were classified as “solvable” while problems not having the answer of “3800 TL” were classified as “not solvable.”
Two coders independently analyzed and coded the students’ responses and used Cohen’s kappa coefficient for calculating interrater reliability. For the swimming task, coding agreement for each response was calculated within the range of 0.90–0.98. Coding agreement for the purchasing task was calculated within the range of 0.87–0.94. Coding agreement for the first part of the purchasing task (posing a problem with the answer “3800 TL”) was calculated and found to be 0.82. Therefore, the coding process was carried out with either strong (i.e., between 0.8 and 0.9) or perfect (i.e., more than 0.9) agreement (McHugh, 2012). Differences in coding were resolved by reaching a consensus through discussion.
Our data are dichotomous as the solvability of the responses is coded as 0 and 1. Therefore, we could perform Cochran's Q test on these data to see how solvability varied according to the response order (Field, 2009).
Complexity analysis
Students’ responses were analyzed according to their complexity, utilizing the frameworks provided by Silver and Cai (1996) and Peng et al. (2022). We focused on the presence of assignment, relational, and conditional propositions in the problem statements. There are different variables and relationships among the data in problem-posing tasks. Accordingly, students may pose problems for one of the variables in the existing task (assignment), problems that involve relations among variables (relational), or new problems by adding new data (i.e., conditions or limitations) to the existing task (i.e., conditional). Peng et al. (2022) coded assignment, relational, and conditional problems as low, medium, and high complexity problems, respectively. The rationale behind this rating is that asking directly for the amount of one or more variables in the data without analyzing the mathematical content in the task (assignment) does not require a high level of cognitive effort when posing problems. On the other hand, when comparing two variables (relational), it is necessary to investigate relationships between the variables and generate problems that do not involve logical inconsistencies. Therefore, we can infer that creating relational problems is more difficult than creating assignment problems. Adding new information (conditional) to the given data in the problem-posing task requires the analysis of the variables in the existing task and the relationships among them, as well as the structure of the new information to be added in accordance with them. In this respect, it is reasonable to argue that creating such problems requires more complex thinking than the other two types.
Applying the abovementioned classification, we coded the students’ posed problems in the “solvable” category as 1 point (low complexity) if they were focused on one of the variables in the existing task. For example, S67's first response to the swimming task was as follows: “Turgut is paying 35 TL per hour to swim in the pool. Accordingly, how much money does Turgut pay for 5 h?” If a problem required a comparison of two variables, it was coded with 2 points (medium complexity). For example, S29's third response to the swimming task was as follows: “Turgut wants to swim one hour per day through the month. Accordingly, if he chooses the 3rd option instead of the 1st one, how much will he save?” Lastly, if a problem was posed by adding new information to the given data, it was coded with 3 points (high complexity). For example, S138's first response to the swimming task was as follows: “Turgut chose option 2 and swam for 2 h this month. In the following months, he regularly doubled his swimming time each month. Accordingly, if October as the current month, how much TL did Turgut spend on swimming lessons from October to January?”
We used Cohen’s kappa coefficient for calculating the interrater reliability of the coding of the complexity of the responses. For the swimming task, the coding agreement for each response was calculated within the range of 0.94–0.97. For the purchasing task, the coding agreement for each response was calculated within the range of 0.86–0.99. Differences in coding were resolved by reaching a consensus through discussion.
Complexity for inappropriate and not solvable responses was coded with 0 points in order to perform statistical analysis, and the complexity points range from 0 to 3. Complexity points for the three responses are represented by ordered triplets for each student. A response order of (2, 1,3) indicates that the first response is at the medium complexity level, the second at the low complexity level, and the last at the high complexity level. We also calculated the frequency values for the following situations to better describe how the complexity of the problems changed based on response order: (1) Getting the same point for all three responses [i.e., (0,0,0), (1,1,1), (2,2,2) or (3,3,3)], (2) constantly increasing the point [e.g., (1,2,3) or (0, 2,3)], (3) constantly decreasing the point [e.g., (3,1,0) or (3,2,1)], (4) the point in the first response does not decrease in subsequent responses [e.g., (3,3,3), (2,2,3) or (1,1,2)], and (5) students who received the full point on their first, second, or third problem [e.g., the full point for (0,2,3), (2,3,1) and (3,2,2) was received in the third, second and first responses, respectively]. Those who received a zero point on their first response were excluded from the fourth category analysis because subsequent responses would have received a zero or higher point in any case. A student's response in the fifth category analysis can be coded for more than one category. A response order of (3,0,3), for example, indicates that the first and third responses received full points.
We used the Friedman test to compare the complexity of students’ problems in relation to the order in which they were generated. We calculated the effect size for the units of analysis for which statistical differences were determined. According to Schmidt (1997), an effect value greater than 0.7 is “very high,” 0.5–0.7 is “high,” 0.3–0.5 is “fair,” 0.1–0.3 is “low,” and less than 0.1 is “no effect.”
Findings
176 students gave a total of 528 responses, and 409 (77.5%) of them were appropriate for free posing. When the distribution was examined based on the response order, it was found that 80.1% (141) of the first responses, 78.4% (138) in the second response, and 73.9% (130) in the third response were appropriate. Of the 528 responses received for structured posing, 249 (47.2%) were appropriate. When the distribution is examined based on the response order, it was found that 61.9% (109) of the first responses, 40.9% (72) in the second response, and 38.6% (68) in the third response were appropriate.
In the following section, parallel to our research questions, we present findings on the solvability and complexity of the posed problems for free and structured posing, respectively.
Free posing
Solvability
For free posing, 49.6% (203) of the appropriate responses were solvable problem. When the distribution is examined based on the response order, it was found that 50.4% (71) of the first responses, 42% (58) in the second response, and 56.9% (74) in the third response were solvable. Among the 176 students, 40.3% posed a solvable problem in their initial response, followed by 33% in their second response, and 42% in their final response.
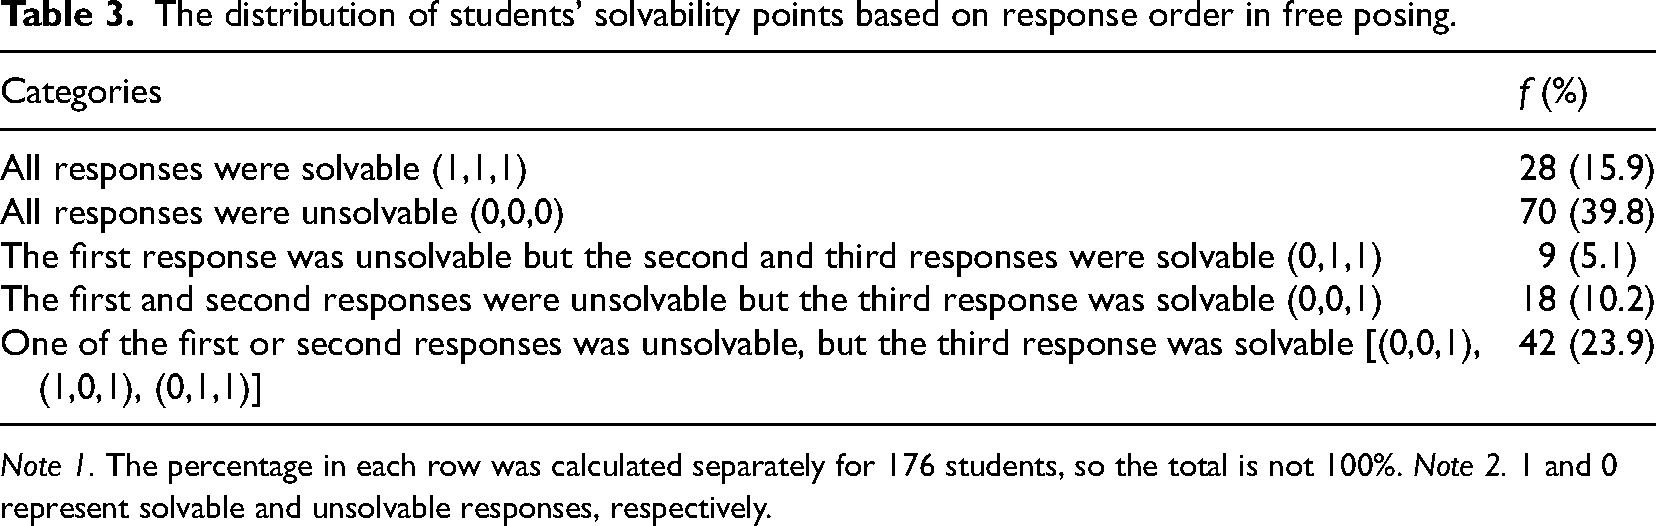
A review of the solvability points according to the response order revealed that 15.9% (28) of the students had all three responses in the solvable category, and 39.8% (70) had all three responses in the unsolvable category (Table 3). Moreover, 5.1% (9) of students increased in performance in subsequent responses when compared to that in the first one. When compared with the first two responses, 10.2% (18) of the students increased their performance in the third response. Cochran's Q test showed no differences among the three proportions: χ2(2) = 5.564, p = .062 > .05.
The distribution of students’ solvability points based on response order in free posing.
The distribution of students’ solvability points based on response order in free posing.
Note 1. The percentage in each row was calculated separately for 176 students, so the total is not 100%. Note 2. 1 and 0 represent solvable and unsolvable responses, respectively.
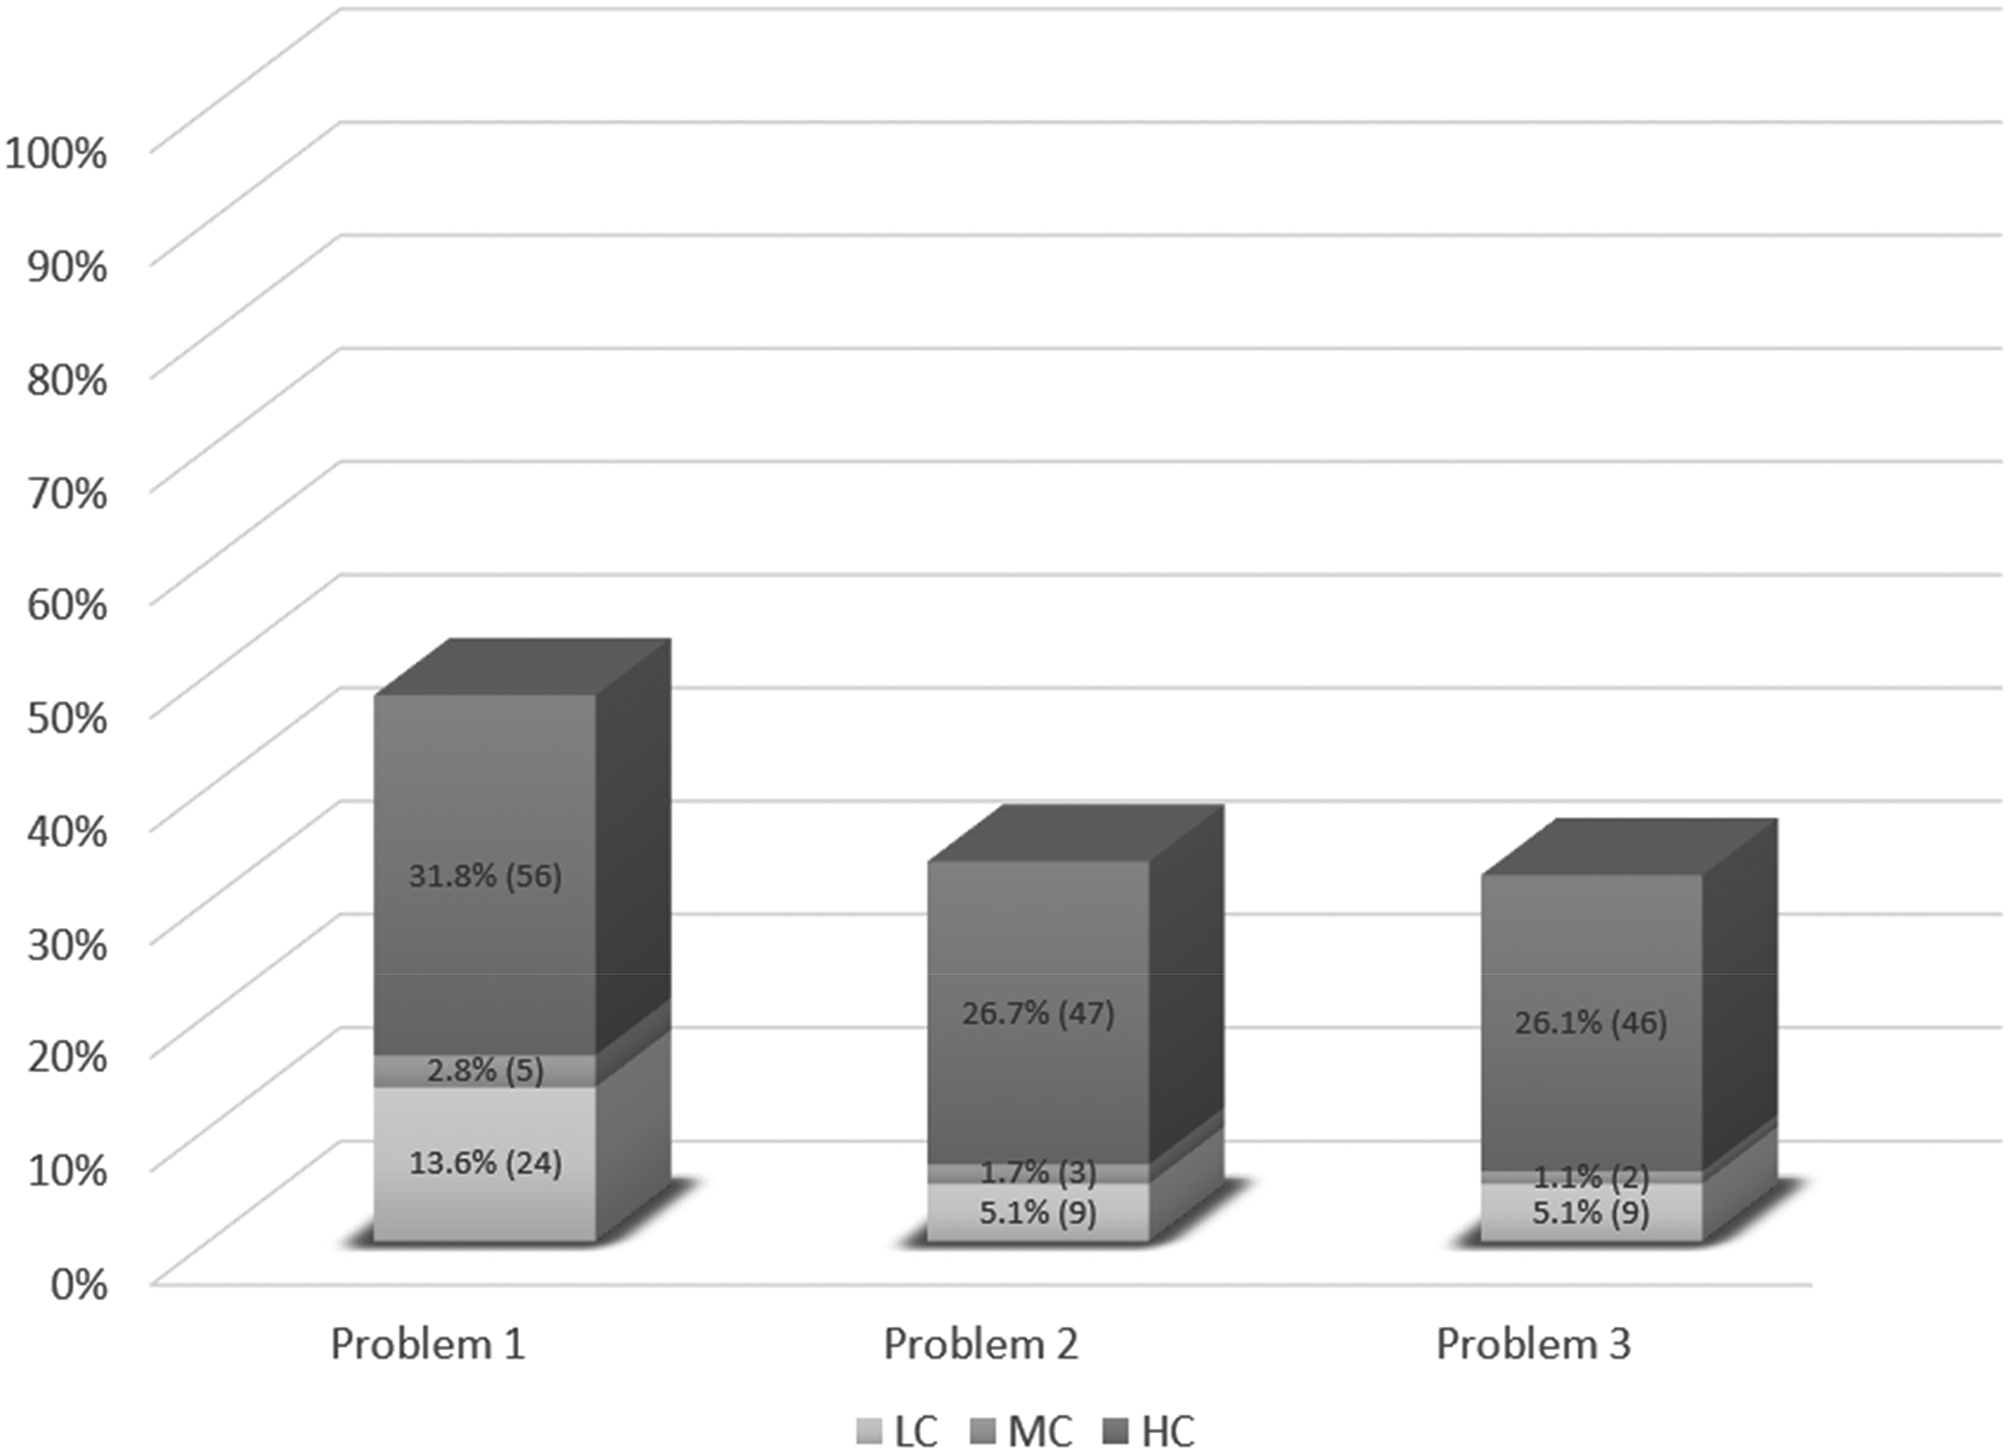
The distribution of students’ solvable problems by levels of low, medium, and high complexity is shown in Figure 1. In the transition from problem 1 to problem 2, while the distributions of medium- and high-complexity responses were close to each other, there was a decrease in the percentage of low-complexity responses. Furthermore, there was a slight increase in the high complexity level for problem 3 when compared to problems 1 and 2.
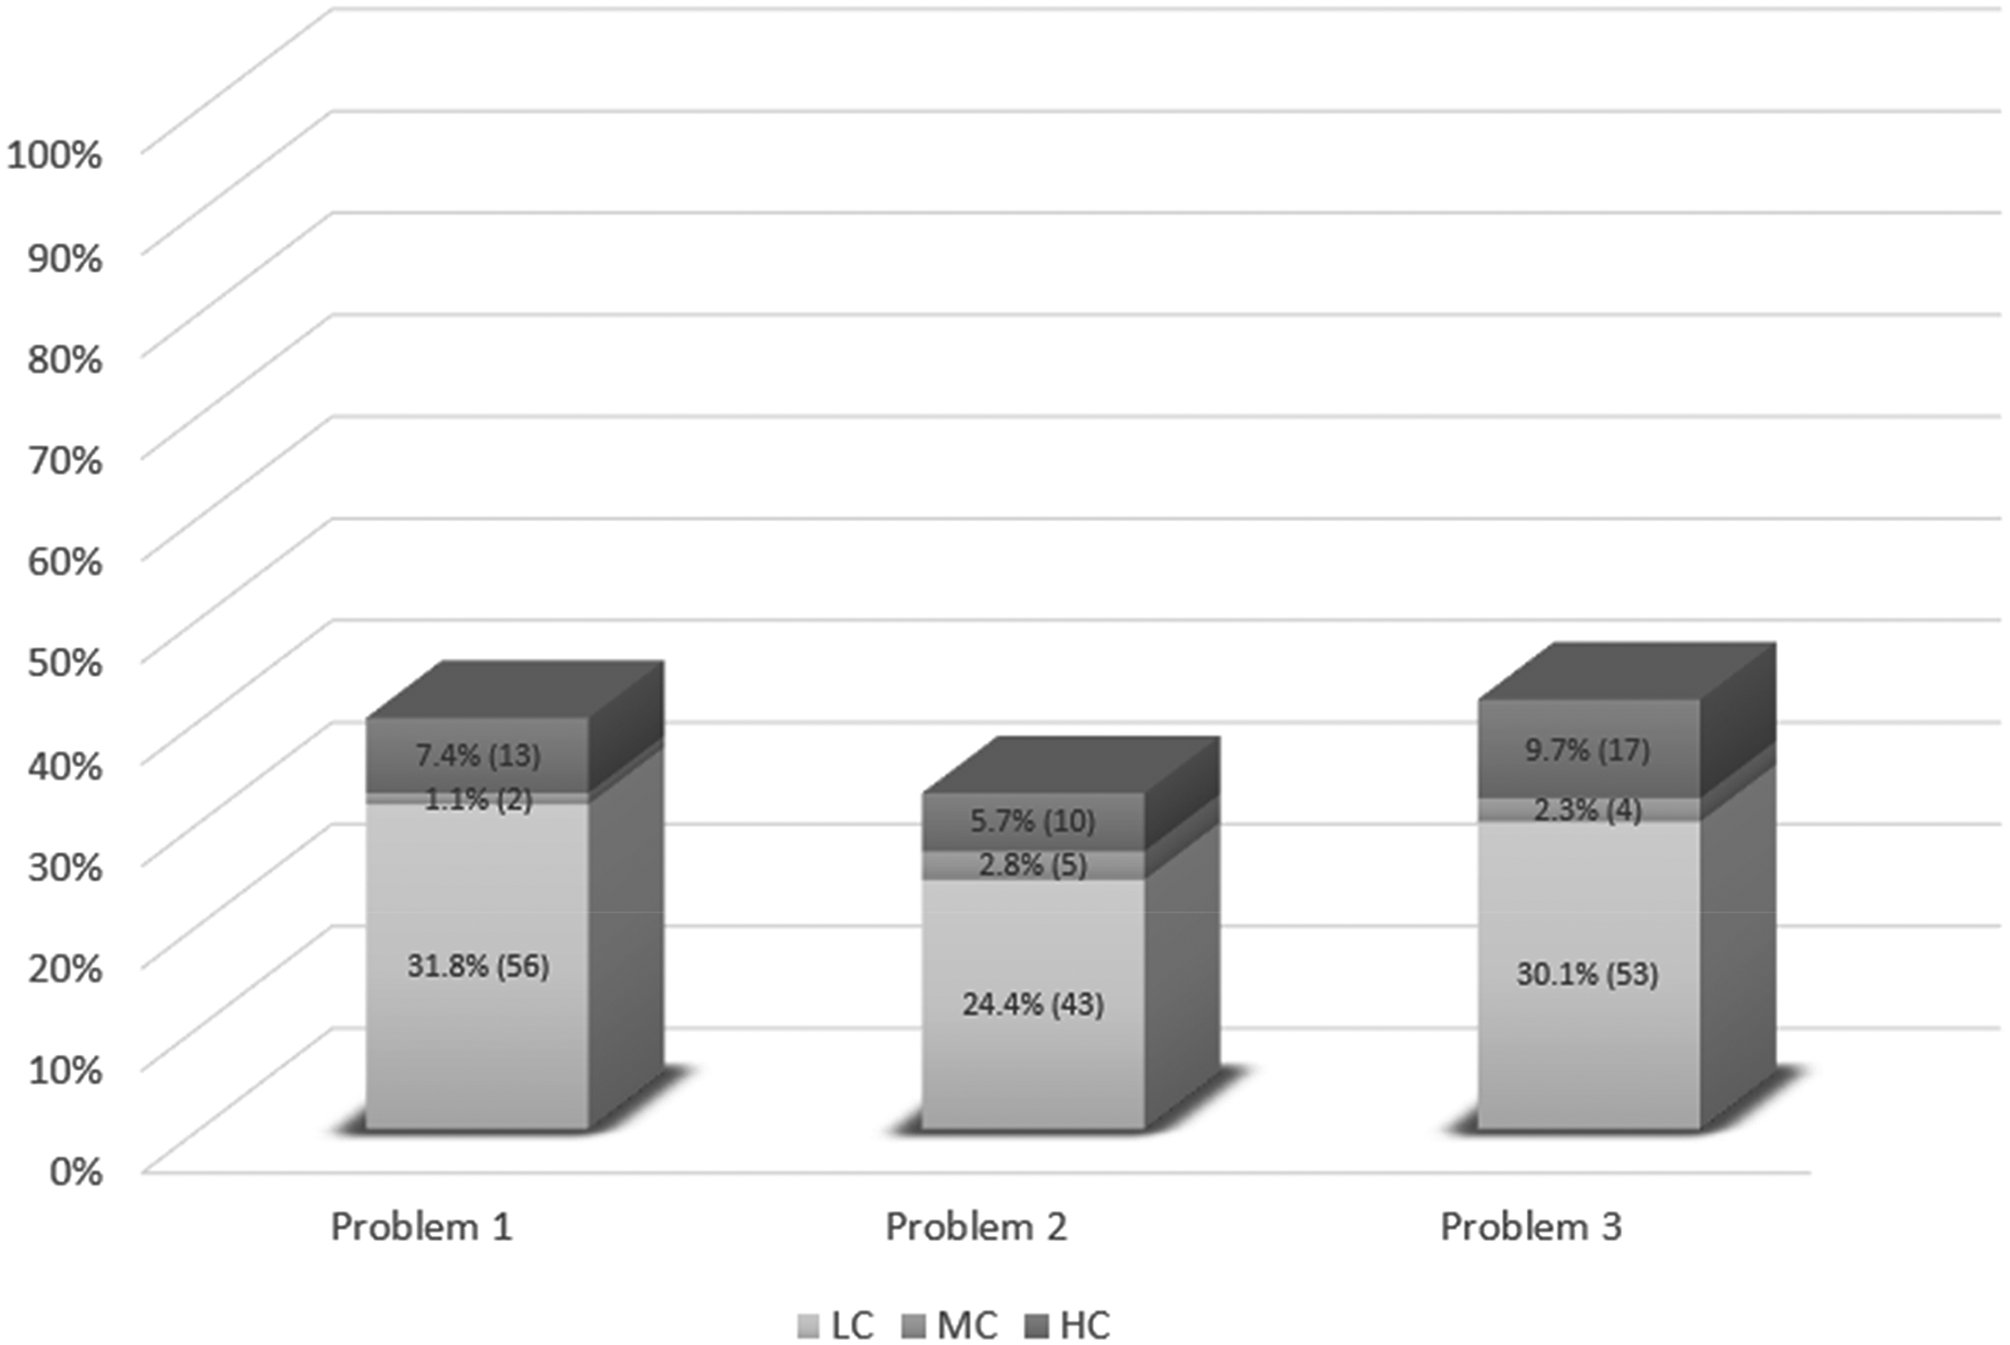
Distribution of complexity of the problems in free posing.
When we examined the change of the complexity point of the three responses for each student, 39.8% (70) of the students received a complexity point of zero in each of the three responses [i.e., (0,0,0)] (Table 4). On the other hand, 1.7% (3) of the students received three points in each response, indicating a high level of complexity. These findings indicate that the complexity levels of the problems posed by students are quite low. When the complexity points were compared based on the order of responses, one student constantly increased his complexity point in subsequent responses and another student constantly decreased it. Furthermore, 14.8% (26) of students received at least as many complexity points in their second or third responses as they did in their first ones. The Friedman test showed that there was no differential rank ordering of the three posed problems: X2(2) = 4.57, p = .1> .05.
The distribution of students’ complexity points based on response order in free posing.
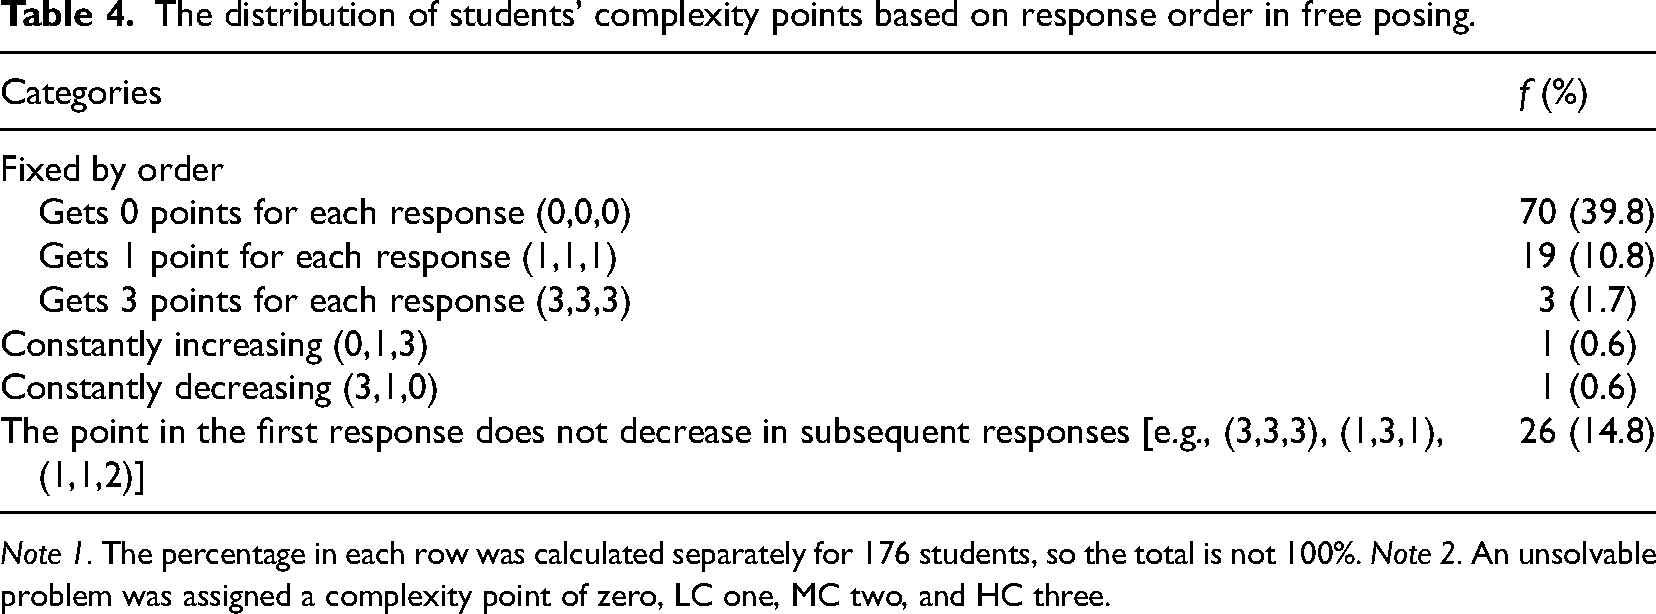
Note 1. The percentage in each row was calculated separately for 176 students, so the total is not 100%. Note 2. An unsolvable problem was assigned a complexity point of zero, LC one, MC two, and HC three.
Solvability
For structured posing, 80.7% (201) of the appropriate responses were solvable problems. We found that 78% (85) of the appropriate problems were solvable in the first response, 81.9% (59) in the second response, and 83.8% (57) in the third response. Among the 176 students, 48.3% posed a solvable problem in their initial response, followed by 33.5% in their second response, and 32.4% in their final response.
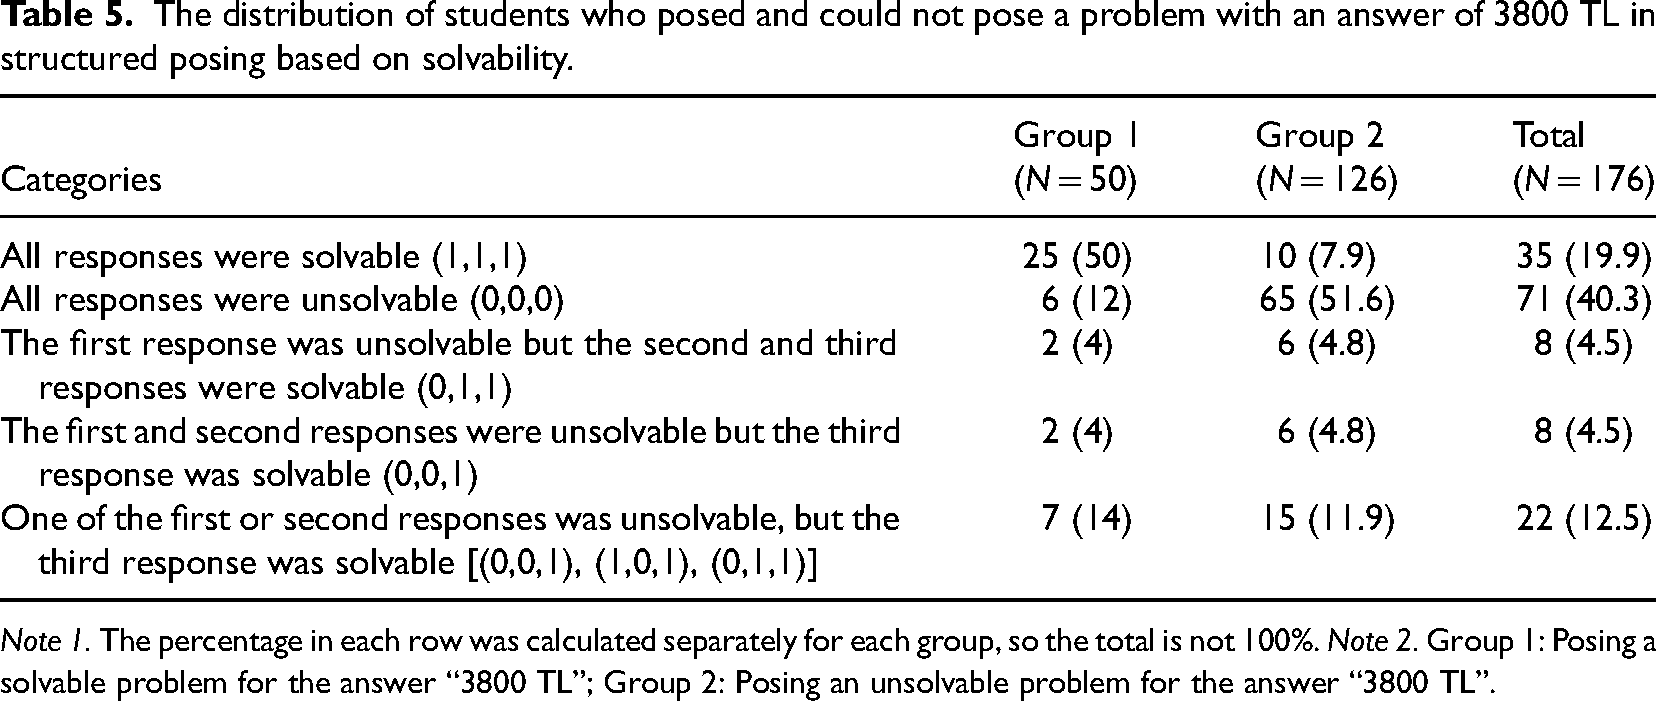
A review of the solvability points according to the response order revealed that 19.9% (35) of the students had all three responses in the solvable category, and 40.3% (71) had all three responses in the unsolvable category (Table 5). Moreover, 4.5% (8) of students increased their performances in subsequent responses when compared to the first one. When compared with the first two responses, 4.5% (8) of the students increased their performance in the third response. Cochran's Q test showed that there was a difference among students’ three responses: χ2(2) = 20.914, p < .05. According to McNemar’s post hoc test, differences were found between the first and second responses (p < .05) and the first and third responses (p < .05) in favor of the first response. However, there was no difference found between their second and third responses (p > .05).
The distribution of students who posed and could not pose a problem with an answer of 3800 TL in structured posing based on solvability.
The distribution of students who posed and could not pose a problem with an answer of 3800 TL in structured posing based on solvability.
Note 1. The percentage in each row was calculated separately for each group, so the total is not 100%. Note 2. Group 1: Posing a solvable problem for the answer “3800 TL”; Group 2: Posing an unsolvable problem for the answer “3800 TL”.
Table 5 also shows the change in problem-posing performances of each group who posed solvable (group 1) and those who posed unsolvable (group 2) problems in the case where students are asked to pose a problem with an answer of 3800 TL based on response order. Although half of the students in group 1 posed solvable problems and more than half of the students in group 2 posed unsolvable problems in all three responses, it does not indicate a tendency for increase in problems’ solvability in accordance with the order of responses. The arithmetic means of group 1's solvability points for each of the three responses are 0.76, 0.66 and 0.64, respectively. Although group 1 showed higher performance in their first response, Cochran's Q test reveals that there was no statistically significant difference among the proportions of solvable problems, χ2(2) = 3.263, p = .196 > .05. On the other hand, the arithmetic means of group 2's solvability points for each of the three responses are 0.37, 0.21 and 0.20, respectively. Cochran's Q test showed that there was a significant difference among the proportions of solvable problems: χ2(2) = 18.157, p < .05. According to McNemar’s post hoc test, a difference was found between the first and second responses (p < .05) and the first and third responses (p < .05) in favor of the first response. However, there was no difference found between the second and third responses (p > .05).
The distribution of students’ solvable problems by levels of low, medium, and high complexity is shown in Figure 2. More than a quarter of the students’ total responses in each problem category were of high complexity (3 points). When complexity levels were compared according to the order of responses, the percentages of responses at low- and high-complexity levels were considerably higher in the first than in the second and third responses. The Friedman test produced a statistically significant difference in the students’ performances in complexity regarding the response order: X2(2) = 10.47, p < .05, and Kendall's W effect size was calculated and found to be .03, which corresponds to no effect. Therefore, considering the effect size, none of the orders of the posed problems yielded a noteworthy mean difference over others.
Distribution of complexity of problems in structured posing.
Table 6 shows the change in complexity points of each group who posed solvable (group 1) and unsolvable (group 2) problems in the structured posing situation that required the answer to be “3800 TL” based on their response order. In group 1, 30% (15) of the students received three points for each of the three responses. On the other hand, the percentage of students who received zero point for each response was 12% (6). In addition, none of the students in group 1 consistently increased their complexity point, and only a student consistently decreased the complexity point. Moreover, 40% (20) of the students received at least as many points for complexity in their second or third responses as they did in their first. The Friedman test yielded no difference among the orders of posed problems: X2(2) = 1.16, p = .56 > .05.
The distribution of students’ complexity points based on response order in structured posing.
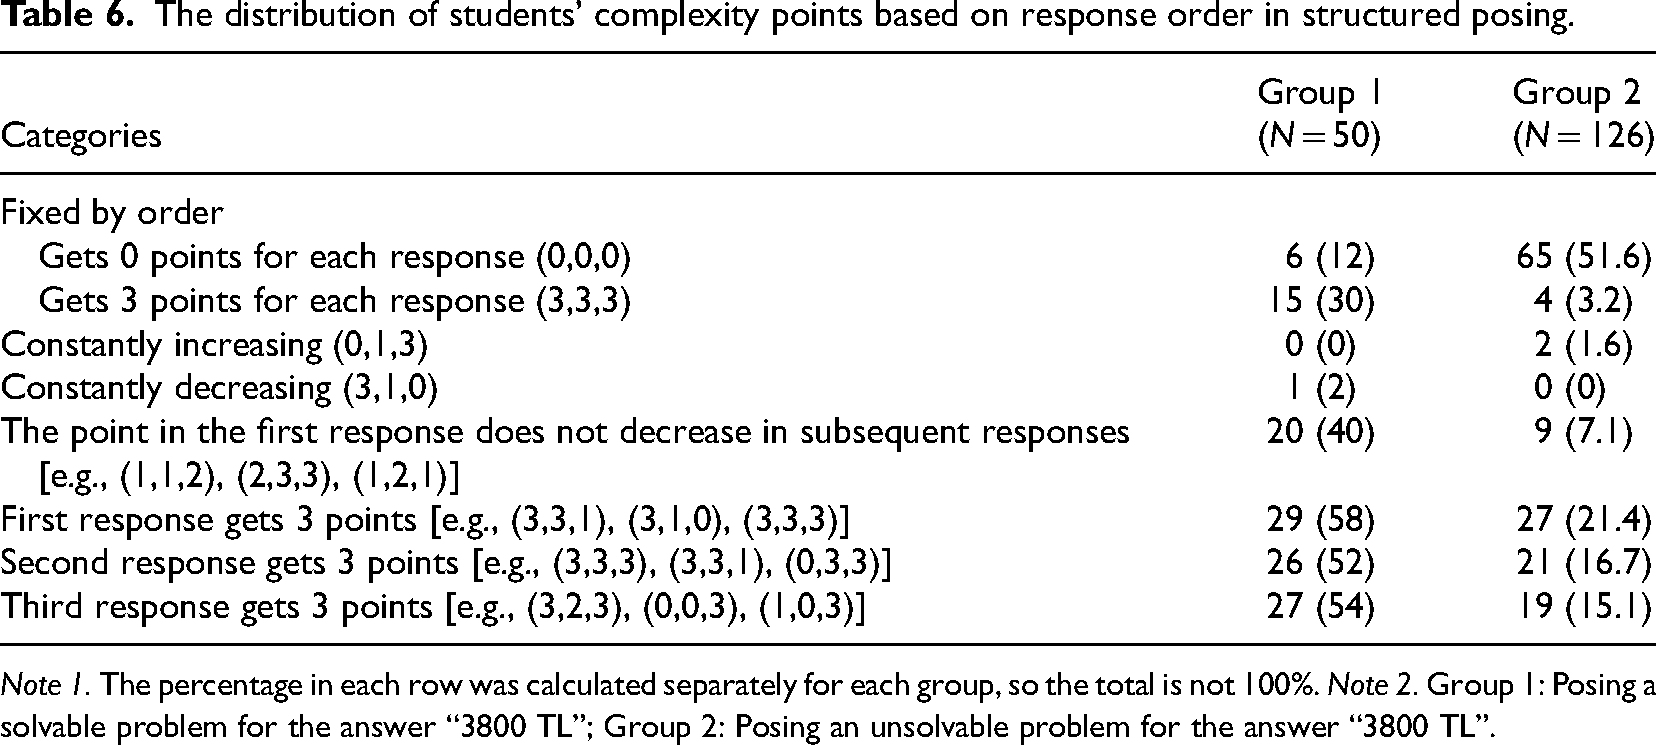
Note 1. The percentage in each row was calculated separately for each group, so the total is not 100%. Note 2. Group 1: Posing a solvable problem for the answer “3800 TL”; Group 2: Posing an unsolvable problem for the answer “3800 TL”.
In group 2, more than half of the students received zero point for complexity in each response and the percentage of students who received three points from each response was 3.2% (4) (see Table 6). In addition, two students consistently increased the complexity point and none of the students consistently decreased it. Moreover, 7.1% (9) of the students received at least as many points for complexity in their second or third responses as they did in their first ones. The Friedman test indicated that there was a significant mean difference among the orders of posed problems: X2(2) = 10.57, p < .05, and Kendall's W effect size was calculated and found to be .04, which corresponds to no effect. Therefore, considering the effect size, none of the orders of the posed problems yielded a noteworthy mean difference over others.
Discussion of the solvability of responses
The students performed poorly in terms of posing solvable problems in both tasks. In free posing, the fact that more than one-fifth of the responses in free posing were mathematically inappropriate indicates that students struggle to come up with task-related and mathematical problems. Students found it more difficult to generate appropriate responses in structured posing than in meeting the solvability condition because less than half of the total responses were appropriate and a majority of the appropriate responses were solvable. These results appear incompatible with assertions in the literature that K-12 students are capable of posing problems (Cai et al., 2015, 2022). For example, Zhang et al. (2022) found that most of the problems generated by sixth-grade students were mathematically solvable.
Problem-posing performance is affected by a wide variety of factors, two of which are problem-posing experience and mathematical knowledge (Leung & Silver, 1997). The inappropriate responses in our analysis scheme included nonmathematical responses, responses without a question statement, and problems for which the answer was readily accessible in the data set. Such responses supported the claim that lack of problem-posing experience may be the reason for students’ low problem-posing performances. Furthermore, the fact that provision of problem-posing tasks is quite low in or absent from Turkish textbooks (Ev Çimen & Yıldız, 2017; Mersin & Kılıç, 2021) also supports this claim. Furthermore, students’ responses which had insufficient data indicated that lack of mathematical content knowledge may be another factor.
The response order in free posing did not show a relation with solvability points. One possible explanation may be the variety of alternative fee arrangements for the swimming program in free posing, as each of these alternatives can be the subject of a problem. The three alternatives for fee arrangements in the swimming program offered the potential for each of these alternatives to be the focus of a similarly configured problem, which may explain why there were no differences in solvability according to response order. As we will point out in the next section, the higher number of low-complexity than medium- or high- complexity responses in free posing supported this explanation, as the low-complexity level corresponds to problems requiring assignment propositions, that is, asking about one of the variables in the existing data set.
In structured posing, students statistically posed more solvable problems in their first response than in their second or third responses. The main reason for this difference in structured posing was that the group who did not pose a problem to the specific answer of “3800 TL” posed more solvable problems in their first response. These results may be explained in several ways. First, we can argue that starting the task by posing a problem for a specific answer provided an opportunity to analyze the structure of the task, which inclined the students to pose more solvable problems in their first attempt at posing a new problem. On the other hand, it may be that problem posing for a specific answer is insufficient to develop a deep understanding of the mathematical structure of the task. In this case, because problem posing is closely related to mathematical knowledge (Leung & Silver, 1997), repeated attempts to formulate new problems may have increased the likelihood of making mistakes.
Second, Koichu and Kontorovich (2013) found that students tended to start problem posing by recalling or quickly formulating prototype problems. Students who could not pose a problem for a specific answer in structured posing might, therefore, have started their three problem-posing effort by reviewing other problem-posing experiences, which resulted in their producing valid problems in their first responses. Then if their problem-posing experiences were insufficient for them to continue at that level, their performance might have fallen off, resulting in an increase in the rates of unsolvable problems.
Discussion on the complexity of responses
Fewer than half of the total responses in both free and structured posing tasks were solvable. The majority of these responses in structured posing were in the high-complexity category. Conversely in free posing, about three-quarters of total responses were in the low-complexity category. These results can be attributed to task format, which affects students’ problem-posing performances and their complexity points (Peng et al., 2022; Silber & Cai, 2017). Free posing offered students in this study a context enriched by alternative options for swimming arrangements and which may have encouraged students to draw on their experiences to quickly formulate less complex prototype problems.
In free posing, there was no statistically significant difference found when the complexity points were compared based on the response order. It is possible that each of the three alternative swimming pool programs that were offered at free posing led to the problems they posed. This result is further supported by the large number of responses with low complexity levels in each response. This could be the reason for the lack of variation in complexity levels with respect to response order.
In structured posing, we observed that the complexity of the problems in the second and third responses decreased slightly compared to the first response, but the effect size was at the level of no effect (Schmidt, 1997). The group that posed the problem incorrectly in the situation where the answer was “3800 TL” is the reason why the students posed more complex problems in their first responses than in their subsequent responses. To pose a problem, one must have an in-depth understanding of the mathematical concepts and operations as well as the relations between them (Leung & Silver, 1997). The students may have created a more complex problem in the first of the three problems because of the knowledge and experience they gained from posing problems, even though they posed the problem with the answer “3800 TL” incorrectly.
Although the literature indicates that students tend to pose more complex problems in their second or third responses than in their first one (Silver & Cai, 1996), this situation was not observed in the current study. Our results indicated that there was no particular trend in both tasks. The students did not pose problems by comparing the complexity level of each response with that of the previous responses; they approached each attempt as a new task independent of previous attempts. As noted above, the students may have manipulated various possibilities in the information provided in the task to generate their second and third responses without increasing the complexity of one problem over that of the previous problem, so no trend in the complexity of the problems through successive responses was evident. Öçal et al. (2021) found that some sixth-grade students, when asked to pose three problems, did so by dividing the data provided in the task into three parts. The fact that we also observed that students in our study posed multiple problems by slicing the data provided suggests that this strategy may be a common approach among students.
In structured posing, when the complexity points of students who could and could not pose solvable problems with an answer of 3800 TL were compared, we noticed that the successful group had a higher tendency not to reduce the complexity points in their subsequent responses compared to their first responses. These findings imply that the tendency to maintain the complexity points in subsequent responses compared to their first responses is a distinguishing feature of successful students who can pose problems for a specific answer.
Implications and future research
Considering the diversity in problem-posing tasks, we need to increase our understanding of how best to design a problem-posing task in order to integrate problem posing into mathematics classroom practices (Cai & Hwang, 2023). Although Silver and Cai (1996) found that when students generated more than one problem the successive problems tended to be more interesting or complex, in the present study, we did not find a pattern in which the solvability and complexity of students’ problems increased in tandem with successive responses. These mixed results lead to further questions and suggest that to find ways to encourage students to generate complex problems, researchers need to design and evaluate alternative problem-posing prompts that consider the difficulty level of the problems. Instead of simply being asked to pose three problems, students should be prompted to pose easy, moderately difficult, and difficult problems, which would shed more light on the complexity of their problems. In support of this claim, Cai and Hwang (2023) argued that when students are prompted to pose a sequence of problems of varying difficulty, they are encouraged to engage more deeply in the mathematics involved. As Xu et al. (2020) observe, such prompts can “encourage the students to provide a mix of problems that are not simply trivial variations on the same problem.” (p.4).
Problem-posing performance can also be affected by the structure of the problem-posing prompt in addition to the problem-posing situation (Cai et al., 2023; Cai & Hwang, 2023). In this study, the generic prompt “pose three problems” was utilized. The prompt can also be configured to “pose three different problems” or “pose three complex problems.” Students may concentrate more on the differences between the problems and, as a result, the complexity may change depending on the order of responses if the prompts reflect explanations of the problems’ complexity or differences from one another. On the other hand, the literature on problem posing highlights that the complexity of the problems varies depending on the specific target group they are posed for (Kontorovich et al., 2012). The relationship between response order and complexity points in this context may also be affected by the fact that students were asked to pose complex problems for themselves or their friends. Therefore, in order to provide a clear picture of the relationship between response order and complexity, more research should be conducted with various problem-posing situations and prompts.
Teachers consider students’ inability to pose interesting and complex problems as a major obstacle to teaching through problem posing (Cai et al., 2020; Li et al., 2020). Our results reveal that students can be encouraged to pose more complex problems with structured posing because there was a considerable amount of response at a high level of complexity in structured posing. However, we should note that the results may also be due to the mathematical structure of the task. Future research should therefore focus on whether structured or free posing, designed for the same problem-posing situation, encourages more complex problem posing.
A limitation of the current study is that only one task was provided for each of the free and structured posing. Providing more tasks for each situation may yield more detailed results about the nature of the relationship between problem-posing performance and response order. The mathematical structures in free and structured posing are different from each other. Therefore, the strength of our results comparing the relationship between problem-posing performance and response order by task type is limited. To address this issue, we recommend that future investigations involve designing free and structured posing tasks for the same problem-posing situation.
Despite limitations, the present study provides a useful snapshot of the relationship between problem-posing performance and the order of the responses. However, to explain our results we have made several assumptions which our study does not provide the data to confirm due to the methodology used. The question of whether the complexity of problems is related to the order in which they are posed should therefore be pursued by taking into account students’ mathematical content knowledge and problem-posing experience in future research. Lastly, we know that different problem-posing tendencies have been observed in different countries (Cai & Hwang, 2002). Differences in teaching practices on problem posing, and students’ problem-posing experiences may influence the relationship between problem-posing and response order. Therefore, international comparison studies are needed to investigate possible effects of cultural differences on the relationship between students’ problem-posing and response order.
Footnotes
Contributorship
Tuğrul Kar identified the research problem, designed the data collection tool, managed the data collection process and analysis, drafted the paper, and contributed to revising paper. Mehmet Fatih Öçal contributed to data analysis, drafting the paper, and revising the paper. Büşra Bişgin and Melike Arslan helped design the data collection tool, collected data, and contributed to data analysis.
Declaration of conflicting interests
The authors declared no potential conflicts of interest with respect to the research, authorship, and/or publication of this article.
Funding
The authors disclosed receipt of the following financial support for the research, authorship, and/or publication of this article: The authors received financial support for the research from the Scientific and Technological Research Council of Türkiye with the project number 1919B012201930.
Informed consent
Informed consent was obtained from all subjects involved in the study.