
Abstract
This article reports the findings of a nationwide sign language translator and interpreter (SLTI) census to establish a baseline description of the United Kingdom’s SLTI workforce that was commissioned by the Association of Sign Language Interpreters UK. Complete responses were received from 690 practitioners from across the United Kingdom (43% of the potential sample). The survey responses were analysed using the SPSS statistical software, specifically to look at various intersectional characteristics concerning gender, age, sexuality, race, and ethnicity. This article provides an overview of the findings with respect to two key themes: representation and diversity in the profession, along with discussion of the profile of the SLTI profession in the United Kingdom, and recommendations for actions for key stakeholder organisations. As a first snapshot, this census functions as a baseline for future comparisons, and can be modified and improved through open dialogue with professional and community groups. This snapshot helps us to identify gaps in representation. Finally, it can also inform the planning and forecasting of recruitment needs for the workforce and highlight any education and training needs.
Keywords
1. Introduction
It is difficult to estimate the exact number of deaf signers 1 throughout the United Kingdom (UK), but based on an analysis of the 2011 Scottish census results, Turner (2020) estimates between 40,000 and 70,000 deaf signers. Sometimes the sign language translation and interpreting (SLTI) profession reflects diversities within deaf communities and wider society; at other times not as much. There is now greater awareness of the many different forms of structural inequality that disadvantage different groups and individuals in the outcomes they create. This has caused many professions in the UK to take an introspective look at their own structures and systems. These issues also have great significance in the UK SLTI profession where issues of gender, sexuality, disability, and race equity among others need to come into sharper focus to utilise the diversity of skills on offer. For the UK SLTI profession, which is predominantly female and estimated to number approximately 1,600 2 practitioners, it is therefore timely to consider the disparities perceived or experienced by members of the profession with respect to the work that SLTI professionals undertake, what is expected of them, the opportunities offered to them and any link this may have to the diversity characteristics they have. It has been argued that the SLTI profession supports social justice goals for deaf communities by providing improved access to society (McCartney, 2017). As such, it is appropriate that social justice is also embedded in the profession by identifying potential barriers that may prevent entry to, and progression within, the profession.
In recent years, there have been several movements that have motivated this study, including the #MeToo and Black Lives Matter (BLM) movements. These movements force us to better understand inequalities. This means that there is a rightful expectation of a clearer and more nuanced understanding of the composition of the SLTI profession in the United Kingdom. The concept of intersectionality, coined by Crenshaw (1989, 1991), can be used to interrogate inequalities in society, and intersectionality studies (Cho et al., 2013) highlight how the diversity of lived experiences is important to consider in all contexts. Intersectionality is therefore a valuable framework for considering the diversity and representation in the SLTI profession. Understanding gaps in the SLTI workforce profile will enable education and training institutions, professional bodies and other stakeholders to become more mindful of how to remove barriers and increase access to training and professional support for specific under-represented social groups within the profession. Improving diversity in the SLTI profession may improve opportunities for deaf people to work with interpreters that they feel represent their identities (Napier et al., 2017, 2019; Young et al., 2019).
The census was commissioned by the Association of Sign Language Interpreters UK (ASLI) in 2021 to establish a baseline description of the SLTI workforce. The broad aim was to see whether there are differences in education, work, and professional development opportunities experienced by those in the SLTI profession. As such, the specific objectives of the project were to:
Describe the demographic profile and intersectional characteristics of deaf and hearing British Sign Language (BSL)/English interpreters and translators in England, Scotland, Wales & Northern Ireland.
Map the locations of translators and interpreters throughout the United Kingdom.
Obtain information on the educational qualifications of BSL/English translators and interpreters.
Obtain information on the settings in which BSL/English translators and interpreters work.
This is to date the largest sample of SLTIs surveyed in the United Kingdom and provides a wealth of new data regarding the demographic profile of the SLTI profession. In this article, we contextualise the findings of the census, by briefly documenting the emergence of the SLTI profession in the United Kingdom and reviewing previous relevant research. We then give an overview of the methodological process for developing, conducting and analysing the census, before sharing the main findings with respect to two key themes: representation and diversity in the profession, along with discussion of the profile of the SLTI profession in the United Kingdom, and a summary of suggested recommendations for actions for key stakeholder organisations.
2. The emergence of the SLTI profession in the United Kingdom
The first moves in the United Kingdom to formally establish a SLTI profession can be traced back to the work of the Scottish Association for the Deaf approving interpreters, and the British Deaf Association’s Communication Skills Project funded through the former UK Government’s Department of Health and Social Security (1977–1981). The objective for both of these organisations was to separate formal interpreting as part of a “multi-professional role” that included spiritual and welfare roles (Corfmat, 1990) typically undertaken by White, hearing, men, to a single professional role via two registration bodies: the Council for the Advancement of Communication with Deaf People (CACDP) 3 (Simpson, 2007), and the Scottish Association of Sign Language Interpreters (SASLI). 4
Initial registrants in the 1980s were typically those who had family ties to deaf communities or worked in deaf welfare or educational roles (Scott-Gibson, 1991), with larger numbers of female interpreters. This is not surprising given that in many deaf-hearing families the family “interpreter” (child language broker) is typically, but not exclusively, the eldest female child (Napier, 2021). Many of the interpreting courses available at that time were short courses tailored to those already fluent in BSL. In the early years, deaf interpreters were included in the registers. However, this innovation fell away, and deaf translators and interpreters were only readmitted by the NRCPD 35 years later.
The 1990s saw the establishment of university sign language interpreter education programme, 5 followed by the introduction by CACDP of the National Vocational Qualification pathway, enabling people to also achieve registration by completing a vocational programme that meets the National Occupational Standards for Interpreting. 6 The two other regulatory bodies vet applicants through their own systems Regulatory Body of Sign Language Interpreters and Scottish Register of Language Professionals with the Deaf Community (RBSLI and SRLPDC).
The 2000s saw a swing from traditional interpreters (i.e., people from deaf families), to novices with little previous contact with deaf communities, and who had learnt a sign language as L2 (Stone, 2008, 2012). Brien et al. (2002, 2004) identified deaf, male, ethnic minority and disabled people’s under-representation in the SLTI profession as an area that needed to be addressed via trainee recruitment. As academics and practitioners began to recognise the SLTI profession as relatively young in status (Napier, 1998; Obasi, 2007; Pollitt, 2000), debates continued about how best to further professionalise. Within these considerations, the lack of ethnic diversity became more evident, particularly in relation to Black deaf communities.
In the late 1990s/early 2000s, Black sign language interpreters joined Black deaf activists in their journeys to America, to connect with other more established Black self-organised groups in both the American Black deaf community and the Black American sign language interpreting profession. LEMDA (London Ethnic Minority Deaf Association) and BASLIN (Black and Asian Sign Language Interpreters Network) were established around the same time. From this initiative, the first ever directory of interpreters from ethnic minorities was produced. 7 A new organisation—the Interpreters of Colour Network (IOCN)—was established in 2020 and has continued to produce a more extensive online directory.
Issues of intersectional identity, inclusion and representation in deaf communities have taken on new significance (see, for example, Chapple et al., 2021; Emery & Iyer, 2022; Leigh & O’Brien, 2020; Obasi, 2022), and as such also in the SLTI profession (Parkins-Maliko, 2022; Sikder, 2019). Developing an evidence base is vital to our understanding of representation within the SLTI profession (Obasi, 2013).
This history brings us to the current context, where questions have resurfaced as to the representativeness of the profession: who currently makes up the profession, and what we need to do to improve representation.
2.1 Who makes up the SLTI profession?
A useful starting point in developing the census was to examine what we already know about who makes up the SLTI profession and how these data were collected. Table 1 summarises various surveys that used questionnaire instruments to collect demographic information about the SLTI workforce in the United Kingdom.
Relevant UK SLTI Surveys.
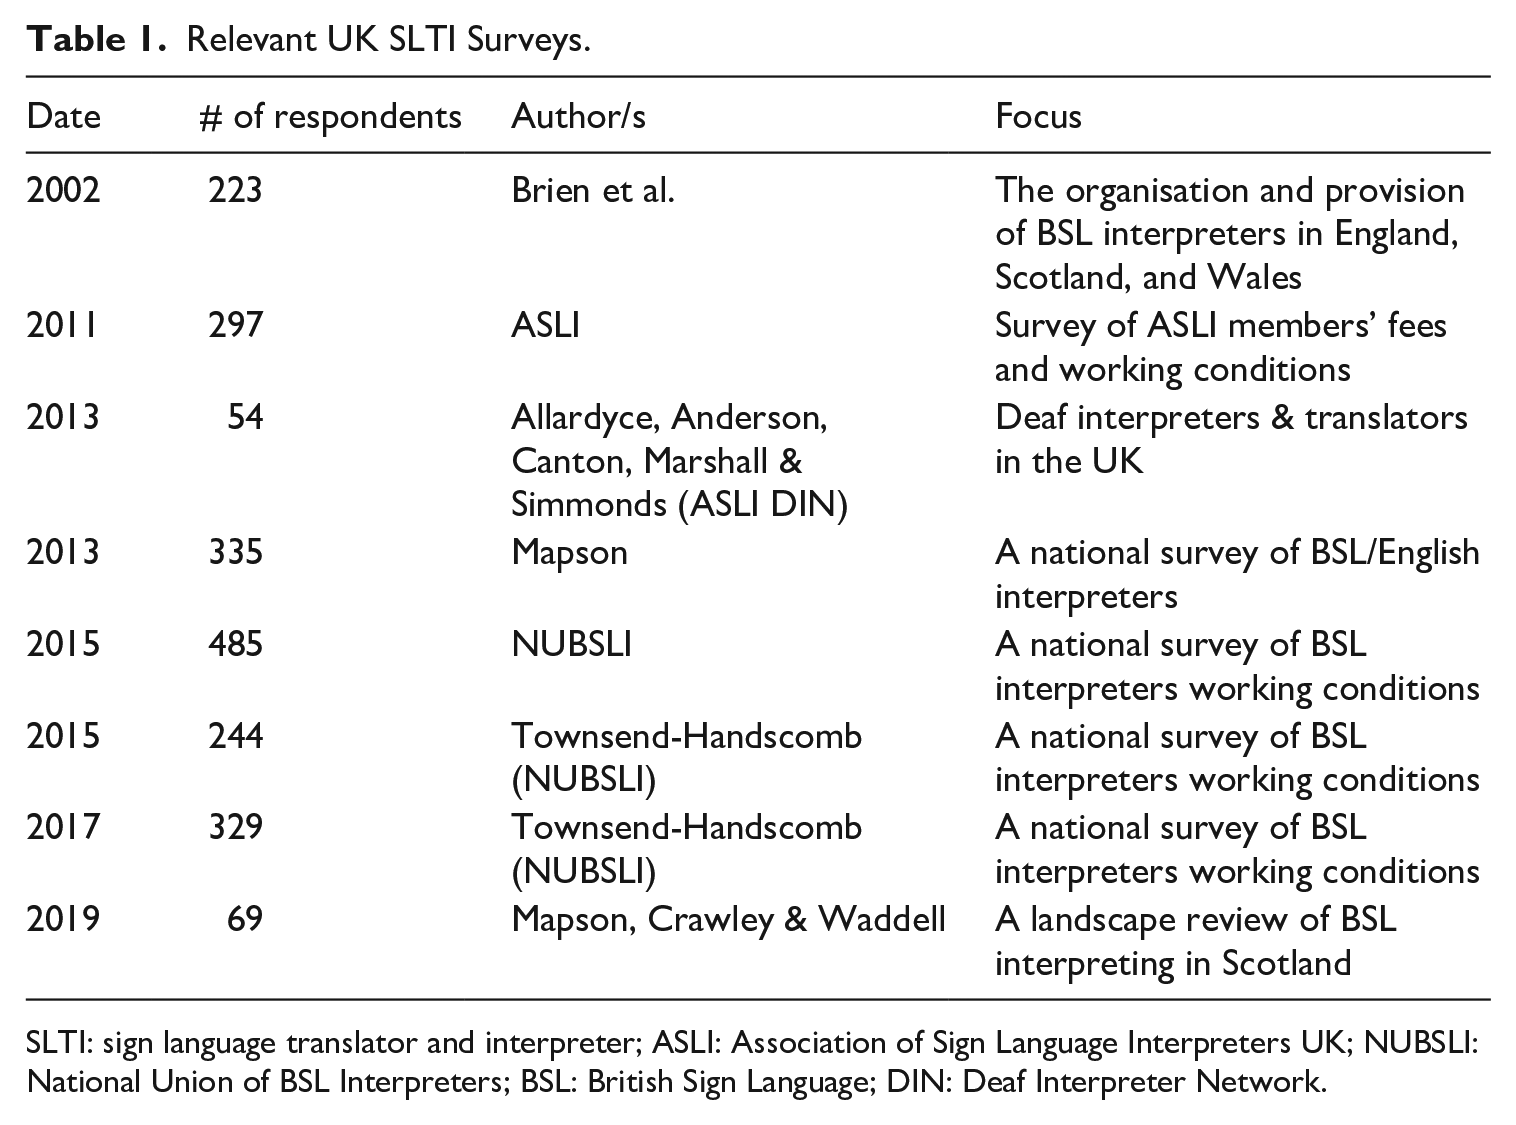
SLTI: sign language translator and interpreter; ASLI: Association of Sign Language Interpreters UK; NUBSLI: National Union of BSL Interpreters; BSL: British Sign Language; DIN: Deaf Interpreter Network.
Existing data concentrate only on interpreting and provide a useful snapshot of the emerging profile of UK SLI profession. 8 Thus, much of the demographic detail we discuss here focuses on interpreters only. Unfortunately, there are no data available that provides the specifics of the demographics in the UK deaf community, so we refer to the wider census of the UK population for comparison.
We see a pattern over several surveys in that around 85% of respondents identify as female and 15% as male (Brien et al., 2002, 2004; Mapson, 2014; Mapson et al., 2019; National Union of BSL Interpreters [NUBSLI], 2015; Townsend-Handscomb, 2015, 2017), with a small number who identify as transgender (Townsend-Handscomb, 2017). Based on the smaller number of male trainee interpreters entering the field, Brien et al. (2002, 2004) had predicted that the number of men in the profession would decline. This suggests that many of the earlier male interpreters had traditionally worked as missioners/welfare workers with deaf communities and interpreting was part of their role. So, the availability of formal interpreting training has changed the pipeline of who chooses to enter the SLTI profession.
The percentage of qualified SLTIs who have deaf signing parents (also known as heritage signers, Napier, 2021) has decreased from 31% (Brien et al., 2002, 2004) to 13% (Mapson, 2014). There are no earlier data available on the number of heritage signers in the profession. Mapson found the percentage of heritage signers was higher among SLTIs who had 15+-year experience (at 36%), which highlights how the beginnings of the profession relied on people with familial or close connection to deaf communities. This signifies an increase in hearing SLTIs who are “new signers” (De Meulder, 2018) from 69% to 87%. This may be due to the increased profile of SLTIs in the media, more awareness of sign language, and more opportunities to train and qualify as an SLTI through different pathways. Therefore, when considering deaf heritage signers, it is necessary to examine whether there are increased opportunities for deaf people from deaf families to consider the SLTI profession as a career option.
Ethnicity was only specifically reported by Brien et al. (2002, 2004), who found that 5% of respondents were from a Black or minority ethnic background, compared with 13% of the general UK population as noted in the 2001 census (Sikder, 2019). ASLI’s 2011 survey of fees and working conditions reported 9% of respondents as being “non-white” (Sikder, 2019). However, the survey did not focus specifically on ethnicities, but only asked respondents to report whether they were “white” or “non-white” without providing a breakdown of ethnicity, which is problematic in itself.
While we were able to formulate some general descriptions about the SLTI workforce, the surveys noted in Table 1 did not include a detailed list of options that enabled us to gain a more nuanced understanding. A more comprehensive list of gender identities, ethnicities, nationalities, religions, sexual identities, language profiles, family commitments and signing background is needed to fully appreciate the intersectional identities of SLTIs. For example, previous surveys did not provide space to identify those who do not have deaf parents but do have other family or close connections with a signing background, such as a deaf signing partner, sibling, or grandparents.
More work was also needed to clarify similar trends or differences between those who self-identify as deaf, hard-of-hearing, and hearing. It is anticipated that those who are registered as translators are mainly deaf or hard-of-hearing. A survey from the US Deaf Interpreters Institution (DII) indicates that this type of deaf-hearing distinction is important. In 2007, the DII found that 62% of deaf interpreters identified as female and that the majority came from deaf families (57%). Respondents to a survey of deaf SLTIs in the United Kingdom (Allardyce et al., 2013) were more balanced, with 54% being female versus 46% being male, but they were not asked if they were heritage signers. We have already highlighted how the number of SLTIs who were brought up in the deaf community has decreased within the hearing SLTI population. As noted above, changes in training opportunities may have facilitated this shift. Understanding the nature of the different pathways into the profession can help us identify to what extent these pathways have influenced the demographics of the SLTI profession.
3. Methodology
These issues of diversity and representation were also important in putting together a research team. The team involved academics who are all qualified interpreters, but who vary in terms of race, gender, sexuality, age of and route to, sign language acquisition. Each team member brought their lived personal and professional experience to the research design and data analysis. An advisory group was established to ensure representation from stakeholders across the sector from sign language teachers, sign language interpreters/translators and their representative organisations, importantly including the IOCN and the Deaf Interpreters Network, considering the focus of the study on diversity and representation. The advisory group provided critical support in the development and testing of the census survey.
Given the need to conduct a census of the SLTI population in the United Kingdom, it was agreed that an online, self-administered questionnaire would be the most effective way of reaching the sample population. After piloting, final ethics approval was received by the Heriot-Watt School of Social Sciences Ethics (Human Research) Committee on 25 January 2021.
In developing this census, decisions had to be made regarding what to include or exclude, to ensure that the census was manageable, and to reduce the risk of participant dropout. The final census was designed to take no longer than 30 min to complete. These criteria meant topics to do with the “experience of being” a SLTI professional could not be included, as they were considered beyond the scope of this census project.
3.1 The questionnaire instrument
A questionnaire was developed in written English, which was considered appropriate for a bilingual population of translators and interpreters qualified to work between BSL and English. The questions selected focused on establishing a baseline profile of the SLTI workforce.
The questionnaire was drafted initially by the research team, drawing on previous literature about what we already know about the SLTI profession and guidelines on how to design census survey demographic profile and language profile questions generally and for professional populations (Butler-Henderson et al., 2017; Marian et al., 2007; Middleton et al., 2010, 2011; Treanor, 2009). The finalising of the questionnaire followed an iterative approach: it was shared with the advisory group for feedback and the questions were revised through each iterative loop.
The questionnaire consisted of a total of 74 questions, using a combination of open, closed, single-choice, multiple-choice, and Likert-type scale questions, which were grouped into five different sections. When the final draft was confirmed, the questionnaire was transferred to the Heriot-Watt University licensed version of the online survey tool Qualtrics. The online version of the survey contained a mixture of forced and non-forced responses, and was designed to redirect participants to bypass or respond to certain questions depending on previous choices. The survey was piloted by all members of the research team and members of the advisory group (n = 17).
Section A covered demographic information and personal intersectional characteristics of the respondents relating to factors such as geographical location, nationality, age, gender, race, ethnicity, and sexual orientation. The aim of including these questions was to capture the demographic profile of sign language interpreters and translators in the United Kingdom, and to consider how diversity in the SLTI profession might extend to other intersectional characteristics.
Section B focused on respondents’ linguistic and cultural profile, with a specific interest in identifying how many SLTIs were heritage or new signers, and their relationship with the deaf community. This has been highlighted as an important aspect that contributes to the standing and perception of (particularly hearing) interpreters as allies who recognise their role in the wider social justice landscape, rather than simply as language technicians (Hall et al., 2016).
Section C concentrated on respondents’ current professional status as interpreters/ translators, and was dedicated to understanding the qualification and registration status of respondents and their workload, as well as exploring what (if any) career breaks they had taken, and their career history. Taking into account the Covid-19 pandemic, we also asked about the proportion of interpreting work carried out online before and during the pandemic.
Section D focused on respondents’ professional and training background. Section E sought to create an overview of respondents’ work patterns: the main region(s) in which they work, their main areas of work (BSL-English translation, BSL-English interpreting, deafblind/visual frame interpreting, etc.). In this article, we focus on the results from Sections A—C to consider key themes of diversity and representation in the profile of the SLTI profession.
3.2 Survey administration and participant recruitment
The first round of the online survey was made open to the UK SLTI population for 2 weeks between 1 and 14 February 2021. An invitation to participate in the survey was presented in BSL and in English, and posted on the ASLI UK webpage. 9 Although the questionnaire was only available in English, SLTI professionals were offered the opportunity to engage in the survey in BSL through one-to-one interviews with a member of the research team. However, nobody took up this offer. In response to feedback, four members of the research team held a BSL question-answer session on 10 February 2021, in which SLTI practitioners could raise questions or concerns about answering the census.
Using network and snowball sampling techniques (Cresswell, 2013), the invitation was disseminated through the membership and registration databases of the advisory group organisational members, as well as through the research team and using video graphics via various social media networks. In total, 822 respondents began the questionnaire with 690 completing it in full. It is not possible to determine the exact size of the population as the SLTI profession is not regulated in the United Kingdom. Nevertheless, based on the largest number of registrants with the NRCPD, the potential sample population was estimated to be 1,600 practitioners. This suggests maximally a 43% response rate. According to Babbie (1990), a survey return rate from 50% of the potential sample population is adequate, 60% is good, and 70% is very good. However, for sampling organisations or professional groups, a response rate of 35.7% is considered good (Baruch & Holtom, 2008). From this perspective, the response rate of 43% for this SLTI survey can be considered acceptable.
3.3 Survey analysis
An initial descriptive statistical analysis was conducted to summarise the responses to each question and create heat maps. This provided a snapshot of the general demographic profile of the SLTI profession with sufficient granularity while maintaining the anonymity of respondents.
To understand any significant relationships within the data, Pearson’s chi-square analysis was used to explore relationships between female and male respondents, Black/minority ethnic and White respondents, and respondents who identified as lesbian, gay, bisexual, transgender, queer (questioning), intersex, asexual, and LGBTQIA+ and heterosexual with respect to (1) part-time versus full-time work and (2) caring responsibilities.
4. Results
Here we present descriptive statistics to summarise response rates, and inferential statistics when statistical significance can be observed. The results focus on the 690 fully completed census responses.
4.1 Section A: General demographics
The majority of SLTI survey respondents were based in England (98.13%). Figure 1 provides a further breakdown of respondents by UK regions. Greater London (18.4%) was the most populated region, followed by the South-East (11.88%) and Scotland (11.88%).
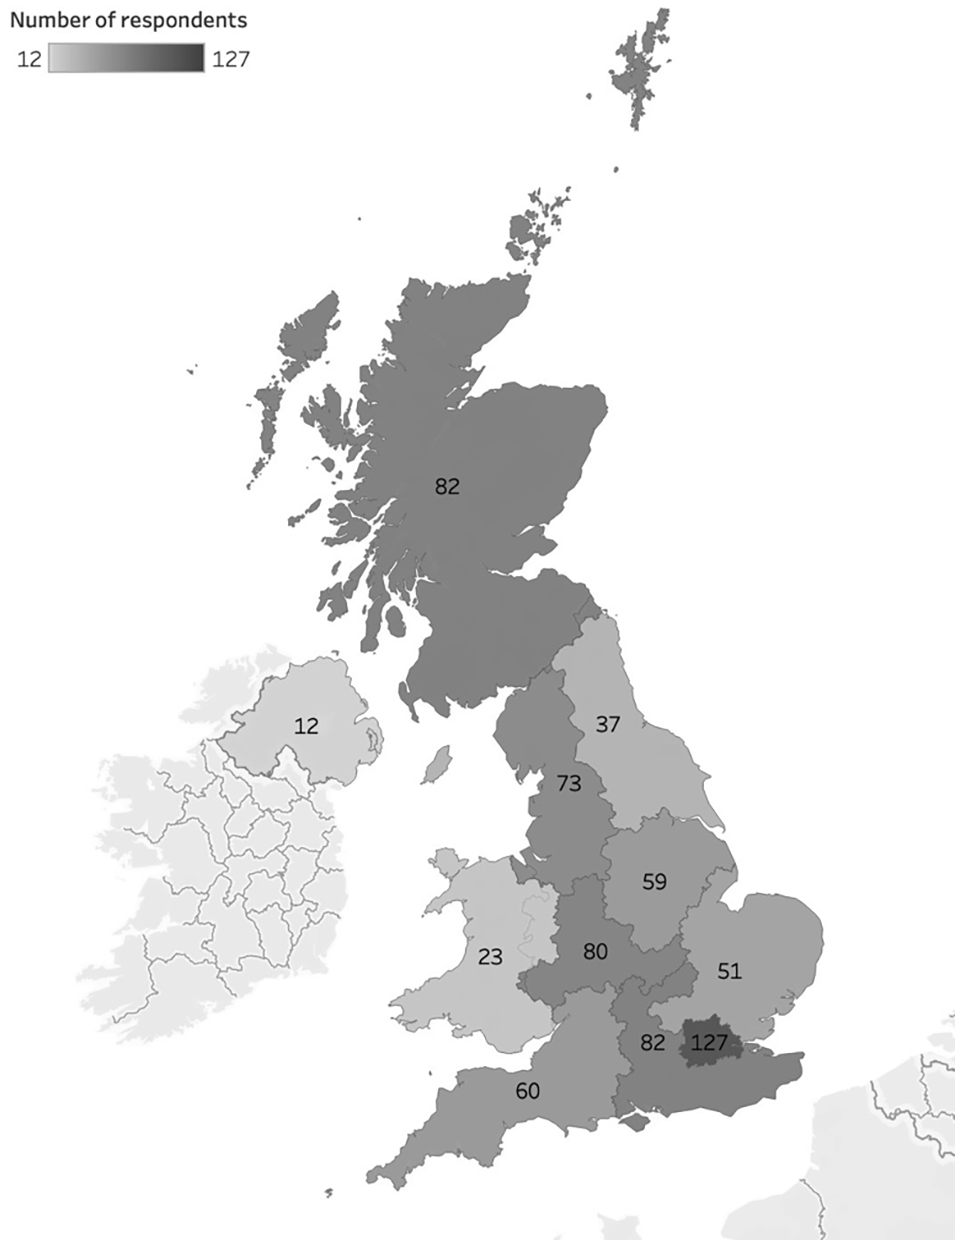
Number of Respondents by UK Regions
When looking at the distribution of deaf SLTIs (n = 25) across the United Kingdom, Greater London appeared to be the most populous (n = 7), followed by the Northeast (n = 3) and Southwest (n = 3). The census did not surface any deaf SLTIs based in the East of England.
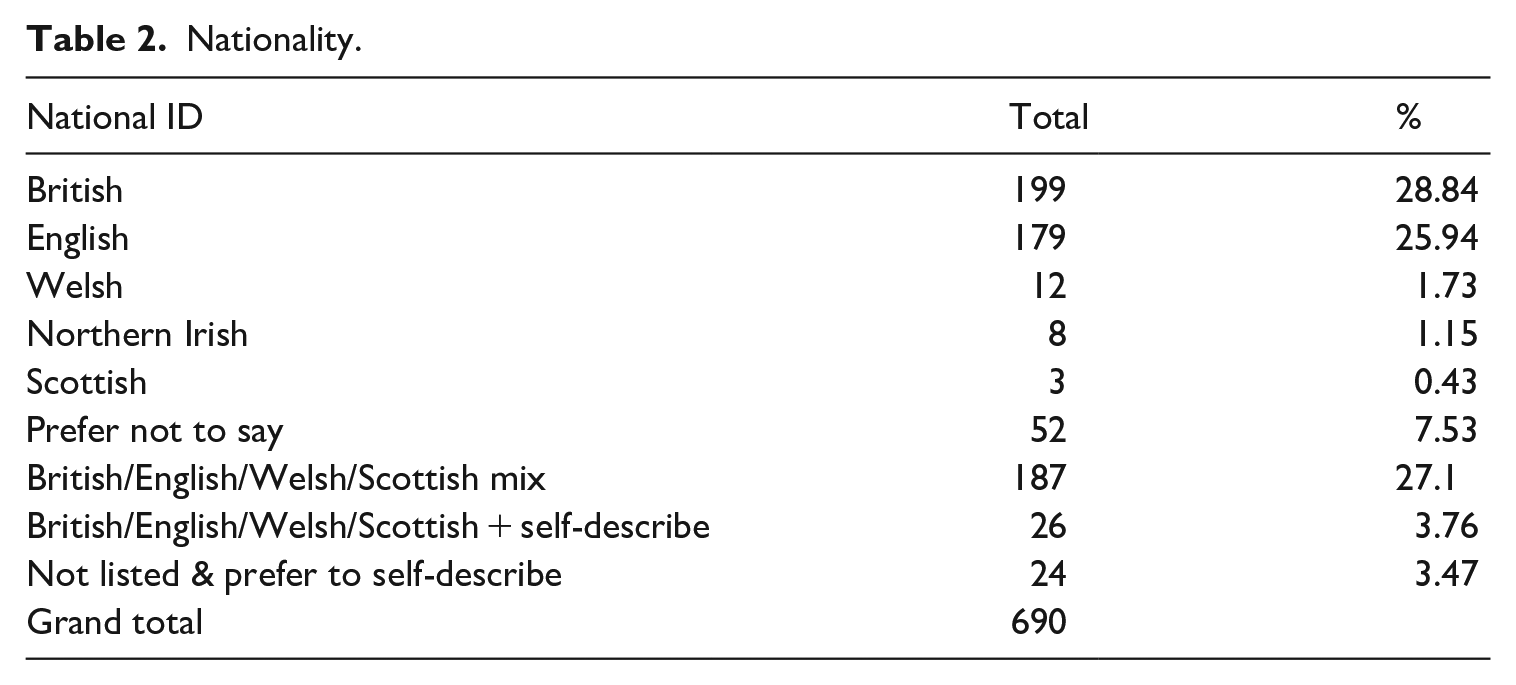
As a whole, 93.75% of respondents were born in the United Kingdom. When comparing the SLTI census data with Office for National Statistics (ONS) figures, roughly 86% of the general UK population were born in the United Kingdom, whereas 14% were born overseas (5% European Union [EU] 27 nationals and 9% non-EU) showing less diversity than the general populace. 10 This low level of diversity also exists within the deaf practitioner population, where all but one were born in the United Kingdom. The nationality data are comparable with country of birth data, where the majority identify as having British heritage (Table 2).
Nationality.
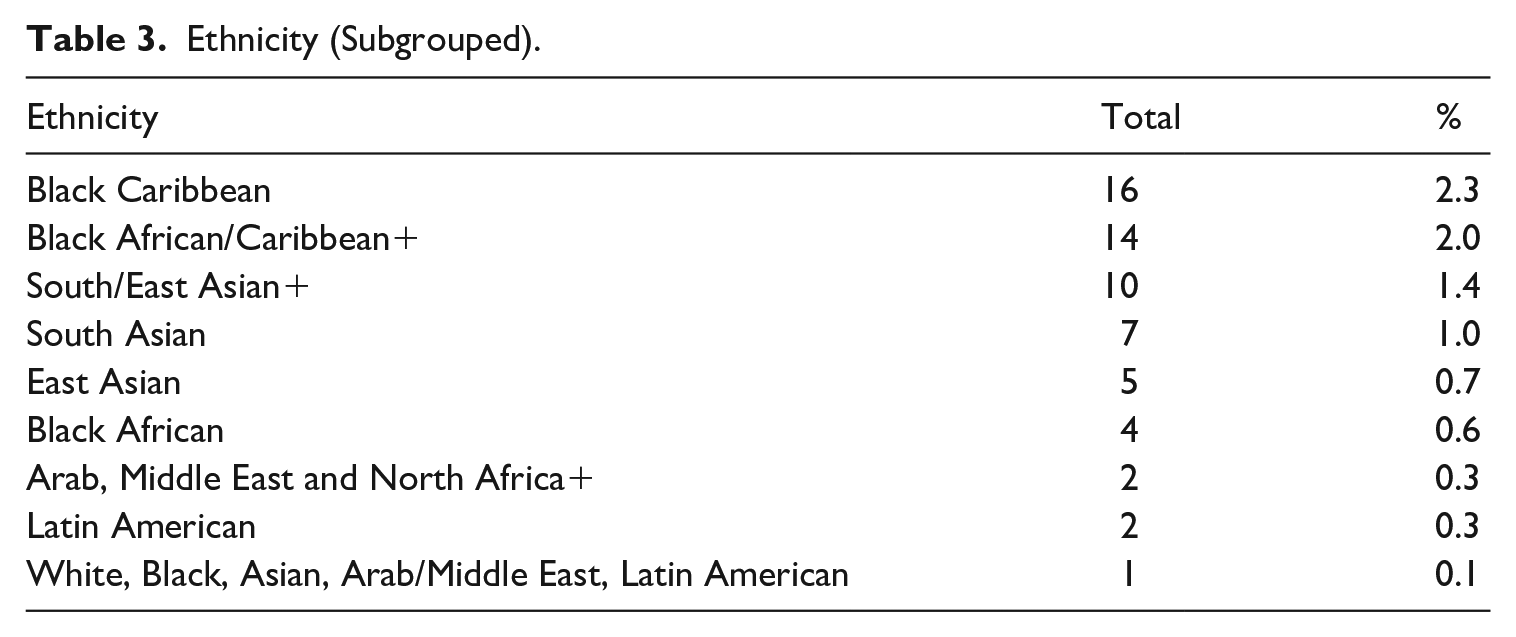
Continuing with the theme of nationality and heritage, most SLTIs identified as “white” (89.5%). The lack of ethnic diversity was again observed within the deaf practitioner group, where the majority were also White (88%). Table 3 provides a more detailed look at the ethnic diversity (or lack thereof) of SLTIs. Of the respondents with a mixed ethnicity, the largest number of responses noted were for Black Caribbean.
Ethnicity (Subgrouped).
At the time of completing the survey, the oldest respondent was 76 years of age (year of birth, 1945) and the youngest respondent was 18 years of age (year of birth, 2003). The median year was 1977 (about 44 years old), and the mode year 1973 (about 48 years old).
In recognition of the varied conceptualisations and self-descriptions of gender and non-gendered identities, the SLTI census offered more than the traditional binary options. This is one example where the SLTI census deviated from the 2011 census; however, it is expected that the 2021 census will produce comparable data. In total, the majority identified as female (82.08%), with 16.81% identifying as male, 0.43% as nonbinary/genderqueer, and 0.28% as transgender. The female–male balance is consistent with other large-scale surveys on the SLTI profession. A total of 679 out of 690 respondents identified with the sex registered at their birth.
Unlike the gender imbalance described for hearing SLTIs, the deaf SLTI population was more balanced, with 60% females and 40% males. This finding is similar to the results reported in the ASLI DIN survey (Allardyce et al., 2013). For the question “Is the gender you identify with the same as your sex registered at birth?,” 100% of the deaf practitioners answered “yes.”
Although they may not represent the specific demographics of UK deaf communities, the groupings of SLTIs seem broadly representative of the wider population. An interesting point to note is that the second and third largest categories are reversed when comparing the wider UK population and SLTIs.
In terms of sexuality, the ONS 2018 data found that 94.6% of the UK population (aged 16 years or above) identified as heterosexual (SLTI = 80.14%). According to the ONS, 2.2% of the UK population identified as LGBTQIA+, while our data report a figure seven times higher as 14.49% of the SLTI profession. This confirms anecdotal reports of there being a higher proportion of LGBTQIA+ within the SLTI profession when compared with the general population.
The majority of respondents (536, that is, 77.68%) indicated that they did not have a disability or mental health condition, whereas 24 (3.47%) abstained. In total, the survey produced 64 types of disability and mental health conditions from the 125 (18.11%) who reported having a disability or mental health condition. 11 The largest number of these respondents (50/7.24%) identified as having a mental health condition. The second largest group, 35 (5.07%), identified as having “stamina or breathing fatigue.” Other trends included 26 (3.78%) mobility conditions (e.g., walking short distances or climbing stairs), and 20 (2.89%) dexterity conditions (e.g., lifting or carrying objects, using a keyboard).
Potential issues with the phrasing of the SLTI census question, “Do you have a physical or mental health condition or illness lasting or expected to last 12 months or more?” was raised by one respondent. It was explained how being neurodivergent does not necessarily mean having a physical or mental health condition. It is possible the phrasing of this question did not inspire those who were neurodivergent to respond. A total of 12 (1.73%) respondents indicated they had a “social or behavioural” condition (e.g., conditions associated with attention deficit disorder or autism spectrum disorder).
We sought to understand how many SLTIs had caring duties, either for their own children, or for another child or adult requiring their committed support. In total, 390 respondents (56.5%) indicated that they were parents, with 184 respondents (26.6%) having one or more children under the age of 12 years. In addition, 167 (24.2%) confirmed they had official unpaid caring duties for an adult or child.
Pearson’s chi-square analyses showed that there is no significant difference in the prevalence of caring responsibilities between male and female respondents, χ2(1) = 0.199, p = .655, between respondents who were White or from minority ethnic groups, χ2(1) = 0.235, p = .628, or between heterosexual and LGBTQIA+ respondents, χ2(1) = 0.196, p = .658 (see Table 4).
Caring Responsibilities by Characteristics.
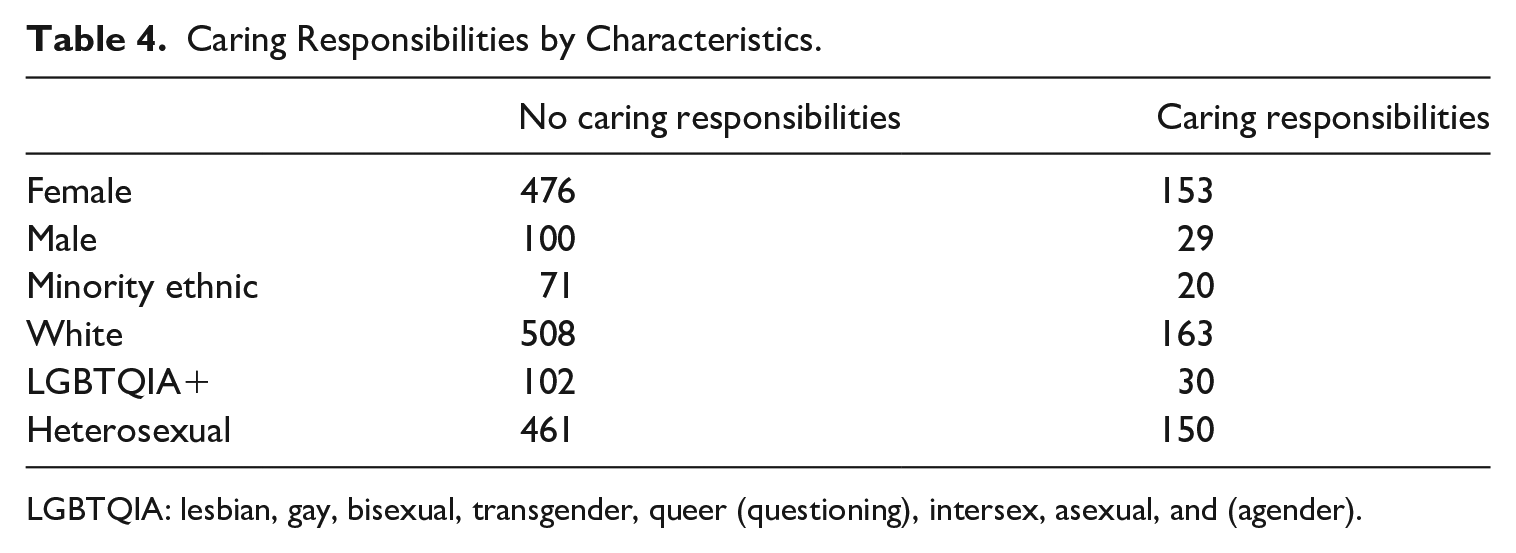
LGBTQIA: lesbian, gay, bisexual, transgender, queer (questioning), intersex, asexual, and (agender).
Comparing the SLTI data with ONS (2011) figures for England and Wales, we see some interesting differences with regard to religion, as more SLTIs reported being non-religious than the wider population (see Table 5).
Comparing Wider Population and SLTIs on Religion.
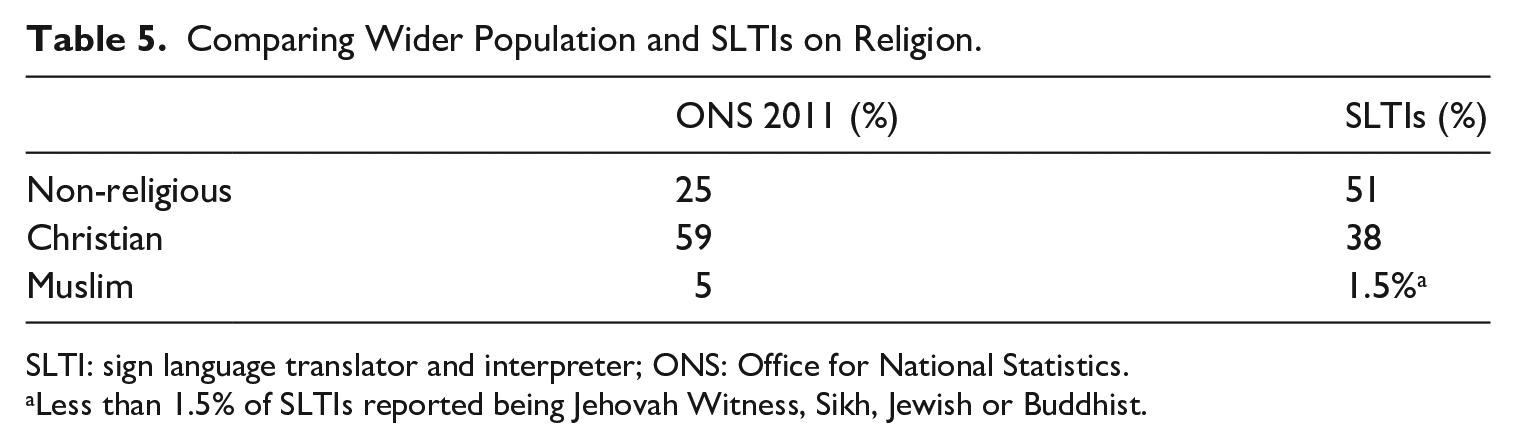
SLTI: sign language translator and interpreter; ONS: Office for National Statistics.
Less than 1.5% of SLTIs reported being Jehovah Witness, Sikh, Jewish or Buddhist.
Interestingly, the ONS data reveal that those who identified as non-religious tended to be White, British, and under the age of 50 years. These variables describe the majority of SLTIs who responded to this census.
4.2 Section B: Linguistic and cultural profile
As expected, the majority of respondents were hearing (92.5%), with a minority identifying as deaf or hard-of-hearing (4%). A few respondents either abstained from this question, or opted to self-define as being hearing but feeling culturally deaf because they grew up in the deaf community.
Traditionally, when asking SLTIs whether they have family and/or personal ties to the deaf community, this has been taken to mean whether they have deaf parents. This census broadened the focus to include extended family members, non-biological relatives, and partners. More than two-thirds of respondents (69.1%) had no family or personal connections with the deaf community. Table 6 provides a breakdown of the 213 respondents who have a deaf family or personal connection.
SLTI Deaf Signing Connections.
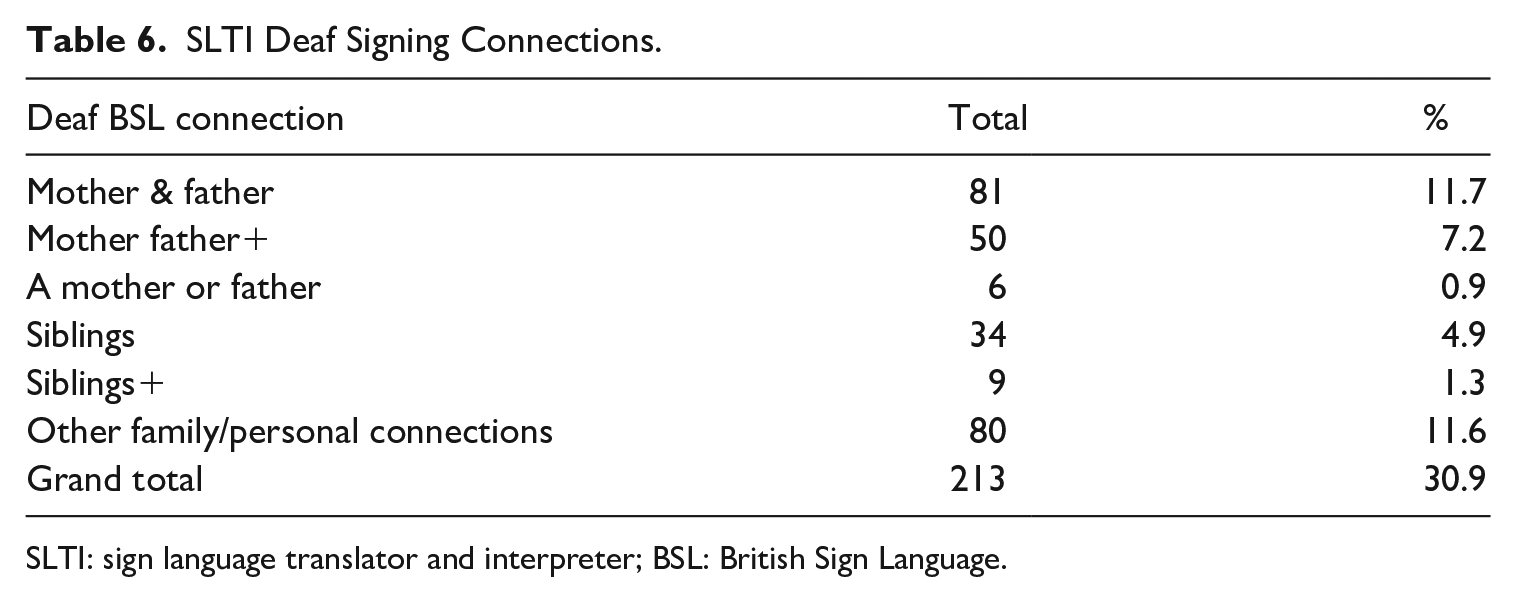
SLTI: sign language translator and interpreter; BSL: British Sign Language.
The majority of deaf SLTIs came from a signing background (n = 17). Nearly half of this sub-population were in a relationship with another deaf signing person (48%). One-third (32%) were heritage signers. All of those who reported having deaf parents also had other deaf signing relatives. The number of deaf SLTIs who were new signers represented only a third of the deaf SLTI population (n = 8, 32%).
Considering that most of the respondents were “hearing British” with no family or personal connection with deaf signing communities, it is not surprising that the majority (84.2%) identified English as their preferred language. Nearly two-thirds (64%) of deaf SLTI practitioners considered both English and BSL as their preferred language. A few considered BSL (n = 4) or English (n = 3) as their “preferred language.” The other “preferred language” included three signed languages (Irish Sign Language, Swedish Sign Language, Australian Sign Language) for deaf SLTIs, and five spoken languages (French, German, Nigerian, Spanish and Welsh) for hearing SLTIs. 12
The majority (87.8%) of SLTIs did not know another signed language. One third of those who did know another signed language were deaf SLTIs (n = 16). The most common “other signed languages” were International Sign (n = 13), ASL (n = 12), Auslan (n = 10), ISL (n = 9), and deafblind communication (n = 6).
The majority of SLTIs only knew English as part of their written/spoken language profile (at 82.6%). The knowledge of another spoken/written language was more diverse than other signed languages, with a combined list of 36 different spoken/written languages. The most popular languages were European languages: French (n = 30), Spanish (n = 30), and German (n = 21). Less frequent responses included (in no particular order) Mandarin, Cantonese, Punjabi, Jamaican Patois, Italian, Arabic, Welsh, and Hindi.
4.3 Section C: Registration and employment
In the United Kingdom, there are three national registration bodies. The majority of respondents were registered with NRCPD (90.4%), followed by RBSLI (3.9%) and SRLPDC (3.6%). Some respondents (n = 61, 8.8%) are registered with more than one organisation. Approximately 85% have fully qualified status (interpreters and translators combined), whereas 13.5% are trainee interpreters. The remaining 1.5% were lipspeakers, notetakers, or deafblind communicators.
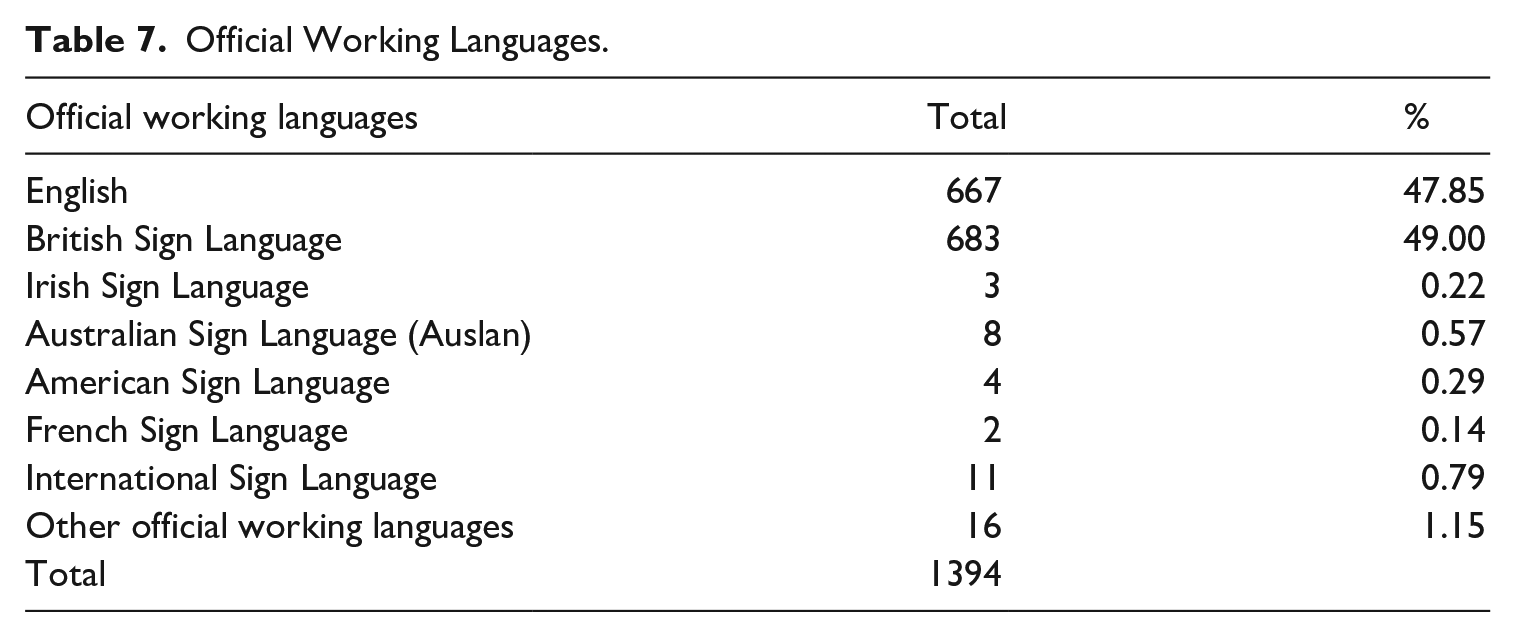
SLTIs were asked to note their official working languages (those that they are qualified to interpret between). While some respondents were multilingual, most responded that English and BSL were their working languages (Table 7).
Official Working Languages.
The majority (46%) of SLTI professionals work full-time in a self-employed capacity, followed by those who were part-time and self-employed (38.6%) (see Table 8). Nearly a quarter of the latter subgroup also worked in another employed position (51 part-time and 7 full-time). Only three deaf SLTIs worked in a full-time employed position. Twenty deaf SLTIs are self-employed, whereas 10 are full-time.
Employment Status According to Characteristics.
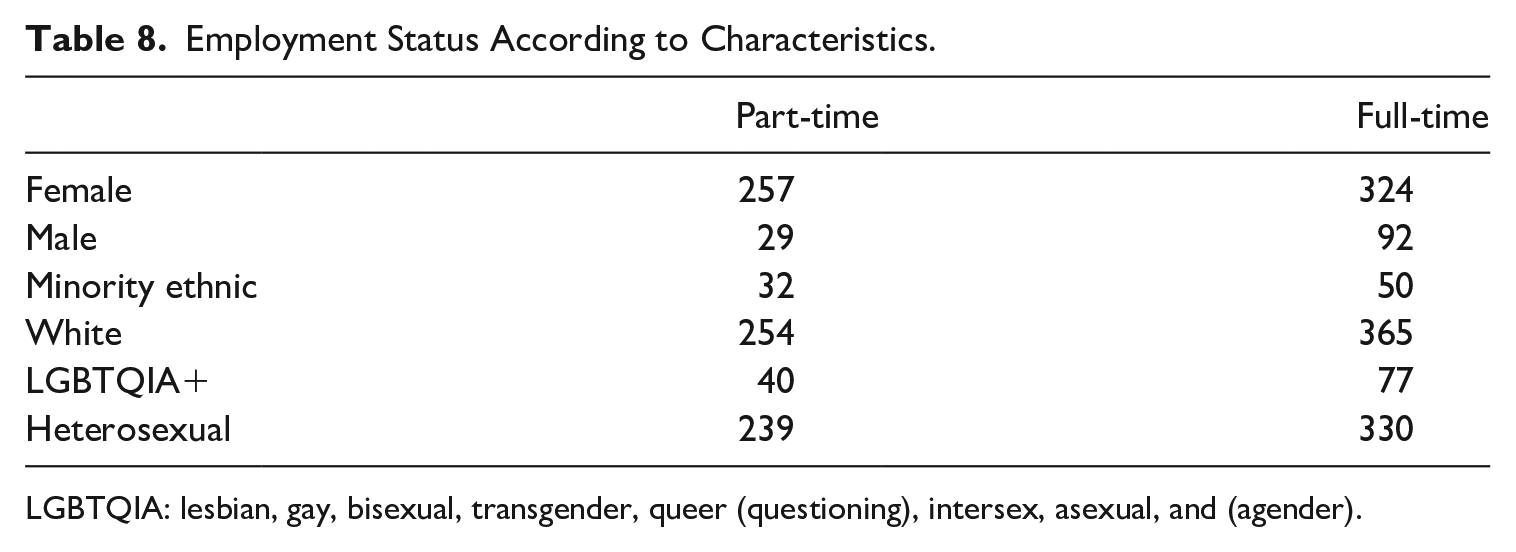
LGBTQIA: lesbian, gay, bisexual, transgender, queer (questioning), intersex, asexual, and (agender).
Pearson’s chi-square analysis showed that females are significantly more likely than males to work part-time, χ2(1) = 17.038, p > .001. Analysis of relative risk suggested that females are approximately 85% more likely (almost twice as likely) as males to work part-time. Pearson’s chi-square analysis revealed that there is no significant difference in the prevalence of part-time versus full-time work between respondents who are from minority ethnic backgrounds and White respondents, χ2(1) = 0.121, p = .728, or between heterosexual and LGBTQIA+ respondents, χ2(1) = 2.457, p = .117.
We found that 10% of the respondents had taken a career break, ranging in duration from 3 months to 204 months (17 years). The mode was 12 months. (Many commented that this break was maternity leave, and some had taken maternity leave more than once).
5. Limitations of the study
Before we conclude, there are some limitations to the study worth noting. The ideal would have been to make the survey available in both BSL and English. Creating bilingual/multilingual surveys in written languages is already a complex process (Sha & Pan, 2013), and creating a bilingual survey in a signed and written language using video technology is even more challenging, although not insurmountable (Bosch-Baliarda et al., 2019; Lucas et al., 2013; Napier et al., 2018). For the purposes of this study, budgetary and time constraints precluded a bilingual survey. The offer of completing the survey in BSL was also not taken up. This could have been because SLTIs all felt confident to respond in English, because they did not want to bring attention to the fact they would rather complete the questionnaire in BSL, or because they were concerned about lack of anonymity if they responded in BSL, or because they work between BSL and English they were comfortable answering questions in English. In any case, it should be acknowledged that because the questionnaire could only be answered in written English, this might have deterred deaf SLTIs from participating in the survey. Furthermore, while SLTIs are required to work between English and BSL, NRCPD have now introduced a new category of Intralingual Relay Interpreters, where deaf interpreters will not be required to work between BSL and English. Therefore, it is imperative that any future census surveys are offered in both English and BSL.
We received 690 complete responses, giving a 43% response rate from a population of 1,600. Ideally, in survey research terms, this should have been higher. However, as noted in the introduction, this is to date the largest sample of SLTIs surveyed in the United Kingdom. For any future census, it is suggested that allowing a longer period for completion of the questionnaire and making a version available in BSL may encourage more practitioners to respond. Having a baseline description from this census provides a point of comparison for future data collection. These data have also documented who are present, visible, and well represented within the profession, and uncovered those who are absent, unseen, or peripheral.
Despite piloting the survey instrument, analysis of the data revealed that some questions should have been reworded to elicit data more accurately. (For example, for the question asking about other sign languages, many respondents listed BSL when we really wanted to elicit sign languages other than BSL. Also, the question asking about physical and mental health conditions may have inadvertently excluded neurodiversity.)
This final point ties into what kinds of questions a census should contain and the compromises that need to be made when selecting certain topics or questions. We recommend that ASLI commissions a census every 5 years to see how far-reaching and long-lasting the recommendations we make are, and what impact, if any, the changes have on the demographic make-up of the SLTI profession. Such a census should include more options for Northern Ireland, as well as new questions related to updated registration categories, available training programmes, post-pandemic working, and patterns of remote working and training needs. There also needs to be a BSL translation of the census survey instrument.
6. Conclusions
The national census of SLTI practitioners has provided the opportunity to examine the current demographic profile of practitioners with regard to diversity and representation in the profession, the results of which will assist future recruitment, mentoring and professional development plans for key stakeholder organisations.
In sum, the census data reveal that the typical SLTI practitioner in the United Kingdom is a non-religious hearing 44-year-old White British heterosexual woman, with caring responsibilities, who is self-employed, hails from England, works predominantly as an interpreter (more so than as a translator), has qualified through the academic or vocational training system (or a combination of both), is registered with NRCPD and is a member of ASLI. One characteristic that is higher in proportion than the wider population is the representation of SLTI professionals who identify as LGBTQIA+. This is a positive story of representation. Comparison with ONS figures shows similar percentages for some ethnic backgrounds, so the SLTI profession is representative for some intersectional characteristics, but others are still under-represented.
Despite Brien et al.’s (2002, 2004) call for recruitment of SLTI trainees to include more men, people from different minority ethnic groups, deaf and disabled people, we have only seen minor shifts in the last two decades. Brien et al. predicted a drop in male SLTI professionals, but this has not been the case. The presence of male SLTIs has been maintained, but, in line with the nursing profession, the SLTI profession could take steps to “degender” the profession (Sasa, 2019), to increase the proportion of men.
There has been a marginal increase in the number of SLTI professionals from ethnic minorities, but not in sufficient numbers to lead to an appropriately diverse professional profile. This may be due to a number of reasons, including the fact that potential SLTI professionals do not see enough ethnic diversity among existing interpreters and interpreter educators to attract them into the profession (Obasi, 2013; Sikder, 2019). There is a danger that the SLTI profession will become further institutionalised as a White profession if steps are not taken to actively change this profile. Interestingly, SLTI practitioner representation from ethnic minority backgrounds is the reverse of the wider population, in that Black interpreters are the second largest group, followed by Asian interpreters. So, although active recruitment of Black interpreters is needed, particular effort should be made to recruit interpreters from Asian and other ethnic minorities.
There has also been a marginal increase in the number of deaf SLTI practitioners, and this subgroup evidences a more balanced gender profile. However, the proportion of deaf practitioners is very small and mostly concentrated in London. Although it is known that deaf people have practised as interpreters and translators informally for many years (Adam et al., 2014), a concerted effort clearly needs to be made to recruit more deaf people into the profession throughout the country, to provide more balance, particularly in terms of ethnic minority representation, as all but one of the 25 deaf census respondents were White. An increase in the number of registered deaf practitioners to date is positive, and now that the NRCPD has introduced a new deaf (relay-intralingual) interpreters’ registration category, this may attract more deaf people into the profession as they can opt to register as an interpreter or translator. 13 However, the training options for deaf practitioners are very limited (evidenced by the fact that most completed a vocational programme to achieve their qualification), which may continue to impact on recruitment if the availability of deaf SLTI training programmes does not change in the foreseeable future. At present, there is only one academic programme in the United Kingdom, offered by the University of Wolverhampton, that is mapped against the National Occupational Standards and approved by NRCPD for SLTI registration for deaf practitioners. 14
There appears to have been a positive shift in the number of SLTI practitioners who identify as having some form of disability, but this is difficult to say for sure as this is the first time that such a question has been asked directly (apart from Lamb, 2020 survey specifically targeted at neurodivergent SLTI practitioners). Brien et al. (2002) suggested that there was an under-representation of disabled people in the profession but did not specifically report on any data. Since our census also included deaf practitioners, it may be that some deaf respondents would identify as having a disability on the basis of their deaf status. Nevertheless, given the increasing awareness in society of intersectional characteristics that make up a person’s identity, 15 and a broader recognition of disability and neurodiversity as intersectional characteristics, it is possible that SLTI practitioners feel more comfortable nowadays to disclose their disabled or neurodivergent status. This proposition needs to be checked and compared again at a future point in time.
The number of SLTI practitioners who are heritage signers or who come from signing backgrounds is higher than that reported in previous surveys, although this census does not just report respondents that have deaf parents but rather all People from Deaf Families (PDF) (Napier, 2021). This census also includes deaf practitioners, whereas previous surveys have focused on hearing interpreters only. This may skew the findings of a higher number of PDF respondents for this survey, since many deaf SLTI respondents have deaf family members. Nevertheless, this is a positive shift. That they would have had frequent/many experiences of sign language brokering when they were young could have been a natural precursor pathway into the profession (Napier, 2017). It has been noted, however, that sign language interpreter training programmes are more geared towards “new signers” who can enrol in programmes with no sign language background (Williamson, 2016). Anecdotally, there are many reports of high levels of attrition of heritage signers from training programmes (especially from academic programmes), which needs to be taken into consideration in future planning for recruitment and training. In the United Kingdom, there is now one new qualifying interpreter training programme targeted specifically at hearing heritage signers. 16
From our data, hearing interpreters tend to be concentrated in London and the South-East, and in areas closer to current or former academic training programmes (Birmingham, Edinburgh and Bristol), that is, they are more likely to stay in the area after graduating. By contrast, most deaf practitioners are located in London. Given the shift to remote working reported by UK respondents to this census, and from SLTI practitioners in other international locations since the pandemic (De Meulder et al., 2021), geographical location may be less of an issue if the “new normal” for post-pandemic SLTI provision involves a hybrid of face-to-face interactions and online work.
In revisiting the aim and objectives of this census, we see that a baseline description of the SLTI workforce is that the profession is becoming more diverse and representative of the wider population, but overall is still a White, female, profession. The intersectional experiences of SLTI practitioners have a bearing on their profile, but more effort needs to be made to recruit a more diverse workforce. As such, we make the following recommendations for stakeholder organisations:
SLTI registration bodies and the NUBSLI to establish policies and targets, with targeted outreach for registration categories that include SLTIs with diverse characteristics reflecting the wider UK population.
SLTI membership organisations (namely ASLI, Visual Language Professionals [VLP], Scottish Collaborative of Sign Language Interpreters [SCOSLI], IOCN, DIN) to work with the Association of British Sign Language Tutors and Assessors (ABSLTA) to engage with all BSL training providers, to promote the SLTI profession to BSL students from diverse backgrounds (including ethnic minorities, LGBTQIA+, men, deaf, and disabled).
SLTI membership organisations to engage with all training providers to support recruitment strategies into training programmes for students from diverse backgrounds.
SLTI membership organisations to work with ABSLTA and BSL teachers, as well as representative deaf ethnic minorities organisations and hearing ethnic minorities organisations in regions where there are higher populations of ethnic minorities in the wider and deaf communities (in particular London, Glasgow, the Midlands, and North West England), to target BSL classes and deaf community networks for recruitment of BSL learners/users from ethnic minorities.
SLTI membership organisations to work with SLTI agencies to develop policies and targets for booking interpreters and translators, to ensure representation of practitioners with diverse characteristics, particularly practitioners from ethnic minorities or who are deaf; and to ensure a gender balance in high-status work.
Registration bodies to require interpreters and translators to evidence some level of engagement with diversity and inclusion issues as part of their annual Continuing Professional Development requirements.
All stakeholder organisations to ensure that marketing materials feature intersectional representation in photos/videos of people who are ethnic minorities, deaf, or disabled, and that these materials reflect a balance of gendered characteristics.
SLTI membership organisations to work with British Association of Teachers of the Deaf (BATOD) in engaging with teachers of the deaf, to promote the SLTI profession as a career choice to deaf students.
BSL and interpreter training programme educators and SLTI membership organisations to use visual materials and case studies that feature intersectional representation of people from ethnic minorities, or who are deaf or disabled, and to balance gender in any training materials.
Footnotes
Acknowledgements
Many thanks to data scientist, Dr Ixone Sáenz Paraíso, who assisted with creation of the heat maps, and the Advisory Group members for their support throughout the project in devising the census questions, disseminating the call for participation and giving feedback on the recommendations.
Declaration of conflicting interests
The author(s) declared no potential conflicts of interest with respect to the research, authorship, and/or publication of this article.
Funding
The author(s) disclosed receipt of the following financial support for the research, authorship, and/or publication of this article: This research was funded by the Association of Sign Language Interpreters UK, with in-kind contributions from Heriot-Watt University, the University of Wolverhampton, and the University of the West of Scotland.