
Abstract
Introduction:
Facial palsy can substantially impact daily functioning and psychosocial well-being. The relationship between duration of facial palsy and quality of life (QoL) remains unclear, with previous studies often assuming a linear association. This study aimed to further explore the association between duration of facial palsy and patient-reported QoL.
Methods:
We retrospectively analyzed 84 adult patients with facial palsy attending the outpatient clinic of a tertiary plastic surgery center. Facial function was assessed using the Sunnybrook Facial Grading System, and QoL was measured with the disease-specific Facial Clinimetric Evaluation (FaCE) scale. Nested regression models were constructed to evaluate duration of palsy as a linear, quadratic, and cubic term, adjusting for age, gender, and Sunnybrook score. Changes in explained variance (R2) were used to assess model fit.
Results:
Median age was 62.6 years, and median duration of palsy was 12.1 years. Vestibular schwannoma (27%) and trauma (11%) were the most common etiologies. The baseline model explained 21.0% of variance in QoL scores. Including duration of palsy as a quadratic term significantly increased explained variance to 28.9% (R2 change = .079, P = .025). Linear and cubic functions did not significantly improve model fit. The relationship between duration of palsy and QoL appeared non-linear, with initial improvements followed by long-term decline.
Conclusion:
Duration of facial palsy is associated with QoL in a non-linear manner. Future studies should consider including duration of palsy, preferably modeled quadratically, when investigating factors influencing QoL.
Introduction
Facial palsy can have a profound impact on daily functioning and psychosocial well-being. Patients may experience impaired facial expression, difficulties with oral competence and eye closure, asymmetry at rest and during movement, and associated social stigma. These functional and esthetic consequences can negatively influence quality of life (QoL), and several factors—such as the etiology of the palsy, the severity of facial dysfunction, and demographic characteristics—have been shown to contribute to variations in QoL outcomes.1,2
One factor that remains not well understood is the duration of facial palsy. Some individuals may adapt to their condition over time, leading to improved acceptance or coping, whereas others may experience cumulative psychosocial burden, progressive distress, or fatigue associated with the chronic nature of the condition. Prior studies have reported inconsistent findings regarding the association between duration of palsy and QoL, and most assume a linear relationship, which may oversimplify a potentially more complex relationship.1-3
Materials and Methods
This study is a retrospective analysis of previously collected research data at the outpatient department of our tertiary plastic surgery center. Approval of the Medical Ethics committee and written consent of patients were previously gathered.
Patients were 18 years or older, suffering from varying degrees of facial palsy, and fluent in Dutch. Patient characteristics were derived from the electronic health records. Facial function was graded according to the Sunnybrook Facial Grading System (SB), 4 which is a validated clinician-graded measure capturing resting symmetry, vaoluntary movement and synkinesis. As a measure of quality of life, the Facial Clinimetric Evaluation (FaCE) scale was used. 5 This questionnaire is a disease-specific patient-reported outcome measure for facial palsy consisting of 15 questions yielding a total score between 0 and 100, with higher scores indicating better QoL.
Nested regression models were used to assess the relationship between duration of palsy and QoL. The first model contained the variables age, gender and SB score. The second, third and fourth model contained the duration of palsy as the variable of interest, in a linear, quadratic (ie, a relationship with 1 curve) and cubic (ie, a relationship with 2 curves) function respectively. The model correlation coefficient (R2) was calculated as a measure of fit for each model; the R2 represents the proportion of variance in the output variable that can be explained by the input variable. R2 of the second, third and fourth model was compared to the first model. Change in R2 and a P-value for change was calculated.
Results
Eighty-four patients were identified and included in this study. Of these, 47 patients (56%) were male. The median age was 62.6 (IQR 49.1-71.1) years. The median duration of facial palsy was 12.1 (IQR 6.7-28.5) years. Most common etiology was vestibular schwannoma (n = 23 [27%]), followed by trauma (n = 9 [11%]). The median Sunnybrook score was 30.0 (IQR 24.0-41.8).
The first model explained 21% of the variance in FaCE scale scores (R2 = .210; Table 1). A quadratic function for duration of palsy did increase the explained variance statistically significantly (R2 change = .079, P = .025) to a total explained variance of 28.9%. The linear and cubic functions for duration of palsy did not improve explained variance statistically significantly (R2 change = .038, P = .064 & R2 change = .079, P = .061 respectively).
Regression Analysis Results.
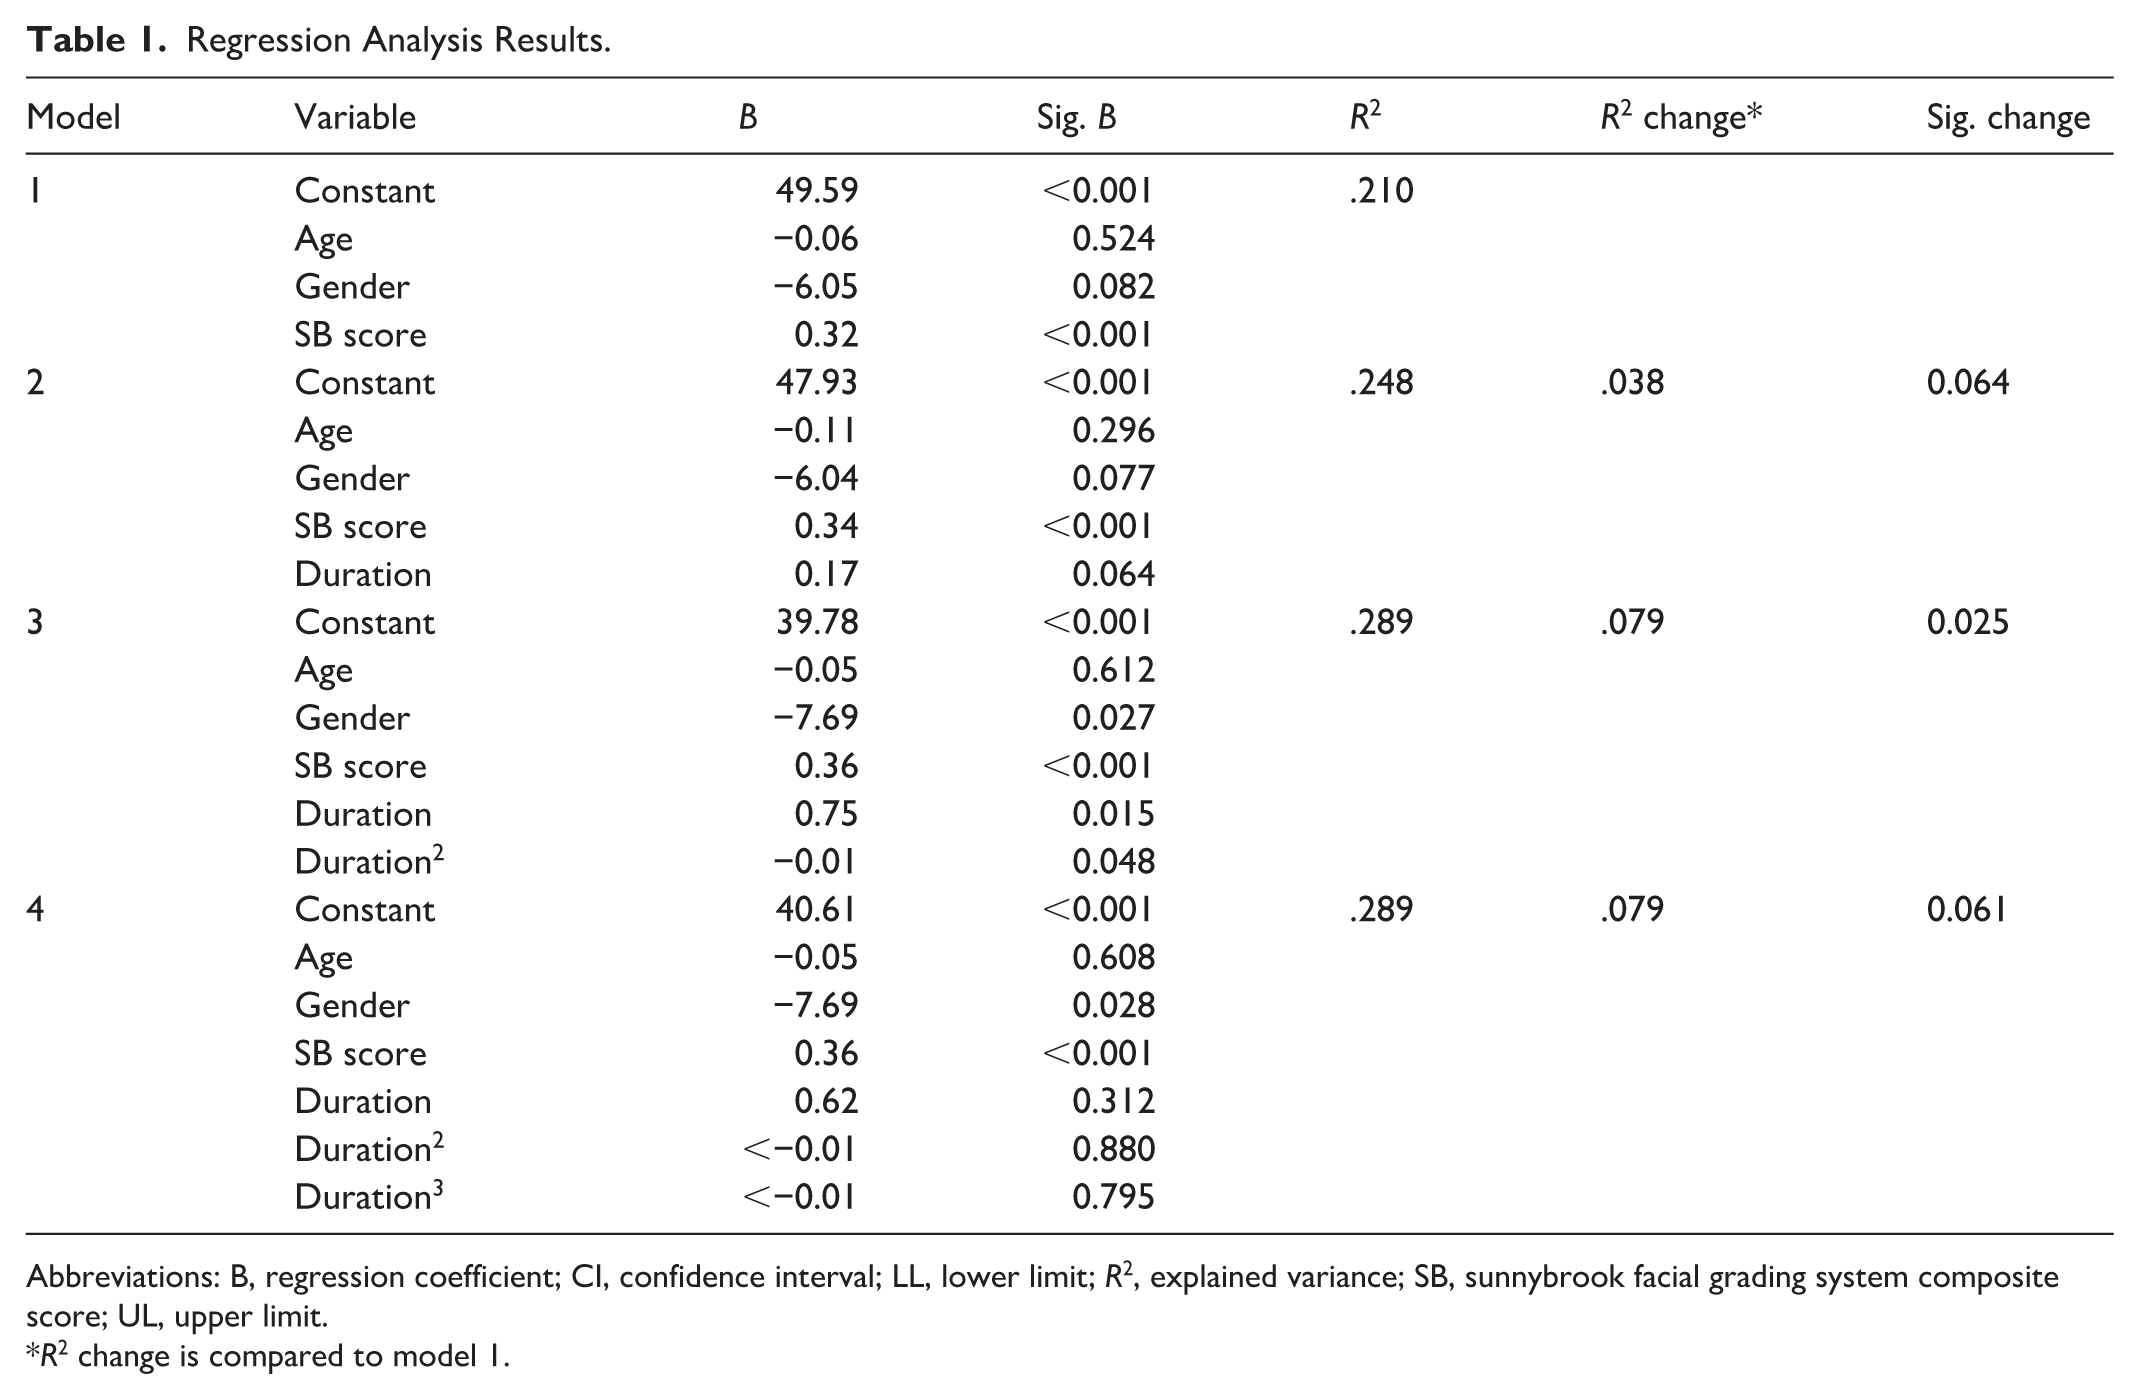
Abbreviations: B, regression coefficient; CI, confidence interval; LL, lower limit; R2, explained variance; SB, sunnybrook facial grading system composite score; UL, upper limit.
R2 change is compared to model 1.
Discussion
Hypothetically, QoL could increase over time as one ‘gets used to’ the health state. Or, it could also decrease over time: the longer someone remains in a certain health state, the greater the burden of disease. 6 Our study demonstrates that the relationship between duration of facial palsy and QoL is best characterized by a non-linear relationship. A visualization of the coefficients that best describe this relationship, shows an initial improvement in QoL followed by a long-term decline (Figure 1). Additionally, the inclusion of a variable for duration of palsy proved to be a relatively important one, with an increase in explained variance of 7.9% (from 21.0% to 28.9%). Our study suggests that duration of palsy is a variable of interest when studying QoL, as previously suggested, 5 but may not be linear.
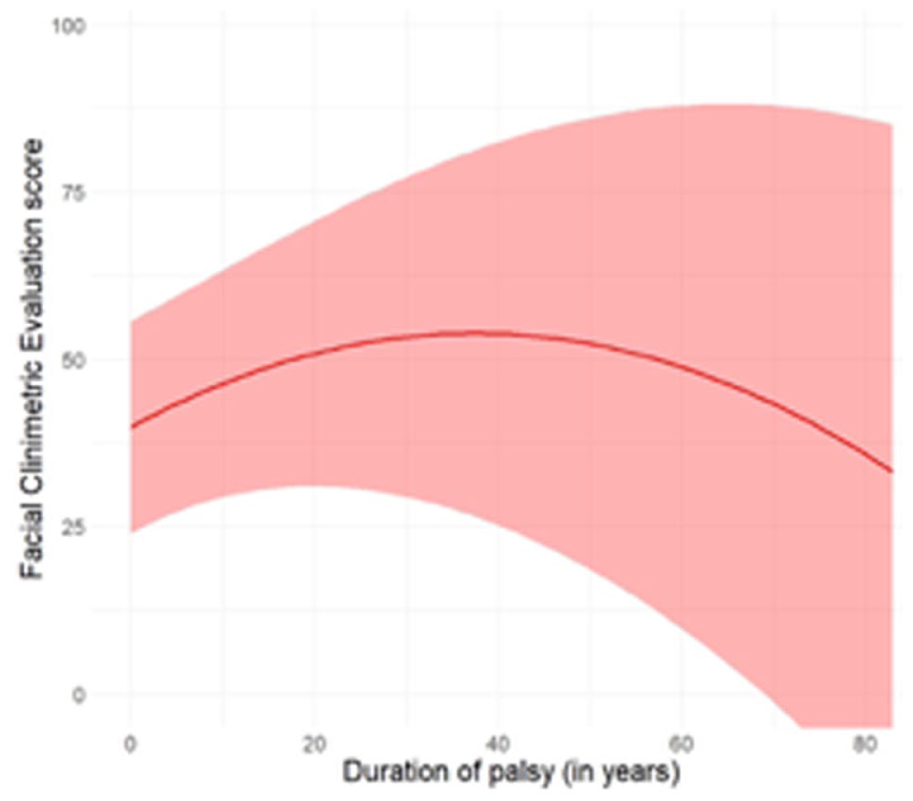
A visualization of the relationship between duration of palsy and quality of life as measured by the facial clinimetric evaluation scale based on the coefficients for a quadratic function (Y = 39.78+ 0.75 × X–0.01 × X2). Area in red represents the margins of error based on the standard errors (see Table 1).
We suggest that future researchers, aiming to study novel factors of influence on QoL in facial palsy, should include duration of palsy in their model, and perhaps best in a quadratic form. The retrospective cross-sectional nature of our study limits statements about causality. and therefore the current findings should not be interpreted as a likely path for individual QoL trajectories. For this purpose, prospective studies, including multiple measurements per participant should be performed. Additionally, the current study is limited by a relatively small sample size, a heterogeneous population including a variety of etiologies and a small number of confounding variables.
Footnotes
Ethical Considerations
This study was exempt from formal IRB review under Dutch national law.
Consent to Participate
Informed consent was obtained from all individuals included in this study.
Author Contributions
Funding
The authors received no financial support for the research, authorship, and/or publication of this article.
Declaration of Conflicting Interests
The authors declared no potential conflicts of interest with respect to the research, authorship, and/or publication of this article.