
Abstract
The Glasgow Outcome Scale–Extended (GOS-E) measures global functional recovery status following traumatic brain injury (TBI). We aimed to identify 10-year latent GOS-E trajectories and examine their associations with social relationship factors at 1 year and over 10 years post-injury. A total of 4,564 participants from the TBI Model Systems dataset with GOS-E at 1-, 2-, 5-, and 10-year post-discharge were included. Latent class growth analysis identified trajectory classes, with the optimal model selected based on fit indices. Social relationship factors were assessed using the social subscale of the Participation Assessment with Recombined Tools-Objective, including total and seven-item scores at 1 year and over 10 years post-injury. Multinomial logistic regression examined associations between social relationship factors and trajectory membership, adjusting for covariates (α = 0.05). Four-class model solution revealed the best model fit: High Function (46.3%), Declining Function (6.0%), Improving Function (29.7%), and Low Sustained Function (18.0%). At 1 year post-injury, relative to a High Function group, trajectories showed higher odds of living with a partner, being in an intimate relationship, and having a close friend to confide in (odds ratios [ORs]: 1.08–1.21, p < 0.05), but lower odds of weekly interactions with friends and family, providing emotional support, internet-based communication, and total subscale scores (ORs: 0.94–0.99, p < 0.05). Over 10 years post-injury, these associations strengthened, particularly for intimate relationships and having a close friend to confide in (ORs: 1.05–1.28, p < 0.05), followed by living with a partner (ORs: 1.07–1.16), weekly social engagement (ORs: 0.87–0.95), and total subscale score (ORs: 0.95–0.98; all p < 0.05). Ten-year GOS-E trajectory modeling post-TBI identified four subgroups: high, improving, nonlinear decline, and low sustained function. Trajectories associated with functional disability and improvement were associated with having confided friendships, intimate relationships, and cohabitation with partners, and fewer weekly social engagements at 1 year post-injury, with associations strengthening over time. Social relationship factors may offer contextual insight into global functional status following TBI.
Introduction
Traumatic brain injury (TBI) remains one of the main causes of life years lost owing to disability and mortality. 1 Worldwide, an estimated 69 million individuals sustain a TBI each year. 2 Physical Medicine and Rehabilitation research recently reconsidered TBI from an acute, time-bound event to a chronic disease, owing to increased research demonstrating long-term neurocognitive, physical, and physiological challenges following the insult. 3 The Centers for Disease Control and Prevention defines chronic disease as a condition lasting 1 year or more and requires ongoing medical attention, limits activities of daily living, or both, 4 with TBI having met this criterion in 2022. 5 In 2023, the US TBI Model Systems (TBIMS) program published a report noting the shift in understanding TBI from a one-time event to a chronic disease with long-term consequences, including the risk of late-onset neurodegeneration. 3 A 2025 Neurological Disorders and Stroke (NINDS) director report discussed the need for research to realize key factors driving recovery to inform prevention initiatives and reduce disability. 6 Serial assessments that track post-injury disability may realize recovery patterns, 7 identify risk factors, and track patient HealthSpan, characterized as the period of life spent in good health without burdens of chronic disease. 8
Measurement of global disability and recovery following TBI is commonly achieved using the eight-point Glasgow Outcome Scale–Extended (GOS-E).9,10 This tool summarizes the overall impact of TBI on neurocognitive, communication, behavioral, and emotional function, independence, and participation in the community. 11 GOS-E is positively correlated with quality of life (QoL) 12 and remains a recommended core measurement in TBI research.13,14 Several retrospective cohort studies observed that ∼50% of individuals achieved a GOS-E score associated with increased global function, such as achieving moderate disability or good recovery 6 months following moderate-to-severe TBI,15,16 while a GOS-E score associated with increased global function was observed in 42% of individuals 6 months after severe TBI. 17
Previous studies assessed GOS-E trajectories after TBI extending beyond 5 years post-injury to depict the chronic nature of disability. Ponsford et al. 18 leveraged TBIMS data, examining GOS-E trajectories approximately 10 years following complicated mild-to-severe TBI, and found that 52% of individuals had good recovery, 44% had moderate disability, and 5% had severe disability. 18 Corrigan and Hammond examined changes in GOS-E categories over four consecutive follow-up periods 15 years post-TBI using data from the TBIMS database and observed dynamic positive and negative changes in GOS-E between time points. 19 Similarly, a UK study assessed changes in disability from 1, 5, and 7 years following complicated mild-to-severe TBI, observing that 24% of survivors with good recovery deteriorated to disabled status. 20 A Norwegian study followed up survivors of moderate-to-severe TBI and found GOS-E remained stable across the first 5 years post-injury. 21 Similarly, a Norwegian study found stable global functioning between 10 and 20 years after moderate-to-severe TBI. 22 These findings of stable levels of disability contrast findings of two TBIMS studies that reported initial improvement in functional status up to 10 years following injury, followed by a peak and a decline in GOS-E scores.23,24 Although this analysis revealed trajectories of recovery using mixed modeling techniques, such approaches may fail to detect subgroups with nonlinear trajectories that can allow for multivariate analysis and support precision medicine.
Latent Growth Mixture Models (LGMMs) represent a set of unsupervised machine learning methods that handle large quantities of longitudinal data designed to model the heterogeneity of growth trajectories with high-fidelity model solutions.25,26 Contrary to traditional longitudinal models assuming a homogeneous population, LGMMs account for unobserved heterogeneity in patient trajectories by identifying latent subgroups that share similar growth trajectories to provide accurate representations of longitudinal data.27–29 Application of LGMM in GOS-E research shows value in identifying multiple trajectories of symptoms by providing valuable insights in delineating treatment trajectories and predicting prognoses in several clinical contexts.30–32 Understanding the differences in recovery of global function after TBI can help inform personalized treatment strategies that account for variability in symptom progression, and identify risk factors associated with trajectory membership to support early preventative initiatives.
Previous research observed several factors predictive of GOS-E score following TBI, including age,16,23 sex,33,34 education,35–37 pre-injury employment,21,33,36 race,23,38,39 history of alcohol abuse before injury,33,40 presence of intracranial lesions,41,42 Glasgow Coma Scale (GCS) score,41,43 duration of post-traumatic amnesia (PTA), 21 duration of hospitalization and rehabilitation,23,24,44 executive function and memory problems,20,35,45 and mood disorders.20,35,45 Temkin et al. identified an association between TBI severity and worsened social function, including reduced probability of employment after injury and engaging in social and leisure time activities, and greater probability of problems with social communication and behavior. 46 However, the association of social relationship factors, such as the frequency of social interactions with friends and family and use of the internet for communication, providing emotional support, being in an intimate relationship, having close confided relationships, and living with a spouse, as measured by the social relationship subscale of the Participation Assessment with Recombined Tools-Objective (PART-O), with global function recovery trajectories post-TBI remains understudied. One study observed greater social support and community participation were associated with an improvement in recovery from TBI. 47 Greater social participation is associated with increased QoL following TBI. 48 Social support is negatively associated with mental fatigue in patients with TBI and buffers against cognitive decline.49–51 In a head-to-head cohort comparison, the Monash Epworth Rehabilitation Research Center cohort (MERCC) showed better functional outcomes than the TBIMS cohort over 2 years, with the only major difference being routine provision of community-based support in the MERCC group. 52 In a study examining the recovery trajectory of social participation of patients who sustained a TBI, most remained stable in participation while ∼25% declined, predicted by lower functional independence. 53 Recent literature demonstrates support for personalized and actionable strategies to optimize long-term function and HealthSpan following TBI. 54 We sought to examine whether social relationship factors are predictors of global functional recovery following TBI, which may support implementing similar strategies for patients with TBI.
The purpose of this study was to identify the longitudinal recovery trajectories of GOS-E scores during the 10 years following TBI of individuals within the TBIMS cohort using LGMMs and identify the association of social relationship factors reported at 1 year and over 10 years following TBI with trajectory membership. First, it was hypothesized that there would be at least three recovery trajectories of GOS-E scores over time. In addition, it was hypothesized that participants exhibiting a greater frequency of weekly social interactions with friends and family, using the internet for communication, providing emotional support, and a greater likelihood of being in an intimate relationship, having close confided relationships, and living with a spouse would be associated with trajectories associated with increased global function over time.
Methods
Participants and study design
This investigation used the open-access TBIMS database of longitudinal data on individuals (≥16 years old) with TBI who received inpatient rehabilitation at 20 TBIMS centers from 1987 to 2024. 55 Inclusion eligibility required a TBI diagnosis defined as brain tissue damage caused by an external mechanical force, evidenced by medically documented loss of consciousness (LOC), PTA, or objective neurological findings. Individuals must have met at least one of the following criteria for inclusion: PTA > 24 h, intracranial abnormalities detected on trauma-related neuroimaging, LOC > 30 min, or a GCS score < 13 in the emergency department, unless affected by intubation, sedation, or intoxication. 56 Additional requirements included ≥16 years old at the time of injury, admission to a TBIMS-affiliated acute care hospital within 72 h of injury, completion of acute hospital care and comprehensive inpatient rehabilitation at a TBIMS center, and provision of informed consent by either the participant or a proxy. 56
All participating TBIMS centers adhered to institutional review board protocols to ensure compliance with ethical research standards. Data collection followed standardized operating procedures, and research staff underwent formal training and reliability assessments to maintain data consistency. 56 Data were acquired from medical records, standardized assessments, and patient or family interviews during the initial hospitalization and through follow-up interviews conducted at 1, 2, and 5 years post-injury, and every 5 years thereafter. For this investigation, the TBIMS cohort as of November 1, 2024, was limited to 19,560 individuals treated within 20 TBIMS locations, wherein 4,564 individuals completed all follow-up GOS-E assessments at 1, 2, 5, and 10 years. Figure 1 illustrates the participant breakdown for inclusion in this analysis.
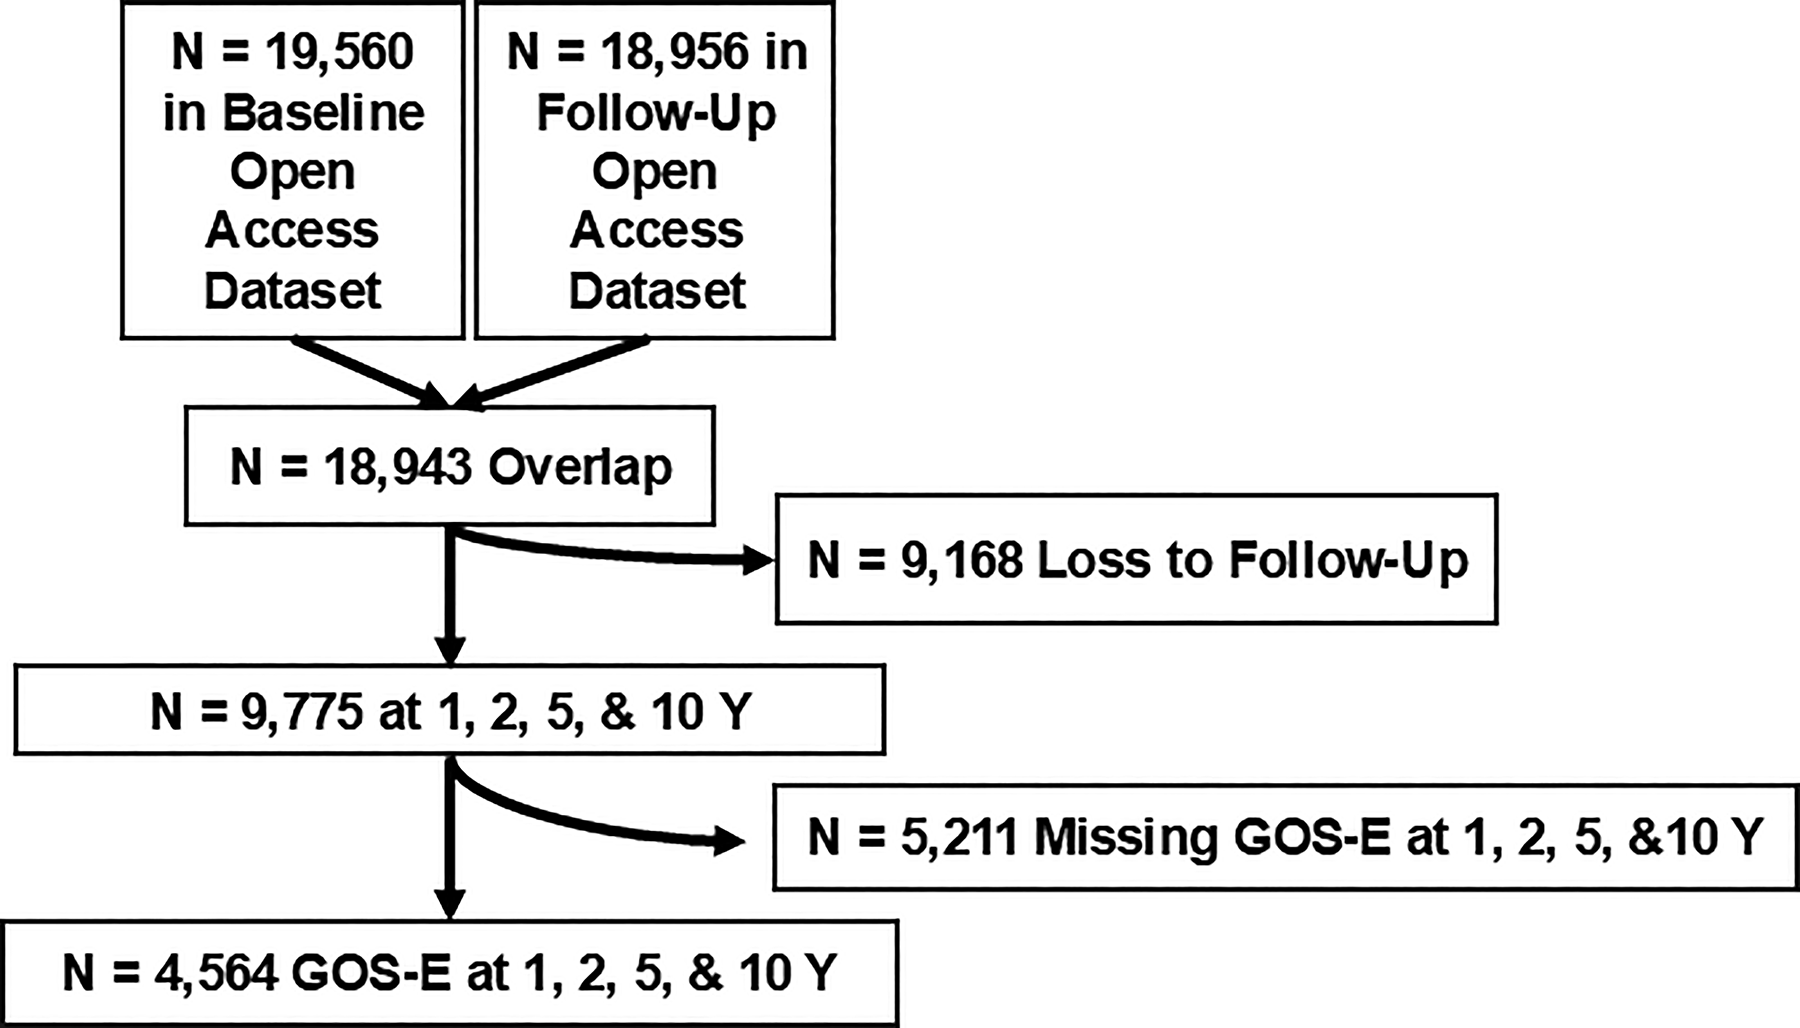
Flowchart illustrates the participants included in the current analysis from the Traumatic Brain Injury Model Systems (TBIMS) National Database. Participants in the current analysis comprised those who had completed GOS-E assessments from 1, 2, 5, and 10 years post-TBI. A total of 4,564 participants had complete GOS-E data to support the present investigation. GOS-E, Glasgow Outcome Scale–Extended; TBI, traumatic brain injury.
Glasgow Outcome Scale–Extended
GOS-E was used to characterize global functional recovery after TBI. It is identified by NINDS as a core tool for all TBI studies. 23 GOS-E assesses one’s ability to return to daily life with scores dependent on change from pre-injury function. Hence, the test was not performed at baseline. 45
The GOS-E (1–8) was administered as a structured interview by a trained professional that assessed patient consciousness, independence within and outside of the home, occupational status, leisure-time activities, and relationships. These topics were used to categorize patients into one of eight categories, including (1) Death resulting from TBI or its complications, followed by (2) Vegetative State, where a person demonstrates only spontaneous reflexes and no awareness of self or the environment, and (3) Lower and (4) Upper Severe Disability, describing a conscious individual completely dependent for support but varying only on the time at which an individual can be left alone. The final categories of the GOS-E comprised (5) Lower and (6) Upper Moderate Disability, which characterized patients based on their independence at home but dependence outside the house that varied in their ability to hold an occupation or conversation, and (7) Lower and (8) Upper Good Recovery, which signified a return to normal life with either minor or no residual issues. Category rating was determined by the most significant area of disability.
Reliable psychometric properties of GOS-E demonstrate consistency and dependability with excellent test–retest reliability as shown by a kappa(w) value of 0.92 57 and an intra-class correlation coefficient (ICC) of 0.92. 58 It also maintains excellent inter-rater reliability scores among various sources, with kappa(w) ranges of 0.84–0.92.57,58 This is important given the nature of the TBIMS being collected over multiple sites and assessors. 59 Adequate Cronbach’s α (0.80) 58 rounds out the reliability. In addition, GOS-E is accurate, shown by its consistent relationship with other outcome measures and ability to forecast long-term patient outcomes, demonstrating construct and predictive validity.11,60 Finally, the standard error of measurement (SEM) to reliable change index (RCI) ratio for GOS-E is 0.61/0.86, meaning that scores are precise within ±0.61, whereas a change of 0.86 is the threshold for “real” change in scores. 61
Social relationship factors
The PART-O collected in the TBIMS consists of three subscales: Productivity, Social Relations, and Out and About. 62 Because we sought to investigate the associative and potentially prodromal relationship between social relationship factors and outcome trajectories, we focused on the PART-O Social Relations subscale. The Social Relations subscale of the PART-O scale was used to assess the frequency of social engagement and presence of certain types of relationships in TBI research. This subscale comprises seven items, four of which assess the number of times per week one socializes with friends, family, gives emotional support to other people, such as listens to their problems or helps them with their troubles, and uses the internet for communication with others through text, email, virtual meetings, and social media (scored as 1–4 times, 5–9 times, 10–19 times, 20–34 times, or 35 or more times). Three remaining items round out the scale, asking the subject whether or not they live with a spouse or significant other, are involved in an ongoing intimate relationship, and have close friends in whom they confide in (scored as yes or no). 62 This subscale serves as a proxy measure of social support, as there is no formal capture of the nature or quality of the social interaction. Instant messaging met the criteria for using the internet for communication. Interactions with someone living in the same household must have been intentional and continuous to count as well. Repeated contacts with a single person may count separately. These interactions are aimed at personal encounters; hence, work involvement is not included. We used the overall score of the subscale and each individual seven-item score at 1 year and over 10 years of recovery for analysis. Test–retest reliability for the PART-O Social Relations subscale has been reported as 0.87. 61 The SEM/RCI ratio for this subscale is 0.35/0.49, meaning that scores are precise within ±0.35, whereas a change of 0.49 is the threshold for “real” change in scores. 61
Latent growth mixture modeling
Latent class growth analysis (LCGA) was employed to identify unobserved subgroups within the dataset that followed distinct developmental post-TBI recovery trajectories of continuous GOS-E scores. Using this method, LCGA classified participants into distinct latent classes as defined by GOS-E total scores over the course of care from 1, 2, 5, and 10 years post-TBI. LCGA is an unsupervised machine learning technique that analyzes repeated measures of a variable across multiple time points, modeling trajectories using latent factors for intercept, linear slope, and quadratic slope, while constraining within-class variability to zero to identify homogeneous subgroups based on distinct trajectory patterns. Importantly, modeling GOS-E as a continuous numeric outcome served to preserve the full range of global functional variability and avoided categorization thresholds, thereby allowing the model to detect more nuanced trajectory differences and identify subgroups with greater granularity. This approach also required the outcome to be specified as a numeric (continuous or ordinally scaled) variable rather than as character or categorical groupings, as the estimation of growth trajectories and latent factors depends on quantitative differences between observed values. GOS-E scores were modeled using latent factors for observed intercept, linear slope, and quadratic slope, whereby the intercept represented global function evaluated at discharge from acute admission, the linear slope captured consistent change over time, and the quadratic slope accounted for nonlinear increase or decrease in functional score. Residual variances of observed scores were freely estimated, while latent factor variances and covariances were fixed to zero in accordance with LCGA theory. 63 Models were estimated using a full-information maximum likelihood rule that estimated class membership probabilities and trajectory parameters using all longitudinal data to enhance model robustness. 25
Here, it was assumed that the cohort was heterogenous and divided into a number of distinctive trajectory classes a priori.63,64 Drawing from previous work, 63 model solutions ranging from one to seven were explored on LCGA using ordinal GOS-E data after Box–Cox transformation. The final number of classes reflected the best model solution based on Akaike information criterion (AIC), Bayesian information criterion (BIC), sample-adjusted BIC (saBIC), log-likelihood (LL), entropy, individual class trajectory sample size >50, minimum and maximum average posterior classification probability, model interpretability, and clinical relevance. 26
Posterior probabilities of membership per participant per trajectory class were estimated using the maximum probability assignment rule of Strauss et al. 65 Each individual participant was assigned to the class with their highest probability of membership. Trajectory plots were used to visualize individual trajectories within each class category of the total GOS-E score. 63
Statistical analysis
All statistical analyses were conducted in RStudio software, version 4.5.0 (R Project for Statistical Computing). Continuous variables were expressed as mean (standard deviation [SD]) and categorical variables as frequencies or percentages (%). LCGA model solution fit indices, including LL, AIC, BIC, saBIC, and model solution classification quality indices, including entropy (accuracy, 0 to 1), minimum posterior class probability, maximum posterior class probability, smallest class proportion, largest class proportion, average participants per parameter (indicator of model parsimony), and local sample size per class, were analyzed for 1–7 possible model solutions. Model parameter estimates over time from the best-fitting latent trajectory model solution, including trajectory intercept (β0) and linear and quadratic patterns of change (slopes; linear = β1; quadratic = β2), were expressed. Wald tests were conducted to evaluate whether individual parameters differed significantly from zero. Pairwise Wald tests were conducted to compare class-specific intercepts and time-related parameters, wherein differences in linear and quadratic terms were interpreted as evidence of differences in the rate and curvature of trajectories, respectively, reflecting distinct longitudinal patterns of functional recovery. Independent samples t-test compared baseline characteristics between participants included in and excluded from the final sample. One-way analysis of variance (ANOVA) or chi-squared (Χ2) test assessed characteristics between classes.
Multivariate multinomial logistic regression analysis assessed the influence of social relationship factors during acute admission and throughout recovery on the likelihood of class trajectory membership of GOS-E relative to the trajectory with the largest sample size owing to interpretation. 63 Each item from the subscale and its total score at the first year post-injury and during 10 years of recovery were each evaluated in separate models. Additional demographic and clinical variables were included to mitigate confounding effects. Variables were screened by percent missingness by variable and class, with variables displaying imbalanced missingness >10% across and >30% within classes considered for exclusion, 66 with remaining variables considered for inclusion based on previous literature. Remaining variables with missing values were imputed using the mice package with the predictive mean matching (“pmm”) feature to perform five rounds of multiple imputation. 66 Hence, final covariates included participant demographic characteristics, including sex, age, marital and employment status, household situation following injury discharge, and zip code, and clinical and injury-related characteristics, including injury severity measured by the GCS, cause of injury, and year of injury. 67 Odds ratio (OR), standard error (SE), Z-scores, p value, and 95% confidence intervals (CIs) were expressed. LGMM was employed using the tidySEM package.68,69 Statistical significance was determined at p = 0.05, two-tailed.
Results
Participants
Supplementary Table S1 summarizes the demographic, clinical, and injury-related characteristics of the final sample (n = 4,564) and those excluded (n = 14,996). Compared with those excluded, participants in the final sample showed several differences in demographic, clinical, and injury-related characteristics. Participants were more likely to be younger at injury (−4.65 years, p < 0.001), female (+2.3%, p = 0.002), White (+7.4%, p < 0.001), consume less alcohol per week before injury (−0.14 day/week, p = 0.023), have a more severe injury based on GCS (−0.75, p < 0.001), longer rehabilitation stays (+0.82 days, p = 0.048), and more number of days from acute admission to rehabilitation discharge (+1.36 days, p = 0.020). Further analysis observed a greater number of lifetime TBI (+0.20, p < 0.001), moderate-to-severe TBI (+0.01, p = 0.003), fewer participants having history of mental health treatment (+2.9%, p = 0.006), but more participants injured by a motor vehicle (+7.4%, p < 0.001) (Supplementary Table S1).
Latent trajectories of GOS-E
Ordinal data were best fit by a four-class model solution from LCGA showing four clusters of subgroups with distinct GOS-E changes based on the best model fit parameters (Supplementary Table S2). Figure 2 illustrates the trajectory plot of the four-class model solution with mean GOS-E scores and 95% CI bands stratified by latent class (Fig. 2). Class 1 (High Function, n = 2,112, 46.3%) reported a maintenance of high GOS-E scores. Class 2 (Declining Function, n = 276, 6.0%) reported a gradual downward trajectory in GOS-E. Class 3 (Improving Function, n = 1,356, 29.7%) reported improvement in GOS-E after the first year, which stabilized by the tenth year. Class 4 (Low Sustained Function, n = 820, 18.0%) reported low GOS-E scores over time (Fig. 2). Supplementary Table S3 presents the model-estimated mean GOS-E trajectories with 95% CIs across latent classes, derived from the quadratic growth model at selected follow-up time points.
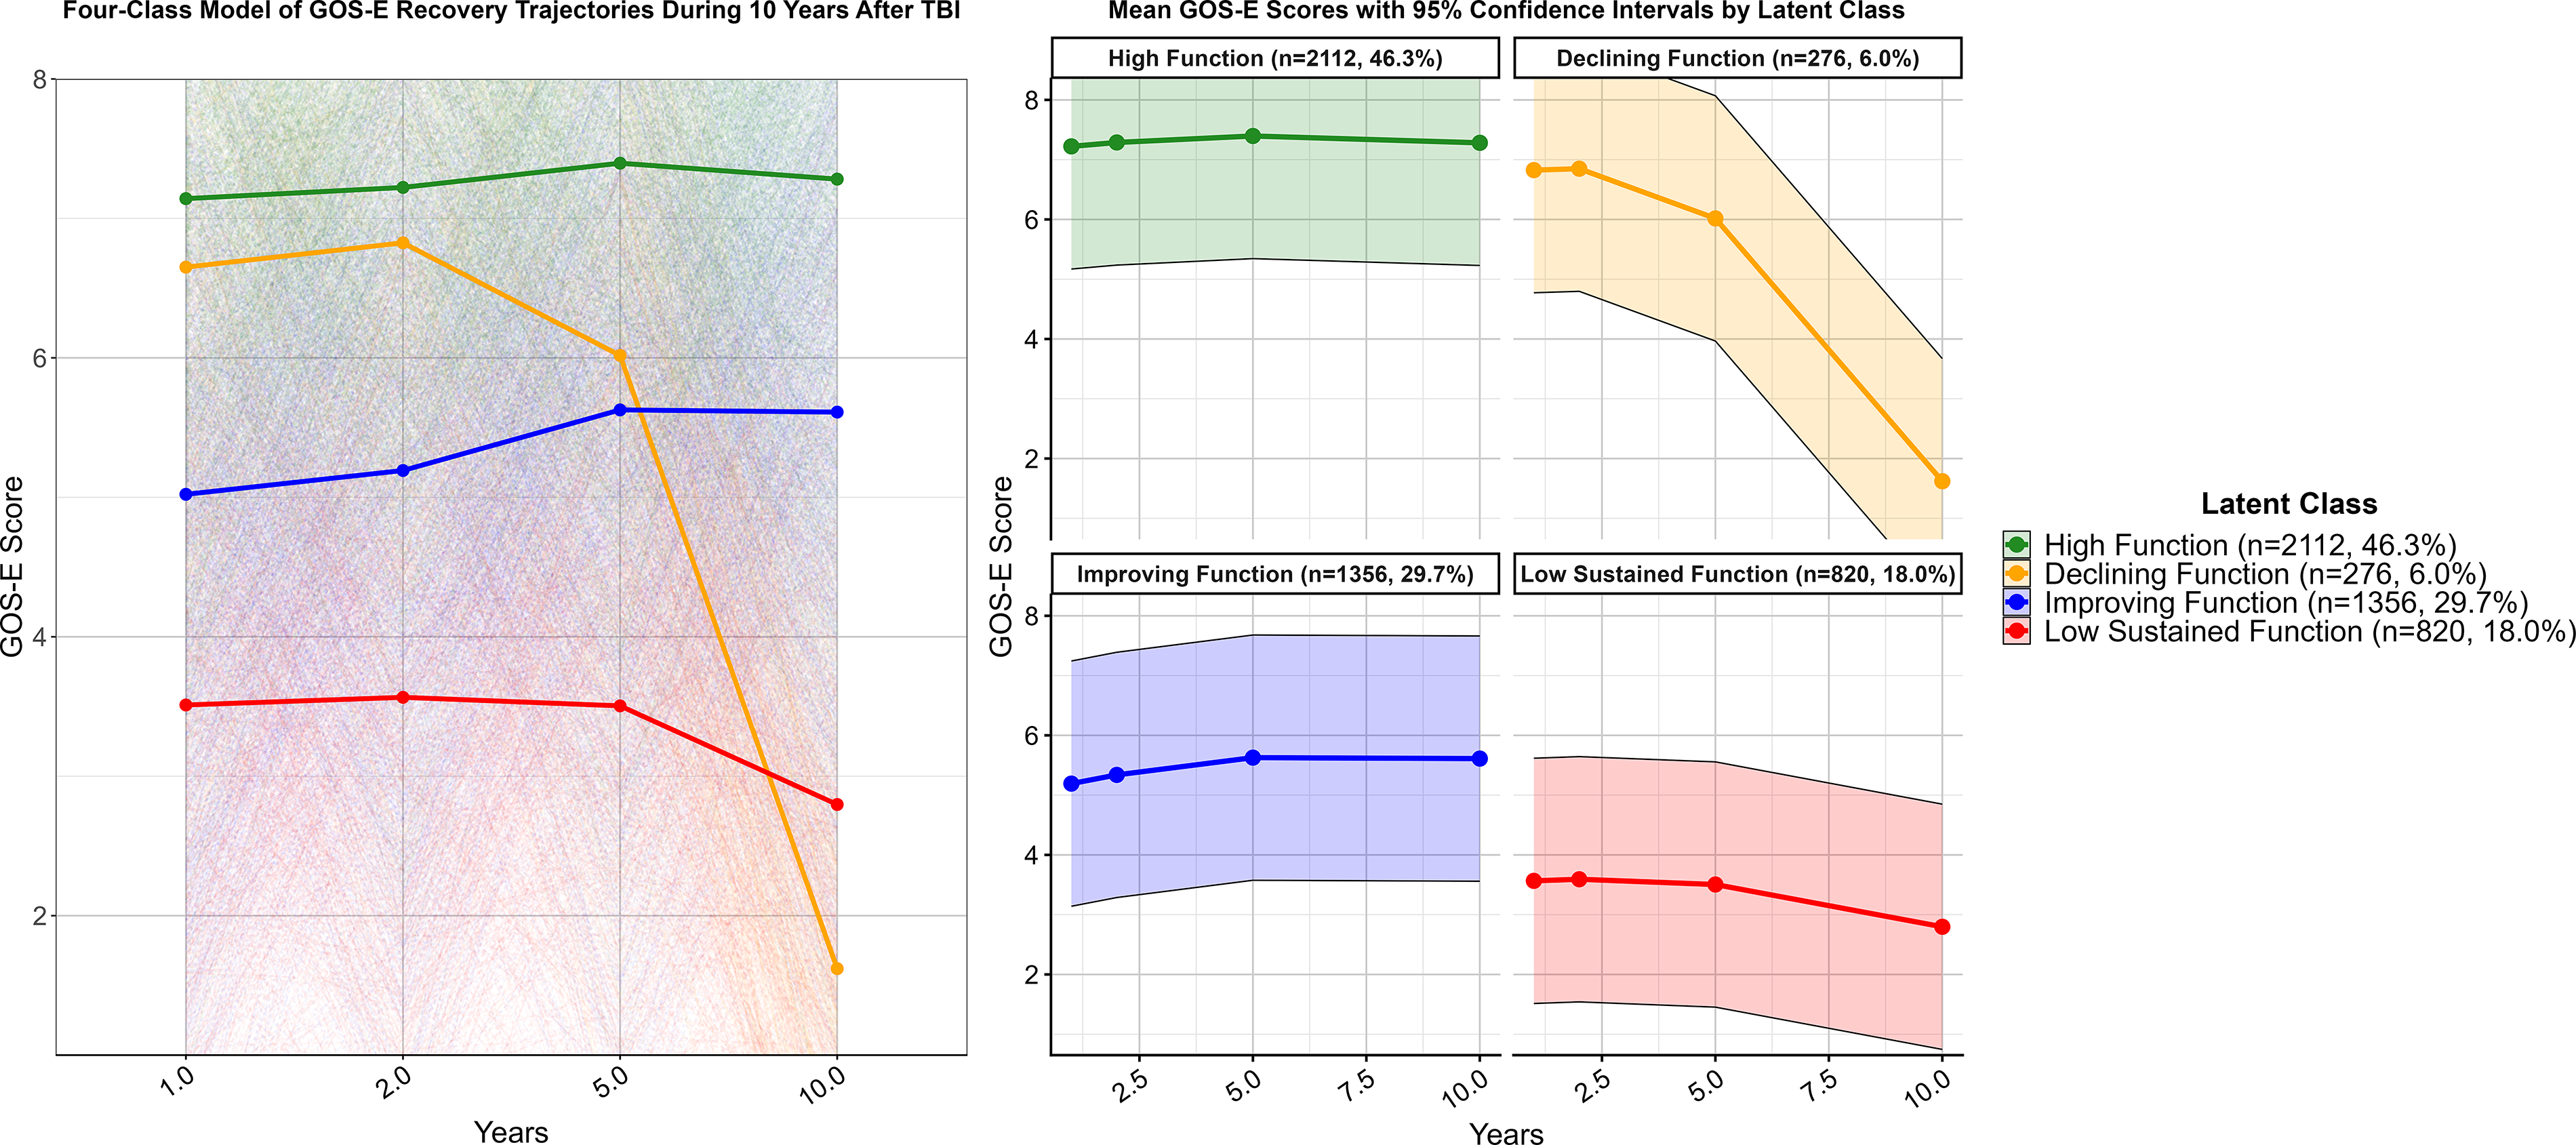
Trajectory plot of the four-class model solution colorized by latent class (left) with model-derived mean GOS-E scores and 95% CI bands stratified by latent class (right). High Function (n = 2,112, 46.3%) reported a maintenance of high GOS-E scores over time. Declining Function (n = 276, 6.0%) reported a gradual downward trajectory in GOS-E. Improving Function (n = 1,356, 29.7%) reported improvement in GOS-E after the first year, which stabilized by the tenth year. Low Sustained Function (n = 820, 18.0%) reported low GOS-E scores over time. CI, confidence interval; GOS-E, Glasgow Outcome Scale–Extended.
Table 1 displays the parameter estimates and Wald test statistics evaluating whether model parameters (intercepts, linear slopes, and quadratic terms) from the four-class latent trajectory model of post-TBI GOS-E scores differed significantly from zero. All parameter estimates across the four classes were significant (all p < 0.001), indicating that intercepts were significantly different from zero, that there was a significant change across time whereby global function continuously increased or decreased, and that there was a significant nonlinear change in function across time with one point of inflection. Each trajectory was defined by its starting point (β0) and patterns of change (linear, β1; quadratic, β2) over time. High Function began at the highest intercept (β0 = 7.140) with a negative quadratic (β2 = −0.010) but positive linear slope over time (β1 = 0.090) to indicate high sustained function with minimal change over time. Declining Function began lower (β0 = 6.650) with a negative quadratic slope (β2 = −0.080) but positive linear slope (β1 = 0.250) to indicate early stable function from Year 1 to Year 2 followed by rapid decline over time. Improving Function began lower (β0 = 5.020) with a positive linear slope (β1 = 0.180) and negative quadratic slope (β2 = −0.010), indicating a gradual improvement that stabilized over time. Low Sustained Function began at the lowest intercept (β0 = 3.510) with a negative quadratic slope (β2 = −0.010) and positive linear slope (β1 = 0.070) to reflect a low stable function that changed minimally over time (Table 1).
Parameters of the Four Latent Classes of Post-TBI GOS-E Scores in the Strongest Latent Class Model

Notes: The intercept represents the mean GOS-E score for each latent class trajectory at 1 year post-injury. A significant intercept indicates that the mean total score at 1 year was significantly different from zero. A trajectory with a significant quadratic parameter indicates that there was a significant nonlinear change in function across time with one point of inflection. A trajectory with only a significant linear parameter indicates that there was a significant change across time whereby function continuously increased or decreased. A trajectory with no significant parameter for time indicates that a trajectory was only differentiated by the level of function but not by any significant change across time. Statistical significance is denoted in bold face font (p < 0.05).
GOS-E, Glasgow Outcome Scale–Extended; SE, standard error.
Table 2 shows the results of Wald tests assessing pairwise differences in linear and quadratic slopes between latent trajectories. Analysis revealed significant differences in linear and quadratic slopes between nearly all trajectories, excluding the quadratic slope rate of change between High Function and Low Sustained Function (p = 0.425) and Declining Function and Improving Function (p = 0.062) (Table 2).
Wald Test Results Assessing the Pairwise Differences Across Latent Classes by Linear and Quadratic Slopes

Note: Bolded values denote statistical significance (p < 0.05).
SE, standard error.
Characteristics between trajectory clusters
Table 3 presents demographic, clinical, and injury-related characteristics of those with complete GOS-E and by trajectory group. Participants in the Declining Function group were more likely to have been injured more recently (p = 0.009) and experienced more days from acute admission to rehabilitation discharge without interruptions during treatment (p = 0.036). Participants in the Low Sustained Function group were more likely to have a greater number of TBIs before age 15 (p = 0.028) and sustained an injury from a motor vehicle accident (p = 0.011). All remaining characteristics were similar among groups (p > 0.05) (Table 3).
Baseline Demographic, Clinical, and Injury-Related Characteristics of 4,564 Participants by Class Trajectory Membership
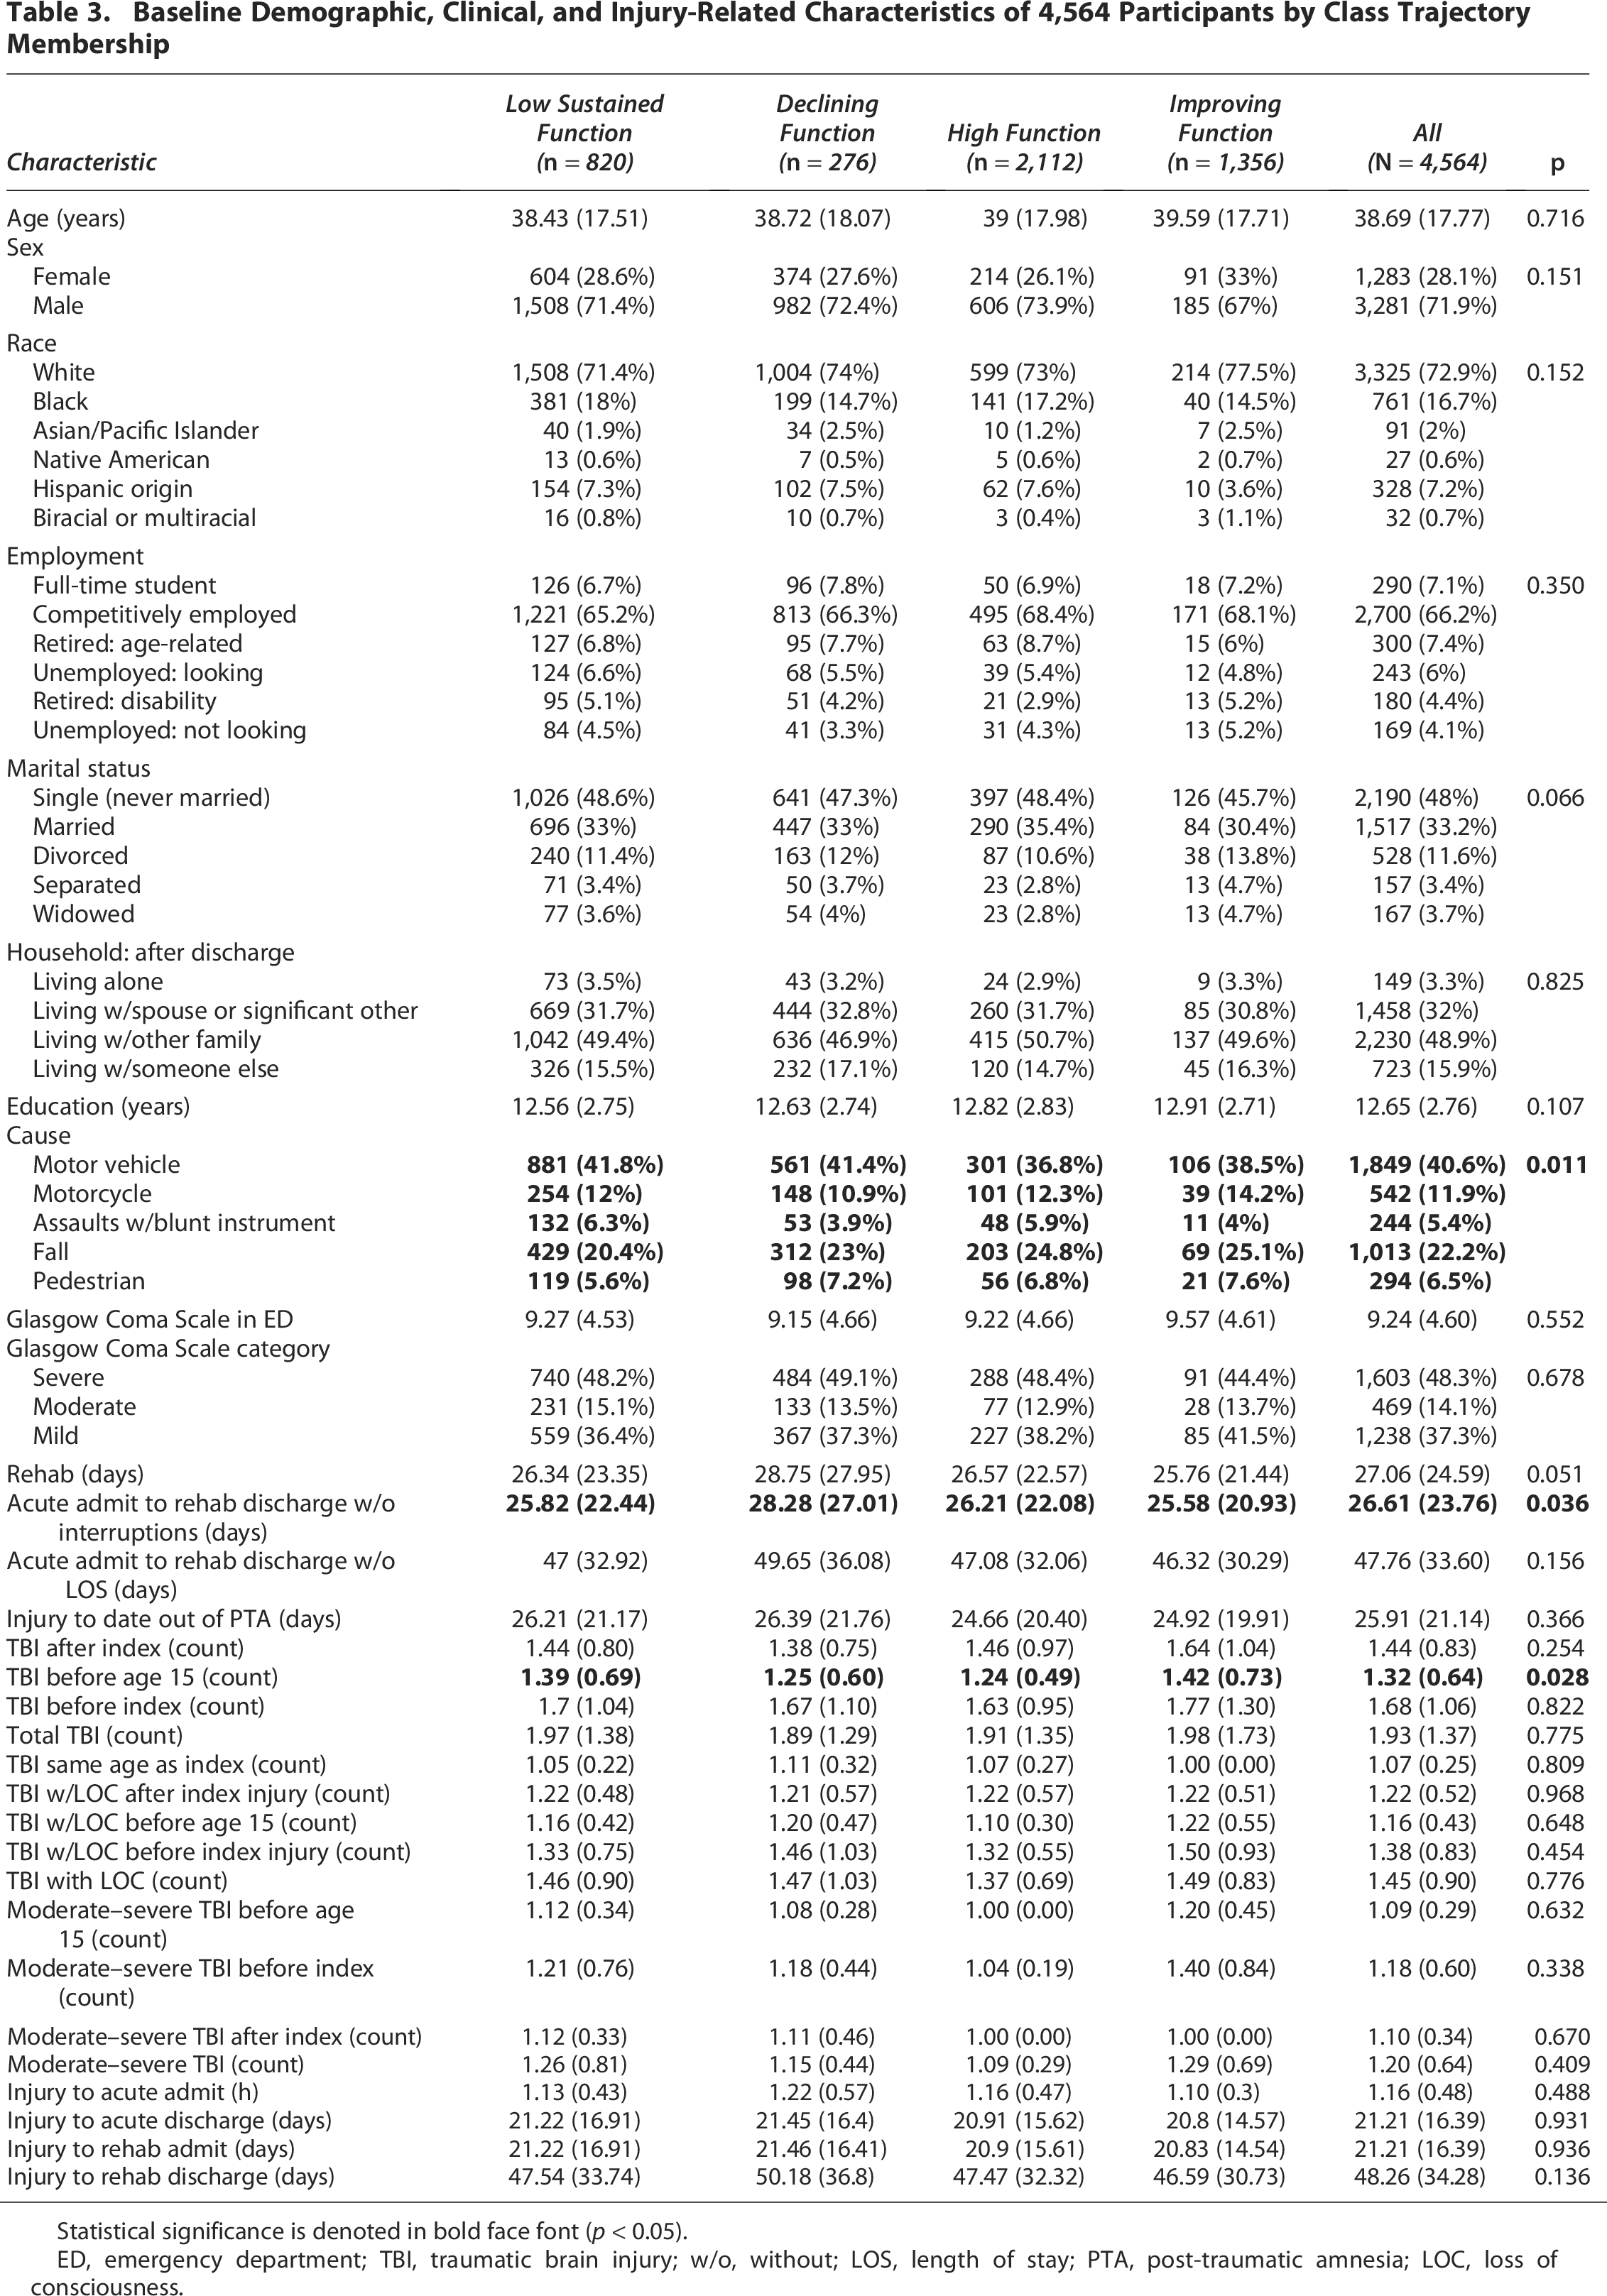
Statistical significance is denoted in bold face font (p < 0.05).
ED, emergency department; TBI, traumatic brain injury; w/o, without; LOS, length of stay; PTA, post-traumatic amnesia; LOC, loss of consciousness.
Association between social relationship factors and GOS-E trajectory membership
Results of the multinomial logistic regression analysis assessing the association of social relationship factors during the first year and throughout the 10-year recovery period following TBI with class trajectory membership likelihood are shown in Tables 4 and 5, respectively.
Multinomial Logistic Regression Analysis Assessing the Association of Social Relationship Factors Measured by PART-O Social Subscale at Year 1 Following Traumatic Brain Injury with Trajectory Membership Likelihood

Note: Reference group is High Function trajectory group.
CI, confidence interval; OR, odds ratio; SE, standard error.
Multinomial Logistic Regression Analysis Assessing the Association of Social Relationship Factors Measured by PART-O Social Subscale over Year 1–10 Following Traumatic Brain Injury with Trajectory Membership Likelihood

Note: Reference group is High Function trajectory group.
CI, confidence interval; OR, odds ratio; SE, standard error.
Association of Social Relationship Factors at 1 Year Post-Injury with Trajectory Membership
Social relationship factors predictive of belonging to the Low Sustained Function group relative to the High Function group, from strongest to weakest rank by absolute magnitude distance from an OR of 1.00, included living with a spouse or significant other (OR: 1.212; 95% CI: 1.210–1.213), being involved in an intimate relationship (OR: 1.171; 95% CI: 1.170–1.172), having a close friend to confide in (OR: 1.149; 95% CI: 1.148–1.150), having fewer social interactions with friends per week (OR: 0.959; 95% CI: 0.958–0.960), fewer instances of using the internet for communication per week (OR: 0.969; 95% CI: 0.967–0.970), fewer social interactions with family per week (OR: 0.970; 95% CI: 0.969–0.971), fewer instances of giving emotional support per week (OR: 0.974; 95% CI: 0.973–0.975), and lower score on the total subscale (OR: 0.986; 95% CI: 0.985–0.987).
Social relationship factors predictive of belonging to the Declining Function group relative to the High Function group, from strongest to weakest, included living with a spouse or significant other (OR: 1.080; 95% CI: 1.079–1.081), being involved in an intimate relationship (OR: 1.077; 95% CI: 1.076–1.078), having a close friend to confide in (OR: 1.075; 95% CI: 1.074–1.076), and having more social interactions with friends per week (OR: 1.030; 95% CI: 1.029–1.031), but having fewer instances of giving emotional support per week (OR: 0.964; 95% CI: 0.963–0.965), fewer instances of social interactions with family per week (OR: 0.970; 95% CI: 0.969–0.971), fewer instances of using the internet for communication per week (OR: 0.980; 95% CI: 0.979–0.981), and lower score on the total subscale (OR: 0.995; 95% CI: 0.994–0.996).
Social relationship factors predictive of belonging to the Improving Function group relative to the High Function group, from strongest to weakest, included being involved in an intimate relationship (OR: 1.214; 95% CI: 1.210–1.220), having a close friend to confide in (OR: 1.109; 95% CI: 1.108–1.110), and having more social interactions with friends per week (OR: 1.010; 95% CI: 1.009–1.011), but lesser likelihood of living with a spouse or significant other (OR: 0.944; 95% CI: 0.943–0.945), having fewer instances of giving emotional support per week (OR: 0.968; 95% CI: 0.967–0.969), fewer instances of using the internet for communication per week (OR: 0.969; 95% CI: 0.968–0.970), fewer instances of having social interactions with family per week (OR: 0.972; 95% CI: 0.971–0.973), and lower score on the total subscale (OR: 0.989; 95% CI: 0.988–0.990) (Table 4).
Association of Social Relationship Factors Over 10 Years Post-Injury with Trajectory Membership
Social relationship factors predictive of belonging to the Low Sustained Function group relative to the High Function group, from strongest to weakest rank by absolute magnitude distance from an OR of 1.00, included a greater likelihood of living with a spouse or significant other (OR: 1.164; 95% CI: 1.163–1.165), being involved in an intimate relationship (OR: 1.133; 95% CI: 1.132–1.134), and having a close friend to confide in (OR: 1.054; 95% CI: 1.053–1.055), but having fewer instances of giving emotional support per week (OR: 0.873; 95% CI: 0.872–0.874), fewer instances of social interactions with friends per week (OR: 0.905; 95% CI: 0.904–0.906), fewer instances of social interactions with family per week (OR: 0.901; 95% CI: 0.900–0.902), fewer instances of using the internet for communication per week (OR: 0.892; 95% CI: 0.891–0.893), and having a lower score on the total subscale (OR: 0.954; 95% CI: 0.953–0.955).
Social relationship factors predictive of belonging to the Declining Function group relative to the High Function group, from strongest to weakest, included a greater likelihood of having a close friend to confide in (OR: 1.163; 95% CI: 1.162–1.164), living with a spouse or significant other (OR: 1.101; 95% CI: 1.100–1.102), and being involved in an intimate relationship (OR: 1.049; 95% CI: 1.047–1.049), but having fewer instances of giving emotional support per week (OR: 0.943; 95% CI: 0.942–0.944), fewer instances of using the internet for communication per week (OR: 0.951; 95% CI: 0.950–0.952), fewer instances of social interactions with family per week (OR: 0.954; 95% CI: 0.953–0.955), fewer instances of social interactions with friends per week (OR: 0.989; 95% CI: 0.988–0.990), and lower score on the total subscale (OR: 0.984; 95% CI: 0.983–0.985).
Social relationship factors predictive of belonging to the Improving Function group relative to the High Function group, from strongest to weakest, included a greater likelihood of having a close friend to confide in (OR: 1.282; 95% CI: 1.281–1.283), being involved in an intimate relationship (OR: 1.198; 95% CI: 1.197–1.199), and living with a spouse or significant other (OR: 1.069; 95% CI: 1.068–1.070), but having fewer instances of giving emotional support per week (OR: 0.896; 95% CI: 0.895–0.897), fewer instances of using the internet for communication per week (OR: 0.900; 95% CI: 0.899–0.901), fewer instances of social interactions with friends per week (OR: 0.944; 95% CI: 0.943–0.945), fewer instances of social interactions with family per week (OR: 0.946; 95% CI: 0.945–0.947), and a lower score on the total subscale (OR: 0.968; 95% CI: 0.967–0.969) (Table 5).
Discussion
This investigation examined the longitudinal recovery trajectories of GOS-E scores at 1, 2, 5, and 10 years post-TBI in 4,564 patients by leveraging machine learning and evaluating the association of social relationship factors at 1 year and over 10 years post-injury with recovery trajectory membership. Our results observed four heterogeneous recovery trajectories characterized by participants showing a nonlinear decline in function, maintenance of high function, improving function, and persistently low function over time to align with our first hypothesis (Fig. 2). Across all four trajectories, intercepts, linear slopes, and quadratic terms were significantly different from zero (Table 1), indicating that each class demonstrated a distinct baseline level of function as well as significant linear and nonlinear change in GOS-E scores over time. Wald tests further revealed significant pairwise differences between trajectories in both linear and quadratic time parameters (Table 2), indicating that classes differed in the rate and curvature of functional change over time. Predictive modeling evaluating the association of social relationship factors with trajectory membership observed that, at 1 year post-injury, being in an intimate relationship, living with a spouse or significant other, having a close friend to confide in, having lesser weekly social engagements with family and friends, using the internet for communication, and providing emotional support were associated with trajectories associated with greater disability compared with the High Function group (Table 5). When examining the association of the same factors reported over 10 years post-injury, these associations persisted but increased in strength for trajectories associated with both disability and improvement in function to partially support our second hypothesis (Tables 4 and 5). Specifically, over the 10 years, belonging to the Declining Function group was associated with a greater likelihood of having close friends to confide in and lesser likelihood of weekly engagement with friends and family, providing emotional support, and using the internet for communication per week than the High Function group, whereas belonging to the Improving Function group was associated with a greater likelihood of living with a spouse or significant other, being in an intimate relationship, and having a close friend to confide in, but remained less likely to engage socially on a weekly basis relative to the High Function group. The Low Function group demonstrated the lowest likelihood of social engagement and presence of close relationships in the first year and over 10 years post-injury (Table 5). Together, these findings indicate that social relationship factors are associated with trajectory membership and may serve as contextual markers of global functional status and recovery following TBI.
Previous work revealed recovery trajectories of GOS-E by leveraging mixed-effects modeling techniques, 24 such as individual growth curve (IGC) analysis,23,24,70 which models a single population average trajectory and the variation around it; however, this analysis fails to assume that the population is made up of distinct subgroups, each with its own unique growth trajectory that can be revealed using LCGA.25,63,71 One benefit of employing LCGA in the current investigation is that it assumed that the population was not homogenous but rather a mixture of distinct groups with a unique trajectory by constraining within-individual variation to zero and allowing for identifying different types of growth (i.e., high-growth, low-growth, declining) rather than a single average over time. 72 Compared with IGC, LCGA allows for mapping multiple distinct trajectories as opposed to mapping a single average trajectory and variance components and helps to identify different types of growth patterns to discern unique changes in function. 73 Unfortunately, few studies have applied LCGA to identify subgroup GOS-E trajectories.74–76 MacDonald et al. 74 leveraged LCGA to examine global disability trajectories in 475 US military servicemembers up to 10 years post-TBI, observing four clusters of trajectory: good stable recovery, upper moderate disability, lower moderate disability, and death. 74 Further analysis revealed that younger age at time of injury, lower education, and being enlisted above the risk of deployment were factors associated with worsened trajectory outcomes. 74 Wang et al. 75 identified four latent classes of Glasgow Outcome Score at discharge, 3, 6, 12, and 24 months post–moderate-to-severe TBI, with discharge LOC, discharge GOS score, age, and comorbidities as predictors associated with prognostic trajectories. 75 Chiang et al. 76 examined the trajectories of GOS-E of 100 participants, observing two latent clusters of recovery trajectories reflecting moderate recovery after TBI to complete recovery by 1 year and delayed accelerated recovery after TBI to near-complete recovery by 1 year. Further analysis revealed that unemployment at 1 month from injury was associated with delayed recovery. 76 However, previous work only included participants with mTBI or moderate-to-severe TBI 75 and did not assess the association of social relationship factors with functional outcomes.74–76 Further research using LCGA on GOS-E in patients with TBI and examining its association with social relationship factors is warranted.
LCGA revealed statistically significant and clinically meaningful differences among latent classes based on model parameters, which, when examining the first year alone, each class was designated a unique clinical category of GOS-E. At 1 year post-injury, the High Function group showed a GOS-E score of Lower Good Recovery (β0 = 7.140), Declining Function showed Upper Moderate Disability (β0 = 6.650), Improving Function reflected Lower Moderate Disability (β0 = 5.022), and Low Sustained Function demonstrated Lower Severe Disability (β0 = 3.511). By 10 years post-injury, these trajectories diverged in clinically meaningful ways. The High Function group showed a mean GOS-E score of 7.282 (95% CI: 5.230, 9.333), remaining within Lower Good Recovery, whereas the Declining Function demonstrated a mean score of 1.620 (95% CI: −0.430, 3.672), reflecting substantial deterioration to a range consistent with Death to Vegetative State. The Improving Function showed a mean score of 5.611 (95% CI: 3.560, 7.662), reflecting sustained recovery within Lower Moderate Disability, while Low Sustained Function reflected a mean score of 2.797 (95% CI: 0.746, 4.849), consistent with a Vegetative State to Lower Severe Disability. Importantly, the magnitude of these differences spans multiple GOS-E categories, indicating shifts that are clinically relevant and interpretable in terms of functional recovery. In addition, the consistency of nonoverlapping clinical categories across time further supports that these differences may not be solely attributable to statistical power alone but reflect meaningful separation in functional outcomes during recovery. Together, these data provide further evidence of the clinical utility in leveraging LGMM approaches for identifying heterogeneous recovery patterns following TBI and denote clear practical implications for stratifying patient recovery.
Maintaining a low GOS-E score reflecting Vegetative State to Lower Severe Disability characterized nearly one-quarter of the study sample (18.0%) (Fig. 2). Within the Low Sustained Function group, several changes from 1 year to 10 years post-injury reflected a progressive weakening of the types of social relationships and weekly social engagements. Specifically, the ORs for being involved in an intimate relationship, living with a spouse or significant other, and having close friends to confide in decreased over time (spouse ORs: 1.212–1.164; relationship ORs: 1.171–1.133; confided friend ORs: 1.149–1.054), suggesting that although these social factors distinguished Low Sustained Function, their potential protective influence based on previous literature50,51 is not supported from our results. Concurrently, the ORs for fewer emotional provisions, fewer weekly friend and familial social interactions, and lesser weekly use of the internet for communication declined further, indicating that lower social engagement coincided with persistent functional impairment. The overall social relationship subscale of the PART-O became more predictive over time, as reflected by a reduction in OR from 0.986 to 0.954 to suggest that lower scores more strongly characterized persistent low function. Although these data cannot delineate the cause of the relationship between the subscale parameters and GOS-E, these findings may be interpreted in the context of global disability status. The association with greater social disengagement and fewer types of relationships with increased likelihood of belonging to Low Sustained Function may represent a consequence of functional impairment, as persistent disability can limit opportunities for social participation and support. However, future studies examining underlying potential mechanisms contributing to this association are warranted.
Improvement in GOS-E scores reflecting Lower Moderate Disability and Upper Moderate Disability characterized a relatively large cluster of the sample, with the Improving Function group comprising nearly one-third of participants (29.7%). From 1 to 10 years, this group demonstrated a notable shift in which dimensions of social relationship factors were associated with this trajectory membership. At 1 year, individuals were distinguished by their involvement in an intimate relationship and having a close friend to confide in, with being in an intimate relationship emerging as the dominant factor relative to the High Function group (Table 4). By 10 years, however, having a close friend to confide in became the strongest predictor, surpassing both relationship status and cohabitation, suggesting that peer-based social support increasingly coincided with improvement in recovery over time. In parallel, reporting a lesser weekly frequency of providing emotional support, interacting with family or friends, and using the internet for communication was also associated with this group relative to the High Function group, as exhibited by progressively lower ORs (Table 5). Together, belonging to the Improving Function group was associated with a greater likelihood of having intimate relationships, cohabitation, and close friendships, but lesser weekly social engagements within broader contexts, which may reflect the functional status of participants coinciding with greater participation in some social relationship factors. Hence, changes in factors in this group may represent a reflection of functional improvement. This is complementary with prior work suggesting that enhanced, closer social connections may serve as a meaningful indicator of positive recovery over the long term.77,78
Nonlinear decline in function represented by Upper Moderate Disability to Death or Vegetative state characterized the Declining Function group, which consisted of a small cluster of the sample (6.0%). Despite both Improving Function and Declining Function groups displaying similar patterns of social dynamics over time, as demonstrated by an increased likelihood of having types of social relationships coinciding with concomitant reduction in weekly social engagement, both groups diverged in how these factors manifested and interacted with their functional outcomes. In the Improving Function group, social relationship factors may have served as a marker of functional improvement during recovery, whereby confided friendships, spousal support, and providing emotional support strengthened in their association over time, which may be reflective of improvement in global function. Conversely, in the Declining Function group, similar patterns occurred but may be reflective of the opposite context serving as markers of functional decline. Although the Declining Function group was also associated with greater likelihood of having types of relationships and lesser likelihood of weekly social engagements than the High Function group, the shape of the trajectory may provide greater context in these associations and reflect accompanying functional loss rather than recovery. Together, both Declining Function and Improving Function exhibited parallel relationships with social relationship factors but differed in functional trajectory, with Improving Function demonstrating a pattern reflecting associative adaptation with functional recovery, and the Declining Function group reflecting a decrease of social engagement with functional decline (Fig. 2).
Maintaining a high GOS-E score reflecting Lower Good Recovery characterized the High Function group as the largest cluster of the sample (46.3%). Our results observed a similar distribution of distinct latent classes that is consistent with previous literature, 75 and that one of the four latent classes reflected a relatively high degree of global function over a 10-year period. 74 Comparative analysis of baseline characteristics revealed that this group exhibited the fewest number of TBIs before the age of 15 years old (mean = 1.24; SD = 0.49, p = 0.028) compared with the remaining classes and showed the fewest injury causes by motor vehicle (36.8%, p = 0.011), which may have contributed to their maintenance of high function over time (Table 3). Although this class served as the reference group for determining the associations between social relationship factors and trajectory membership, the results at 1 year and 10 years post-injury suggest that this group demonstrated greater likelihood of weekly social engagement with friends and family, used the internet for communication, and provided emotional support than the trajectories associated with greater disability (Tables 4 and 5). These results may be attributed to participants’ global functional status, whereby GOS-E scores consistent with Lower Good Recovery over the 10-year period may have allowed for greater social engagement, as reflected in previous literature observing positive associations between global function and social participation.52,53 Interestingly, individuals in the High Function group were also less likely to report certain types of relationships, including living with a spouse or significant other, being in an intimate relationship, and having a close friend to confide in when compared with the remaining trajectories. Although the underlying causes of these associations cannot be determined, one possible explanation is that individuals in trajectories characterized by greater disability may have required increased functional support, leading to greater reliance on peers and cohabitation. However, further research is needed to clarify the mechanisms underlying these associations, particularly whether they reflect differences in functional dependence, social support needs, or broader social participation following injury.
Although this investigation unveiled novel results, it is not without limitations. First, our results of the association of social relationship factors with functional outcome trajectory only tell a part of the story regarding risk factors. Functional recovery after TBI has been shown to be heterogenous and multifactorial, with factors like socioeconomic factors, 79 age,16,23 sex,33,34 education,35–37 pre-injury employment,21,33,36 race,23,38,39 history of alcohol abuse before injury,33,40 presence of intracranial lesions,41,42 mental health, 80 and GCS score41,43 associated with recovery outcomes. Fatigue has been shown to be associated with lesser social participation, which was not assessed in the current investigation. 81 Injury severity was the strongest predictor for global functional outcome following TBI in a European cohort study. 82 Age at injury has shown to be a suppressor variable, potentially masking the effect of injury severity in other studies. 83 It has also been shown to influence trajectories over time, causing mortality rates to rise as age does. 84 Importantly, the model was adjusted for notable risk factors, including age, sex, GCS, education, zip code, and living situation following the injury to help discern the relationship between social relationship factors and GOS-E scores. Second, the analytical approach only included participants with complete GOS-E data from discharge through 10 years post-TBI, indicating survivorship bias to these results. Third, the changes in ORs across the three trajectory groups over time may have been influenced by changes in GOS-E within the High Function group; however, this group was chosen owing to its largest sample size and stability over time for comparisons. 63 Fourth, the GOS-E may also avoid ceiling or floor effects and enhance its precision by using item response theory in future studies. 85 Finally, the subscale used in this study served only as a proxy measure of social support as there was no formal capture of the nature or quality of the social interaction. Further research investigating the association of the quality of social interactions with trajectory membership is warranted.
Conclusion
Following TBI, the use of LCGA on GOS-E scores over 10 years reveals four distinct subgroups of TBIMS participants characterized by the maintenance of high function (46.3%), improving function (29.7%), a nonlinear decline in function (6.0%), and low sustained function over time (18.0%). Social relationship factors are associated with functional recovery trajectories, with trajectories associated with greater disability showing a greater likelihood of having close friends to confide in, intimate relationships, and living with a spouse or significant other, as well as reporting fewer weekly interactions with friends and family, using the internet for communication, and providing emotional support at 1 year, all of which strengthen in association over 10 years relative to a high function group. Together, these findings indicate that social relationship factors are associated with trajectory membership and may serve as contextual associative markers of global functional status following TBI. Further research investigating the association between social interaction quality and functional trajectory memberships is warranted.
Transparency, Rigor, and Reproducibility Summary
The study design and analytic plan were preregistered as part of the TBIMS National Database parent study (https://www.tbindsc.org/Default.aspx). All data used for this investigation were from the open-access national database (https://www.tbindsc.org/staticfiles/DD/_ndb.html).
Ethical Considerations
The authors declare that the Research Ethics Committee of the TBIMS Model Systems has approved all the procedures undertaken in this project, and all participants provided written informed consent prior to procedures within this project. The above-mentioned study is consistent with the principles of ethics of scientific research.
Authors’ Contributions
E.D.F.: Conceptualization, methodology, writing—original draft preparation, formal analysis, data curation, visualization, investigation, and software; M.J.M.: Conceptualization, writing—original draft preparation, methodology, investigation, and writing—review and editing; C.B.L.: Writing—review and editing, and conceptualization; B.F.: writing—review and editing; D.G.: Writing—review and editing; C.W.L.: Writing—review and editing and conceptualization; M.-M.T.: Writing—review and editing; B.O.: writing—review and editing; I.F.: Writing—review and editing; J.T.G.: conceptualization, methodology, investigation, resources, funding acquisition, data curation, and project administration; R.B.: Writing—review and editing; D.H.D.: Conceptualization, methodology, resources, project administration, supervision, and writing—review and editing.
Footnotes
Data Availability
Author Disclosure Statement
The author(s) declared no potential conflicts of interest with respect to the research, authorship, and/or publication of this article.
Funding Information
The current investigation was conducted under no formal funding resource. However, the contents of this report were developed under a grant from the National Institute on Disability, Independent Living, and Rehabilitation Research (NIDILRR #90DPTB0027 [Giacino]). NIDILRR is a center within the Administration for Community Living (ACL), Department of Health and Human Services (HHS). The contents of this report do not necessarily represent the policy of NIDILRR, ACL, and HHS without endorsement by the Federal Government.
Supplemental Material
Supplemental Material
Supplemental Material
Abbreviations
References
Supplementary Material
Please find the following supplemental material available below.
For Open Access articles published under a Creative Commons License, all supplemental material carries the same license as the article it is associated with.
For non-Open Access articles published, all supplemental material carries a non-exclusive license, and permission requests for re-use of supplemental material or any part of supplemental material shall be sent directly to the copyright owner as specified in the copyright notice associated with the article.