
Abstract
Background. Little information exists about longitudinal changes in spatiotemporal gait asymmetry during rehabilitation, despite it being a common goal. Objectives. To describe longitudinal changes in spatiotemporal gait asymmetry over rehabilitation and examine relationships with changes in other poststroke impairments. Methods. Retrospective chart reviews were conducted for 71 stroke rehabilitation inpatients. Admission and discharge measures of spatiotemporal symmetry, velocity, motor impairment, mobility and balance were extracted and change scores were calculated. Relationships between changes in spatiotemporal symmetry and other change scores were investigated with Spearman correlations. Individuals were divided into four groups (worse, no change-symmetric, no change-asymmetric, improved) based on (1) symmetry/asymmetry at admission and (2) symmetry change scores >minimal detectable change. Differences in change scores between groups were investigated with analyses of covariance using the admission value as a covariate. Results. At admission, 59% and 49% of individuals were asymmetric in swing time and step length, respectively. Of these individuals, 21% and 14% improved swing symmetry or step symmetry, respectively. In contrast, 30% improved gait velocity, 62% improved functional balance and 73% improved functional mobility. Associations between change in swing symmetry and change in paretic limb weight bearing in standing and change in step symmetry and change in velocity were significant. There were no significant differences in change scores between the symmetry groups. Conclusions. The majority of asymmetric stroke patients did not improve spatiotemporal asymmetry during rehabilitation despite the fact that velocity, balance and functional mobility improved. Future work should investigate other factors associated with improved spatiotemporal symmetry and interventions to specifically improve it.
Introduction
Stroke-induced gait impairments can limit independence, quality of life, and participation, and improved walking function is the top rehabilitation goal poststroke.1,2 Two common poststroke gait impairments are temporal and spatial asymmetry, exhibited by 55.5% and 33.3% of individuals with chronic stroke, respectively. 3 Reducing this asymmetry is commonly addressed by physiotherapists. 4 This emphasis is likely because of the potential negative consequences associated with persisting spatiotemporal gait asymmetry, which include (1) challenges to balance control, (2) gait inefficiencies, (3) cumulative musculoskeletal injury to the nonparetic lower limb, (4) loss of bone mineral density in the paretic lower limb, and (5) reduced activity which may occur in response to any one or a combination of the preceding consequences3,5,6
Spatiotemporal gait asymmetry has been described as resistant to intervention. 7 This resistance may be due in part to lack of training specificity; interventions that focus on ameliorating spatiotemporal gait asymmetry 8 have had more success than interventions to improve velocity or cardiovascular fitness.7,9 New spatiotemporal gait symmetry interventions will be guided by information about changes in asymmetry with current rehabilitation practice. Furthermore, information about factors associated with changes in spatiotemporal gait asymmetry may facilitate tailoring interventions to specific patient deficits.
Despite the clinical importance of spatiotemporal gait symmetry, there is little information about longitudinal changes. It appears that spatiotemporal gait asymmetry may worsen in the chronic stage of stroke.10,11 However, no studies have examined changes in spatiotemporal gait asymmetry over inpatient rehabilitation when it is likely to be a target for intervention. Thus, the purpose of this study was to describe longitudinal changes in spatial and temporal gait asymmetry over inpatient rehabilitation. A secondary objective was to examine longitudinal changes during inpatient rehabilitation in other related dimensions that may be associated with changes in either spatial or temporal gait asymmetry, including lower limb motor impairment, gait function, quiet standing balance and reactive balance.
Methods
Data were obtained through retrospective chart reviews of individuals admitted to stroke rehabilitation from October 2009 to September 2011. Inclusion criteria were the ability to (1) stand independently for 30 seconds without a mobility aid and (2) walk 10 m without an aid and without physical assistance. Exclusion criteria were (1) previous lower limb orthopedic surgeries, prosthetics, or ankle-foot orthotics; (2) history of other neurological conditions that would influence gait; (3) bilateral strokes or bilateral sensorimotor impairment; and (4) greater than 10 days between tests at admission or discharge. Seventy-one individuals met these criteria and were included. The review was approved by the institution’s research ethics board with a waiver of patient consent.
Standardized Gait and Balance Assessment
The assessment was carried out in a novel on-site clinic that integrates technology (eg, force plates, pressure-sensitive mat) with clinical measures of gait and balance.12,13 This standardized assessment is considered routine care and is completed on admission and discharge from inpatient stroke rehabilitation. Measures of spatiotemporal overground gait parameters, quiet standing balance control, and reactive balance control are obtained and the results are entered as part of the patient care record. Assessments were administered by a trained physiotherapist. The assessment methods are described in detail elsewhere14,15 but will also be described briefly here.
Overground Gait Assessment
Spatiotemporal parameters of gait were measured using a pressure-sensitive mat (GaitRite, CIR Systems, Clifton, NJ) that measures 4.6 m × 0.9 m and records the timing and location of each foot fall during walking. Data were stored in a personal computer that calculated spatial and temporal parameters using application software. Participants walked at their preferred speed across a level 10-m walkway which included the pressure sensitive mat in the middle. Participants walked without any gait aids but were permitted to wear any customary braces or orthotics (eg, ankle-foot orthosis). Walking trials were performed until 18 footfalls were collected (typically 2-3 trials; up to 5 trials were completed for those with long stride lengths).
Quiet Standing Balance Assessment
Quiet standing balance was measured using 2 force plates. Individuals stood with 1 foot on each force plate in a standardized position (heels 17 cm apart, 14° between the long axes of the feet. 16 Weightbearing on the paretic limb was recorded under 2 conditions: (1) standing quietly with eyes open for 30 seconds, which is an estimate of an individual’s natural tendency to bear weight on their paretic limb (stand condition) and (2) standing while bearing as much weight as possible on the paretic limb for up to 20 seconds, which is an estimate of an individual’s capacity to bear weight on the paretic limb (load condition). The shorter duration for the latter condition is because of decreased tolerance individuals with stroke have for this condition compared to the quiet stance condition.
Reactive Balance Assessment
Compensatory stepping reactions were evaluated in a videotaped session, using a lean-and-release postural perturbation system. 17 Patients stood in the standardized foot position 16 with 1 foot on each of the 2 force plates and leaned forward with approximately 10% of their body weight supported by a cable attached to the wall. A load cell attached in series with the cable measured forces placed on the cable prior to the perturbation. This output was monitored to ensure consistency of the lean prior to the perturbation. A perturbation was created by releasing the cable at an unexpected time, which caused the individual to fall forward. This type of perturbation consistently evokes compensatory stepping reactions in young healthy individuals. 17 There were no instructions or constraints placed on reactions. Individuals wore a safety harness attached to an overhead frame to prevent a fall where there was a failure to recover balance. A physiotherapist also provided standby assistance for every trial and provided hands-on assistance if individuals were unable to regain stability alone.
The load cell output was used to detect perturbation onset time (ie, time when force recorded was <1 N) and vertical ground reaction forces were recorded by the force plates. These data were sampled at 256 Hz. The limb used to initiate compensatory stepping was identified using the following criteria: The vertical force on 1 forceplate was <1% body weight and/or there was noticeable forward movement of the foot on the video.
Data Extraction
The following measures at admission and discharge were extracted from the patient chart:
Demographic data and measures of motor impairment, functional balance and functional mobility: Age, sex, date of stroke, affected side, Chedoke-McMaster Stroke Assessment (CMSA), 18 Berg Balance Scale (BBS), 19 and Clinical Outcome Variables Scale (COVS). 20
Spatiotemporal measures of overground gait: The values (averaged over 2-5 walking trials) for velocity and left and right swing time (seconds) and step length (cm) were extracted. The magnitude of swing time and step length symmetry were calculated as the ratio of left and right values, with the larger value in the numerator (irrespective of the affected side) as per recommendations. 21 A ratio of 1.0 indicates perfect symmetry. The direction of asymmetry was determined with respect to the limb that exhibited the larger swing time/step length value; paretic or nonparetic. However, only the change in the magnitude of the asymmetry was considered in subsequent statistical analyses.
Quiet standing balance: The amount of weight borne on the paretic limb was expressed as percentage of body weight and was averaged over the trial for both the stand and load condition (%BWPload). The difference between 50% and the amount of weight borne on the paretic limb, during the stand condition only, was then calculated (%BWPstand). The ratio of the root mean square (RMS) of the center of pressure (COP) in the anterior–posterior (AP) direction under the paretic and nonparetic limbs was also calculated. A value of 1.0 indicates equal contribution from the paretic and nonparetic limbs to balance control. The difference between the RMS-AP ratio and 1.0 was calculated to indicate the magnitude of discrepancy from equal contribution of lower limbs to balance (RMS-COP).
Reactive balance control: The frequency of initiating stepping with the paretic limb after a perturbation was calculated by dividing the number of trials where steps were initiated with the paretic limb by number of trials where a step was taken (PERT-freq). The mean duration of compensatory steps with the nonparetic limb was also calculated. Steps that are too quick or too slow could be detrimental to balance recovery. Therefore, participants were classified as either within or outside the 95% confidence interval (CI) for compensatory swing time for healthy adults [132 ms, 178 ms] 17 (PERT-swing).
Data and Statistical Analysis
All calculations and statistical analyses were performed using SAS 9.3 software (SAS Institute Inc, Cary, NC).
Change Scores
Change scores were calculated for spatiotemporal gait symmetry, velocity, COVS, BBS, CMSA scores, and measures of standing and reactive balance by subtracting the admission value from the discharge value. For CMSA leg, CMSA foot, velocity, BBS, COVS, %BWPload, RMS-COP, and PERT-freq, change scores >0 indicate an improvement and scores <0 indicate a worsening from admission to discharge. The reverse is true for %BWPstand. For PERT-swing, the classification at admission and discharge were compared. Participants were classified as improved (ie, outside the CI at admission and within the CI at discharge), no change (ie, PERT-swing value at admission and discharge the same) or worse (within the CI at admission and outside the CI at discharge).
Classification of Participants According to Swing and Step Symmetry
Individuals were classified by the magnitude of their swing and step asymmetry as follows. First, individuals with admission symmetry ratios >normative cut-point (1.06 for swing symmetry, 1.08 for step symmetry 21 ) were classified as asymmetric; all others were classified as symmetric. Second, individuals with change scores >minimal detectable change (MDC; 0.26 for swing symmetry, 0.19 for step symmetry 22 ) were classified as either “improved” or “worse” depending on whether the discharge symmetry ratio was closer to or further away from 1.0, respectively. All others were classified as “no change.” Finally, the “no change” group was divided again into those who were symmetric and those who were asymmetric on admission. This process divided the study sample into four groups with respect to changes in swing and step symmetry: improved, no change and asymmetric on admission (no change-a), no change and symmetric on admission (no change-s), and worse. Individuals in the improved and worse groups were also classified by the change in direction of the swing and step asymmetry from admission to discharge. Individuals were classified as “no change” (NC) if the direction of asymmetry (ie. larger paretic or nonparetic swing time/step length value) was the same at admission and discharge. Individuals who exhibited a change in symmetry direction were classified as either (1) change from a larger paretic value at admission to a larger nonparetic value at discharge (PtoNP) or (2) change from a larger nonparetic value at admission to a larger paretic value at discharge (NPtoP).
Classification of Participants According to Velocity, Functional Balance, and Functional Mobility
Participants were classified as either improved, worse, or no change in those measures for which change could be compared to an objective level accounting for either (1) error and variability in the measurement (MDC) or (2) the amount of change that has significance for the patient (minimal clinically important difference MCID) depending on what was available in the literature. Thus the following values were used: velocity (MDC = 0.30m/s), 23 BBS (MDC = 6), 24 and COVS (MCID = 5). 25 Participants were classified as “improved” or “worse” if the change score >MDC or MCID and if the discharge score was greater or less than the admission score, respectively. All others were classified as “no change.”
Statistical Analyses
All data were tested for normal distribution using the Shaprio–Wilk test. Variables that were not normally distributed were rank transformed and the ranked values were used in the subsequent analysis of variance (ANOVA) and analysis of covariance (ANCOVA) analyses.
The three symmetry change groups (improved, no change-a, no change-s) were compared for differences in age, length of stay, and time poststroke at admission to rehabilitation with 1-way ANOVAs.
To investigate within-subject changes from admission to discharge in functional outcomes and balance measures Wilcoxon signed rank tests were performed on velocity, %BWPstand, %BWPload, RMS-COP, PERT-freq, CMSA leg and foot scores, COVS, and BBS. Multiple comparisons were corrected with the Holm method 26 and the initial adjusted level of significance was set to P = .006.
Spearman correlations were used to investigate relationships between changes in swing and step symmetry and changes in velocity, COVS, BBS, CMSA leg and foot scores, %BWPstand, %BWPload, RMS-COP, PERT-freq, and PERT-swing. Multiple comparisons were corrected with the Holm method 26 and the initial adjusted level of significance was set to P = .005.
To investigate differences across the symmetry change groups for swing and step symmetry, ANCOVAs were computed on the change scores for velocity, CMSA leg and foot scores, BBS, COVS, %BWPstand, %BWPload, RMS-COP, PERT-swing, and PERT-freq. The admission value for each respective variable was used as a covariate. Ordinal data were rank transformed prior to analysis (eg, CMSA, BBS, and COVS) and the Holm 26 method was used to correct for multiple comparisons. The initial adjusted level of significance was .005. 26 The no change-s group was included in the analysis so as not to misrepresent our entire study sample as more impaired or having lower gait and balance function.
Results
The mean (standard deviation [SD]) age for the group was 67.4 (11.8) years, 43 individuals in the group were men and 43 exhibited right-sided hemiparesis. The mean (SD) time poststroke on admission was 19.7 (18.5) days and mean length of stay was 30.1 (9.0) days. On average, the entire group exhibited asymmetric gait on admission with mean swing symmetry and step symmetry ratios of 1.21 (0.35) and 1.14 (0.21), respectively. The mean swing and step symmetry magnitude and the direction of asymmetry for each of the symmetry change groups are summarized in Table 1.
Summary of Swing and Step Symmetry Change Groups. a
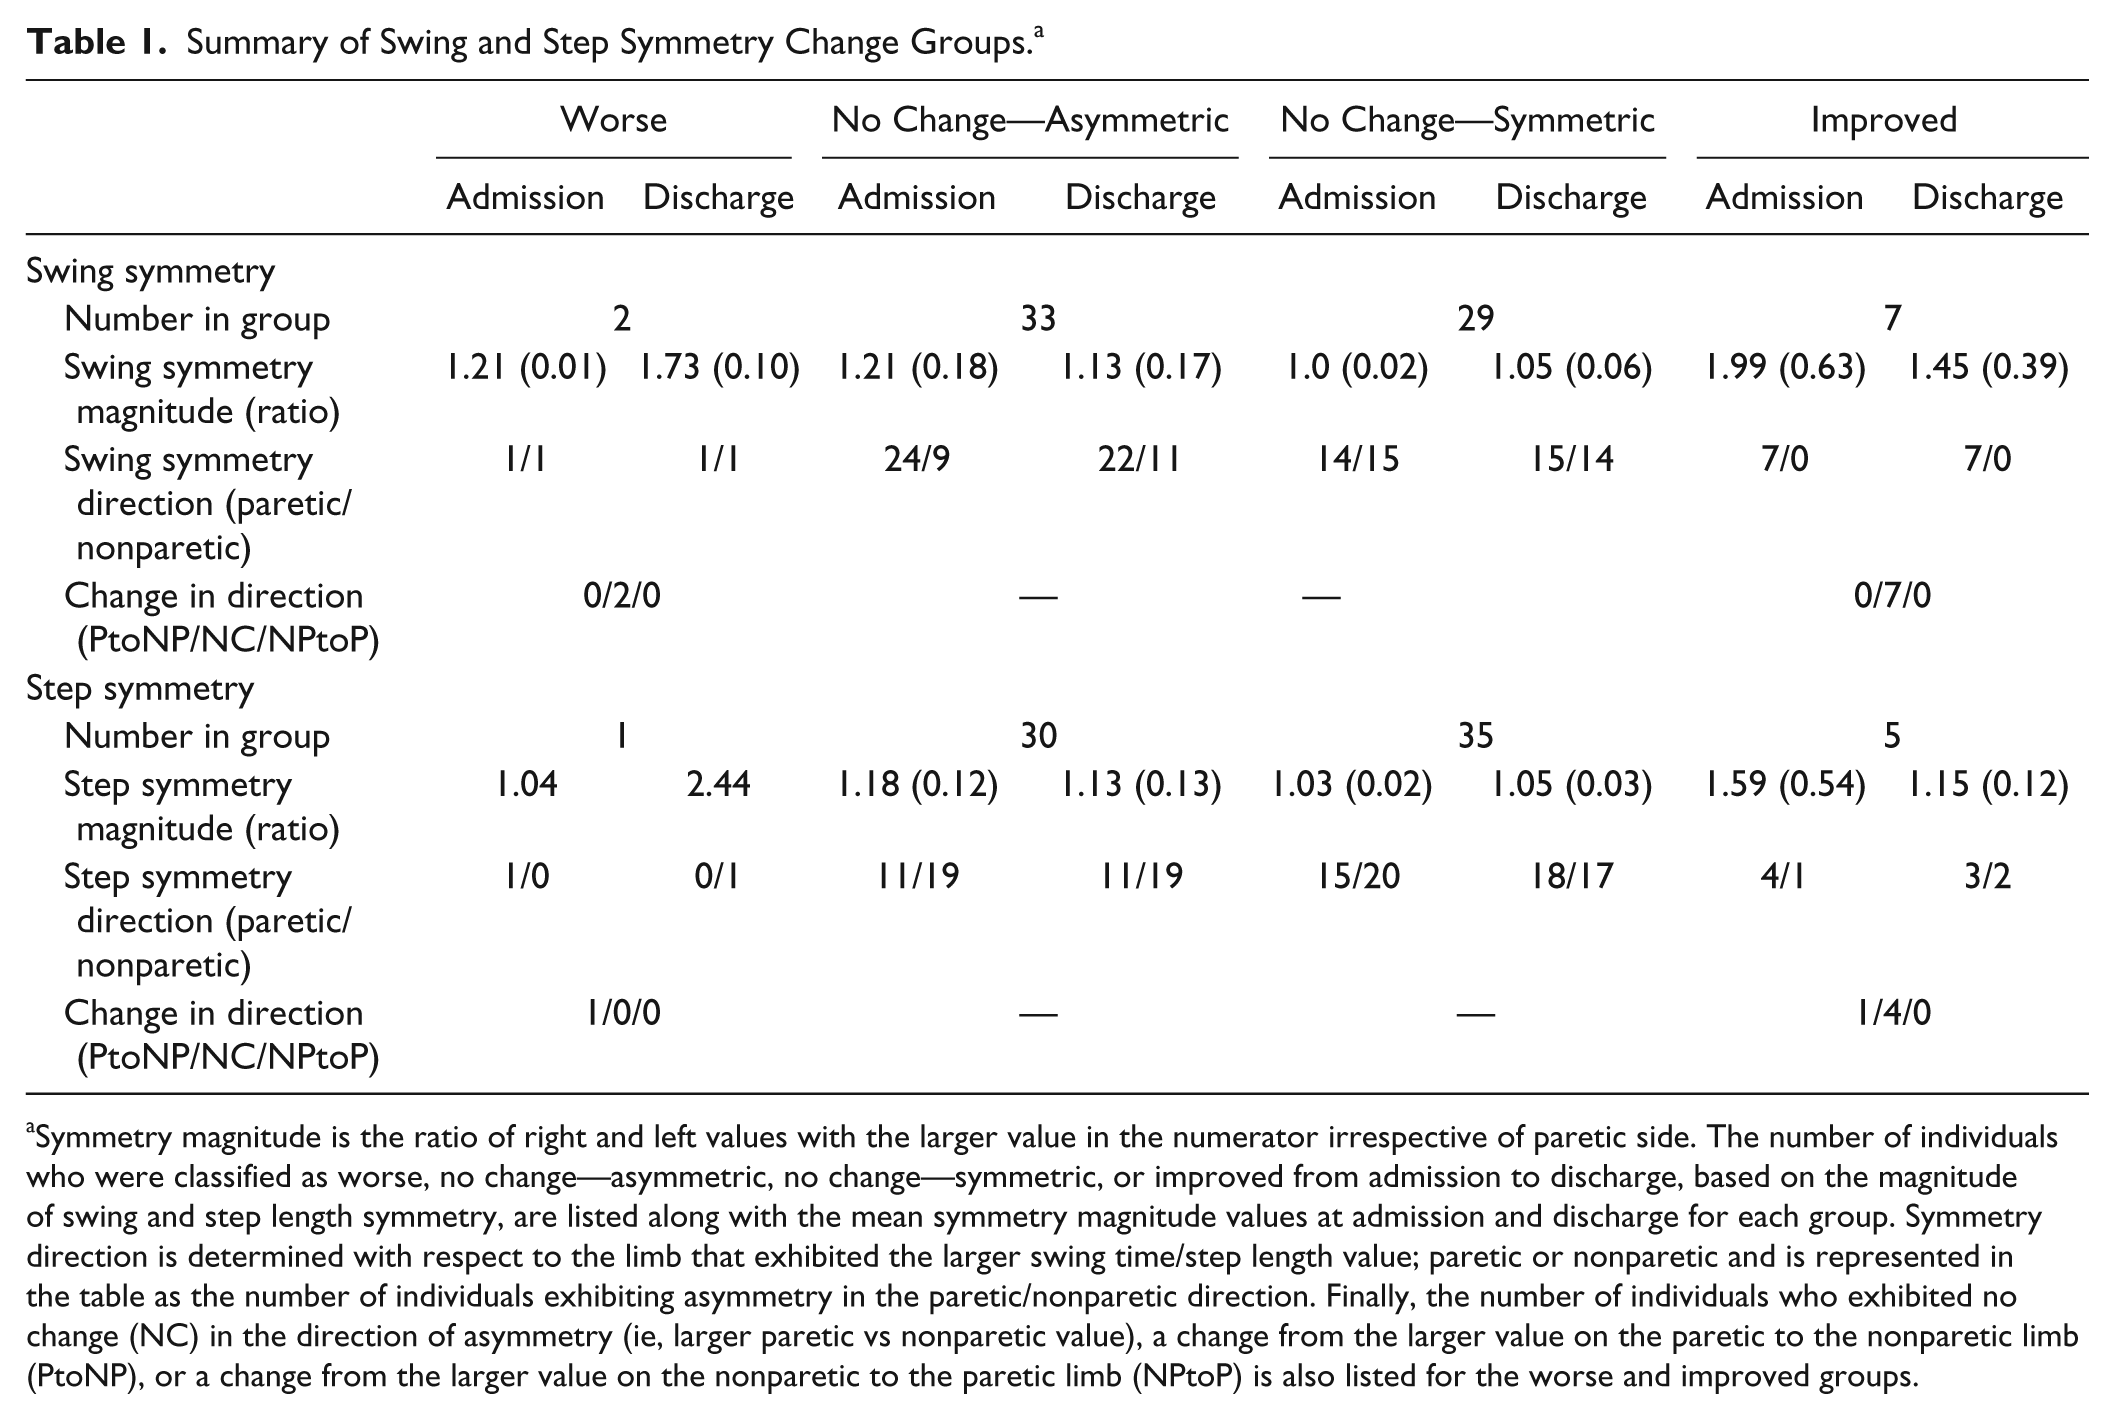
Symmetry magnitude is the ratio of right and left values with the larger value in the numerator irrespective of paretic side. The number of individuals who were classified as worse, no change—asymmetric, no change—symmetric, or improved from admission to discharge, based on the magnitude of swing and step length symmetry, are listed along with the mean symmetry magnitude values at admission and discharge for each group. Symmetry direction is determined with respect to the limb that exhibited the larger swing time/step length value; paretic or nonparetic and is represented in the table as the number of individuals exhibiting asymmetry in the paretic/nonparetic direction. Finally, the number of individuals who exhibited no change (NC) in the direction of asymmetry (ie, larger paretic vs nonparetic value), a change from the larger value on the paretic to the nonparetic limb (PtoNP), or a change from the larger value on the nonparetic to the paretic limb (NPtoP) is also listed for the worse and improved groups.
Change in Spatiotemporal Gait Symmetry
At admission, 59% (42/71) and 49% (35/71) of individuals were classified as asymmetric in swing time and step length asymmetry respectively. The majority of these individuals did not exhibit a change in symmetry over inpatient rehabilitation that exceeded the MDC; 79 % (33/42) did not change swing symmetry and 86% (30/35) did not change step symmetry. The number of individuals categorized as improved, no change-a, no change-s, or worse, in terms of the magnitude of the asymmetry, is summarized in Table 1. The number of individuals (within the worse and improved groups) categorized as no change, PtoNP or NPtoP, in terms of the direction of asymmetry is also summarized in Table 1.
Change in Functional Outcomes, Balance, and Motor Impairment
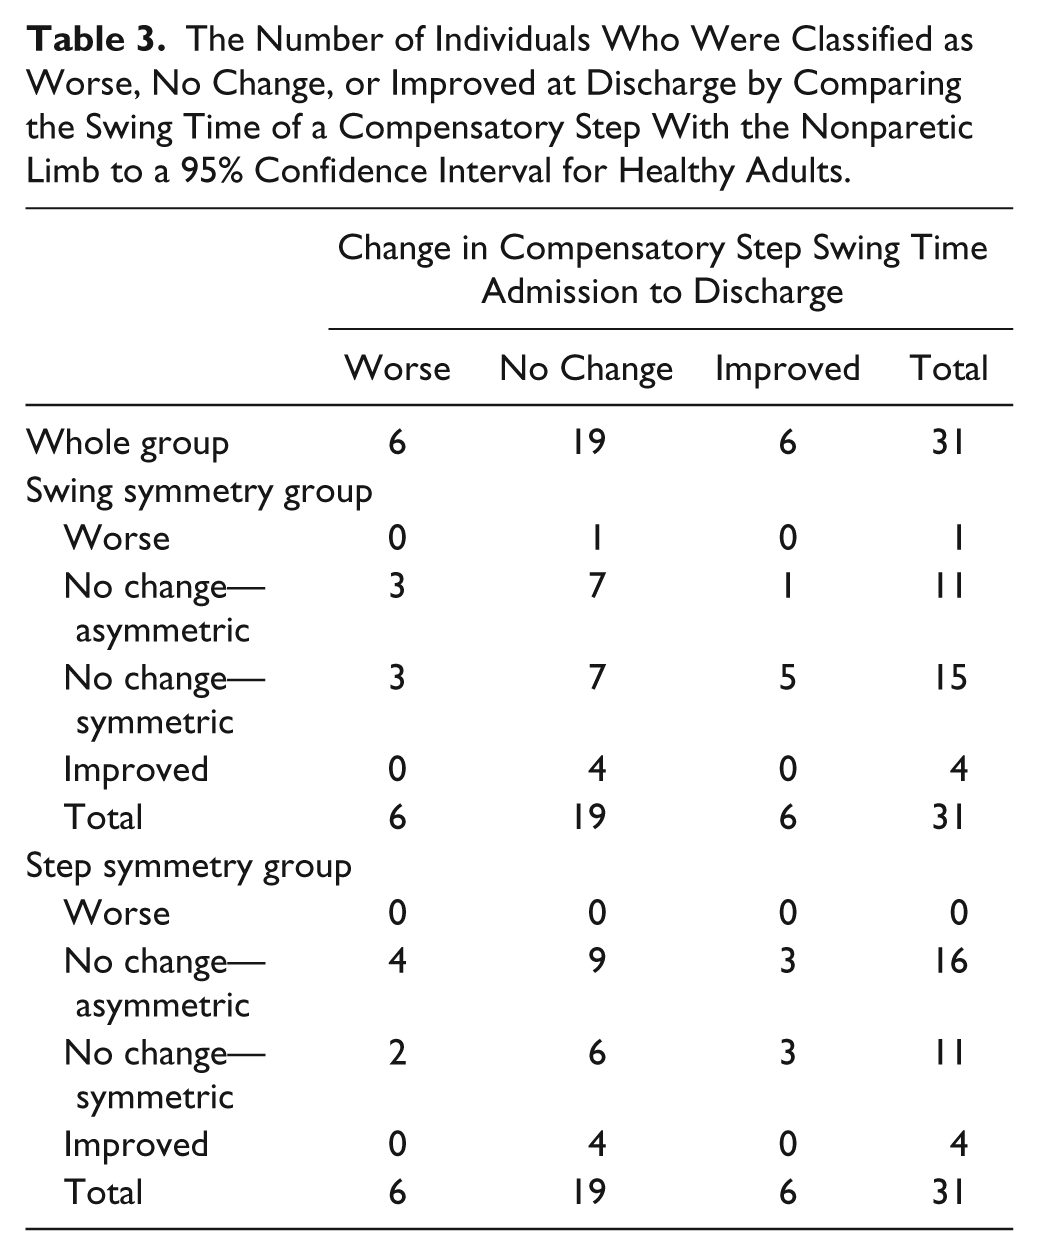
Mean admission and discharge values are summarized in Table 2. Table 2 also summarizes the number of individuals classified as worse, improved and no change for velocity, BBS and COVS. Some admission and discharge values were missing; thus the number of individuals included in each analysis is also reported. On average, there was a significant improvement from admission and discharge for velocity, CMSA leg and foot scores, BBS, COVS, and PERT-freq. Table 3 contains a summary of the classification of individuals based on PERT-swing compared to the 95% CI for healthy individuals at admission and discharge. Of the 31 individuals who met the inclusion criteria for extracting the PERT-swing values (ie, completed 5 trials of external perturbations), 61% (19/31) did not exhibit a change in compensatory step swing time with the nonparetic limb.
Group Mean Values for Balance, Gait, and Motor Impairment on Admission and Discharge for the Entire Study Group. a
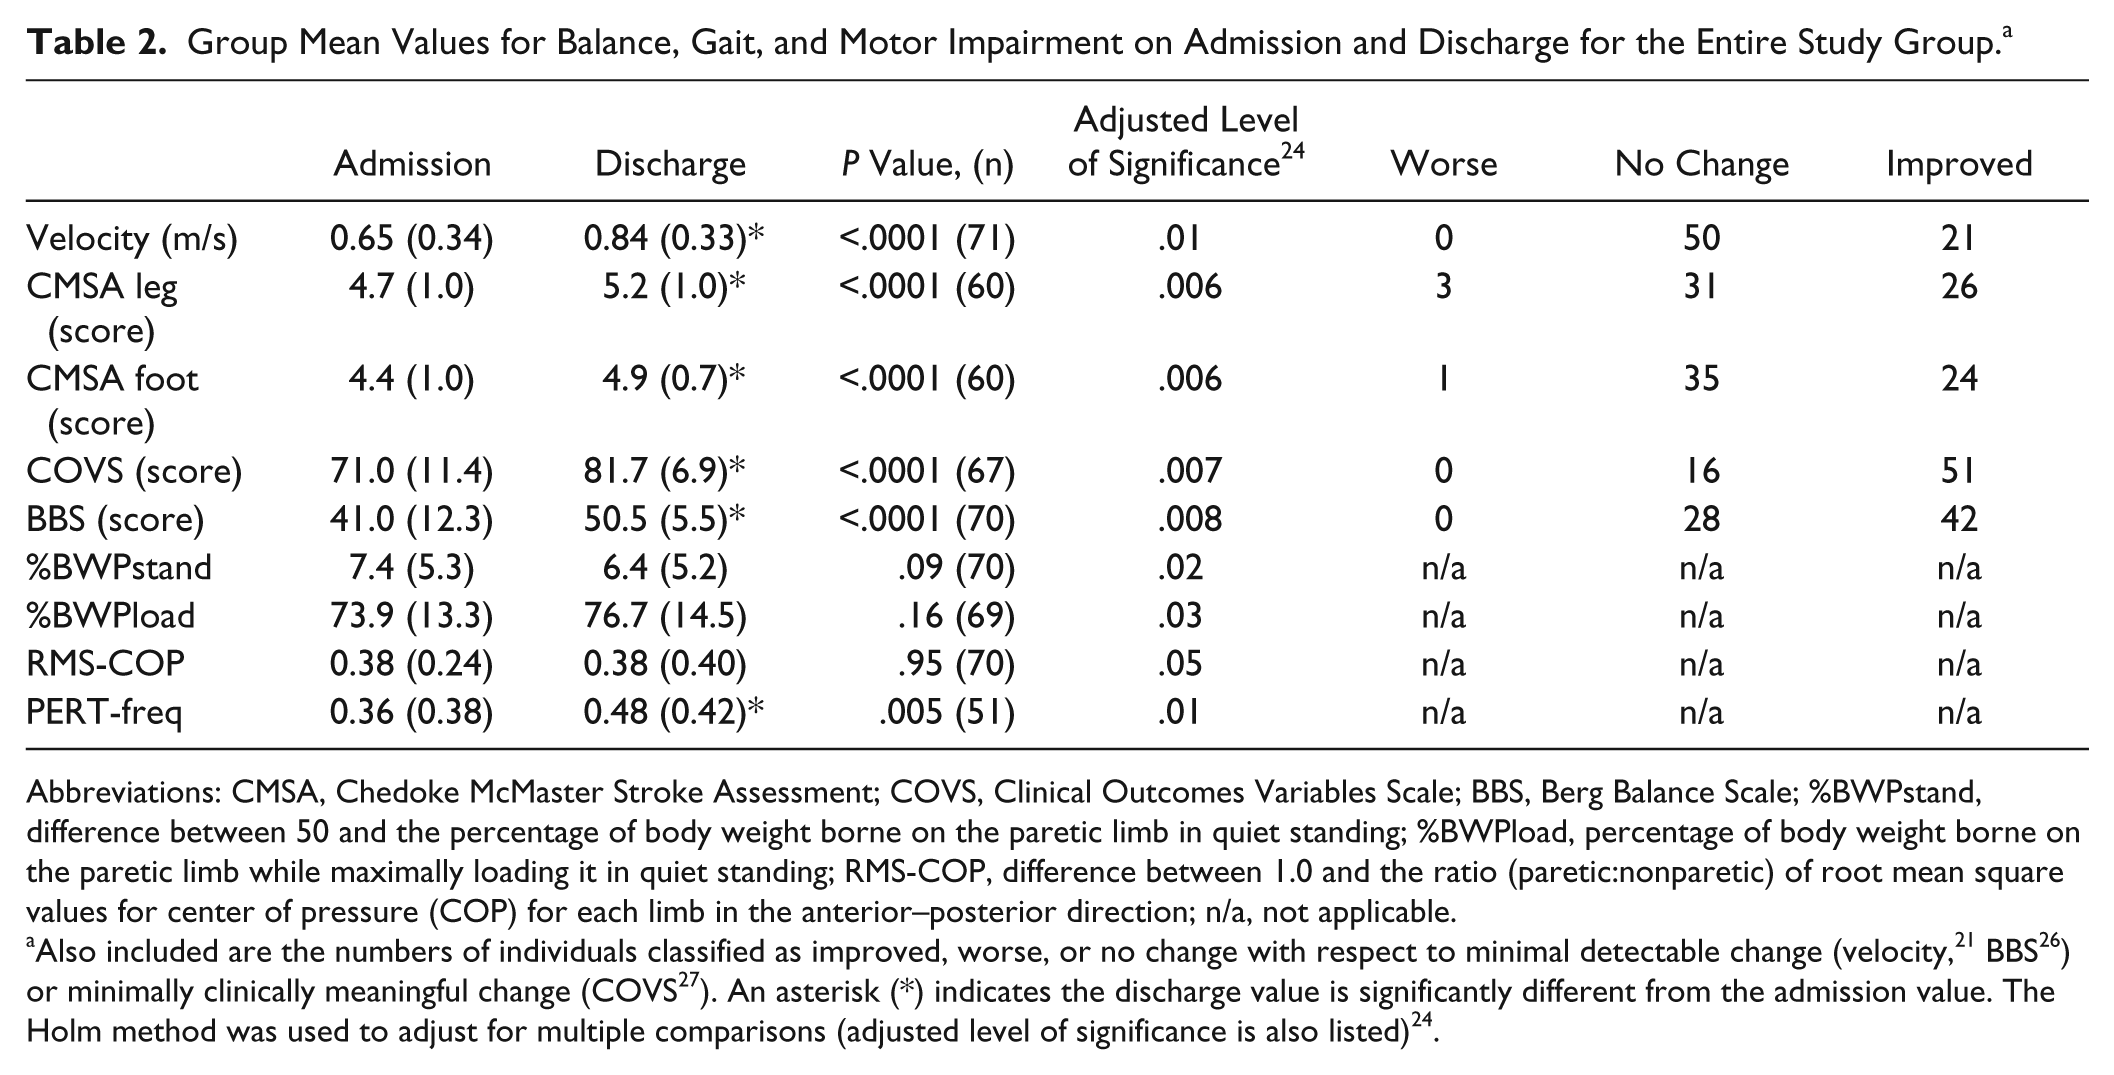
Abbreviations: CMSA, Chedoke McMaster Stroke Assessment; COVS, Clinical Outcomes Variables Scale; BBS, Berg Balance Scale; %BWPstand, difference between 50 and the percentage of body weight borne on the paretic limb in quiet standing; %BWPload, percentage of body weight borne on the paretic limb while maximally loading it in quiet standing; RMS-COP, difference between 1.0 and the ratio (paretic:nonparetic) of root mean square values for center of pressure (COP) for each limb in the anterior–posterior direction; n/a, not applicable.
Also included are the numbers of individuals classified as improved, worse, or no change with respect to minimal detectable change (velocity, 21 BBS 26 ) or minimally clinically meaningful change (COVS 27 ). An asterisk (*) indicates the discharge value is significantly different from the admission value. The Holm method was used to adjust for multiple comparisons (adjusted level of significance is also listed) 24 .
The Number of Individuals Who Were Classified as Worse, No Change, or Improved at Discharge by Comparing the Swing Time of a Compensatory Step With the Nonparetic Limb to a 95% Confidence Interval for Healthy Adults.
Relationships Between Changes in Spatiotemporal Gait Symmetry and Changes in Measures of Functional Balance and Mobility and Motor Impairment
There was a significant positive association between change in swing symmetry and change in %BWstand (rs =0.36, P = .002; Figure 1). There was a significant negative association between change in step symmetry and change in velocity (rs = −0.42, P = .0003; Figure 1). Of note, although the relationship between step symmetry and velocity appears to be driven by 2 outliers, when these were removed and the analysis rerun, the relationship remained significant.
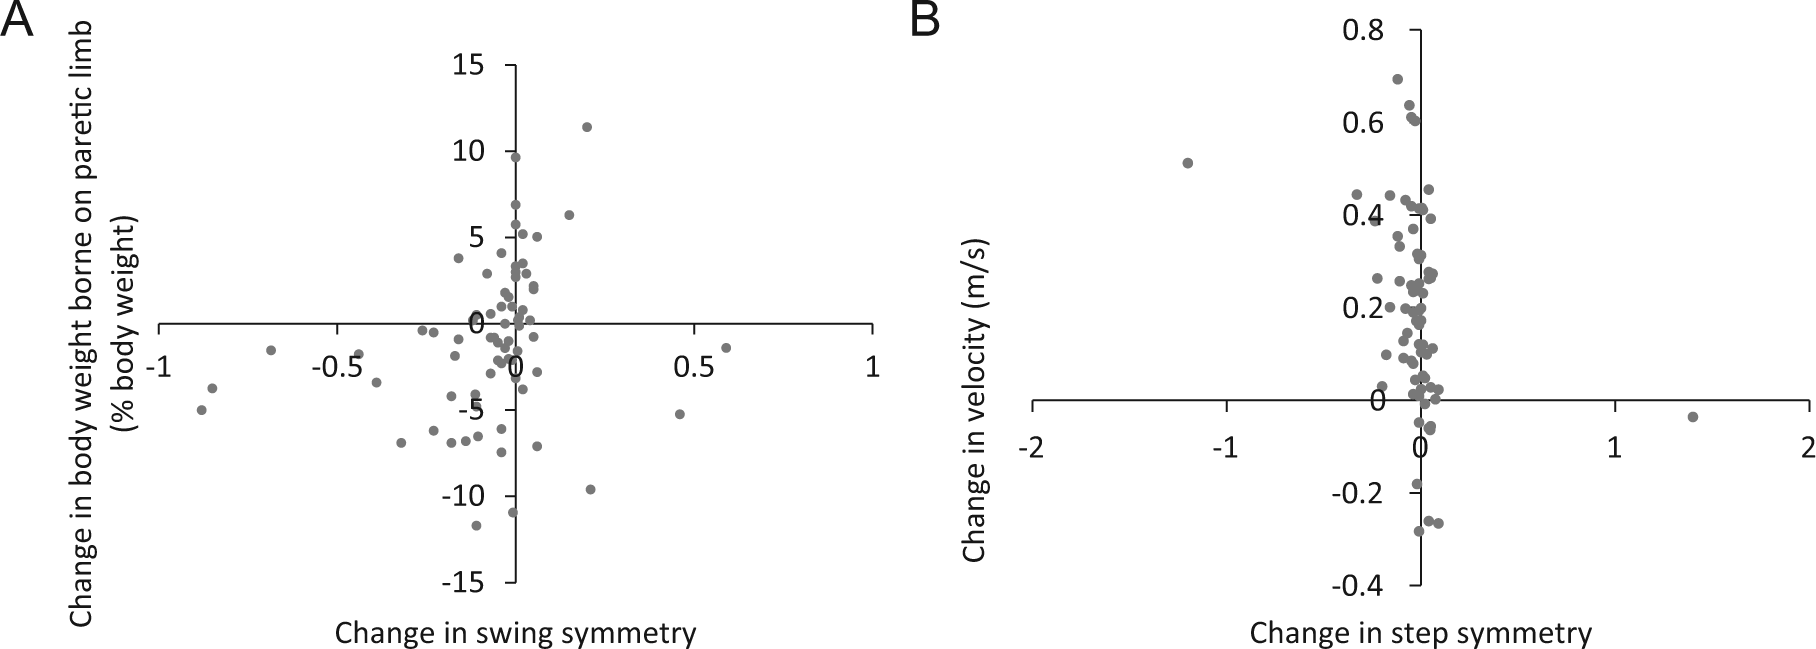
Associations between changes from admission to discharge in (A) swing symmetry and percentage of body weight borne on the paretic limb in quiet standing (rs = 0.3, P = .002) and (B) step symmetry and velocity (rs = −0.42, P = .0003). Negative values for changes in swing and step symmetry indicate symmetry ratios that were smaller at discharge (improved) and positive values indicate ratios larger at discharge (worse). Negative values for changes in body weight borne on the paretic limb indicate greater weight bearing at discharge (improved) and positive values indicate less weight bearing (worse). Negative values for changes in velocity indicate slower walking at discharge (worse) and positive values indicate faster walking at discharge (improved).
Differences in Functional Outcome and Measures of Balance and Motor Impairment Across Symmetry Change Groups
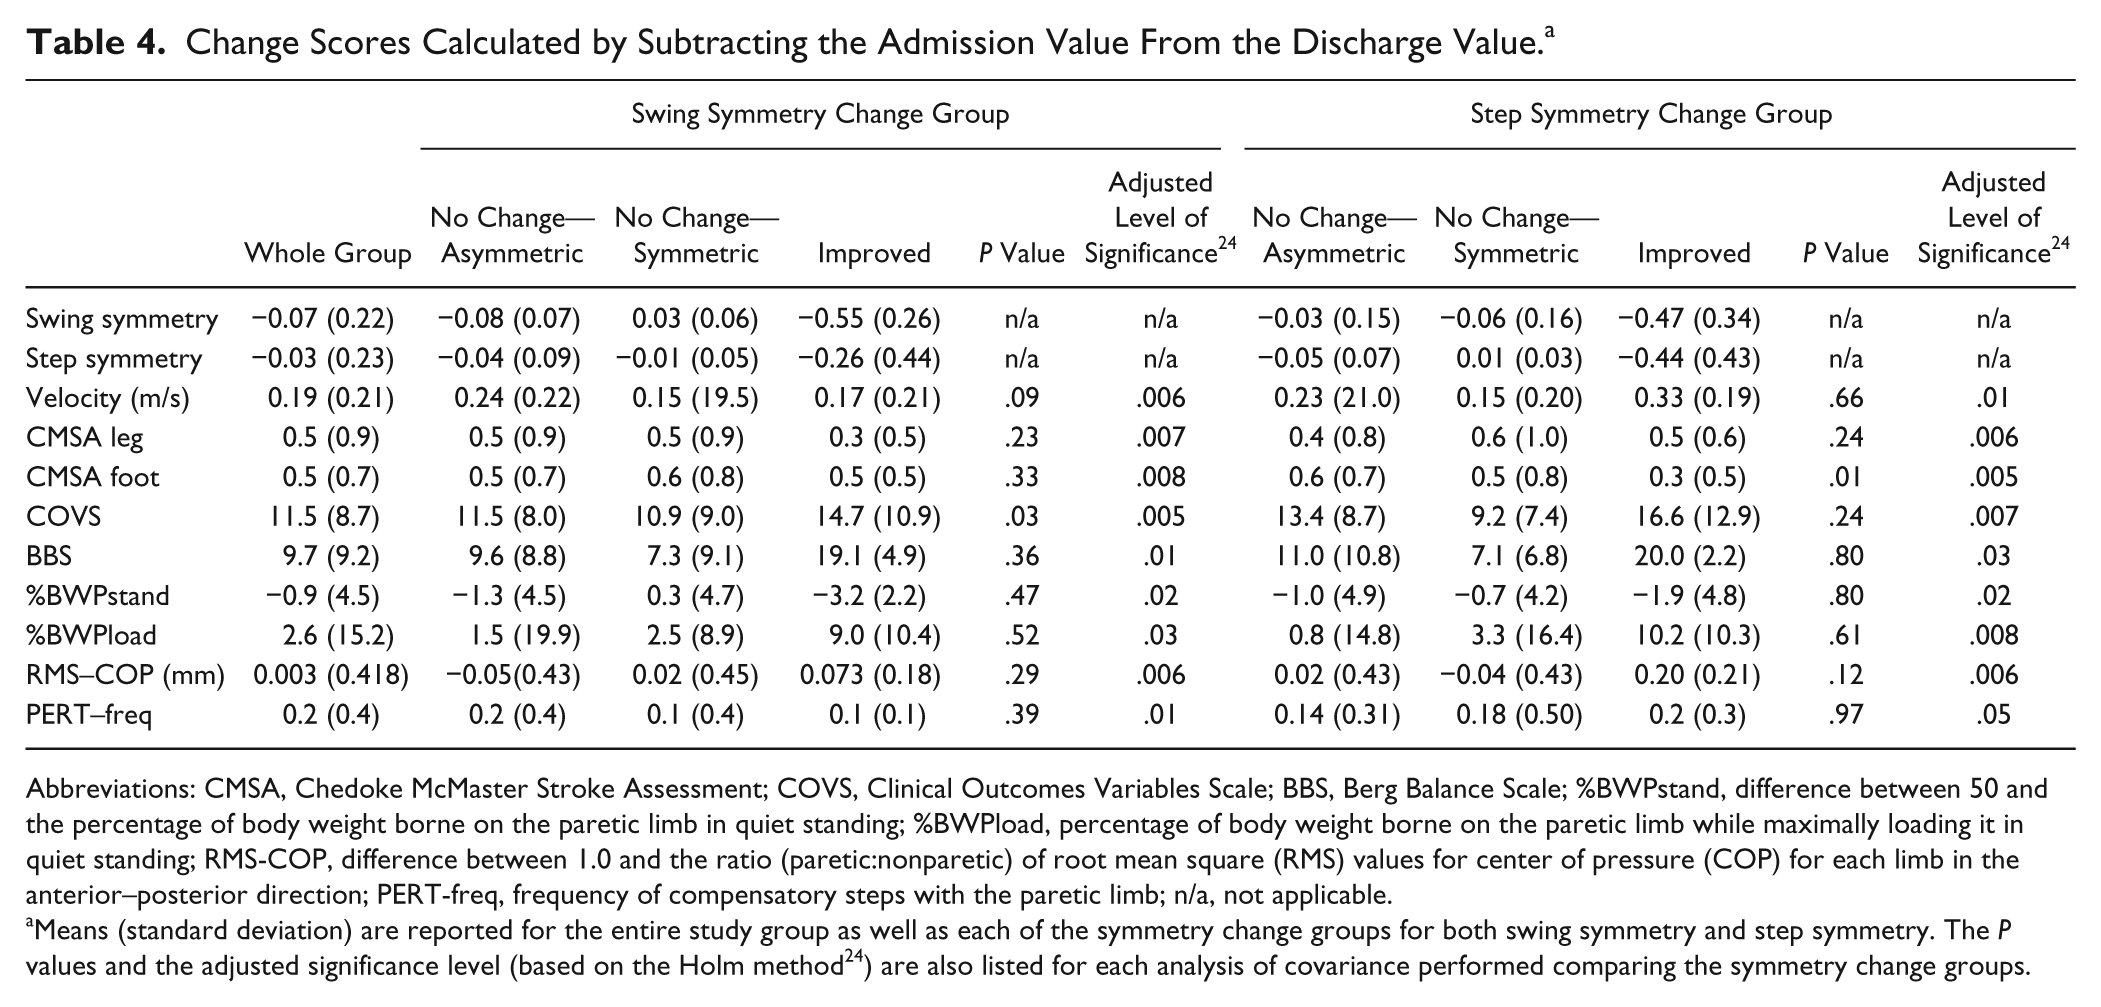
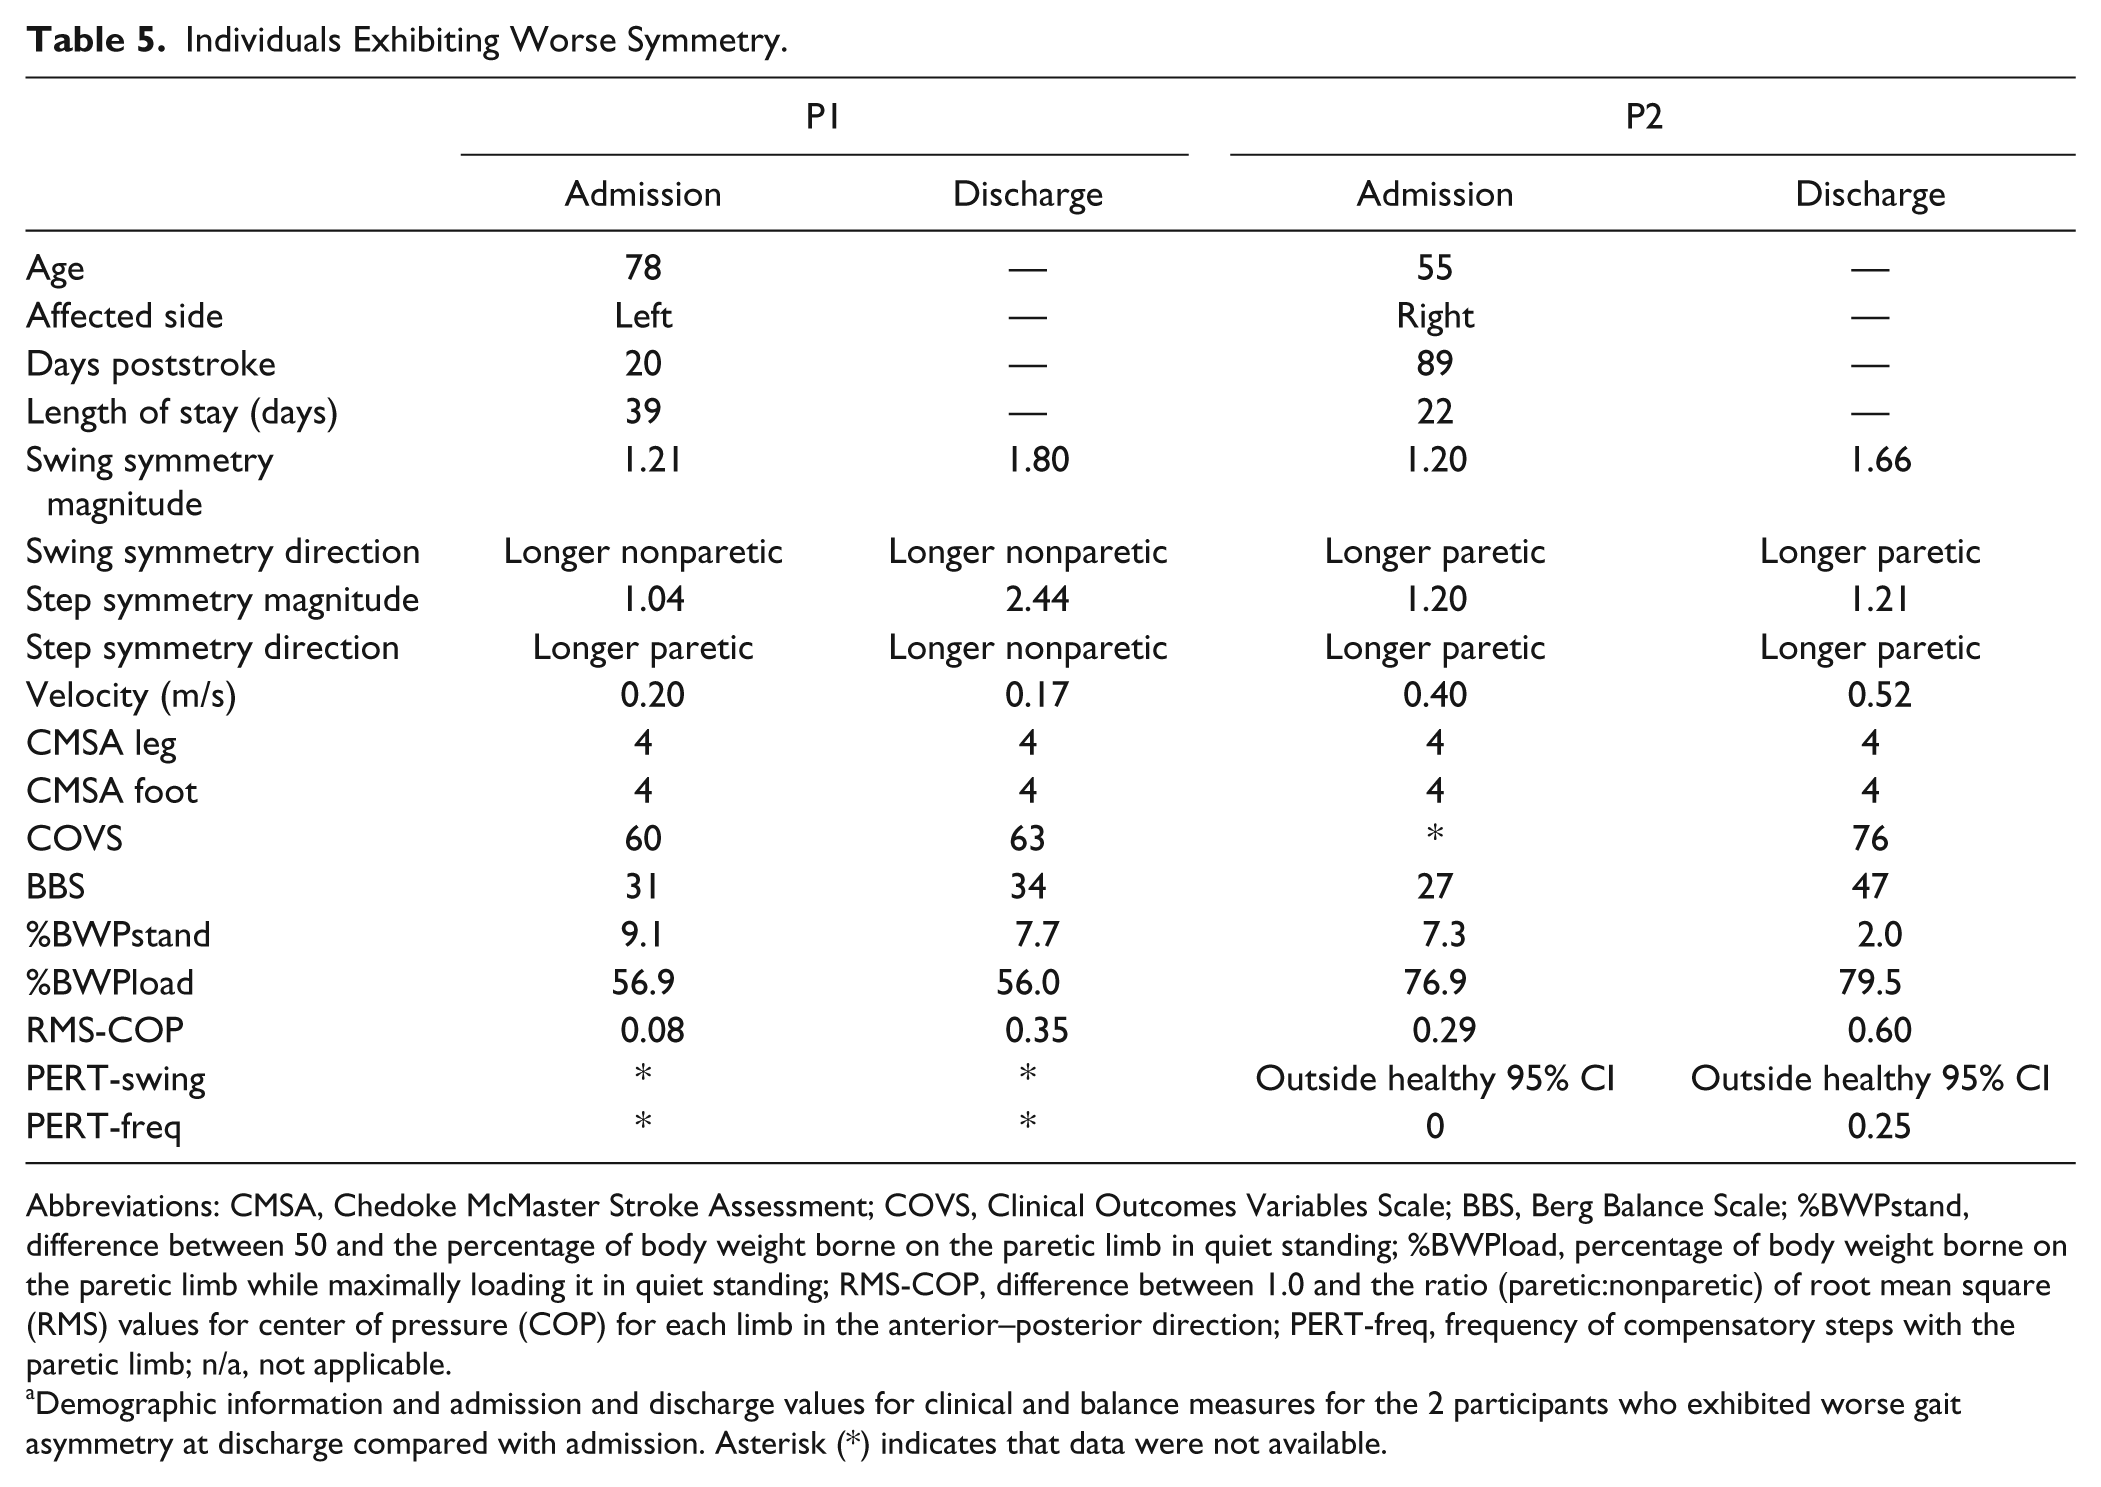
The mean change scores stratified by swing and step symmetry change groups are summarized in Table 4. Only 2 individuals exhibited worse swing/step symmetry at discharge. These individuals were treated as outliers and excluded from subsequent analyses. The characteristics of these individuals are outlined in Table 5. Age, length of stay, and time poststroke were not significantly different across the swing and step symmetry change groups (no change-s, no change-a, improved). There was no significant difference across the swing or step symmetry groups for any change score when the admission value was used as a covariate.
Change Scores Calculated by Subtracting the Admission Value From the Discharge Value. a
Abbreviations: CMSA, Chedoke McMaster Stroke Assessment; COVS, Clinical Outcomes Variables Scale; BBS, Berg Balance Scale; %BWPstand, difference between 50 and the percentage of body weight borne on the paretic limb in quiet standing; %BWPload, percentage of body weight borne on the paretic limb while maximally loading it in quiet standing; RMS-COP, difference between 1.0 and the ratio (paretic:nonparetic) of root mean square (RMS) values for center of pressure (COP) for each limb in the anterior–posterior direction; PERT-freq, frequency of compensatory steps with the paretic limb; n/a, not applicable.
Means (standard deviation) are reported for the entire study group as well as each of the symmetry change groups for both swing symmetry and step symmetry. The P values and the adjusted significance level (based on the Holm method 24 ) are also listed for each analysis of covariance performed comparing the symmetry change groups.
Individuals Exhibiting Worse Symmetry.
Abbreviations: CMSA, Chedoke McMaster Stroke Assessment; COVS, Clinical Outcomes Variables Scale; BBS, Berg Balance Scale; %BWPstand, difference between 50 and the percentage of body weight borne on the paretic limb in quiet standing; %BWPload, percentage of body weight borne on the paretic limb while maximally loading it in quiet standing; RMS-COP, difference between 1.0 and the ratio (paretic:nonparetic) of root mean square (RMS) values for center of pressure (COP) for each limb in the anterior–posterior direction; PERT-freq, frequency of compensatory steps with the paretic limb; n/a, not applicable.
Demographic information and admission and discharge values for clinical and balance measures for the 2 participants who exhibited worse gait asymmetry at discharge compared with admission. Asterisk (*) indicates that data were not available.
Discussion
The main finding of the present study is that the majority of individuals with spatiotemporal gait asymmetry at admission to stroke rehabilitation do not significantly improve the magnitude of asymmetry or exhibit a change in the direction of asymmetry by discharge. This persisting spatiotemporal gait asymmetry placed these individuals at risk for potential negative consequences, such as loss of bone mineral density of the paretic lower limb, musculoskeletal injury in the nonparetic limb, compromised postural control, and gait inefficiencies.3,5,6
This absence of change in spatiotemporal gait asymmetry occurred despite reports that a considerable amount of rehabilitation time is devoted to gait. 27 It is noteworthy that physiotherapists for the current patient sample received an admission assessment report identifying the magnitude of spatiotemporal gait asymmetry for each patient, which may have guided clinical decision making. However, the results of the present study suggest 2 possible scenarios regarding the rehabilitation interventions received by the majority of individuals in this study since spatiotemporal gait asymmetry was not significantly affected. First, any focused attempts to address asymmetry were collectively unsuccessful or second, and more likely, focus was directed to other gait features related to overall function such as forward progression, level of independence and safety (contrary to the assertion gait asymmetry is a significant clinical focus 4 ) and thus these are the features that improve with rehabilitation.
In contrast to the absence of longitudinal spatiotemporal gait asymmetry changes, individuals generally improved in gait velocity, lower limb motor impairment, functional balance and mobility (measured by BBS and COVS), and use of the paretic limb to initiate compensatory steps. Given these improvements, an opposing argument could be made that there is sufficient recovery of gait and balance function and thus symmetrical walking is not an appropriate rehabilitation goal. Furthermore, it has been proposed that given the asymmetrical nature of the stroke-related sensorimotor deficits, perhaps symmetrical gait is not achievable particularly in the chronic stage. 28 In contrast, we feel it should be emphasized that absence of spatiotemporal gait asymmetry changes with current practice does not imply it is unworthy of clinical attention. Given the potential long-term consequences of persisting asymmetry and possible worsening over time in the chronic stage10,11, it is undoubtedly an important issue. The lack of significant spatiotemporal gait asymmetry changes simply highlights the need for developing new, clinically feasible interventions specific to asymmetry. Interventions that target the underlying causes of spatiotemporal gait asymmetry (which are yet to be determined) will likely have more success. Such interventions may need to include some form of feedback about the symmetry of a patient’s gait. 29 In addition, efforts could be made to move promising novel interventions such as split-belt treadmill training 8 into clinical practice.
The present correlational analyses revealed only 2 significant relationships between changes in spatiotemporal gait asymmetry and changes in other measures of gait and balance. In the present study, improvement in swing symmetry was associated with increased paretic limb weight bearing in standing and improvement in step symmetry was associated with improvement in velocity. This coincides with results from previous cross-sectional studies demonstrating relationships between temporal symmetry and symmetry in ground reaction forces in standing 14 and between step symmetry and velocity.21,30 However, interpretation of these relationships in the present work is complicated by the lack of overall within-subject change in paretic weightbearing from admission to discharge and the lack of significant differences in change scores for paretic limb weightbearing, velocity, or in fact any other variable between the improved and no change symmetry groups.
Given the lack of significant associations in the current longitudinal analysis, explicitly focused on the inpatient rehabilitation period, this work raises doubt about the proposed causal relationships between spatiotemporal gait asymmetry and either motor impairment or symmetry of balance control (RMS-COP), revealed in cross-sectional studies.3,14 It is possible that the composite clinical measures of balance and motor control (such as BBS and CMSA) may not isolate specific aspects of impairment linked to spatiotemporal gait asymmetry. Alternatively, a singular index of asymmetry may not account for potential subcategories of underlying causes that may arise from different types of stroke-related impairments. Finally, factors other than motor and balance impairment may influence spatiotemporal gait asymmetry (eg, learned compensatory strategies to achieve functional outcomes).
Two individuals in the current study exhibited worse asymmetry at discharge. Both of these individuals exhibited worse gait velocity, CMSA, COVS, and BBS scores on admission compared with the remaining group. However, one individual was younger and had a shorter length of stay, whereas the other was older and had a longer length of stay compared with the rest of the group. The second individual exhibited improvements in balance while the first individual exhibited no such changes and her chart revealed several falls during her inpatient rehabilitation stay. Interestingly, this individual was one of two individuals who changed direction in step asymmetry. The direction of step length asymmetry is related to the propulsive forces generated during gait and Balasubramanian et al 30 have described propulsive force profiles based on the direction of step asymmetry. In accordance with this relationship, it could be extrapolated that this individual changed from generating more propulsive force with the nonparetic leg at admission to proportionally more force generated with the paretic limb, but at a much reduced overall magnitude at discharge. However, it is unclear if change in propulsive force is directly related to the change in asymmetry magnitude since another individual in the improved step symmetry change group exhibited the same change in direction of step asymmetry. Future work should investigate severity of impairments at admission and adverse events during rehabilitation as factors related to a decline in spatiotemporal gait symmetry.
One limitation of the current study is that a detailed record of physiotherapy treatment received by each patient is not available. However, it is possible to give a general description of the inpatient rehabilitation program to which all individuals included in the current study were admitted. The stroke rehabilitation program, which at the time of publication had 23 beds, is located in a large urban rehabilitation hospital. The program is staffed with 3 full-time physiotherapists with clinical experience ranging from 14 to 25 years. Each physiotherapist carries a case load of 7 to 8 patients, who receive one-on-one physiotherapy sessions (45- to 60-minute duration) 5 days per week. It is likely both the overall therapeutic approach and specific gait interventions varied widely since stroke rehabilitation is heterogeneous. 31 Therefore, we cannot say if the few individuals who exhibited improved spatiotemporal gait symmetry (7 improved in swing symmetry, 5 improved in step symmetry) received different interventions than the remaining group. Similarly, we do not know how much walking individuals performed through the day. Stroke rehabilitation inpatients walk with greater asymmetry outside of therapy time. 32 This “practice” of walking in everyday activity may reinforce asymmetric patterns making symmetrical gait more difficult to restore during active rehabilitation periods. What remains unknown is whether the asymmetric pattern of everyday walking activity is under conscious control and if so, why an individual would “choose” to walk asymmetrically. Furthermore, our results may only apply to higher functioning individuals with stroke since those individuals who required an aid for the overground gait assessment or could not complete a gait assessment on admission were excluded from the analysis. Finally, although our study is a retrospective design, this may not be a significant limitation since the gait and balance variables of interest extracted from the chart were measured in the on-site clinical laboratory with standardized protocols.
In conclusion, a large percentage of individuals present to inpatient stroke rehabilitation with swing time and step length gait asymmetry. Despite significant gains in velocity, motor control and some aspects of quiet standing and reactive balance control, few of these individuals significantly improved gait asymmetry by discharge. Further work is needed to determine factors contributing to gait asymmetry and to develop new rehabilitation interventions that specifically target this important poststroke gait impairment.
Footnotes
Authors’ Note
The views in this publication are those of the grantees and do not necessarily reflect those of the funding agencies.
Declaration of Conflicting Interests
The author(s) declared no potential conflicts of interest with respect to the research, authorship, and/or publication of this article.
Funding
The author(s) disclosed receipt of the following financial support for the research, authorship, and/or publication of this article: This study was supported by the Heart and Stroke Foundation Centre for Stroke Recovery, the Canadian Institutes of Health Research and the Toronto Rehabilitation Institute. Equipment and space have been funded with grants from the Canada Foundation for Innovation, Ontario Innovation Trust and the Ministry of Research and Innovation. Elizabeth Inness is supported by the Canadian Institutes of Health Research. Kara Patterson is supported by a Focus on Stroke personnel award from the Heart and Stroke Foundation of Canada and the Canadian Stroke Network.