
Abstract
The aim of this study is to evaluate the effects of the water-to-binder ratio and water-to-sand ratio on the structural properties of high-strength lightweight concrete. To this end, the tested properties included slump, water absorption, density, compressive strength, flexural strength, splitting tensile strength, and modulus of elasticity. Finally, the microscopic features of the concrete were observed by scanning electron microscopy (SEM). The results demonstrated that the compressive strength, flexural strength, splitting tensile strength, modulus of elasticity, and high-strength lightweight concrete exhibited inverse relationships with increasing water-to-binder ratios and water-to-sand ratios. In addition, the splitting tensile strength exhibited a more pronounced sensitivity to changes in the aforementioned ratios than did the compressive strength. Microscopic analysis revealed that the incorporation of lightweight aggregate enhanced the mechanical properties at room temperature, conferring both lightweight and high-strength characteristics to the resulting material. Furthermore, on the basis of the aforementioned results, this study presents an effective method for predicting the strengths from water‒sand ratios (w/b and w/s). Additionally, the compressive strength can be optimized through the development of equations. The results of this research have the potential to facilitate the practical implementation of concrete in real-world pavement projects. In other words, the use of oil shale aggregate and clean recycled concrete aggregate for bridge decks resulted in savings of 368 tons of structural steel, 363 tons of suspension and cable, 2060 tons of bridge deck weight, and cost savings of US$320,000 in the pier‒pier portion of the bridge.
Keywords
Introduction
Lightweight concrete has a long history, dating back to the early Roman Empire. 1 However, the commercial production of lightweight aggregate (LWA) during the 19th and 20th centuries marked a shift in the construction industry.2,3 The specifications for lightweight aggregates (LWAs) can be found within international standards,4–7 varying among three categories of LWAs. These include LWA for use in structural lightweight concrete 5 ; LWA for applications in masonry lightweight concrete, such as ASTM C331M-17 6 ; and LWA for insulating concrete, such as ASTM C332-17. 7 The European standard DIN EN 13055 4 allows lightweight aggregate (LWA) to be used in lightweight concrete, but only mineral-origin LWAs are considered. LWA can be derived from natural sources, manufactured from natural materials, by industrial processes, or recycled from construction and demolition waste. ASTM standards cover two main categories of LWAs: those prepared through expansion, pelletization, and sintering and those made from natural materials. ASTM C330M-17a lists lightweight aggregate types, including coal or coke combustion products. 5 The literature provides extensive information on lightweight aggregate sources, features, and production processes, highlighting various sources and production methods.8–11
Since the 1990s, low-density concrete has offered advantages such as thermal and structural performance, fire resistance,12–15 and durability.16–20 Infra-lightweight concrete (ILC), 21 also known as warm concrete, 22 architectural lightweight concrete, 23 or ultralight concrete, 24 aims to fulfill structural provisions and heat retention specifications. Despite its technological advancements, ILC has not yet achieved standardization, requiring project-specific or technical approval. However, ILCs are commercially available.
On the other hand, the production of lightweight aggregate concrete (LWAC) and standard concrete relies heavily on mixing characteristics, such as the water-to-binder and water-to-sand ratios. Marble powder (MP) is a high-fineness mineral additive used in mortar and concrete, and experiments have demonstrated its impact on compressive and flexural strengths. A 10% replacement of sand with MP results in the highest compression resistance. 25 Lam and others studied the compressive strength, bending strength, shear strength, and modulus of resilience of concrete made with different water/lightweight waste aggregate ratios and a combination of EAF slag aggregate and fuel ash. 26 The W/C ratio positively affects both the compressive strength and setting time. 27 A study by Kim reported that the compressive strength of concrete reached 30 MPa and above on day 28 at a 15% water/cement ratio. 28 Vurst and others reported that increasing the water/powder ratio improved the robustness of a blend. The concrete mixing ratio has a variable influence on the compressive strength of concrete.29,30 However, there is a lack of research on the impact of water/cement ratios and water/sand percentages on the physical and mechanical features of concrete containing LWAs. This paper investigates the mechanical properties of lightweight aggregate concrete (LWAC) with various water-to-cement and water-to-sand ratios. The slump, density, water absorption, compression strength, bending strength, shear strength, and modulus of resilience were also examined, and the microstructure and element composition were analyzed via SEM and EDS. Therefore, the readers of the journal will find details on the effects of water-to-binder and water-to-sand ratios on the structural properties of high-strength lightweight aggregate concrete (LWAC) containing clean recycled aggregate, oil shale sand, carbon quantum dots (CQDs), graphite nanoparticles (GNPs), polycarboxylate superplasticizers (SPs), and coir fibers (CFs). The results demonstrate that incorporating CQDs, GNPs, and CFs improves the flexural strength, tensile strength, and Young’s modulus. The optimal mix ratio of 50% clean recycled concrete sand (LWAR) and 50% oil shale sand (LWAS), known as 50% LWAR and 50% LWAS, achieved the best performance. This research highlights the potential of LWAC for real-world applications, offering insights into optimizing concrete properties through innovative materials and mathematical modeling for sustainable construction.
Materials and methods
Materials
The results of chemical analysis of standard cement.

The mineral composition of the clinker for standard cement.

The principal properties of standard cement.

Some physical and mechanical properties of the LWAs used and their limits are outlined in ACI 213R-14 31 .

The European Committee for Standardization (CEN) has published two documents regulating the use of structural lightweight concrete (LC) in Europe: DIN EN 206 32 and DIN EN 1992-1-1. 33 These documents outline the minimum strength class requirements, including 8 MPa and 9 MPa compression stresses, and the LC12/13 strength class. Technical approval is required for LC70/77 and LC80/88 because of a lack of empirical evidence.
Preparation of lightweight aggregate concrete (LWAC)
Blend portions of the LWAC and natural aggregate concrete in kg/cubic meter.

To this end, the contents of the LWA, w/b, and w/s were altered in the coarse and medium-sized aggregate stacks, respectively. A total of 24 groups of LWAC were designed, comprising two different LWA sources (LWAR and LWAS) under three different water-to-binder ratios and nine different water-to-sand ratios. In Table 5, LWARC5%, LWARC10%, LWARC15%, LWARC20%, LWARC30%, and LWARC50% highlight the lightweight clean recycled concrete aggregate (LWARC). LWAS5%, LWAS10%, LWAS15%, LWAS20%, LWAS30%, and LWAS50% refer to lightweight oil shale sand concrete. The combinations LWARC5%+LWAS5%, LWARC10%+LWAS10%, LWARC15%+LWAS15%, LWARC20%+LWAS20%, LWARC30%+LWAS30%, and LWARC50%+LWAS50% indicate the integration of lightweight clean recycled concrete aggregate and lightweight oil shale sand concrete. Furthermore, LWARC50%+CQD2.5%+CF2%, LWARC50%+GNP2.5%+CF2%, LWAS50%+CQD2.5%+CF2%, LWAS50%+GNP2.5%+CF2%, LWARC50%+LWAS50%+CQD2.5%+CF2%, and LWARC50%+LWAS50%+GNP2.5%+CF2% represent either the lightweight clean recycled concrete aggregate or the lightweight oil shale sand concrete combined with CQD, GNP, and CF. The values following the letter LWAR, LWAS, CQD, GNP, and CF represent their contents. The control concrete group was composed of CEM I 52.5 N cement, natural course aggregate, natural fine aggregate, and drinkable water. This means that the control concrete group does not contain LWAR, LWAS, CQD, GNP, SP, or CF. Vibrating concrete is a frequently omitted step in the construction process that nonetheless plays a crucial role in achieving a high-quality final product. The process of concrete pouring and setting requires a certain degree of skill and knowledge, and there are numerous reasons why it is inadvisable to rush the vibration procedure. Consequently, both inner and outer vibrator techniques were employed in this work.
Carbon Quantum Dots (CQDs) and Graphene Nanoplatelets (GNPs) are highly sensitive to their dispersion within the cementitious mass as upon failure to disperse uniformly may agglomerate thus affecting the ultimate concrete mix. To obtain sufficient dispersion and exclude the risk of particles aggregation, a complex of well-regulated measures was used.
In order to disperse the GNPs and CQDs, the CQDs were dissolved in water and the particles were dispersed well prior to addition of the particles into the cementitious composition mixture. Ultrasonication was employed in order to increase the dispersion. A 30-min ultrasonic treatment at 60 Hz was applied to the CQDs that was more than enough to break any possible agglomerates. The ultrasonic process was performed in medium temperature of 30–40 C to avoid degradation of the nanoparticles. This was done to ensure that the CQDs are dispersed to a stable suspension in the solution before adding them into the cement mix.
In the same manner, ultrasonication combined with the surfactant was used to disperse GNPs. Polyvinyl alcohol (PVA) or sodium dodecyl sulfate (SDS) was added at 0.1% weight to further increase dispersion. The surfactant decreased the surface tension between the nanoparticles and the surrounding solution, decreasing the inclination of the GNPs to cluster. GNPs were ultrasonicated for 30 min at 40 kHz. This was to evenly stabilize the nanoparticles in the cementitious paste and eliminate the reaggregation opportunities. Outward dispersion was achieved after an extra 15 min of magnetic stirring to ensure homogeneity after sonication.
Special consideration was made to the optimization of the ultrasonication time to avoid agglomeration. It was found that the surfactants have a crucial role in stabilizing the dispersion and in suppressing agglomerate formation during remixing. Resulting in a well-mixed CQD and GNP suspension that could easily penetrate the concrete mix.
Based on the preliminary tests and previous literature, the specific concentration of 2NPs of 2.5% of CQDs and GNPs and coir fibers of 2% was selected, because these concentrations offered the best compromise between the improvement of the mechanical properties of the concrete and the workability of the mixture. The nanoparticles used agglomerated at concentrations exceeding 2.5, and this had adverse effects on the workability and performance of the concrete. Similarly, greater amount of coir fibers meant greater amount of brittle concrete, disabling its toughness. Previous trials and initial tests showed the 2% coir fibers had the best balance where the tensile strength could be increased without loss of material flexibility.
Lastly in order to achieve the homogeneous distribution of the nanomaterials the dispersed CQDs and GNPs were added to the cement paste using the mixing water. Dry cement and aggregates were then added to the water which contained the dispersed nanomaterials. Mechanical mixing was maintained for 10 min to help increase uniformity of distribution. This was done to ensure the nanoparticles were uniformly distributed in the mixture hence enabling the same performance in all test specimens. The microscopic examination of the cement paste material indicated that the CQDs and GNPs are uniformly distributed, which also ensured the quality of the concrete mix.
Methods
Slump
Figure 1 shows a fresh sample used in the slump test. The slump test demonstrates how adding LWAR, LWAS, CQD, GNP, SP, and CF mitigates undesirable side effects. Fresh samples used in the slump test: (a) LWARC5% and (b) LWARC50%+ CQD2.5%+CF2%.
The slump test measures the fluidity of a concrete mixture containing LWA, CQD, GNP, CF, and pure Portland cement, following ASTM C1611/C1611M-21. 34 For the slump test, the arithmetic mean of three samples was used to obtain the average value.
Apparent density
The apparent density is determined by measuring the density of the cylinder of the LWAC, which is employed in the strength experiment. Equation (1) is used to compute the apparent density of the LWAC
The apparent density, γ, is expressed in grams per cubic centimeter (g/cm3). The mass of the dry sample, md, is expressed in grams, whereas the volume of the dry sample, V, is expressed in cubic centimeters (cm3). The following figure displays the arithmetic average of the samples as the definitive apparent unit volume mass. 35 For the apparent density test, the arithmetic mean of three samples was used to obtain the average value.
Water absorption
This study aimed to determine the water absorption characteristics of a mortar under specific laboratory conditions. Figure 2 presents the samples used in the water absorption tests. Samples used in the water absorption test.
These conditions included a heating degree of 20 ± 3°C, a relative moisture content of 90 ± 5%, and an air velocity of less than 0.2 m/s. The experiment was conducted over 7 days using a humidity-controlled curing cabinet. The LWAC was mixed, cast, and immersed in the cabinet, with constant water levels maintained. After 7 days, the LWAC was removed, placed in a kiln, and weighed to determine its water absorption. Three samples were examined for each LWAC, and equation (2) was used to calculate their water absorption
Tensile split stress
Figure 3 shows the prepared samples and their tensile split stress test results. The shear stress test is an indirect method for determining the splitting tensile stress of concrete. The samples were prepared and subjected to tensile split stress tests.
The test can be carried out by horizontally placing a sample in a universal testing machine. One hundred 25 cylindrical specimens—150 mm × 300 mm, including varying percentages of the LWA, the CQD, GNP, and the CF—were tested to determine the shear stress, following the ASTM C496/C496M-17 standard rules. 36 For the splitting tensile stress test, the arithmetic mean of three samples was used to obtain the average value.
Flexural strength
Figure 4 shows a sample used in the flexural strength test and its fractured stance. The flexural strength was evaluated in accordance with the ASTM C293/C293M-16 standard.
37
The specimen in the flexural strength test and its fractured stance.
Prism steel molds with dimensions of 100 mm by 100 mm by 300 mm were employed for the determination of flexural strength. For the flexural strength test, the arithmetic mean of three samples was used to obtain the average value.
Compressive strength
Figure 5 presents the prepared samples and their compressive strength test results. The compressive stress of the cylinders was determined in accordance with the standards set forth in ASTM C39/C39M-18.
38
The samples were prepared, and their compressive strength was tested.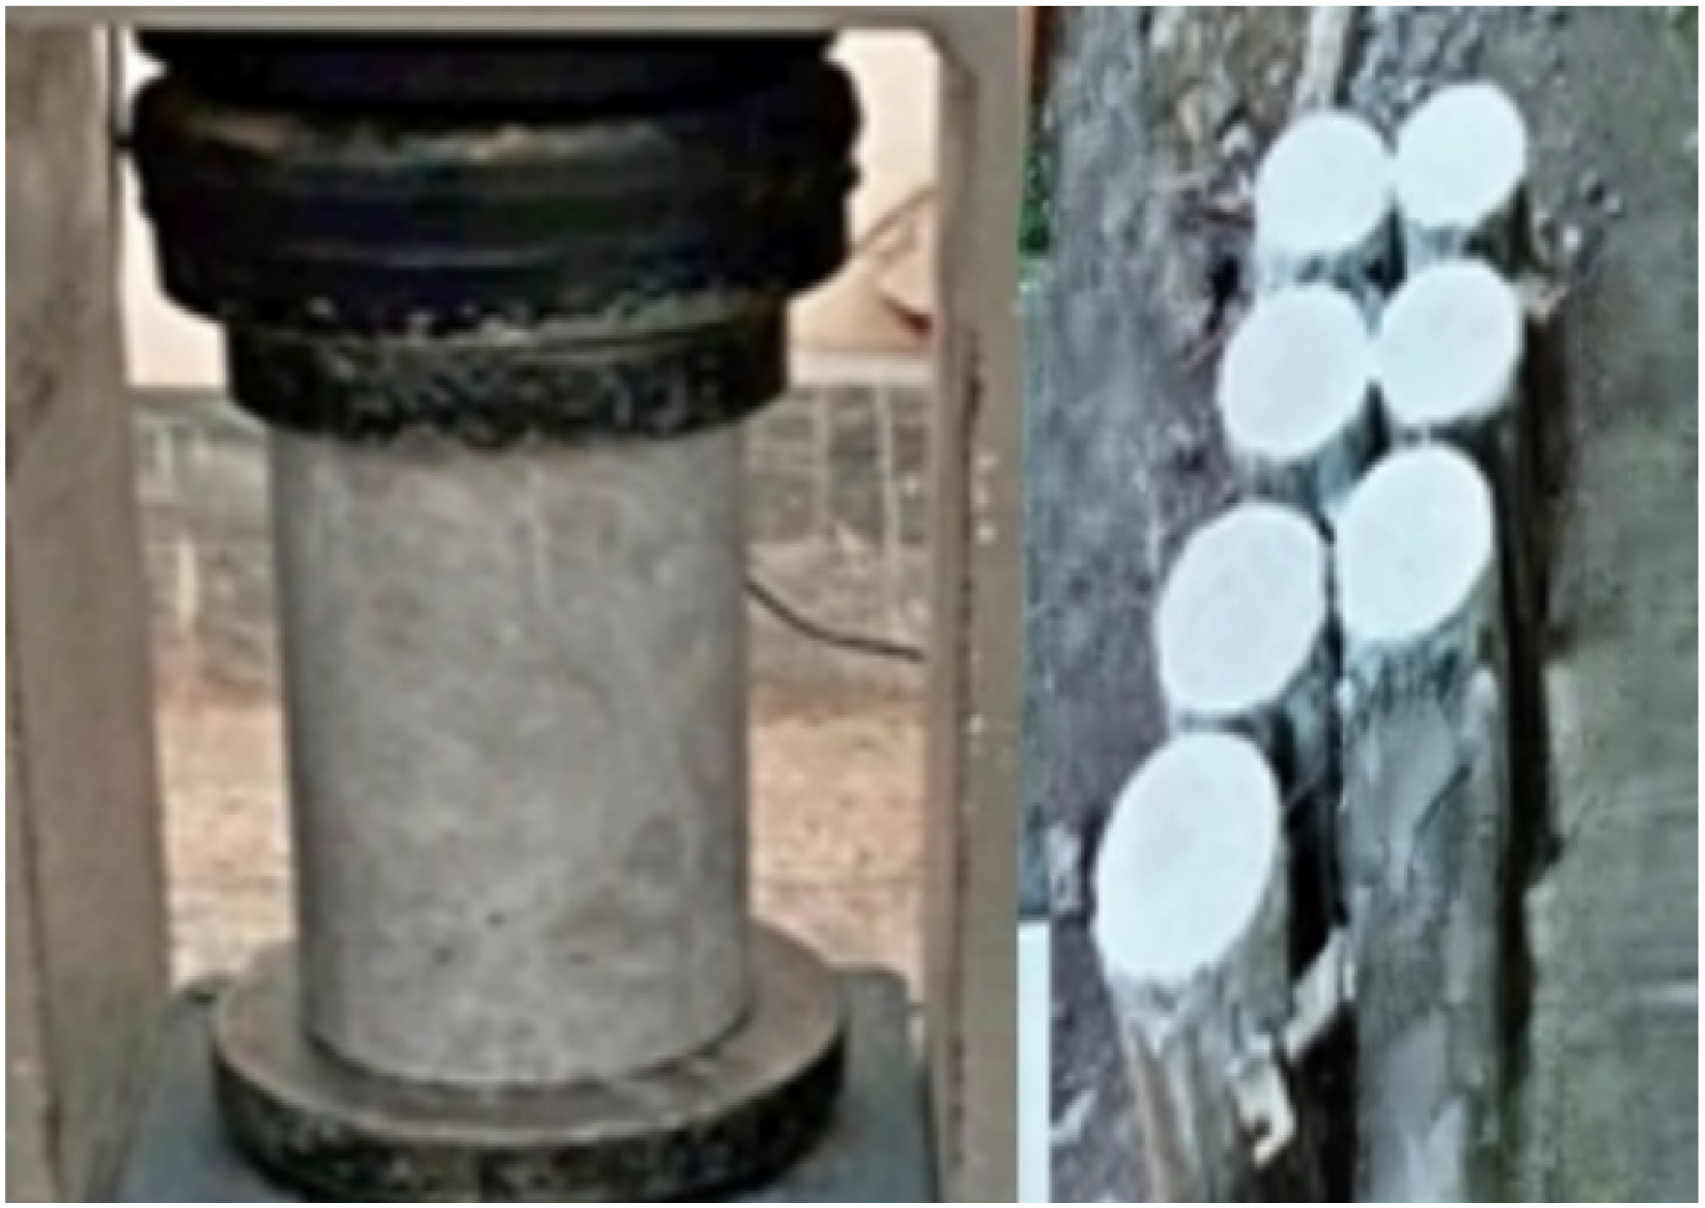
In this research, cylindrical steel molds with dimensions of 150 mm × 300 mm were utilized for the assessment of compression strength. For the compressive strength test, the arithmetic mean of three samples was used to obtain the average value.
Modulus of elasticity
Figure 6 shows the modulus of elasticity of each sample. The modulus of elasticity was quantified at the age of 90 days in accordance with ASTM C469/C469M-14.
39
The modulus of elasticity of a sample during the test.
The stress–strain relationship was obtained via the use of an LVDT. The modulus of elasticity is subsequently calculated on the basis of the relationship between the stress and the strain in the linear portion of the curve. For the modulus of elasticity test, the arithmetic mean of three samples was used to obtain the average value.
Microscopic analysis
To investigate the chemistry of the LWAC at 90 days, SEM was employed in accordance with the ASTM C1723-16 regulation norm. 40 To ascertain the chemistry of the LWAC, both the principles of Bragg’s law and the stipulations set out in the ASTM C1365-18 standard were employed. 41
Results and discussion
Slump
The relative slumps and types of concrete containing recycled concrete aggregate, oil shale aggregate, superplasticizer, CQD, GNP, and CF, which were made of various water-to-binder ratios and water-to-sand ratios, are shown in Figure 7. LWARC50% results in the highest slump, as anticipated. Therefore, the control concrete is regarded as the least workable material since it lacks any superplasticizer. The incorporation of oil shale sand with CQD and GNP diminishes the lateral formwork pressure of the concrete, as noted in the LWAC. The composite type of LWARC5% + LWAS5%, which included 5 wt. % clean recycled concrete aggregate and 5 wt. % oil shale sand, demonstrated the second smallest reduction in slump (Figure 7). Relative slumps and types of concrete containing recycled concrete aggregate, oil shale aggregate, superplasticizer, CQD, GNP, and CF, which were made of various water-to-binder ratios and water-to-sand ratios.
This may suggest that the slump level of the LWAC could be affected by the water requirements of the oil shale sand, potentially altering the water-to-cement ratio (w/c) in this mixture, which might reach a point that could impede optimal slump. The lower water demand of the CQDs and GNPs could account for the higher slump rate than that of the control concrete. After CQD and GNP are blended into LWAC, the average flow rate is 30.8% greater than that of the control concrete. Similar findings have been documented in the literature. For example, Berra et al. reported a similar effect regarding the negative influence of adding nanoparticles on the workability of ordinary Portland cement (OPC) pastes. The slump measurements for all four mixtures, both with and without graphene, surpassed 200 mm, exceeding the recommended slump values for OPC concrete. 42 In the study conducted by Chindaprasirt et al., the slight decrease in slump values due to the inclusion of graphene did not have a significant effect on the fresh state of the concrete. The proportions of the mixture for the concrete, whether it contained graphene or not, were considered suitable for producing the required samples for slump testing. There was no significant difference in the handling of the concrete, regardless of the presence of graphite-based carbon. 43 In addition, slumping is a crucial method in the construction industry for studying the workability behavior of concrete. 44 Concrete quality is assured from the initial, freshly mixed state, with the slump being the primary factor of concern. 45 The rheology of freshly mixed concrete is susceptible to various environmental influences, including temperature and humidity. The type, sequence, and duration of mixing also impact the rheological parameters. Large-scale workability testers are essential for freshly mixed concrete, 46 but they lack the precision and reliability of laboratory apparatuses. The first ASTM standard to include the slump test was established in 1922, and the subsequent ASTM C143/C143M-20 describes the standard method for conducting the slump test.46,47 In a typical slump test, two parameters are evaluated: the “slump” and the “spread.” Modern high-capacity mixes, especially those designed for slumps of approximately 200 mm, exhibit collapsing–slumping characteristics. The concept of the workability of concrete is subjective, but some papers categorize it into three types: qualitative (Class I), quantitative (Class II), and quantitative (Class III).46,48 The slump of LWAS is not similar to that of the control concrete. The control concrete has the lowest slump among the tested concrete samples. In contrast, the slump of the LWAS50% composite is the largest because it contains 1.46% cement (Table 5 and Figure 7). van der Waals bonds and electrostatics combine to form the particles of the slurry. 48 A flocculated cement particle suspension has a high viscosity, which decreases as the particle defulates. Thixotropy in concrete is due mainly to flocculation. In addition, stiffness, known as coagulation, may also affect the quasistatic response of the mixture in relation to the cementing application. The mold compression of self-consolidated cement-based material 49 and slip molds for paving are examples of this relationship. Indirect evidence of this relationship is also reported: both the pressure response to estimate the mold pressure and shape. The correct addition of marble powder and a small amount of nanographite to the cement, as this behavior is related to flocculation behavior similar to that of flocculation strength and flocculation size, can significantly reduce the lateral hydraulic pressure of the formwork, strength and flocculation size affected by nanoclay particles. 50
Apparent density
The relative apparent density, curing day in water, and types of concrete containing recycled concrete aggregates, oil shale aggregates, superplasticizers, CQD, GNP, and CF, which were made of various water-to-binder ratios and water-to-sand ratios, are illustrated in Figure 8, which is a key parameter for monitoring the fullness of the hardened LWAC. Compared with the control concrete, the LWARC50% sample presented the highest apparent density, and the LWAS5% sample presented the lowest apparent density (Figure 8). The incorporation of lightweight, clean recycled concrete aggregate increases the apparent density substantially. On the one hand, the concrete type LWAS5%, which included 5 wt. % oil shale sand, demonstrated the second smallest reduction in apparent density (Figure 8). In addition, LWAC provides compression stress and reduced thermal conductivity, making it suitable for various applications. LWAC is produced with gravel LWA and naturally derived sand and is used in bridges51–53 and offshore rigs.
17
Thienel presents a variety of LWAC constructions, with a focus on coarse LWAs and lightweight sand for additional thermal insulation. A more detailed analysis of compression resistance and packing density in LWAC can be found in relevant databases.54–56 Relative apparent density, curing days in water, and types of concrete containing recycled concrete aggregate, oil shale aggregate, superplasticizer, CQD, GNP, and CF, which were made of various water-to-binder ratios and water-to-sand ratios.
Figure 9 shows the relationships among the apparent density of LWACs from the water-to-sand ratio, math models, types of LWAC, and R2 values of the math models. As illustrated in Figure 9, a polynomial regression equation is employed to demonstrate the correlation between the W/S ratio and the apparent density of LWA concrete, which incorporates clean recycled aggregate, coarse aggregate, water, and superplasticizer. The R2 relationship degree is also provided in Figure 9, indicating favorable compatibility between the two specified properties. When R2 reaches a value of 1, the apparent density of LWACs can be estimated by adjusting the W/S ratio via the mathematical equation presented in Figure 9. This estimation can be made using at least one of the hardened LWA concrete samples. Relationships among the apparent density of LWACs from the water-to-sand ratio, math models, types of LWACs, and R2 values of the math models.
The figure entitled Apparent Density vs Water-to-Sand Ratio with Polynomial Regression shows the correlation between water to sand ratio (0.30–0.90) and apparent density (2300–2450 kg/m3) of four composite materials which are LWARC50, LWAS50, LWARC50\LWAS50 and LWARC50\LWAS50CQDCF. The regression curves have a steady downward slope with increase in water-sand ratio and this implies that water content causes low packing efficiency and high porosity. LWARC50LWAS50 blend gives the highest R2 (0.997), indicating the closest fit to the experimental data and the regression model. In contrast, LWARC50LWAS50CQDCF formulation has a greater apparent density at higher water-to-sand ratios, which implies that it can be optimized in fluid conditions. Descriptive statistics show density behavior is consistent across the materials and that the 95% confidence intervals of LWARC50 are between 2278.10 and 2395.04. No significant differences are found in ANOVA and Tukey HSD tests between the compositions and support the similarity in apparent density. Both apparent density can be perfectly predicted through the equation of the poly-regression of each composition, with R2 of 0.989, 0.985, 0.997, and 0.993, validating the significance of mix design in customizing material properties and the usefulness of poly-regression in maximizing composite materials.
Water absorption
The relative water absorption, curing day in water, and types of concrete containing recycled concrete aggregate, oil shale aggregate, superplasticizer, CQD, GNP, and CF, which are made of various water-to-binder ratios and water-to-sand ratios, are shown in Figure 10, which is another important parameter for the fullness of the hardened LWAC. The relative water absorption, curing day in water, and types of concrete containing recycled concrete aggregate, oil shale aggregate, superplasticizer, CQD, GNP, and CF, which were made of various water-to-binder ratios and water-to-sand ratios, were used.
Figure 10 shows a detailed discussion of the relative water absorption, curing day in water, and the concrete containing recycled concrete aggregate (RCA), oil shale aggregate, superplasticizer, carbon quantum dots (CQD), graphite nanoparticles (GNP), and coir fiber (CF) at different water-to-binder (w/b) and water-to-sand (w/s) ratio. The data indicates that the LWARC50%+LWAS50%+GNP2.5%+CF2% mixture has the lowest water absorption and in this respect is superior to the control concrete. Introduction of lightweight clean recycled concrete aggregate, lightweight oil shale sand, together with GNP and CF leads to extreme less water absorption, which increases the durability of the material. Surprisingly, the water absorption of LWARC10% even with 10 wt. % lightweight clean recycle concrete aggregate is similar to the control concrete. This implies that the water absorption capacity of the concrete is not affected by the recycled aggregates at small levels. Also, the values of water absorption in all the concrete samples in the study were much lower than that of the standard of NBR 9781 which limits the maximum water absorption to 5%. This observation shows the usefulness of the mix designs in attaining the preferred water absorption properties. The samples prepared using clean sand and gravel aggregates were characterized by the lowest ratios of water absorption which could be explained by the increased compactness of the concrete matrix. The LWAC samples of nonnaturally produced gravel aggregates were also in compliance with the standard requirement with the average water absorption rate not higher than 5%. On the other hand, the control concrete, prepared with natural sand and coarse recycled aggregates had a higher rate of water absorption as it had a higher index of void which highlights the effect of the type of aggregates used as well as the effect of aggregates on the water absorption within the concrete mix. Figure 11 shows a relationship for the projection of water absorption of LWACs from the water-to-sand ratio, math models, types of LWAC, and R2 values of the math models. A number of multinomial regression models for the projection of the sorption of LWACs from the water-to-sand ratio, math models, types of LWAC, and R2 values of the math models.
The figure below, known as Water Absorption vs Water-to-Sand Ratio with Polynomial Regression, presents an in-depth look at the variation in water absorption with a change in the water-sand ratio of a number of composite materials. The x-axis indicates water-to-sand ratios, which lie between 0.30 and 0.90 where water absorption percentages lie between 0.1% and above 1.2 on the y-axis. The graph compares five different material compositions, that is, LWARC50, LWAS50, LWARC50 LWAS50 CQD, LWARC50 LWAS50 CF, that is, LWARC50, LWAS50, LWARC50 LWAS50, LWARC50 LWAS50, LWARC50 LWAS50 CQD, and LWARC50 LWAS50 CQD CF, corresponding to the data points and the corresponding The R2 values of these compositions are 0.986, 0.985, 0.988, 0.995, and 0.990, which are high model fits and strong predictive accuracy.
Regression trends indicate a positive value in terms of water absorption as the ratio of water to sand increases which is to be expected since the porosity and capillary action of the sand is expected to increase as the water content does. LWARC50LWAS50CQD has the largest R2 (0.995) suggesting a very small difference between the observed and predicted values, which points to the stabilization property of CQD additives on absorption behavior. On the other hand, it can be seen that the LWARC50LWAS50CQD CF formulation exhibits a lower absorption rate at higher water to sand ratio, indicating that the co-existence of CQD and CF plays a role in decreasing the permeability and in densifying the material.
The graph highlights the significance of mix design in maximization of water absorption properties on engineered composites. Through the application of the concept of the use of polymorphic regression, material properties can be predicted and optimized, which can be utilized well to improve the construction and material sciences in terms of durability and performance. Moreover, the statistical analysis, descriptive statistics, and ANOVA indicate that there are no significant differences between the materials in terms of water absorption and the fact that Tukey HSD post-hoc tests have verified that the compositions are similar is also proven. The derived polynomial equations of each of these compositions are a strong basis of predicting water absorption in diverse condition, as they show the usefulness of these models in the optimization of materials.
Splitting tensile strength
The relative splitting tensile strength, curing day in water, and types of concrete containing recycled concrete aggregate, oil shale aggregate, superplasticizer, CQD, GNP, and CF, which were made of various water-to-binder ratios and water-to-sand ratios, are shown in Figure 12 to monitor the shear stress gain in the LWAC. LWARC50% + CQD2.5%+CF2% results in the greatest splitting tensile strength. The lowest splitting tensile strength is observed in the control concrete (Figure 12). Furthermore, the improvement in shear strength due to the addition of CQD can be attributed to the densification of the internal structure of alkali-activated concrete. The relative splitting tensile strength, curing day in water, and types of concrete containing recycled concrete aggregate, oil shale aggregate, superplasticizer, CQD, GNP, and CF, which were made of various water-to-binder ratios and water-to-sand ratios, were used.
The nanoscale size and high aspect ratio of CQDs enable the effective filling of voids. As a result, the internal framework became more compact with the addition of graphene.
57
The maximum shear strength was recorded with mixed LWAC, which included 0.5% graphene, in relation to the weight of the aluminosilicate materials. Importantly, shear strength is directly related to the compressive strength of concrete.
58
Moreover, the physical and chemical reinforcement offered by graphene, which enhances the compressive strength of concrete, likely contributes significantly to the improvement in the high splitting tensile strength of alkali-activated concrete. A literature review revealed that recycled concrete with recycled aggregate and recycled aggregate pavement does not exceed 2 MPa at 28 days. The studies revealed a 56% decline in shear stress and a 52% reduction with 100% RAP. The ratio of shear stress to compression stress ranges from 8 to 14% for normal concrete.59–61 Figure 13 shows a relationship for the projection of the splitting tensile strength of LWACs from the water-to-sand ratio, math models, types of LWAC, and R2 values of the math models. Relationships among the projection of the splitting tensile strength of LWACs from the water-to-sand ratio, math models, types of LWAC, and R2 values of the math models.
The graphs of splitting tensile strength vs water-to-sand ratio with Polynomial Regression (Splitting Tensile Strength vs Water-to-Sand Ratio with Polynomial Regression) compare the relationships between water-sand ratio and splitting tensile strength of three core composite materials (LWARC90, LWAS50, and LWARC90_LWAS50), and variants of these materials with CQD and CF additives. The x-axis covers 0.30 to 0.90 water-sand ratio, and the y-axis displays the splitting tensile strength of 4.5 MPa to 12.5 MPa. Strong model fits of all the compositions are reflected in the strong model fit as demonstrated by the R2 values of 0.989 to 0.997. The regression curves have a consistent negative slope indicating decreasing tensile strength as the ratio of water to sand increases indicating the weakening of cohesion with increasing porosity. Nevertheless, CQD and CF additions yield better tensile strength retention properties, implying that the additives can counter the strength degradation at increased water levels. Descriptive statistics indicate a mean tensile force of LWARC90 equals 8.93 MPa, and the 95% interval is [6.41, 11.46]. Tests of ANOVA and Tukey HSD reveal that there are no meaningful differences among the compositions, which strengthens their performance similarity. Polynomial equations representing the compositions of each of the two compositions give predictive models of the tensile strength and show that CQD and CF additives can be successfully used to improve the performance of materials under different conditions and provide useful information to optimize the material in the case of structural engineering.
Flexural strength
The relative flexural strength, curing day in water, and types of concrete containing recycled concrete aggregate, oil shale aggregate, superplasticizer, CQD, GNP, and CF, which were made of various water-to-binder ratios and water-to-sand ratios, are shown in Figure 14 to monitor the flexural strength gain in the LWAC. The LWARC50% + CQD2.5% + CF2% mixture results in the greatest flexural strength. The lowest flexural strength is observed in the control concrete (Figure 14). Furthermore, the reduction in water absorption may have led to a rise in flexural strength. Relative flexural strength, curing time in water, and types of concrete containing recycled concrete aggregate, oil shale aggregate, superplasticizer, CQD, GNP, and CF, which were made of various water-to-binder ratios and water-to-sand ratios.
For example, despite the SP/binder ratio of the LWARC50% + CQD2.5% + CF2% mixture being 0.023, it has the highest flexural strength of 11.8 (MPa) at 730 days, whereas the reference concrete beam has an average increase of approximately 45.6%. In addition, comparable results regarding the limited influence of graphene nanoplatelets were reported by Sajjad et al. They noted that the flexural strength of mortar beams made with a 1:1 blend of FA and GGBS consistently hovered at approximately 7 MPa, irrespective of the amount of GNPs used (Figure 15). This result was linked to the erratic arrangement of the GNPs in the mixture, which might not have successfully bridged or strengthened the cracks that emerged during the testing process.
62
Additionally, Nepomuceno & Isidoro reported that the mechanical properties of concrete decrease with increasing LWA substitution rate, with the compression strength, bending strength, and shear stress decreasing by 11.1%, 5.8%, and 22.2%, respectively.
63
A number of multinomial regression models for the projection of the flexural strength of LWACs from the water-to-sand ratio, math models, types of LWAC, and R2 values of the math models.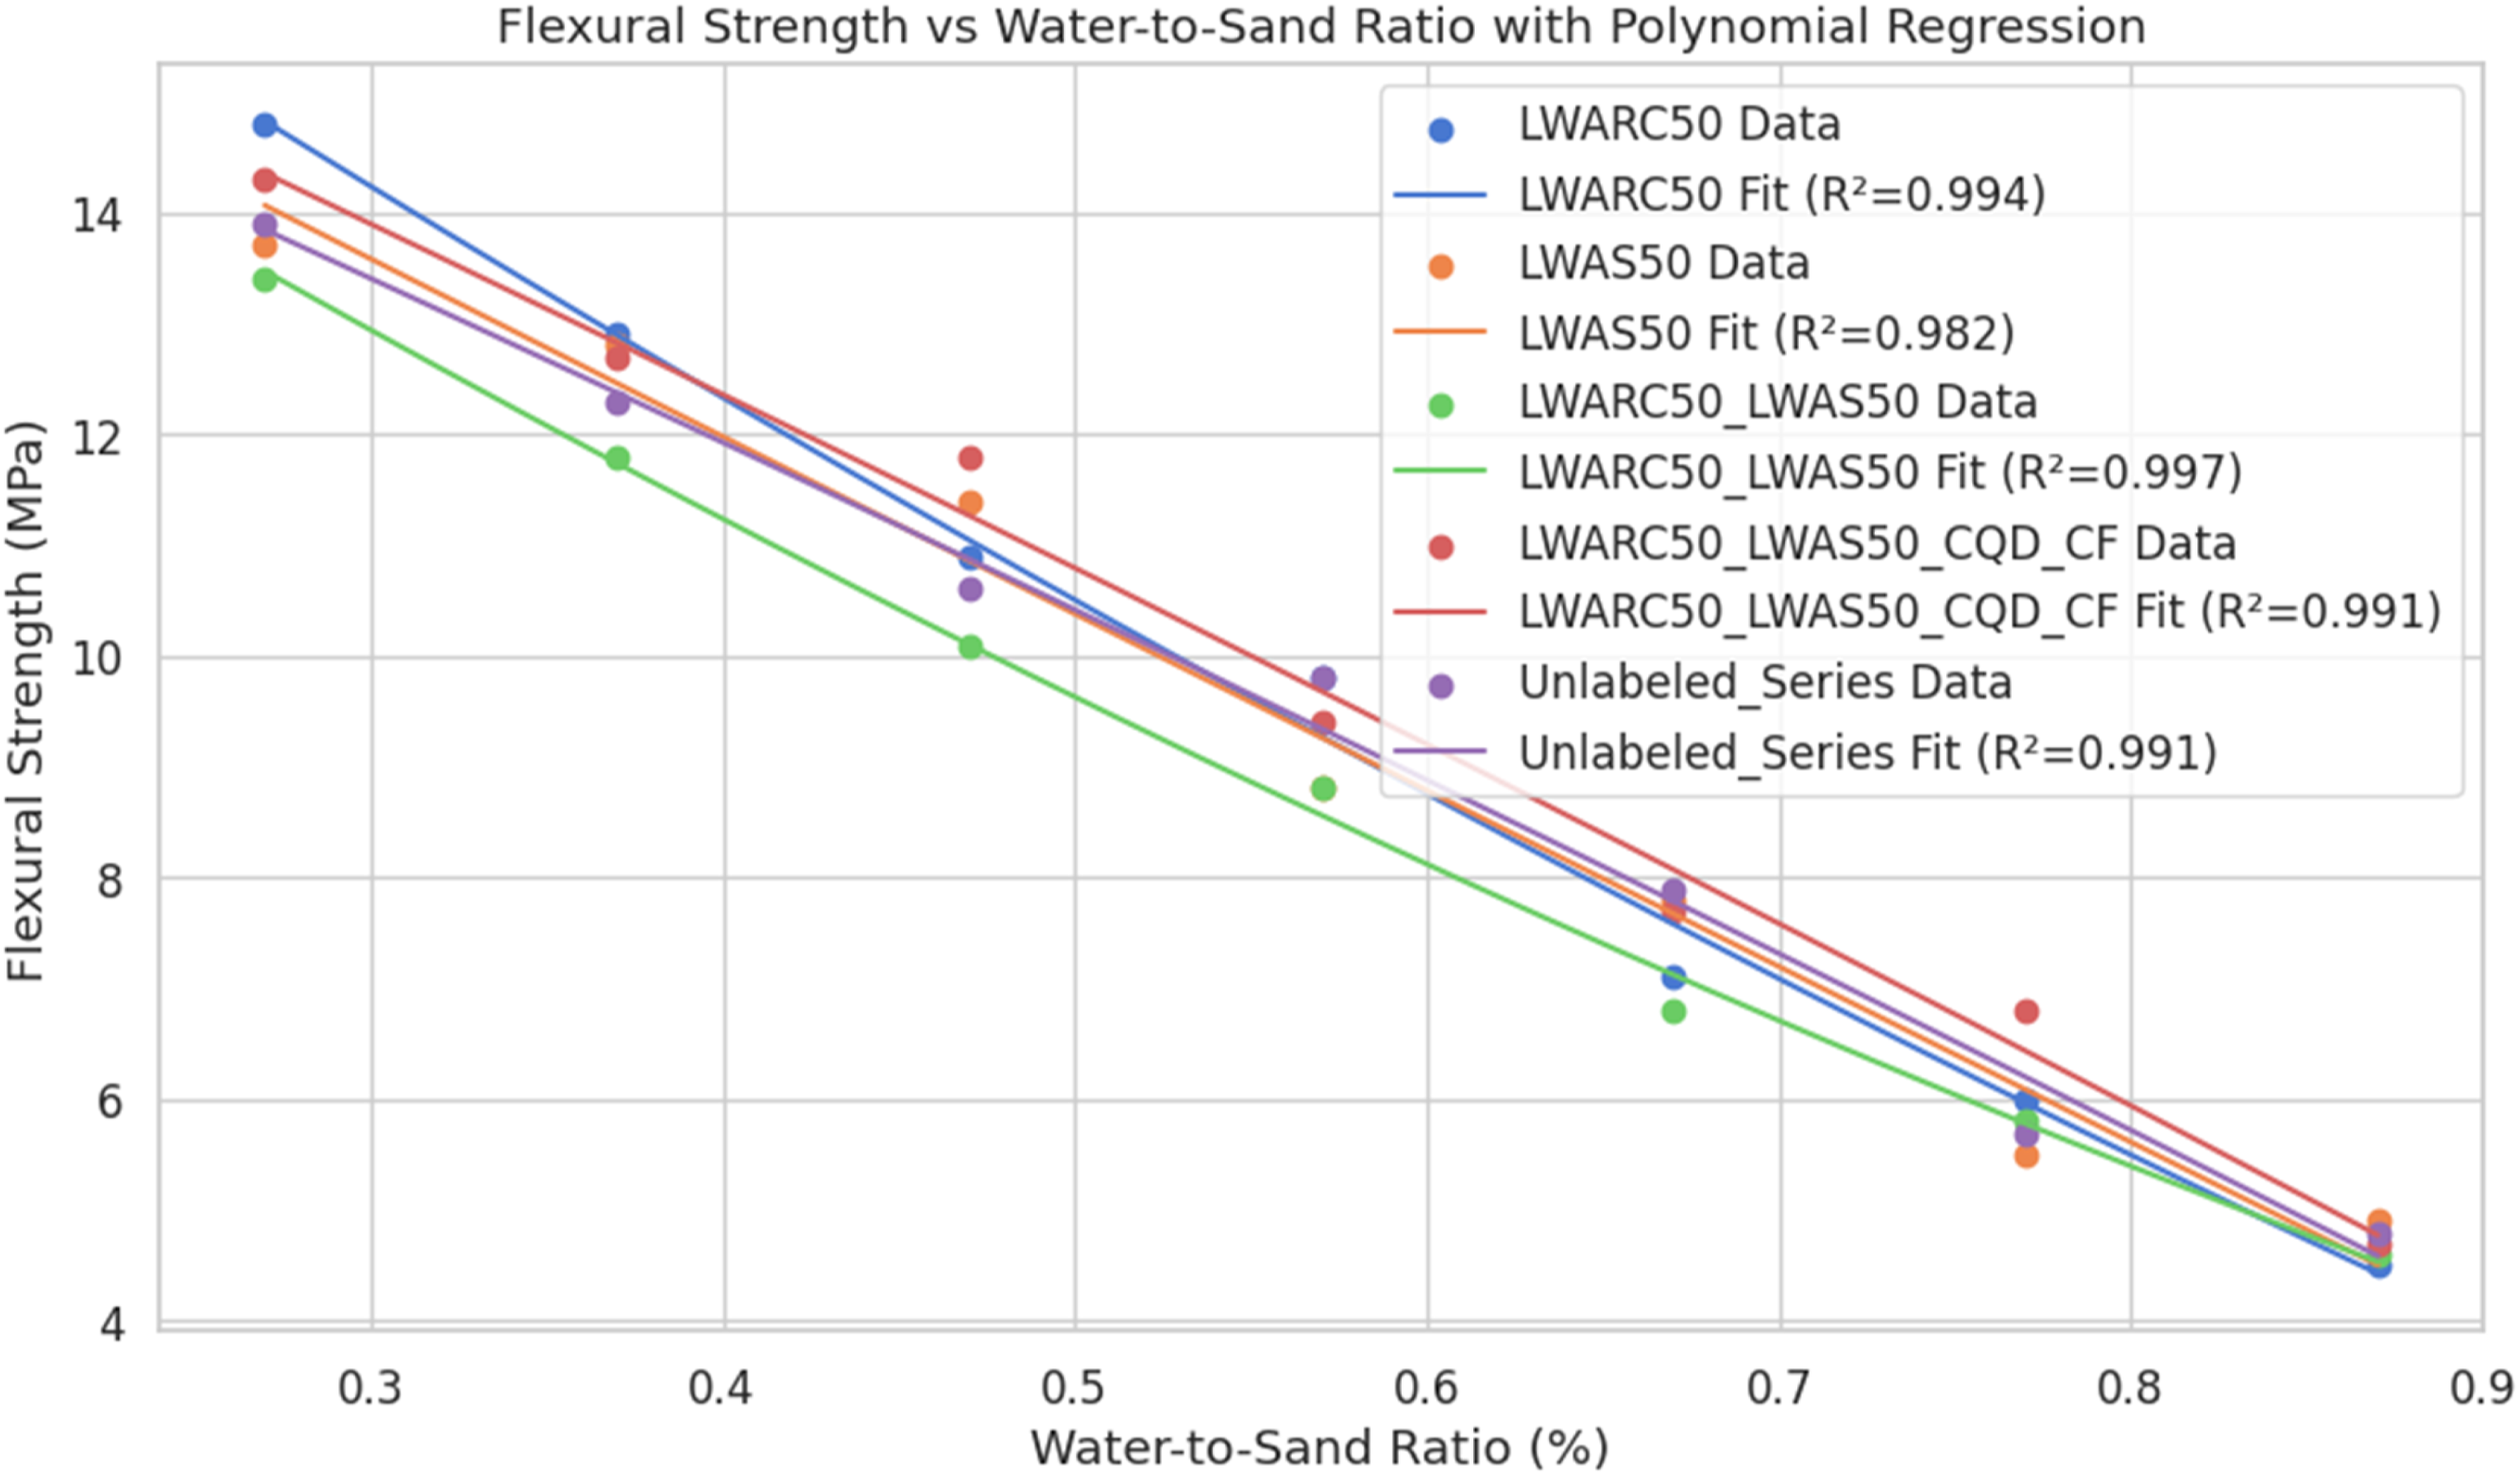
The graph, Flexural Strength vs Water to Sand Ratio with Polynomial Regression, provides an explicit look at the variation in flexural strength with the changing water-sand ratios when varying composite formulations are used. The x-axis is the water-to-sand ratios, with a range of 0.27 to 0.87 whereas the y-axis indicates the flexural strength that is between 4.5 MPa and 14.5 MPa. Five datasets are analyzed (LWARC50, LWAS50, LWARC50LWAS50, LWARC50LWAS50CQDCF, and an unlabeled series), paired with a curve of mathematical expression. The corresponding R2 values namely 0.994, 0.982, 0.997, 0.991, and 0.991 confirm that the model fidelity is high and the regression equations therefore represent the relationship between water-sand ratio and flexural strength well.
The regression curves indicate a steady decreasing trend in flexural strength with increasing ratio of water to sand and this indicates loss in the integrity of the matrix and the increase in the porosity with an increase in water content. It is important to note that the LWARC50LWAS50 blend exhibits the largest R2 (0.997), which means that the experimental data fits the regression model excellent. The LWARC50LWAS50CQDCF formulation containing CQD and CF additives has a comparatively better flexural strength at higher proportions of water-to-sand, signifying the reinforcing benefits of these additives on the material resilience at the high fluid conditions.
In this analysis, the significance of mix design and the role of additives in maximizing the flexural strength has been brought to light. The use of the polynomial regression will not only give better insight into the behavior of materials but also allow making predictions about the future composite formulations. These insights play a critical role in structural applications involving flexural strength, which is very vital, as part of the overall knowledge of the water-to-binder interactions in engineered composites. The results of descriptive statistics indicate that the mean flexural strength of LWARC50 is 9.43 MPa and the 95% interval is [6.65, 12.21], and the results of the ANOVA test indicate that there are no significant differences between the materials. Polynomial equations that characterize each composition are dependable predictors, which again justifies the importance of the use of a poly model to optimize materials.
Compressive strength
The relative compressive strength, curing day in water, and types of concrete containing recycled concrete aggregate, oil shale aggregate, superplasticizer, CQD, GNP, and CF, which were made of various water-to-binder ratios and water-to-sand ratios, are shown in Figure 16 to monitor the compressive strength gain in the LWAC. LWARC50% + CQD2.5% + CF2% results in the greatest compressive strength. The lowest compressive strength is observed in the control concrete (Figure 16). Furthermore, the reduction in water absorption may have led to an increase in compressive strength. For example, despite the SP/binder ratio of the LWARC50% + CQD2.5% + CF2% mixture being 0.023, it has the highest compressive strength of 99.3 (MPa) at 730 days, whereas the reference concrete beam has an average increase of approximately 46%. The noted increase in compressive strength observed during testing can largely be linked to the interaction between free calcium oxide (CaO) and CQD, as previously outlined in the author’s published works.64,65 Furthermore, the increase in the compressive strength of LWAC indicates that the presence of CQDs and the addition of CF lead to an average compressive strength that is 16% greater than that of the control concrete. Consequently, the LWARC50% + CQD2.5% + CF2% mixture is considered optimal with respect to the contents of CQD, CF, and SP. Moreover, the compressive strength of this mixture exceeds the target strength class with the minimal inclusion of CQD (refer to Figure 16). The ways in which CQD and CF affect compressive strength are essential for enhancing strength. The reactive powder of CQD has an artificial pozzolanic effect, whereas CF greatly enhances the structural characteristics of LWAC. Relative compressive strength, number of curing days in water, and types of concrete containing recycled concrete aggregate, oil shale aggregate, superplasticizer, CQD, GNP, and CF, which were made of various water-to-binder ratios and water-to-sand ratios.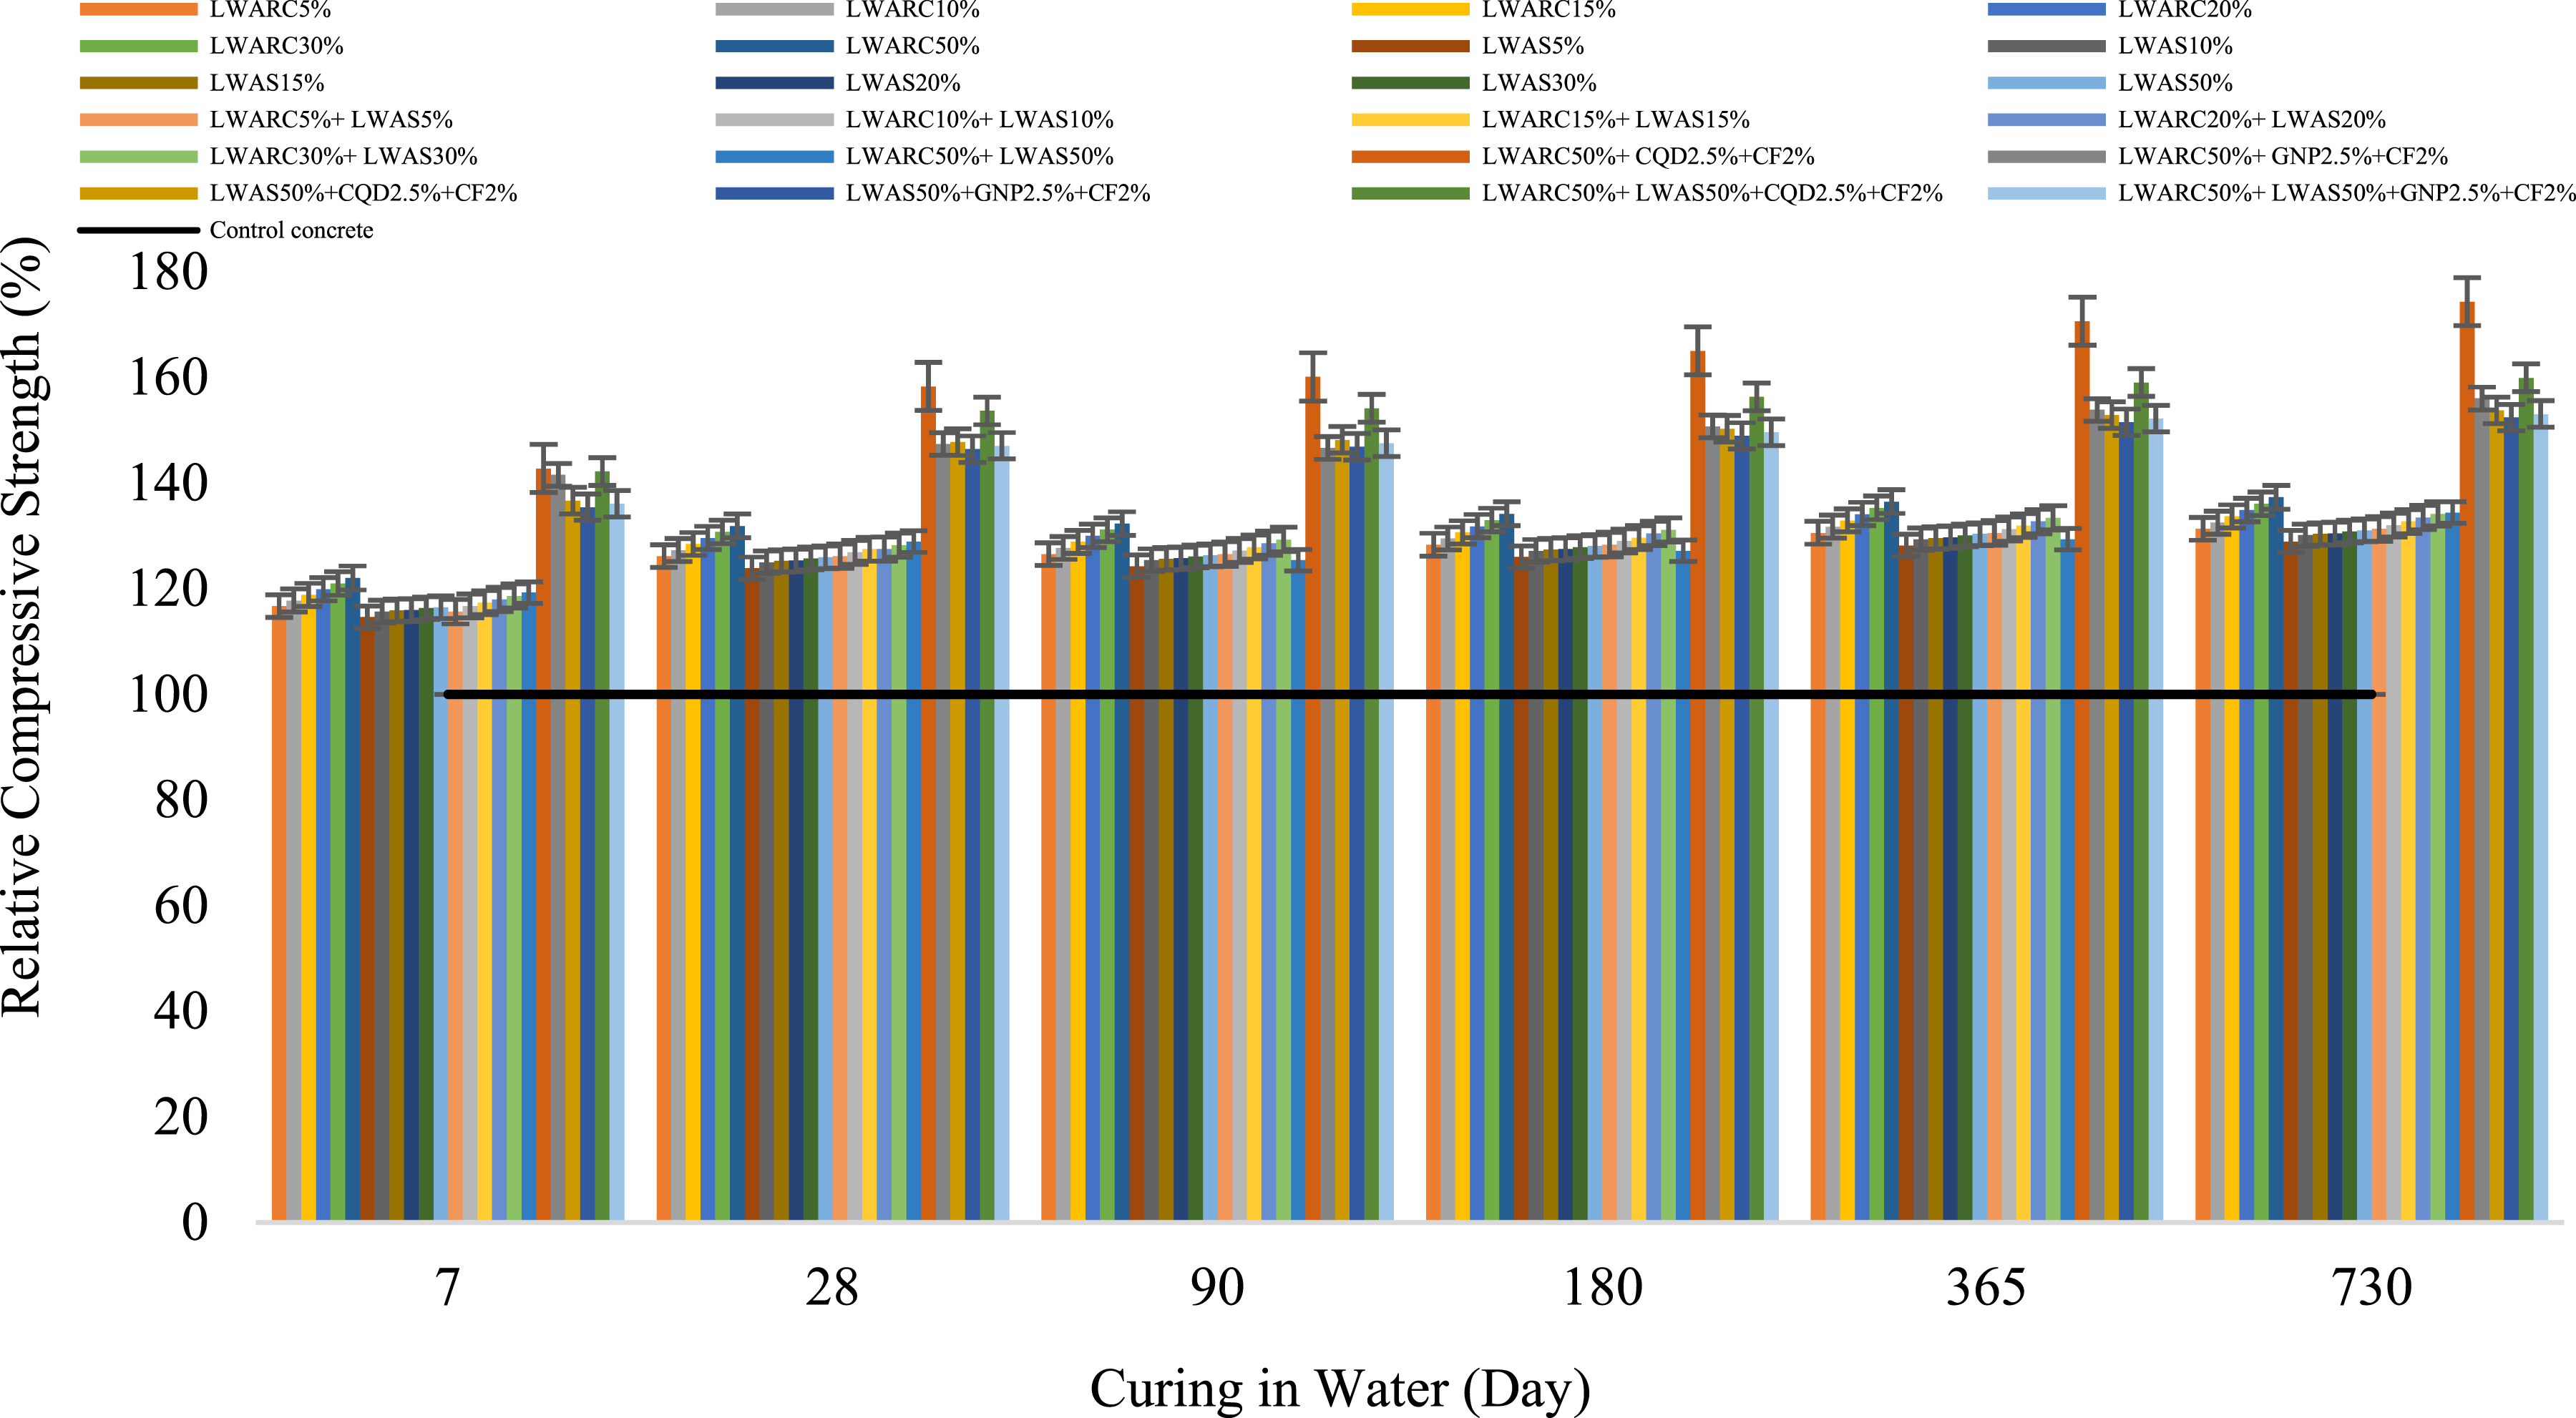
This combined effect leads to a compressive strength increase of over 46% at 730 days, rendering it appropriate for infrastructure and structural renewal through a technological composite. The test strength of LWAC is influenced by skeleton construction, with dense and stable structures resulting in increased early strength, especially in high-brick-content samples. However, loose structures result in low early strength due to discrete weak particles. Compared with the reference concrete block, the incorporation of recycled sand in the concrete blocks enhances the mechanical performance. This observation was also made by Vieira & Dal Molin, who reported an increase in compressive strength with the addition of 100% recycled sand and 0% recycled coarse aggregate.
66
Figure 17 shows a relationship for the projection of the compressive strength of LWACs from the water-to-sand ratio, math models, types of LWAC, and R2 values of the math models. Relationships between the compressive strength of LWACs and the water-to-sand ratio, math model, type of LWAC, and R2 of the math model.
The chart below, Compressive Strength vs Water-to-Sand Ratio with Polynomial Regression, is a detailed discussion on how compressive strength depends with the four different concrete formulations with respect to water-to-sand ratio. The x-axis covers the water-sand ratios between 0.0 and 0.9 whereas the compressive strength ranging between 40 and 120 MPa is plotted on the y-axis. It consists of four composed LWARC50, LWAS50, LWARC50LWAS50 and LWARC50CQDCF each having a regression curve of 0.989, 0.997, 0.997, and 0.993, respectively. The high R2 values mean that the model fits the data and predicts well.
The regression curves indicate that compressive strength is inversely proportional to the water-to-sand ratio, and the regression curves have a constant negative slope, indicating that expectation of greater water content in sand leads to lesser compressive strength. This is in accordance with the anticipated drop in binder concentration and augmented porosity with elevated water proportions, and this weakens the load bearing ability of the material. LWAS50 and LWARC50LWAS50 show the highest correlation (R2 = 0.997), which implies that these two formulations are remarkably consistent in their reaction to changing water/sand ratios. It is worth noting that the LWARC50\CQD\CF formulation, which included CQD and CF additives, shows that the two additives can maintain the compressive strength better even in high water-to-sand ratio, and the two additives eliminate the strength loss.
The insights given by this graph are important in the optimization of mix designs that are used in concrete, especially those in which compressive strength is a performance parameter. Polynomial regression is not only more likely to increase the interpretability of the data but also predictive modeling on future mix designs can be implemented to improve the development of high-performance concrete materials. The information obtained in this analysis can be particularly useful in structural engineering practices, where fluidity and strength are the key factors to be considered. Descriptive statistics indicate that the mean compressive strength of LWARC50 is 82.96 MPa, and the 95% interval is [64.23, 101.69]. The results of ANOVA and Tukey HSD show that there is no significant difference between the compositions, which is also supported by similarity in their work in terms of compressive strength. The derived polynomial equations of each composition are good models of predicting compressive strength that emphasizes the significance of mix design in the material optimization process.
Modulus of resilience
The modulus of resilience is shown in Figure 18 to monitor the increase and decrease in the modulus of resilience of the LWAC. As the content of the LWA, particularly recycled concrete aggregate, increases, the elastic modulus of the concrete decreases, the ITZ problem exacerbates, and the stress features and endurance of the composite continuously degrade. LWARC50% + CQD2.5% + CF2% has the highest Young’s modulus, and LWARC50% + LWAS50% + CQD2.5% + CF2% has the second greatest Young’s modulus in this work. In contrast, the control concrete has the lowest Young’s modulus (Figure 18). Additionally, the decrease in water absorption may have contributed to the increase in the Young’s modulus. For example, although the SP/binder ratio of the LWARC50% + CQD2.5% + CF2% mixture is 0.023, it achieves the highest Young’s modulus of 54.8 (GPa) compared with that of the control concrete, which shows an average increase of approximately 51%. Relative moduli of elasticity, curing day in water, and types of concrete containing recycled concrete aggregate, oil shale aggregate, superplasticizer, CQD, GNP, and CF, which were made of various water-to-binder ratios and water-to-sand ratios.
The 51% reported increase in the modulus elasticity when lightweight aggregates (LWA) were incorporated in the concrete mix seems counterintuitive because the decrease in the stiffness would be expected because of the low density of LWAs. Such a difference should be given more specific explanation and theoretical reasoning to explain the underlying processes. Although adding graphene and carbon quantum dots (CQD) is attributed to an increase in the Young modulus of the concrete through the adoption of the internal structure of the LWAC, it is necessary to resolve how such a large increase in the stiffness is achieved by the introduction of the lightweight aggregates that in most cases are less dense and more flexible. It is possible that the improved modulus is explained by the tight internal structure of LWAC that is enabled by the peculiarities of graphene and CQD, says the text. Nevertheless, how the density reduction of using LWA interacts with the stiffness increase of the introduction of nanomaterials requires further clarification. In particular, it is necessary to investigate more thoroughly the mechanism with the help of which these nanomaterials fill the microstructure and counteract the natural flexibility of LWAs. In addition, the density reduction-stiffness enhancement in LWAC is multifaceted and can connect to the aggregation behavior of LWA, bonding effectiveness of new binders and mechanical interactions at the nanoscale. As such a theoretical framework or model that could be used to justify these findings would increase the credibility of the reported results and explain the observed behavior vis-a-vis the overall material properties.
Moreover, the improvement in the Young’s modulus can be attributed to the compact internal structure of LWAC, which has been enhanced with graphene and CQD. The distinctive features of graphene and CQD, including their high aspect ratio and nanoscale size, have greatly enhanced the overall characteristics of the LWAC matrix, leading to a remarkably high Young’s modulus. On the one hand, the addition of graphite nanoplatelets created a bridging effect at the microscopic level within the concrete. Saafi et al. reported that the enhancement of the microstructure in nanocomposites, achieved through the incorporation of nanotube fibers, depended on the functional properties of these fibers, which likely played a role in the improved Young’s modulus and other mechanical attributes of the composites. 67 The order of the LWA content increases, and the effect on the modulus of resilience is shown in Figure 18. The elastic modulus of LWA in LWAC decreases with the addition of CQDs and GNPs, resulting in a decrease in the overall stiffness of the composite matrix. This decrease is due to the lower stiffness and greater flexibility of the LWA, which collectively results in a decrease in the overall stiffness of the composite matrix. The decrease in the modulus of resilience is due to the adhesion of binder mixing to the clustering of sand and gravel, likely due to inadequate adherence among the novel binder mixtures and the recently introduced clustering of sand and gravel within the LWAC. The modulus of resilience decreases to 53.0% in the LWAC due to the use of LWA, particularly nonnatural sand and gravel, as the sand and gravel stacks cluster. The modulus of resilience of the LWAC samples increases with increasing LWA substitution, leading to a curvilinear stress‒strain diagram. The strain capacity of GNP-modified LWAC is greater than that of the control concrete, with the largest strain capacity observed in LWARC50%+CQD2.5%+CF2%. The origin of the CQDs and GNPs can significantly increase the hardness of the samples, indicating their ability to absorb more power and withstand greater noninner forces. The specific stress is a crucial feature for assessing the stress development of LWAC. As the concentration of LWA varies from 5% to 50%, the specific strength of the samples incorporating LWA, CQD, and GNP consistently exceeds that of the control mixture. An average elastic modulus of 54.8 (GPa) is observed for the mixture of LWARC50%+CQD2.5%+CF2%. This value corresponds to contemporary concrete (with a density of 2400 kg/m3) exhibiting a bending stress of 7.04 MPa at 90 days. This outcome aligns with the typical range of mechanical properties observed for such materials.
The 730-days testing period that is incorporated into the manuscript provides a comprehensive review of the performance of the material over an extended time frame, but it fails to comment on the applicability of such protracted curing durations in the real world contexts. Most of the construction projects may not be able to afford these long testing periods because of time and cost constraints. Thus, it would also be helpful that the manuscript addresses the idea on whether these long curing periods are indeed required to evaluate the material properties in normal construction conditions. Also, long-term testing results should be discussed in relation to faster testing procedures that, in most cases, are viewed as practical and efficient alternatives. Accelerated testing takes the impacts of long-term exposure and extends them during a shorter duration usually done by higher temperatures or other stress factors. The comparison of the results of 730-days testing and accelerated testing methods or predictive models would indicate whether the accelerated testing can be concluded to provide a reliable predictive result of the material performance in the long run. This association would be insightful on whether accelerated testing is a possible alternative to long-term testing, which would serve to lessen the duration of testing and the accuracy of the findings would not be affected.
Microscopic analysis
Figure 19 shows the microscopic analysis used to monitor the mineral phase in the LWAC. The scanning electron microscopy (SEM) micrographs in Figure 19 demonstrated the presence of ettringite, which tended to increase with increasing LWA content. The microscopic analysis of LWARC50%+CQD2.5%+CF2% with SEM included recycled concrete aggregate, oil shale aggregate, superplasticizer, CQD, GNP, and CF, which were made of various water-to-binder ratios and water-to-sand ratios.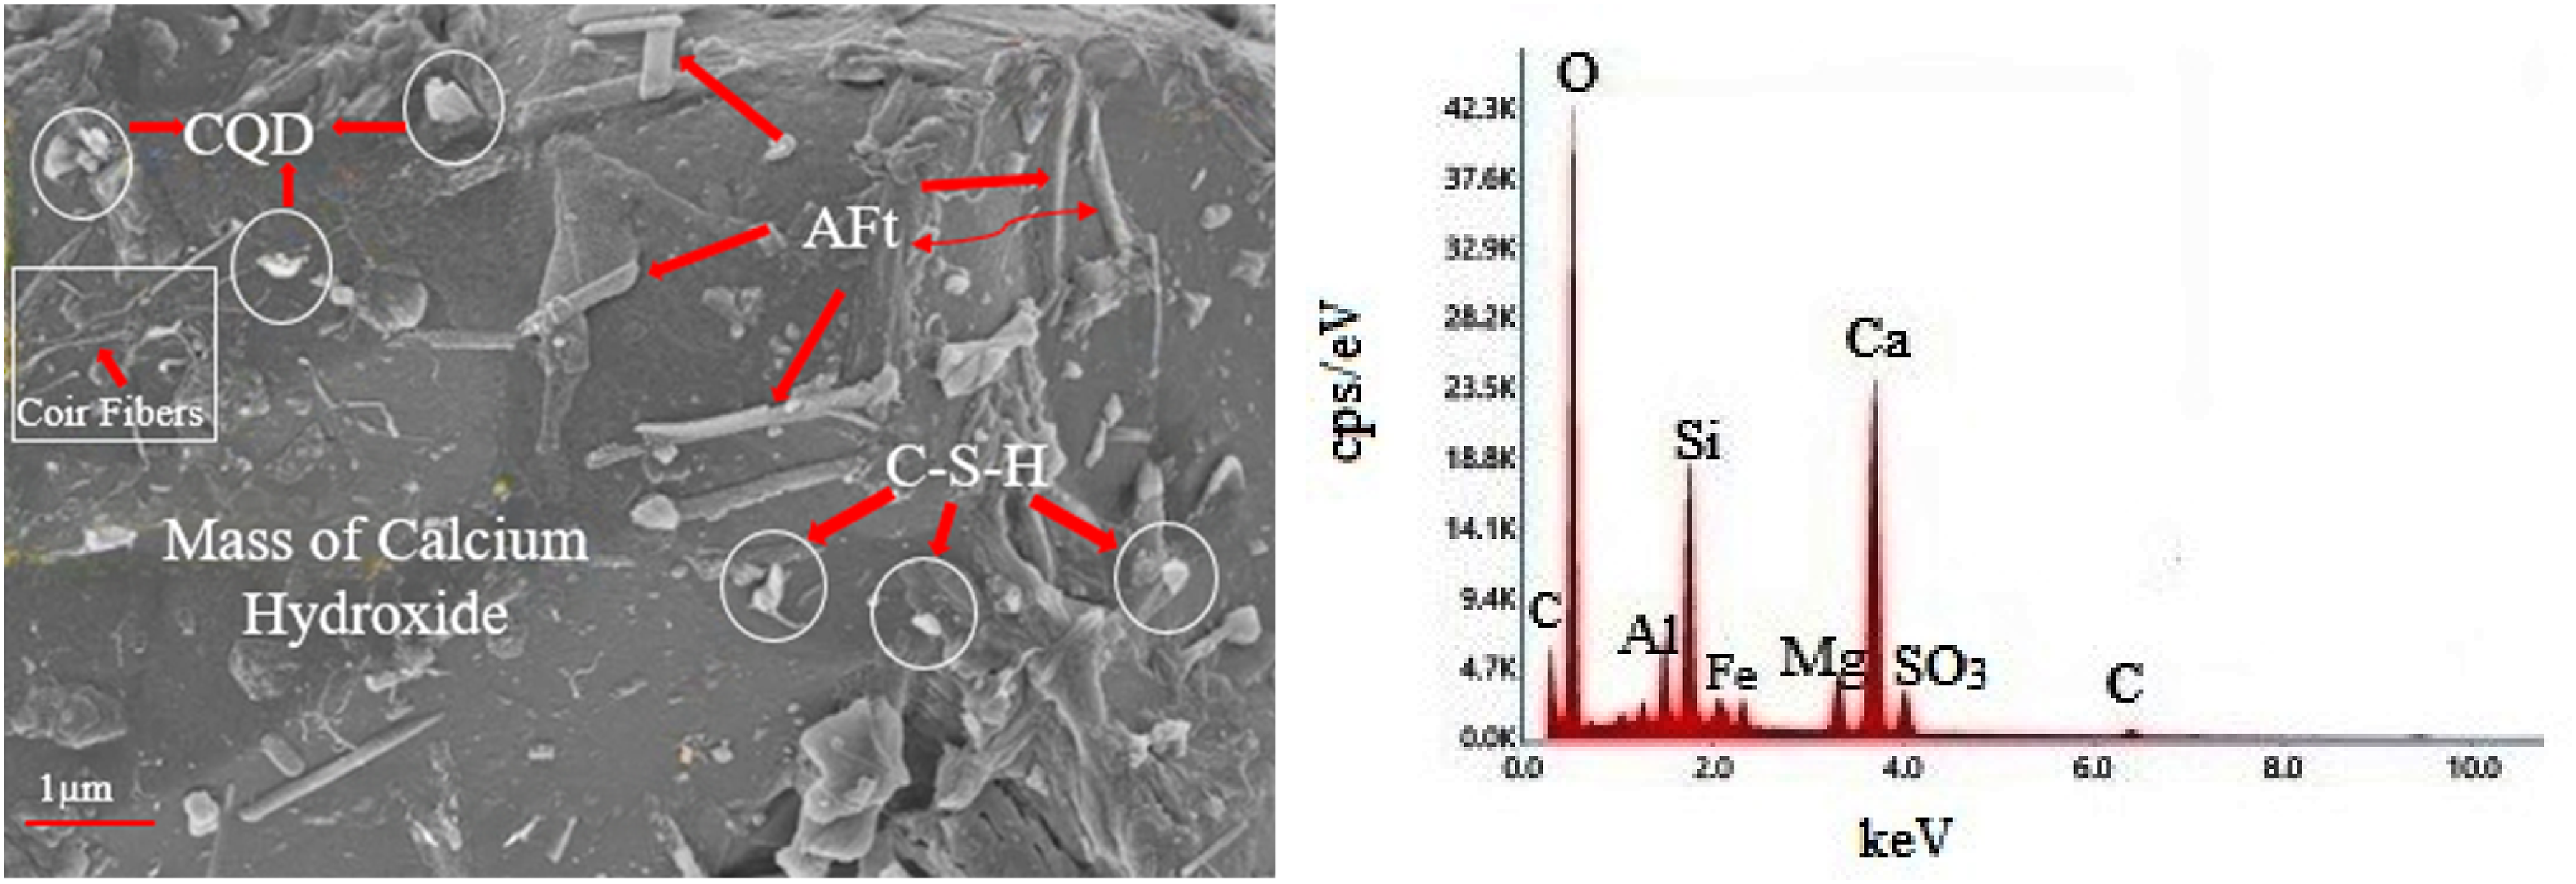
Both AFt and AFm (ettringite) are formed in the early stages of composite development to reduce the setting time of the binder but may also be formed at a later age. This indicates that the hardening of some cement particles has not been completed, resulting in expansion. The concrete material underwent a weakening process due to the presence of calcium silicate hydrate (C-S-H) fibers during the curing period of the binder with LWA. The LWARC50%+CQD2.5%+CF2% composite with shale aggregates showed layered accumulations of CH crystals and prismatic ettringite crystals (Figure 19). The internal structure of the hardened matrix of RCC was represented by an amorphous gel at 90 days. The LWA granules were well located in the matrices and embedded in stratified CH. 68 Additionally, the EDS elemental analysis of LWARC50%+CQD2.5%+CF2% yielded notable peaks for calcium, silicon, aluminum, carbon, magnesium, sulfate, and potassium, which were attributed primarily to the elevated levels of these elements present in the Portland cement and CQD. The calcium content in the matrix of the LWARS50%+CQD2.5%+CF2% composite with shale aggregates was greater than that of the control concrete. At 90 days, the microstructure of the LWAC with shale aggregates further densified compared with that of the LWARC. A polymeric film of a polycarboxylate superplasticizer was used to coat the cement particles, forming an interwoven mesh structure that improved the matrix. This increased the flexural strength and toughness of the samples, as well as their resilience and endurance. Furthermore, numerous studies have investigated the SEM and energy dispersive X-ray spectroscopy (EDS) analysis of traditional concrete. Nevertheless, SEM and EDS of concrete composed of LWAR, LWAS, CQD, GNP, and SP have not been performed. A similar finding has been reported in the current literature. For example, the system that features high calcium produces a calcium–alumina–silicate–hydrate gel (C–A–S–H) with a low Al/Si ratio of 0.3–0.4 and a Ca/Si ratio that varies from 1–1.5, as highlighted by several researchers69,70 in relation to different concrete systems. The resulting products are akin to the C–S–H gel present in Portland cement systems, where higher Ca/Si ratios are generally found, ranging from 1.2–2.3. 71 These products are expected to encompass various types of calcium silicate hydrates and calcium aluminum hydrates. Importantly, the composition of the gel is considerably more abundant in silica than the calculated bulk composition of its components.
Mechanisms of interaction between CQD, GNP, and cementitious matrix
Graphene Nanoplatelets and Carbon Quantum Dots were chosen as nanomorphologies that allow the improvement of mechanical and durability properties of cementitious material. With their nanosized structures, CQDs have a large surface area and many reactive sites that make them pozzolanic. The CQDs in the cementitious is used to help form a more robust calcium silicate hydrate (C–S–H) gel that boosts the strength and ultimately durability of the concrete. The emergence of CQDs can also help optimally modify the hydration products to hasten the pozzolanic reaction and expand the interfacial transition zone (ITZ), which typically is a controlling factor in the seclusion of the aggregates and cement matrix.
Nanoplatelets (GNPs) are other very promising nanomaterials in enhancing the characteristics of concrete. GNPs are high aspect ratios and provide mechanical reinforcement to the concrete matrix. The fact that they can seal even the smallest cracks in the material, and evenly share the stress throughout the material, substantially increases flexural and tensile strength of the concrete. In addition, GNPs improve the electrical and thermal conductivity of concrete and make concrete more varied in other applications. The non-homogeneous dispersion of the GNPs in the matrix also results in a more homogeneous material structure that can prevent the development of cracks and improve the toughness of the material.
The complementary nature of CQDs and GNPs in the cementitious matrix may be explained by the synergy. CQDs enhance improved dispersion of GNPs in concrete mix, that is, the nanoparticles are uniformly distributed in the matrix. With such improved dispersion, an acceptable reinforcing mechanism can be accomplished using CQDs and GNPs working synergistically on the mechanical structure and overall bulk stability of concrete. Unlike the classical nanomaterials, for example, nanosilica, which can reinforce the matrix only by its filler effect, the synergistic combination of CQDs and GNPs provides a versatile reinforcement strategy, which not only fine-tunes the strength of the matrix but also improves its flexibility and crack resistance.
Synergistic effects of CQDs, GNPs, and coir fibers
Another type of reinforcement is Coir Fibers (CFs) that are used in concrete. CFs are eco-friendly and natural fibers that can be used to increase the toughness and ductility of concrete. By using CFs with CQDs and GNPs, the crack-resistance properties of the concrete are improved, and the concrete does not collapse in the presence of tensile stresses. The fibers are applied as crack barriers which restrict load and crack propagation. This is particularly applicable to concrete with dynamic forces where fibers and nanoparticles can contribute significantly to the life and stability of the material.
The above synergistic effects between CQDs, GNPs, and CFs are explained by the fact that they interact at different levels in the concrete matrix. Both GNPs and CQDs work in nanoscale, so the number of chemical bonds among particles of cement is increased, and the matrix is enhanced so it is more robust and harder. In the meantime, the coir fibers will perform on a macroscopic scale to eliminate the cracks and enhance the overall toughness. These materials combined together form a composite material with enhanced mechanical properties, such as the compressive strength, tensile strength, flexural strength, strength to deform or propagation of cracks. Besides increasing the overall structural integrity of the concrete, this synergetic interaction also may well contribute to the overall sustainability of the concrete by incorporating natural and environmentally friendly fibers into the mix.
Each of these elements will have a greater effect if they are introduced in isolation from each other, however, it is the interaction of these components which will result in concrete materials having superior mechanical properties and greater durability.
Economic value of the research
The cost comparison between traditional concrete and high-strength lightweight concrete, which incorporates materials such as LWA, coir fiber, CQD, and superplasticizer for one cubic meter.

At the same time, the manuscript aims to significantly reduce CO2 emissions, energy usage, and the consumption of raw materials in the creation of high-strength lightweight structural materials, exceeding 2.5%. Furthermore, high-strength lightweight concrete, which includes LWAs, coir fibers, CQDs, and superplasticizers, can be applied in various structural contexts, such as (1) the construction of advanced structures, roadways, and surfaces; (2) enhancing the durability of both new and existing buildings and infrastructure; (3) fostering an intelligent built environment; (4) improving the strength and lifespan of cement-based materials for structural, roadway, surface, and infrastructure uses; and (5) facilitating the extraction of carbon minerals in the production of ordinary Portland cement (OPC).72–89
Conclusion
This study evaluated the effects of w/b and w/s on the structural features of high-stress lightweight composites containing recycled concrete aggregates, oil shale aggregates, polycarboxylate superplasticizer polymer films, carbon quantum dots, graphite nanoparticles, and coir fibers. The following conclusions were drawn from the results. The apparent density and water absorption decrease sharply as the LWAR and LWAS contents increase from 5 to 50% for the samples, whereas the optimum ratio of LWAR to LWAS is 50% for CQD, GNP, SP, and CF. There is a slight increase in the flexural strength, splitting tensile strength, and compression strength with the addition of CQD, GNP, and CF compared with those of the composite samples used. The modulus of resilience of the composites increased with increasing usage of CQDs, GNPs, and CFs. The most striking results were shown for both the LWARC50%+ CQD2.5%+CF2% group and the LWARC50%+ LWAS50%+CQD2.5%+CF2% group because their results were the best. Furthermore, the physical and strength/mechanical features can be optimized through the development of mathematical models. The results of this research have the potential to facilitate the practical implementation of LWAC in real building structures.
Footnotes
Funding
The authors disclosed receipt of the following financial support for the research, authorship, and/or publication of this article: This study was supported by grants from the The Science and Technology Research Program of Chongqing Municipal Education Commission (KJQN202200735) and The General Project of Chongqing Natural Science Foundation (CSTB2022NSCQ-MSX1469)
Declaration of conflicting interests
The author declared no potential conflicts of interest with respect to the research, authorship, and/or publication of this article.