
Abstract
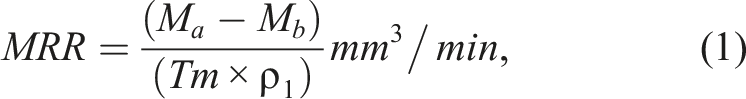
In this work, fuzzy model was developed that predicts response parameters and surface properties of an electrical discharge machined Zircaloy-2. Taguchi L18 mixed design was used to perform the experiments using different process parameters (polarity, pulse-on-time, pulse-off-time, tool electrode material, and peak current). Material removal rate (MRR) and tool wear rate (TWR) were chosen as machining response parameters, whereas number of particles (NoP) and the percentage particle area (PPA) for surface properties of EDMed surface. Digital image processing tool was used to evaluate the surface properties. Fuzzy-Sugeno (FS)-model was developed to predict MRR, TWR, NoP, and PPA. Model accuracy was found to be 94% for MRR and TWR, and 92% for NoP and PPA. Maximum MRR 1.53 × 10⁻³ mm3/min found when machining was performed using graphite tool with negative polarity. Fuzzy Sugeno-GRA method was successfully implemented to predict optimal response corresponding to high value of GRG.
Keywords
Introduction
Today's, non-conventional machining has become a popular machine tool to machine hard materials in complex shape. In this, electrical discharge machining (EDM) is broadly employed to machine electrically conductive materials and produced parts with high precision and accuracy. EDM occupies approx. 2% of industrial application. 1 During machining in EDM, an electric spark between two electrodes is generated. This continuous electrical spark increased temperature of machining area, which melts and evaporates the working surface.2–4 The machining outcomes such as material removal rate (MRR), tool wear rate (TWR), and surface roughness (SR) are significantly impacted by various process parameters including polarity, on-time (Ton), off-time (Toff), tool electrode material, working voltage (V), and peak current (I p ). The choice of tool electrode material and design plays a crucial role in shaping the machining responses, such as MRR, SR, TWR, radial overcut, radial undercut, taper angle, and the hardness of the machined surface.
To measure the effect of tool electrode materials, Titanium-6 alloy was machined with three different tool electrodes (Brass, Zn, and Cu), and reported maximum MRR with brass tool. 5 Hollow tools improved flushing condition during EDM operation; therefore, MRR of DZ125L was improved when machined with hollow tool. 6 Improvement in machining response parameters was observed when machining was performed with progressive tool design. 7 Hardness of the work-piece surface increased on increase in formation of oxide and carbide.8–10 Ablyaz et al. 11 machined bio-implant steel (DSS 2205) and measured surface characteristics of EDMed surface. Authors reported that tool electrode have highest impact on SR and current on MRR. High wear resistance on EDMed surface was observed as compare to bare material.
There is a lack of literature evidence on machining of ceramics and refractory materials using EDM. A pressure tube material (Zr-2.5 Nb) has been studied to explore the effect of hydrogen ingress on the machined surface, and author concluded that EDMed surface explored in to the air have higher rate of hydrogen ingress in comparison to water. 12 Nuclear grade material Zr-2 was machined with progressive tool and reported that tool design parameters (rake angle, flat land, and trunk dia.) significantly influenced the response parameters. 7 Zircaloy (E110) machined with Wire-EDM using brass wire as an electrode and observed the diffusion of Cu on the EDMed surface. 13
EDMed surface is characterized by measuring the surface roughness, crack density, white layer thickness, particle present, surface roughness measurement, SEM, and EDS. Mahajan et al. 14 performed machining on Co-Cr (F-90) and steel (DSS-2205 alloys)to analyze the effect of EDM process parameters and tool electrode material and observed highest impact of peak current (Ip) on MRR for both alloys. Authors also concluded that EDMed surface was less corrosive as compare to that of bare metals due to formation of intermittent metal oxide layers. Surface characteristics of EDMed surface were also analyzed using digital image processing tool (DIPT). A DIPT tool (ImageJ) has been successfully implemented to examine circularity, solidity, particle area, and percentage particle area. 15 Underwood et al. 16 performed a study to analyze the particle size of RM8017 Ag nano particles using ImageJ software. Authors observed the Ag nano particles of 75 nm. A customize macros (watershed segmentation) has been developed and concluded that developed macros reduce error in circular shape of the particle. 17 In the field of material science, image processing is often used to measure particle size. To measure irregularity in the shape of the granular particle, centroid method has been implemented using MATLAB image processing tool, and maximum and minimum diameter of the particle was successfully calculated. 18 DIPT tool easily evaluates surface integrity of machined surface, and it is less time and cost consuming, therefore motivated to use ImageJ for machine surface characterization.
Nowadays, modelling is gaining popularity in to the researchers, a knowledge-based artificial intelligence system has been developed by the researchers to investigate EDM responses. Implementation of the fuzzy logic is used to develop a fuzzy set to define the EDM process parameters. The fuzzy rules and membership function defined the accuracy of the developed model. 19 These fuzzy set have triangular membership functions which have been studied in various studies. 20 Lin et al. 21 developed a fuzzy logic-based Taguchi method to optimize EDM response parameters (MRR, TWR, and SR), and compared with GRA results. The author conclude that both methods ware improved EDM response and GRA have more reliable then fuzzy logic-based Taguchi method. Wire-EDM machining parameters have been modelled using fuzzy inference system (FIS), and model predicted results has been found 90% accurate with the experimental results.22,23 Improvement in the grey relation grade was measured when it is combined with fuzzy logic. 24 The fuzzy inference system consists of two methods, that is, Mamdani and Sugeno. Many researchers used Mamdani technique to develop fuzzy logic model to understand the variables relation on response, and surface viewer gives most influence interaction effect.25,26 Cutting speed of WEDM for Creusabro 4800 steel has been modelled with fuzzy-Mamdani model, and a predicted cutting speed of 6.471 mm min−1 has been found, which was close to the experimental value 6.2 mm min−1. AISI O2 work material machined with EDM to understand the relationship between discharge energy and MRR, discharge current has the highest effect on MRR. An FS model was developed by the researchers, and it gives 94% prediction accuracy with experimental results. 28
There are many literatures available that model and predict the EDM process parameters using fuzzy interface system, scarcity of Sugeno fuzzy interface system is found in the literature. There was no literature available that optimize the machining responses using fuzzy based GRA method and also to measure number of particles (NoP) and particle percentage area (PPA) using digital image processing tool (Image J) of Zircaloy-2. Therefore, it is necessary to optimize the machining responses using fuzzy based GRA method, and to measure NoP and PPA using digital image processing tool (DIPT).
No literatures exhibit the utilization of the DIPT tool for measuring the characteristics of surface that undergo EDM (Electrical Discharge Machining). Therefore, its incorporation in this study brings a novel contribution to the field of research. In this work, the Zircaloy-2 was machined using EDM under a specific design of experiment (DoE). DIPT (ImageJ) is used to detect the number of particles and particle percentage area on the EDMed surface. FS-model was developed to predict MRR, TWR, NoP, and PPA. A fuzzy based GRA method was used to optimize machining response parameters (MRR and TWR).
Materials and methods
Independent process parameters matrix with their respective levels.


Independent process parameters and their responses with respective levels in coded form.

In order to determine the effects of machining parameters on machined surface, the images of Zircaloy-2 EDMed surface were captured by using FE-SEM (JSM-7100F). To see the effect of polarity and tool materials, FE-SEM images of about 50pct. of EDMed specimens were taken. DIPT is one of the important tools to analyze the machined surface without modification. DIPT works on the principle of pixel value. Image J extracts information from these pixels and provides it inquantitative form. For processing in Image J, FE-SEM image was cropped from centre of dimensions 2 mm × 2 mm.
In EDM, responses are highly influenced by process parameters, large number of process parameters increased uncertainty in the experimental results. Thus, to reduce uncertainty and increase repeatability in the experiments, FS-model is employed in this study. Five input and two output process variables are defined in FS-model (Figure 1). In this design, the experimental results are used to design the model, and confirmation test data is used for the validation of model and EDM response parameters and surface characteristics were predicted. Flowchart for FS- model.
In first step, input fuzzy variables (Polarity, tool materials, Ton, Toff, and Ip) for an output crisp values (MRR and TWR) are defined. Number of inputs in the Sugeno-FIS is equal to number of process parameters. This offers greater adaptability to fuzzy model. To establish an input–output parameter relation, a systematic generation of fuzzy rules were established using the Sugeno-FIS.
28
In Sugeno-FIS, defined rules are not fuzzy. The fuzzy rules structured in Sugeno fuzzy inference model have a format as given by equation (3).
where v and y represent input and output variables, respectively, and A and B are the fuzzy sets of the membership function (MF).
FS-model membership function (MF) for each input variable was defined. Since Gaussian profile is smooth and non-zero characteristics, therefore it is popular in fuzzy modelling. A set of four-input symmetric Gaussian MF was formed without considering tool material. The mathematical representation of the Gaussian profile is given by equation (4). The fuzzy set and membership function for the input variables for (a) polarity with two Gaussian MF, (b) tool material with Pi- MF, (c) Ton with Gaussian MF, (d) Toff with Gaussian MF, and (e) Ip with Gaussian MF.

For an input parameter, polarity has two MF, and the rest have three MF. Pi-shaped MF was defined for tool materials as shown in Figure 2(b). The mathematical representation of Pi-shaped MF is given by equation (5).
Output function represented by f(v) gives a crisp value. The output function f(v) is a polynomial, where v1 and v2 are input variables. The output of the fuzzy model depends on the output function either it may be linear or nonlinear, in the fuzzy region. During the rule, development decision is expressed in the form of singletons type. MIN or PROD operator inference mechanisms are used in Sugeno fuzzy model.
Every rule in the Sugeno model generates output value (yi) and weight value (wi). A fuzzy value of each rule output level (yi) is given by equation (6). This may be a constant or a linear function. In this, pi, qi, and ri, are coefficient constants. In zero-order Sugeno model constant (pi = qi = 0) output is considered.
Two inputs membership functions (MF-1 and MF-2) are connected by AND operator, as represented by equation (7).
Weighted average defuzzification method has been utilized for the generation of final output. This is generally used to change the yield fuzzy set into genuine crisp values. The mathematical form of average weighted is given by equation (8).
Fuzzy-grey relation analysis (FS-GRA) was developed to determine the best ranked response. In this, Fuzzy Sugeno crisp outputs are used as input data set in GRA. Relation among variables were established and provide a single response in terms of grey relation grade (GRG). Grey relational grade (Γi) is calculated by using equation (9).
Results and discussion
In this work, Zircaloy-2 was machined with EDM considering different set of process parameters and the responses (MRR and TWR) are calculated and corresponding values are tabulated in Table 2.
Maximum MRR is 1.530 × 10⁻³ mm3/min. obtained corresponding to experiment number 16. TWR is an undesired criterion so it requires minimum, and its minimum value is 0.045 × 10⁻³ mm3/min corresponds to experiment number 14 (Table 2). Interaction plot (Figure 3) shows the effect of process parameters on MRR. MRR is higher in negative polarity because high-velocity electrons strike to work material and erodes high volume of workpiece material (Figure 3(a)–(d)).
30
Tool material has also significant effects on MRR, maximum MRR was obtained when machining was performed with graphite tool (Figure 3(a)). Interaction plot for mean MRR with input parameters (a) polarity versus tool material, (b) polarity versus T
on
, (c) polarity versus T
off
, and (d) polarity versus I
p
.
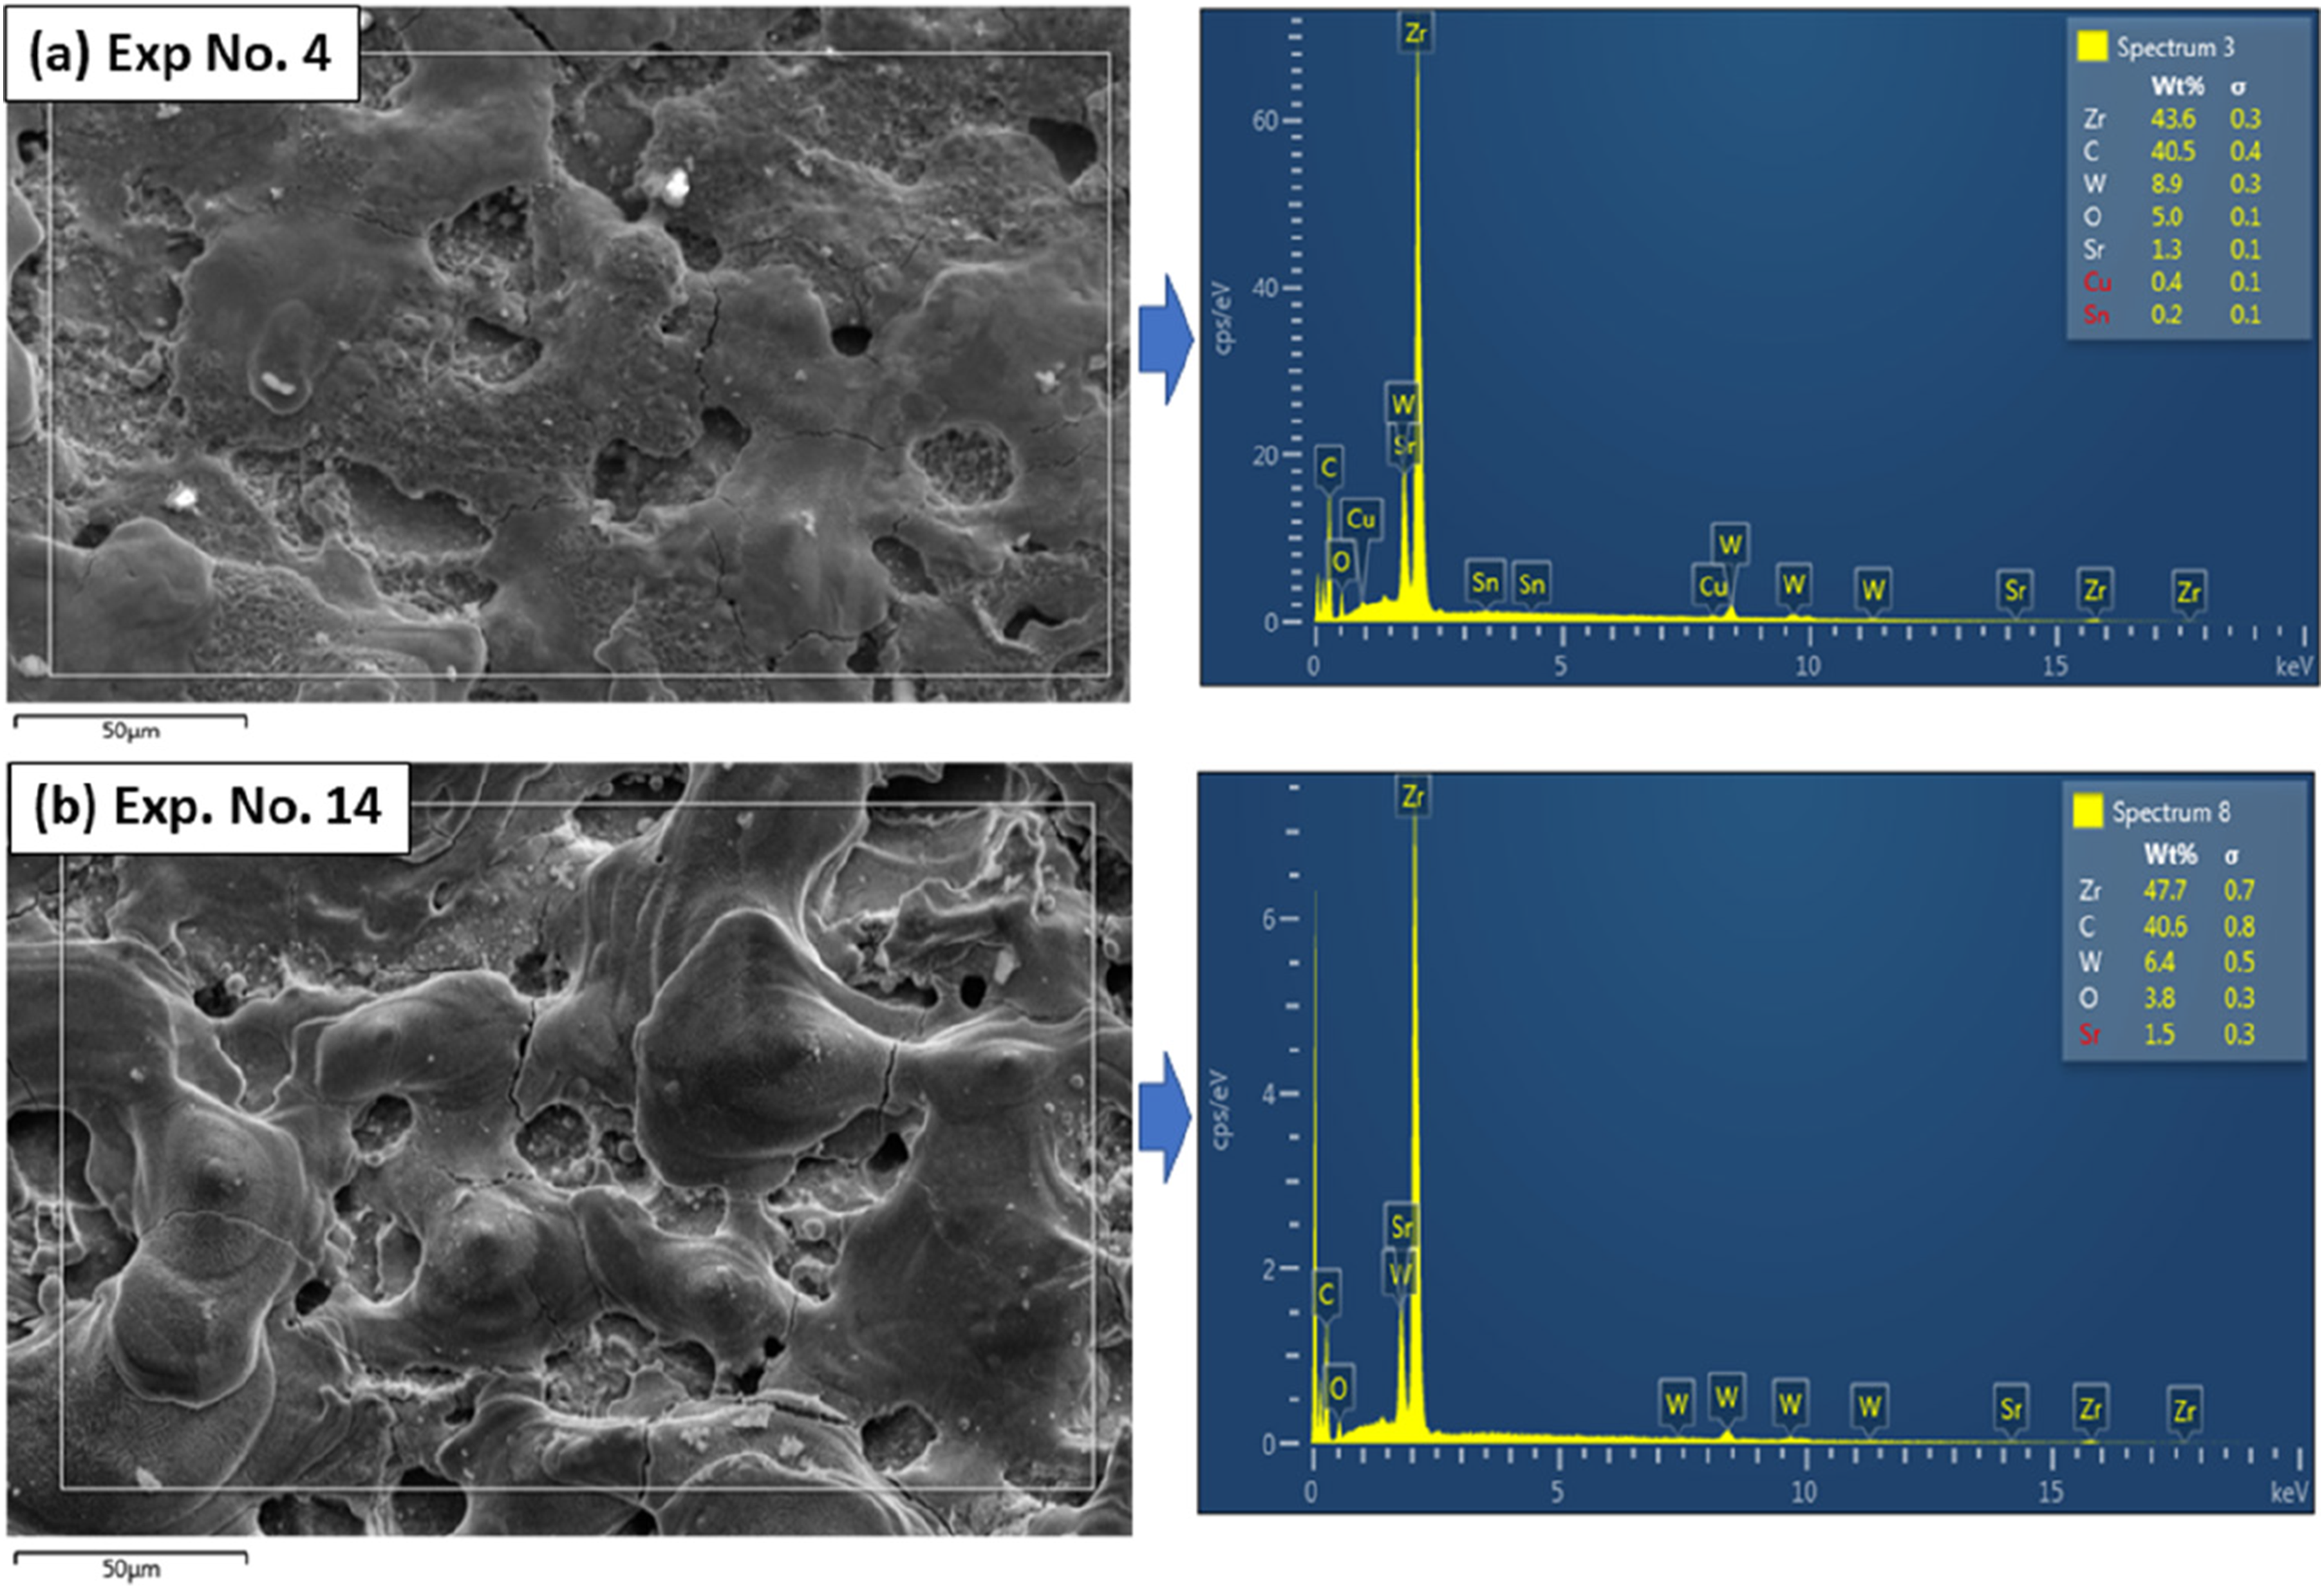
During machining melting and evaporation of tool electrode occurs due to the generation of high-temperature plasma in between the electrodes. Figure 4 shows the effect of machining parameters on TWR. When the machining was performed with Cu and CuW electrodes, minimum TWR was observed at negative polarity, whereas with graphite electrode minimum TWR was observed at positive electrode as depicted in Figure 4(a). TWR depends on thermal properties of tool electrode material. Since Cu and CuW tool material have higher thermal conductivity than that of graphite, results more TWR when the machining was performed using graphite tool at negative polarity.5,30,33,34 As depicted in Figure 4(a), the utilization of a graphite tool in conjunction with negative polarity leads to a higher tool wear rate (TWR). This is primarily attributed to the impact of high-velocity electrons on the work material, resulting in substantial erosion of both the workpiece and tool materials. The minimum value of TWR is 0.045 × 10⁻³ mm3/min corresponds to negative polarity (Exp. No. 14), which is also depicted in Figure 5. Small amount of Cu and W deposition on the machined surface with negative polarity (Figure 5(b)) indicates small TWR. In Figure 5, the tool electrode is CuW and the deposition of W on the machined surface is due to its higher melting point. Therefore W does not escape out from the machining area during flushing. Presence of Cu confirm higher TWR in positive polarity. Interaction plot for mean TWR with input parameters (a) polarity versus tool material, (b) polarity versus T
on
, (c) polarity versus T
off
, and (d) polarity versus I
p
. FESEM and EDS of machined surface with (a) positive polarity, and (b) negative polarity.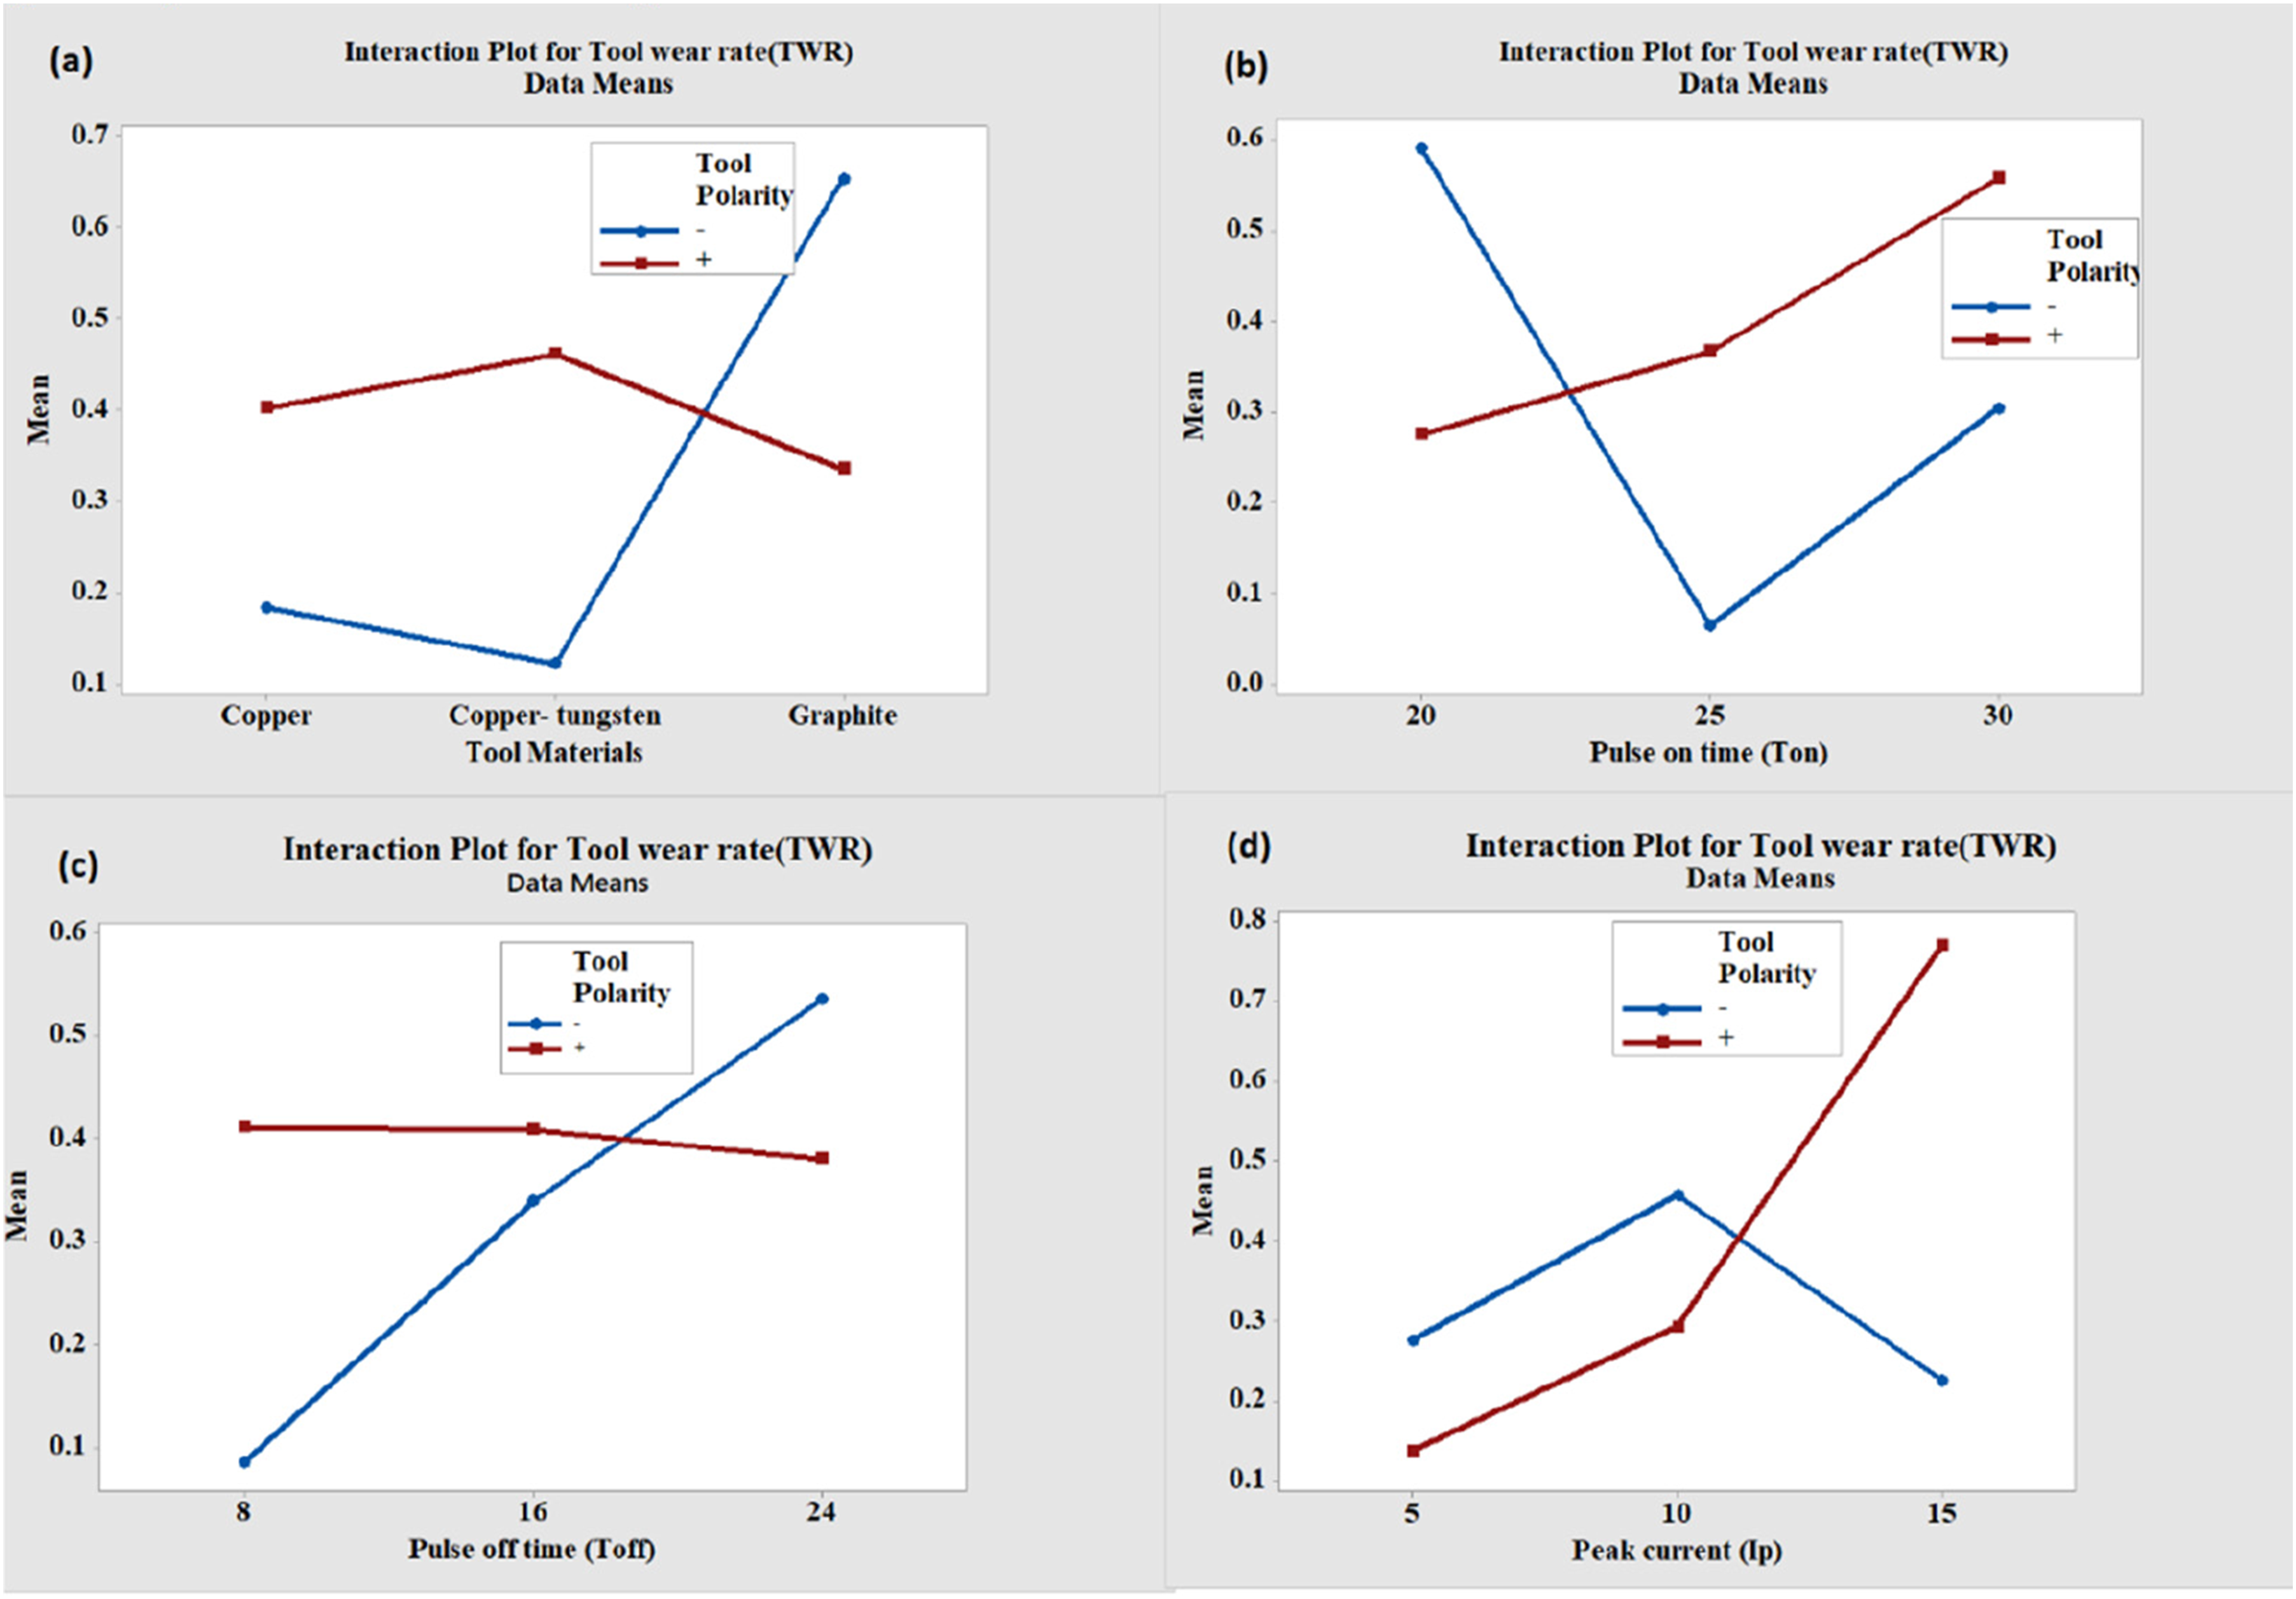
TWR escalates with an increase in T on due to large discharge energy as clearly observed with positive polarity (Figure 4(b)). No significant effect was observed on TWR with increasing T off in positive polarity but in case of negative polarity it increased with increase in T off as shown in Figure 4(c). In negative polarity large amount of heat generation increases the erosion of tool and workpiece materials, which led to increase in TWR during large Toff. The tool material have large time to escape from the machining area on large value of Toff. Figure 4(d) demonstrates that when machining was conducted with positive polarity, an increase in I p (peak current) led to a corresponding increase in discharge energy. This increase in discharge energy subsequently resulted in a higher TWR.
FS-model gives a crisp output for MRR and TWR. Since constant output function is selected therefore this model is called zero-order Sugeno model. In this model Fuzzy rules are used to define the relationship between input and output variables. FS-model rules contain a group of If-Then statements (equation (3)). To observe fuzzy output, fuzzy variable is defuzzified using WTAVEG function. In FS-model, fuzzy logic operator AND method and PROD operator to the fuzzified input value are used. To handle the fuzzy set, an aggregation method SUM is applied. Predicted output from the model was compared with experimental results to evaluate model accuracy. The model accuracy was measured by percentage relative error (RE) using equation (10).
Predicted results for MRR and TWR with relative error percentage using FS-model.

Validation of the model has been carried out by confirmation test results which were performed on optimal input parameters obtained by FS-GRA multi response optimization tool. Larger the value of FS-GRA calculated by equation (9) gives optimal result (Table 3). The input parameters corresponding to experiment no. 16 were considered as optimal input parameters (Negative polarity, Graphite tool, T on -20µs, T off -24µs; I p -10A). Results obtained for MRR and TWR, are 1.38 × 10⁻³ mm3/min and 1.15 × 10⁻³ mm3/min, respectively. Predicted fuzzy model results for MRR and TWR, are 1.190 × 10⁻³ mm3/min and 0.98 × 10⁻³ mm3/min, respectively, having an RE of 12.4% for MRR and 14.5% for TWR. If the RE is less than 15%, the model is considered an effective model.25,35
Normal probability plots for fuzzy predicted values with experimental results are plotted for MRR and TWR (Figure 6). At a confidence level of 95%, the FS-model is normally distributed and close agreement with experimental results. Data is normally distributed in TWR plot, as the p-value is less than 0.005. Mean value (0.399) for the model is close to the experimental mean value (0.36). This suggests that the developed model used to perform the analysis is within a range of experimental process parameters. Normal probability plots (a) for MRR, and (b) for TWR.
3D diagrams show the effect of the input variables on MRR and TWR. Figure 7(a)–(c) show the 3D surface view of FS-model leading to the set of solutions for MRR, whereas Figure 7(d)–(f) for TWR. Figure 7(a) shows that MRR increased in negative polarity with graphite tool whereas minimum effect is shown by CuW tool. Figure 7(b) depicts that an increase in T
on
, MRR decreases. On increasing T
off
, MRR decreased sharply in case of negative polarity (Figure 7(c)). As the polarity change from positive to negative TWR sharply decreased in the case of CuW tool, whereas no significant change was observed in Cu tool (Figure 7(d)). TWR is lowest at negative polarity as shown in Figure 7(e)–(f). From these 3D plots confirmed that developed FS-model was closed agreement with the experimental analysis. Surface plot for MRR and TWR generated by fuzzy interface system model (a) for MRR with tool and polarity, (b) for MRR with T
on
and polarity, (c) for MRR with T
off
and polarity, (d) for TWR with tool and polarity, (e) for TWR with T
on
and polarity, and (f) for TWR with T
off
and polarity.
EDMed surface was observed using FE-SEM and the analysis of surface was performed using ImageJ software, and the results obtained in the statistical form. Sample image of experiment number 1 is shown in Figure 8 as an input for different analysis. The machined surface was highly affected by EDM parameters, and the undesired metal oxides and hydrocarbon are observed in Figure 9(a) and (b). Histogram of selected area in which x-axis showed pixel intensity and y-axis showed the number of particles for particular pixel values (Figure 8(b)). This method was successfully studied by Barreto et al. to count the number of particles (NoP), mean value, and standard deviation using ImageJ software.36,37 To determine the number of particles (NoP) and particle percentage area (PPA), the image needs to adjust the threshold value and then image changed into binary form.15,16 In this work, threshold value was set to be 150–255 to cover maximum pixels of oxides and hydrocarbon for each specimen and the binary image is shown in Figure 8(d). Figure 8(e) shows the effect of different pixel values in the form of 3D image, in this image sky blue colour shows higher pixel values which was also confirmed by the binary image. The analysis was carried out for all specimens and the obtained results are listed in Table 4. FE-SEM image processed by ImageJ software for experiment number 1 (a) 2 mm × 2 mm area sectioned from the centre of the image, (b) histogram of the sectioned image, (c) surface plot of the sectioned image, (d) binary image, and (e) 3D surface with pixel variations. (a) FESEM image, and (b) EDS report, of experiment number 1. Results obtained from DIPT (ImageJ software).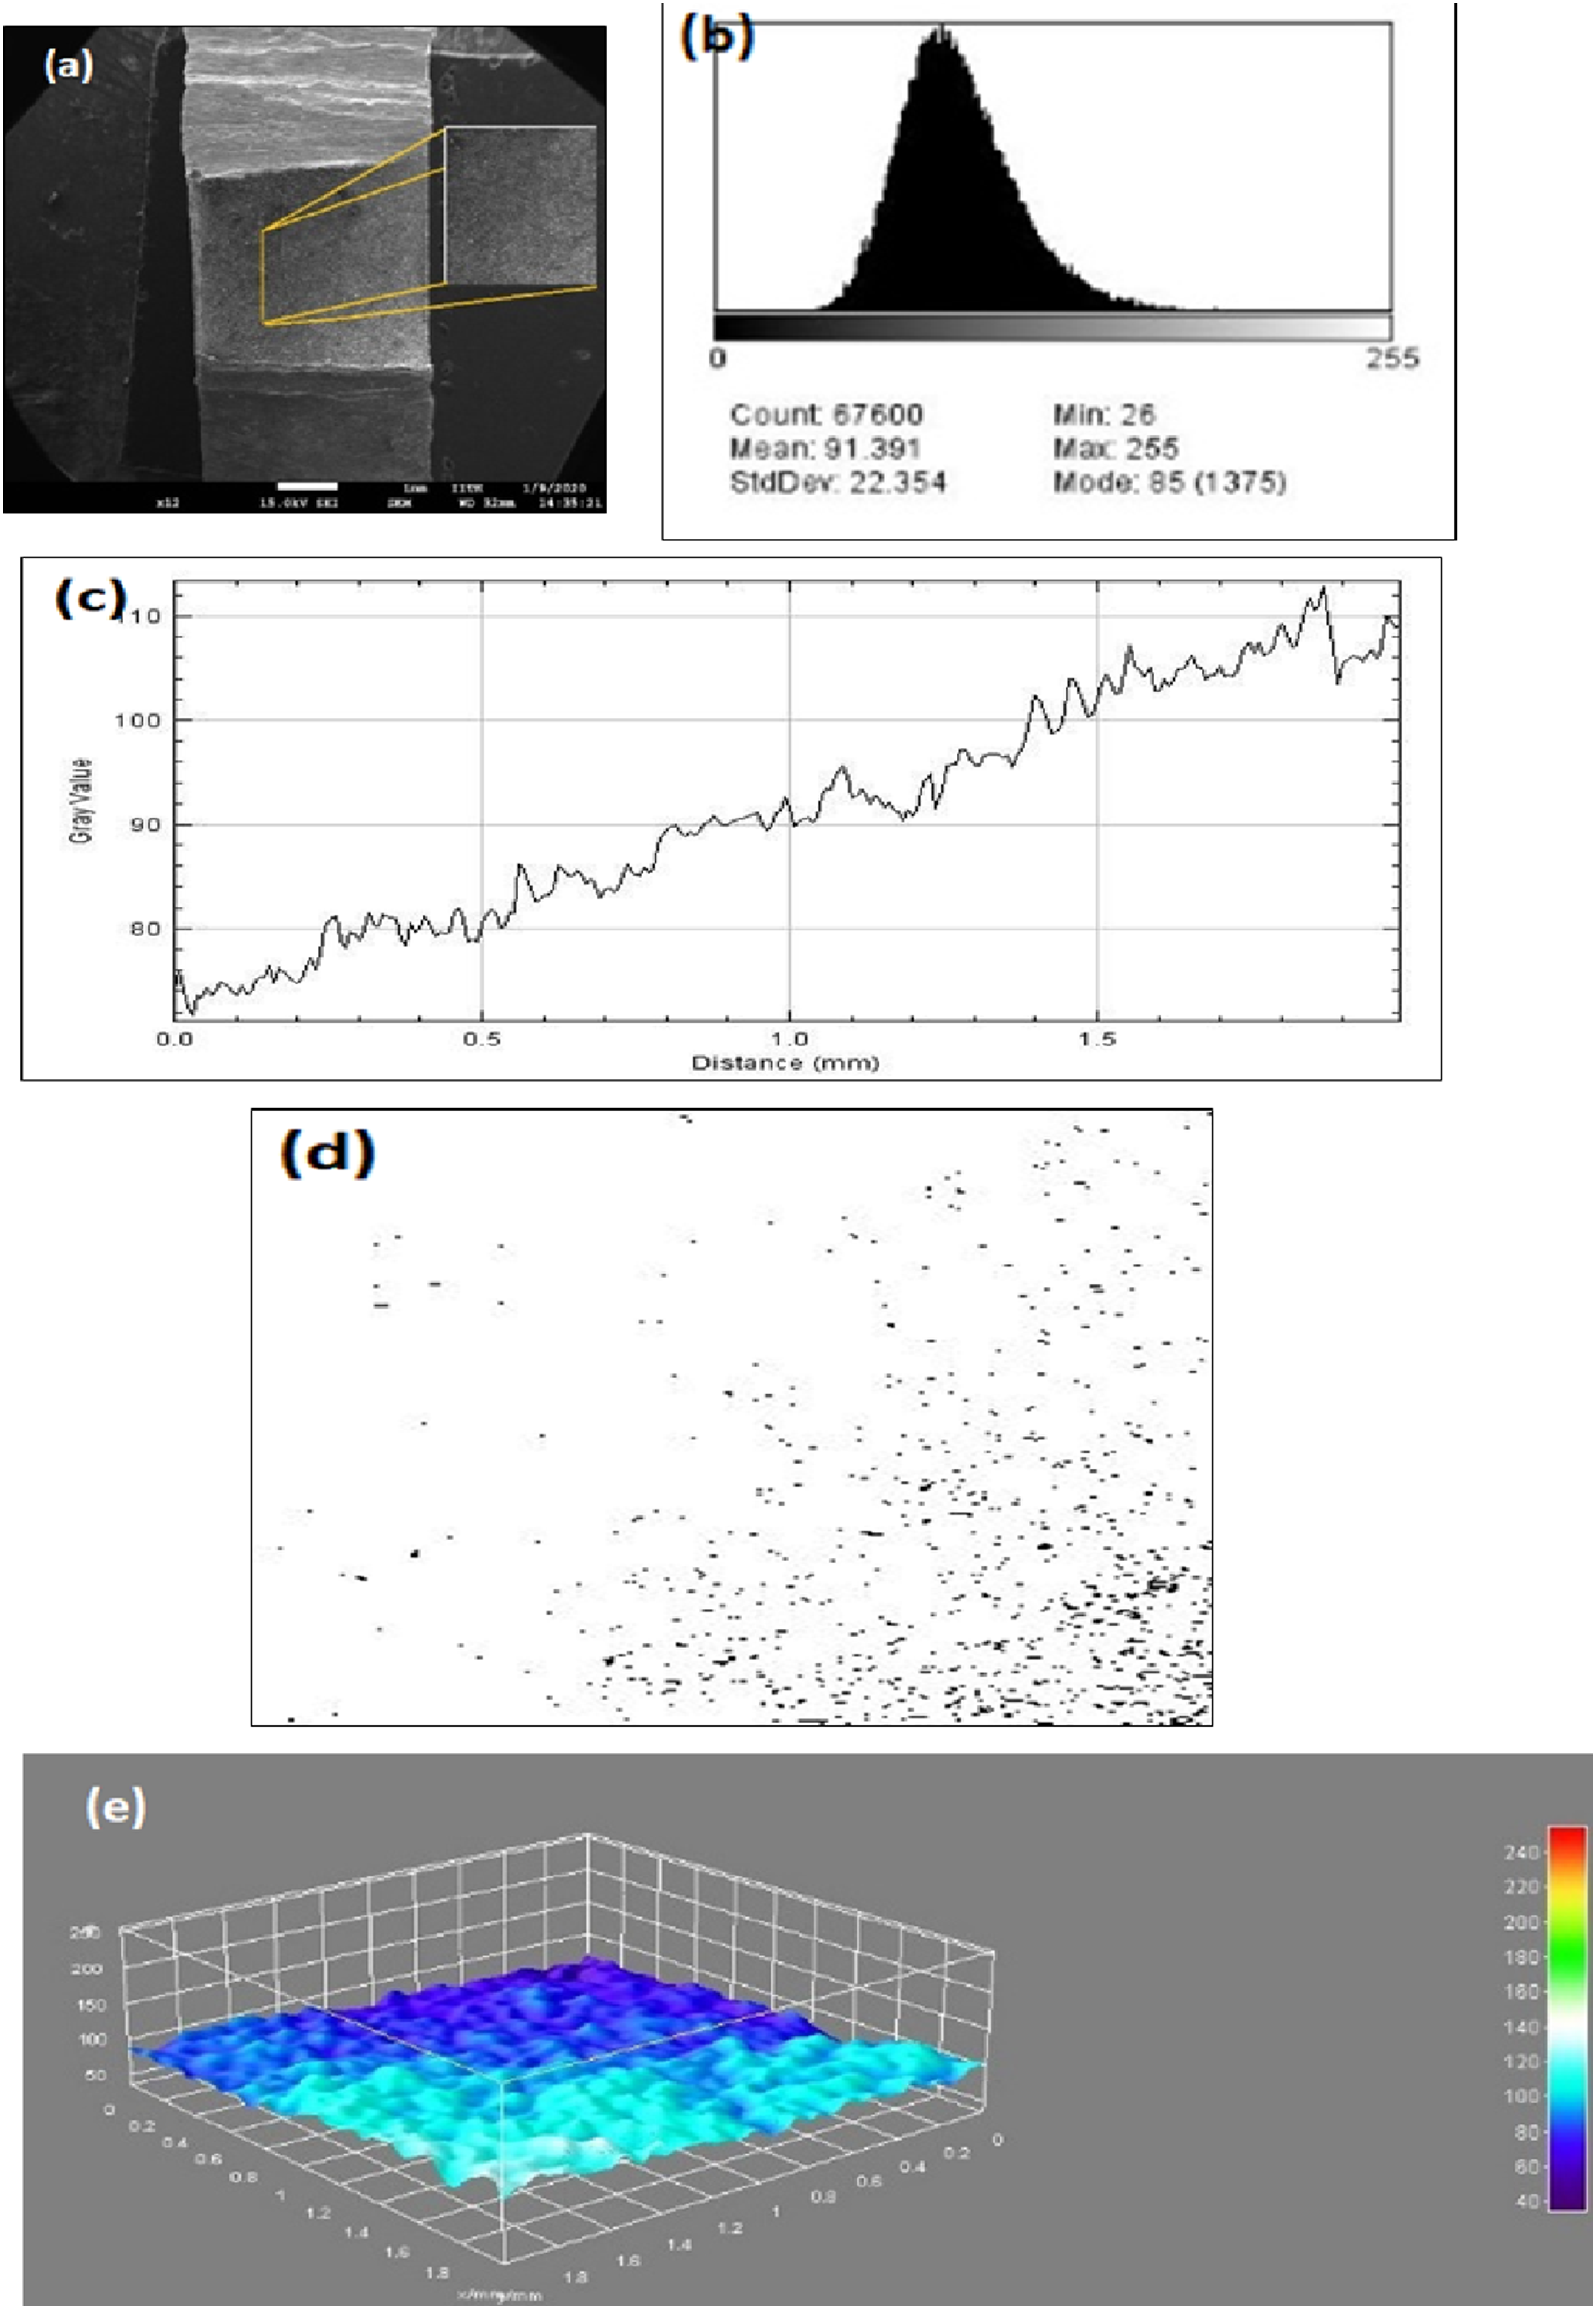


Increase in PPA and NoP reduces the EDMed surface properties, these results follow the same trend as reported by Muthuramalingam and Jothilingam. 8 DIPT results are used as an input to develop FS-model. Total nine experimental data are used to develop the model, and confirmation test is used for validation of the model. In this model, fuzzy input sets and membership functions are the same as shown in Figure 2.
Predicted DIPT results using Fuzzy Sugeno model.

Validation test has performed on confirmation test results at optimal input parameters (Negative polarity, Graphite tool, T
on
-20µs, T
off
-24µs; I
p
-10A). Results obtained from DIPT show NoP 402 and PPA 1.211. Predicted FS-model results for the NoP and PPA are 374.88 and 1.18, respectively. 3D surface plots using predicted data of DIPT FS-model are depicted in Figure 10. An increase in NoP consecutively increased the PPA. Properties of machined surface decrease on an increase in PPA. Figure 10(a) shows a tremendous increase in the PPA on changing the polarity (positive to negative). In Figure 10(b), with negative polarity PPA increased on increase in T
on
and the same trend was followed in the case of T
off
(Figure 10(c)). Average percentage RE is 6.75% for the NoP and 2.88% for PPA. Thus, the model is considered as an effective model. 3D surface plot for PPA with (a) tool and polarity, (b) T
on
and polarity, and (c) T
off
and polarity.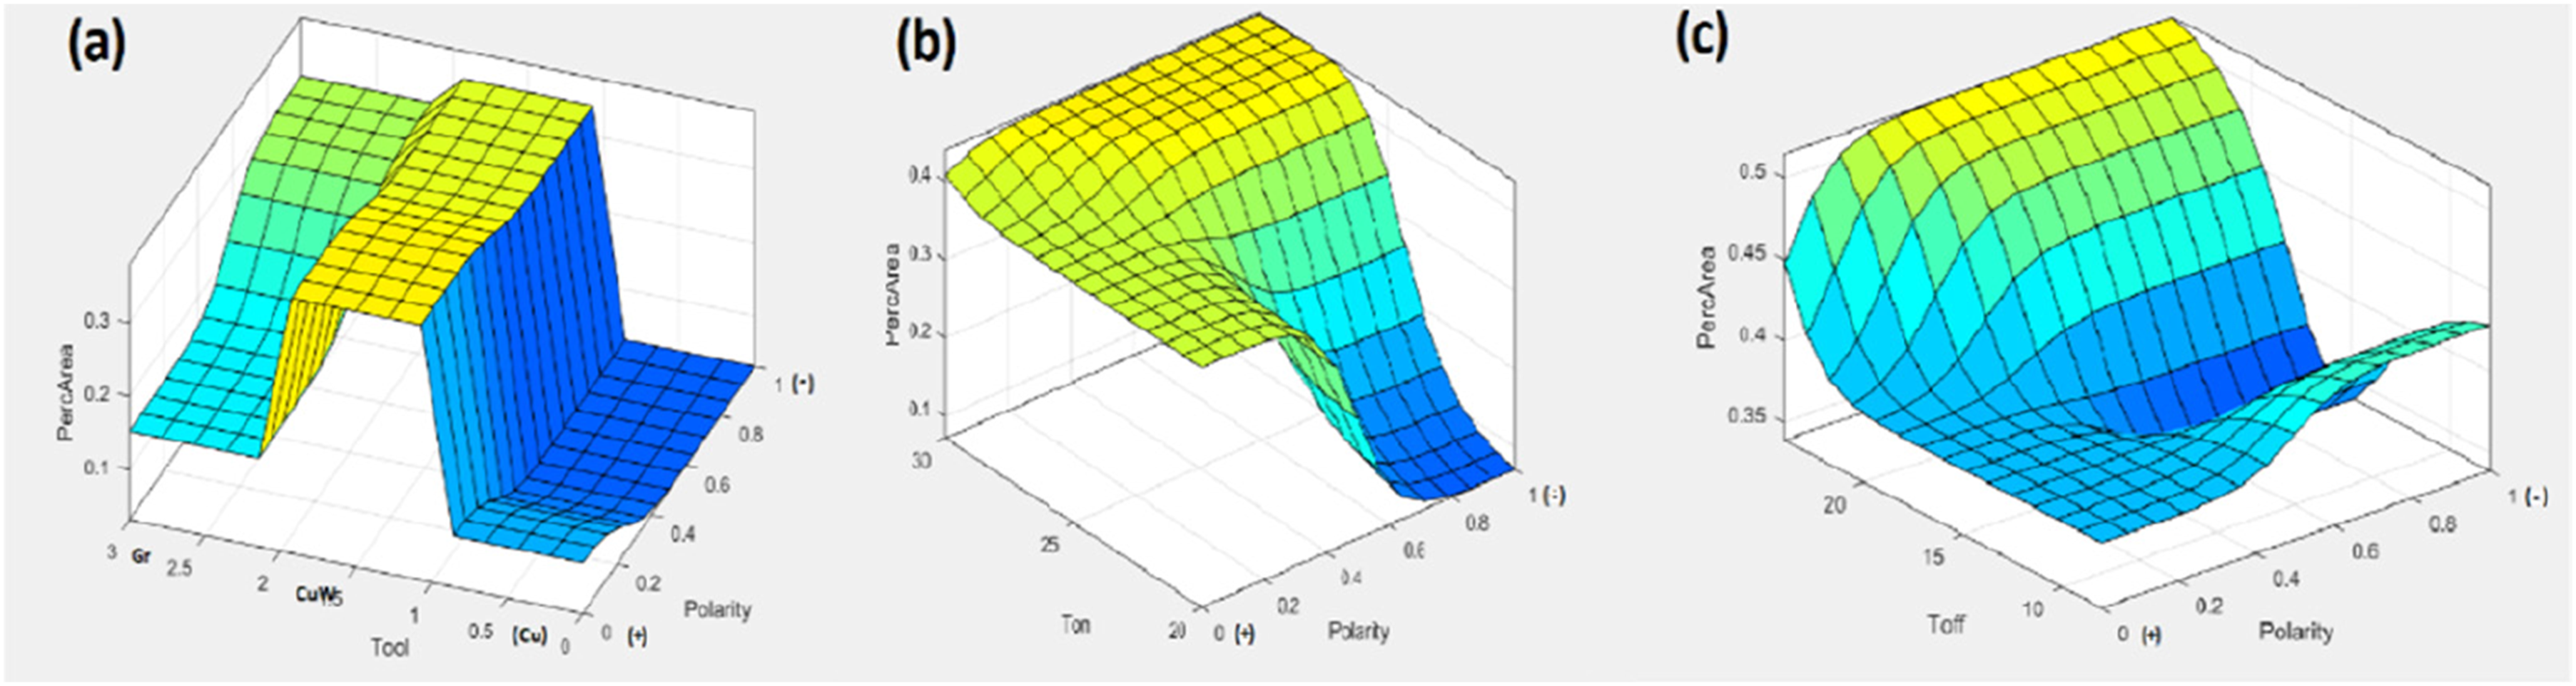
Fuzzy-Sugeno model predict responses MRR (maximum) and TWR (minimum). Grey relation analysis (GRA) method is used to convert multiple responses in to single response in the form of GRG.38,39 Predicted responses (MRR and TWR) are utilized as an input in GRA. After following some basic steps, GRG was calculated using equation (9) and calculated values of GRG are tabulated in Table 3. Figure 11 shows the plot of GRG with experiment numbers. High GRG means the value is near to 1 and response corresponding to this will be optimal. During machining, EDM response MRR required maximum whereas surface roughness (SR) minimum. High GRG gives a compromise solution in case of conflicting criteria in EDM response, and it means EDM performance is better than other experimental runs. In this study, the optimal response (high GRG value) corresponds to experiment number 16. Plot for FS-GRA result (GRG) with experiment number.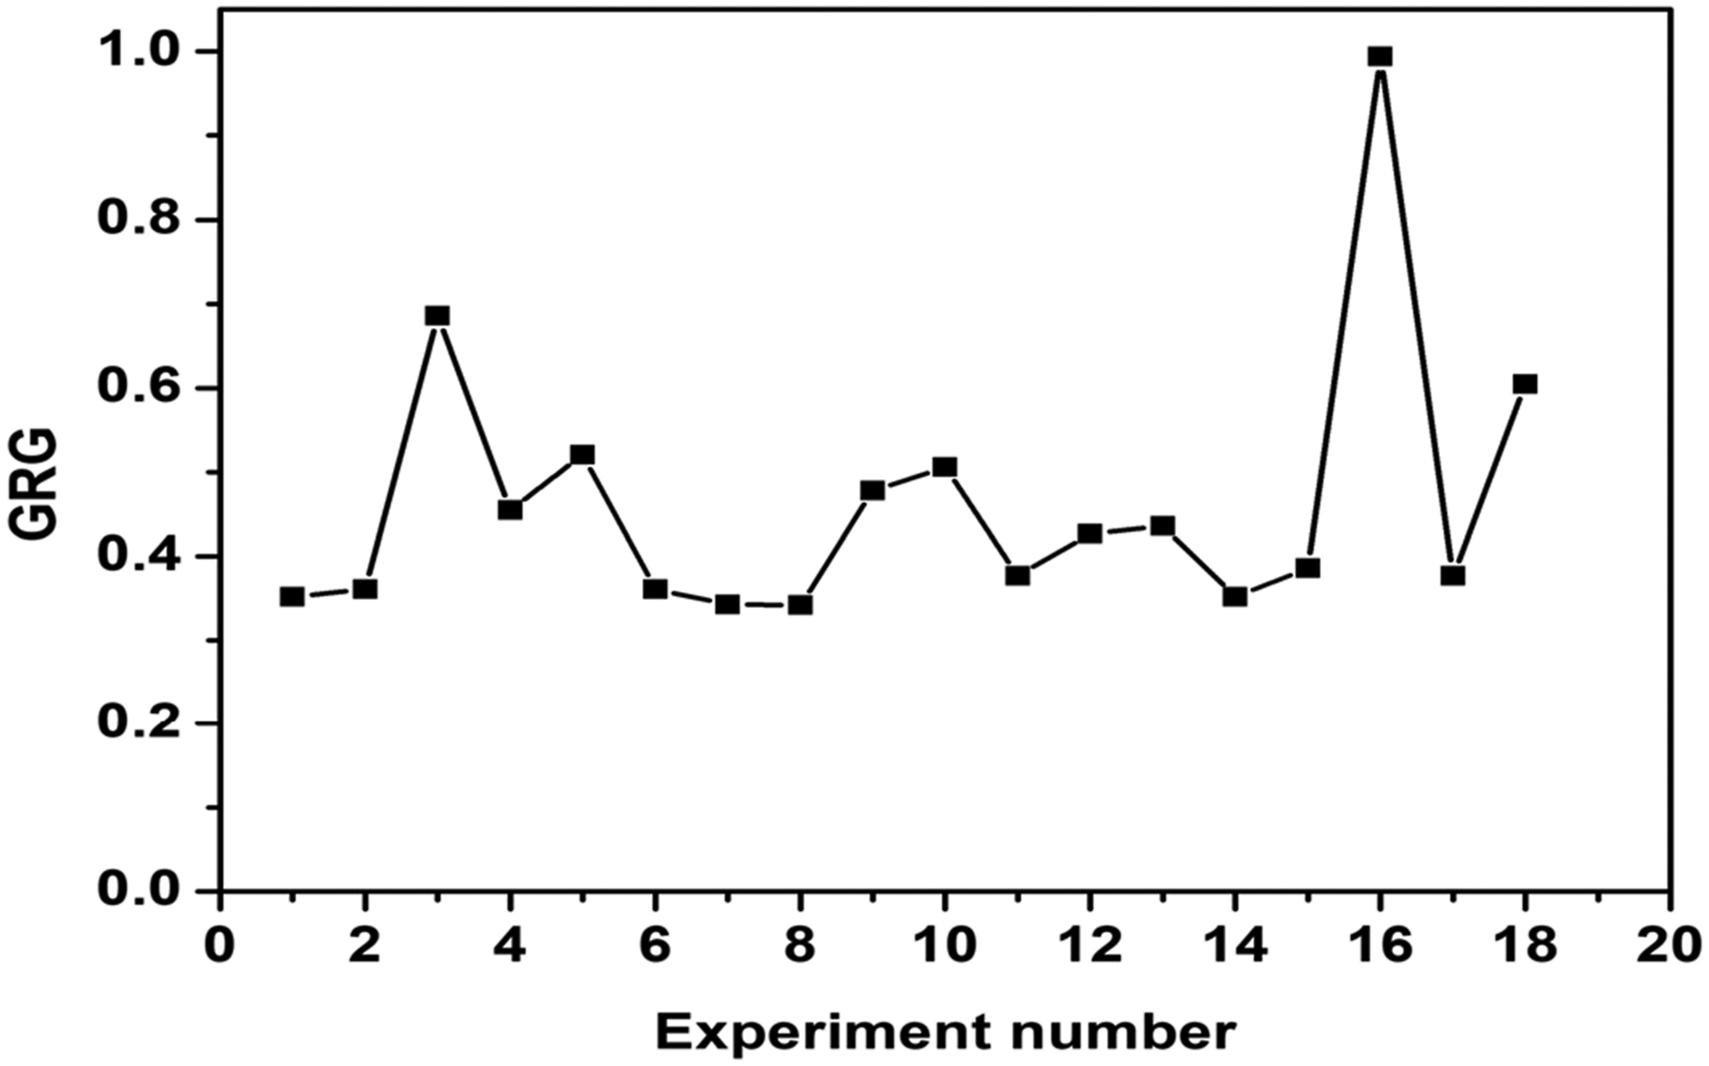
Conclusions
In this work, the machining of Zircaloy-2 was performed on EDM as per L18 design using different process parameters. FS-model was developed to predict MRR and TWR in the context of machining responses. Analysis of surface was performed using DIPT (ImageJ software), and FS-model was developed to predict NoP and PPA. • Maximum MRR 1.53 × 10⁻³ mm3/min was observed at negative polarity when the machining was performed using graphite tool electrode. • Tool wear rate was escalates with an increase in Ton due to large discharge energy. • The developed FS-model was successfully implemented to evaluate MRR and TWR, NoP, and PPA. • The developed FS-model has high potential to predict results and the model accuracy was found to be 94% for MRR and TWR, and 92% for NoP and PPA. • Implementation of multi response optimization technique Fuzzy Sugeno-GRA gives optimal result in case of conflicting criteria and predicts optimal response corresponding to high value of GRG. • FS-GRA model gives optimal response at negative polarity, graphite tool, T
on
-20µs, T
off
-24µs, and I
p
-10A (process parameters).
Footnotes
Acknowledgements
Authors thanks to Department of Mechanical engineering, and Electronics and communication engineering of BIET Jhansi for their continuous support.
Author contributions
In this work conceptualization and methodology was developed by Jitendra Kumar and Tarun Soota, and graph plotting (software) by Prachi Sachan. Reviewing and editing was done by S.K. Rajput and K.K. Saxena.
Declaration of conflicting interests
The author(s) declared no potential conflicts of interest with respect to the research, authorship, and/or publication of this article.
Funding
The author(s) received no financial support for the research, authorship, and/or publication of this article.