
Abstract
With the increasing application of composite components in various industries, the assessment of their structural integrity, the analysis of damage processes, and the identification of damage patterns are becoming increasingly important. The accuracy of the analysis relies heavily on the selection of features. This paper presents a new idea to extract effective damage features from acoustic emission (AE) signals and accurately identify different damages in the failure process of carbon fiber reinforced polymer specimens. The method combines Hilbert–Huang transform (HHT) and Linear Discriminant Analysis (LDA) to analyze the AE signals generated during the damage process of composite specimens. Specifically, the Hilbert marginal energy spectrum of the signals was regarded as frequency domain descriptors. The frequency domain descriptors were subsequently associated with the parametric features after dimensionality reduction by LDA to construct the classification framework named HHT-LDA. The results show that the frequency domain descriptors of the AE signals associated with each damage mode characterized distinctly. The frequency band of energy distribution in the raw waveform for matrix cracking, delamination, and fiber breakage are (100–150 kHz), (150–300 kHz), and (300–350 kHz), respectively. In addition, the three damage patterns mentioned above were successfully detected and recognized from the complex AE waveforms using HHT-LDA with 85% overall classification rate. This research idea will serve as a potential method for future composite damage pattern recognition and provide supporting knowledge for practical applications of AE monitoring.
Keywords
Introduction
With the growing demand for lightweight components across multiple industries, more and more emerging composites come into sight. Carbon fiber reinforced plastic (CFRP) has shown excellent mechanical properties in practical structural applications in addition to meeting the demand for lightweighting. For example, CFRP is already planned to replace certain automotive parts. It has been shown in the literature that CFRP bumpers outperform conventional high-strength steel beams both in terms of energy absorption capacity and dynamic response characteristics. In addition, its weight has been significantly reduced by nearly 50%. 1 It has also been documented that carbon fiber composites B-pillars has excellent collision resistance, by analyzing its energy transformation and deformation during collision. More importantly, the mass of the carbon fiber composites B-pillars is reduced by 50.76% relative to the conventional metal material for the same dimensions. 2 For wind turbine blade material selection, the researchers compared traditional metal materials with fiber-reinforced materials. After balancing material accessibility, material price, and production costs, composite wind turbine blades were considered the best due to their high toughness, low density, and extended service life. 3 Recently, composite components have also been used for restraints and non-primary load-bearing sections in amusement rides. Considering the mass of the metal press bar and the difficulty of detecting internal corrosion in time, the researchers prepared a carbon fiber lap bar structure and carried out destructive experiments, which showed that the ultimate load of the new carbon fiber press bar meets the standard requirements, and the weight is reduced by about two-thirds. 4
Quality control and monitoring are necessary to ensure the safe operation of engineering structures, including bridges, aircraft, large amusement facilities, etc. To date, nondestructive testing techniques such as passive infrared thermography, 5 acoustic emission (AE) technology, 6 and the vibro-acoustic modulation (VAM) method 7 have widely used in health monitoring for structures during operation. However, the interlaminar properties of CFRP are relatively weak and the damage mechanism is complex compared with traditional metal materials. Currently, AE technology is widely used in composite failure assessment. The advantage of AE technology lies in the ability to continuously and dynamically monitor stress waves excited by microstructural changes within a structure under internal or external loads. In addition, AE signals are not only generated from structures, but also from electrical interference and friction. 8 Therefore, establishing a link between the AE signal and the damage pattern of the material and correctly distinguishing the damage pattern remains a focus of attention.
Machine learning has been widely used to process AE signals. 9 The main objective is to reduce the data dimensionality, increase the computational efficiency, and establish the mapping between parameters and labels. 10 It can be divided into supervised and unsupervised learning by whether it contains labels or not. Unsupervised learning is mainly based on clustering, which analyzes the similarities between data clusters, but studies have shown that different clustering algorithms may result in data being assigned to different clusters.11,12 Supervised learning aims to establish the intrinsic connection between labels and features through certain guidelines; thus, the selection of features plays a crucial role in the accuracy of classification models. 13
AE parameters are simplified waveform feature, and most studies have focused on establishing a link between a single parameter or set of parameters and the damage pattern of composite. Saeedifar et al. 14 carried out three-point bending test on carbon-epoxy laminates after impact at different temperatures and used AE technology to monitor the process. The AE signals were classified into three clusters, from low to high frequency associated with matrix cracking, delamination, and fiber breakage, respectively. Li et al. 15 combined AE technology and optical observation to analyze AE signals during stretching of plain glass/epoxy laminates. The AE events were classified into low frequency–low amplitude, low frequency-high amplitude, and high-frequency cluster based on the amplitude and peak frequency of AE signals, which were associated with matrix cracking, delamination, and fiber breakage, respectively. In addition, Ding et al. 16 carried out tensile test on carbon fiber bundle and laminate specimen, which showed that the AE signals of the three damage modes, matrix cracking, delamination, and fiber fracture damage, were characterized by different combinations of rise time, count, energy, duration, and amplitude.
Considering that the increase of the distance from the source to the sensor leads to the attenuation of the amplitude of the AE signal, a considerable number of researchers start from the original waveform and extract new frequency domain descriptors of the AE signal. New descriptors obtained from the original waveforms are used to develop damage pattern recognition models. Su et al. 17 developed an image-based structural health monitoring system using AE signal analysis and deep learning. The AE waveforms were transformed into time-frequency scalograms by continuous wavelet transform (CWT) to characterize different damage modes, which were used as inputs to a Convolutional Neural Networks (CNN) model, and the confusion mean of the model shows that the proposed structural health monitoring system has the ability to classify different damage patterns with high accuracy. Hamdi et al. 18 used HHT to extract new relevant damage descriptors, defined as the higher part of the signal, which is the average frequency of the first eigenmode function, for damage pattern recognition. The new descriptors help to understand the damage process of unidirectional glass fiber reinforced polymer composite specimens. Qiao et al. 19 carried out wavelet packet decomposition (WPD) of the AE signals collected during the three-point bending test of CFRP specimens and defined the ratio of the component energy as a feature to distinguish different damage modes. The SVM classification model built by combining energy features and parameter features provided satisfactory classification results. Chai et al. 20 proposed a new method in order to investigate the AE signals generated from the intergranular, which combines Ensemble Empirical Mode Decomposition (EEMD) and linear discriminant analysis (LDA). The results show that the features of the AE signals were effectively extracted during the corrosion monitoring process and the environmental noises, the intergranular corrosion, and the formation and propagation of cracks were successfully identified via this method.
In this work, in order to achieve the goal of efficient and convincing composite damage pattern recognition, a classification model based on the combination of waveform analysis and LDA is developed. The characteristics of AE signals related to typical failure modes of composites were investigated by loading tests on pure resin, fiber bundle, and laminated specimens. The frequency domain descriptors obtained from the HHT are associated with the parameters after dimensionality reduction by LDA, and the classification model is built. Subsequently, the performance of the classification model is evaluated in practical use. The idea of this work is shown in Figure 1. The idea of the study.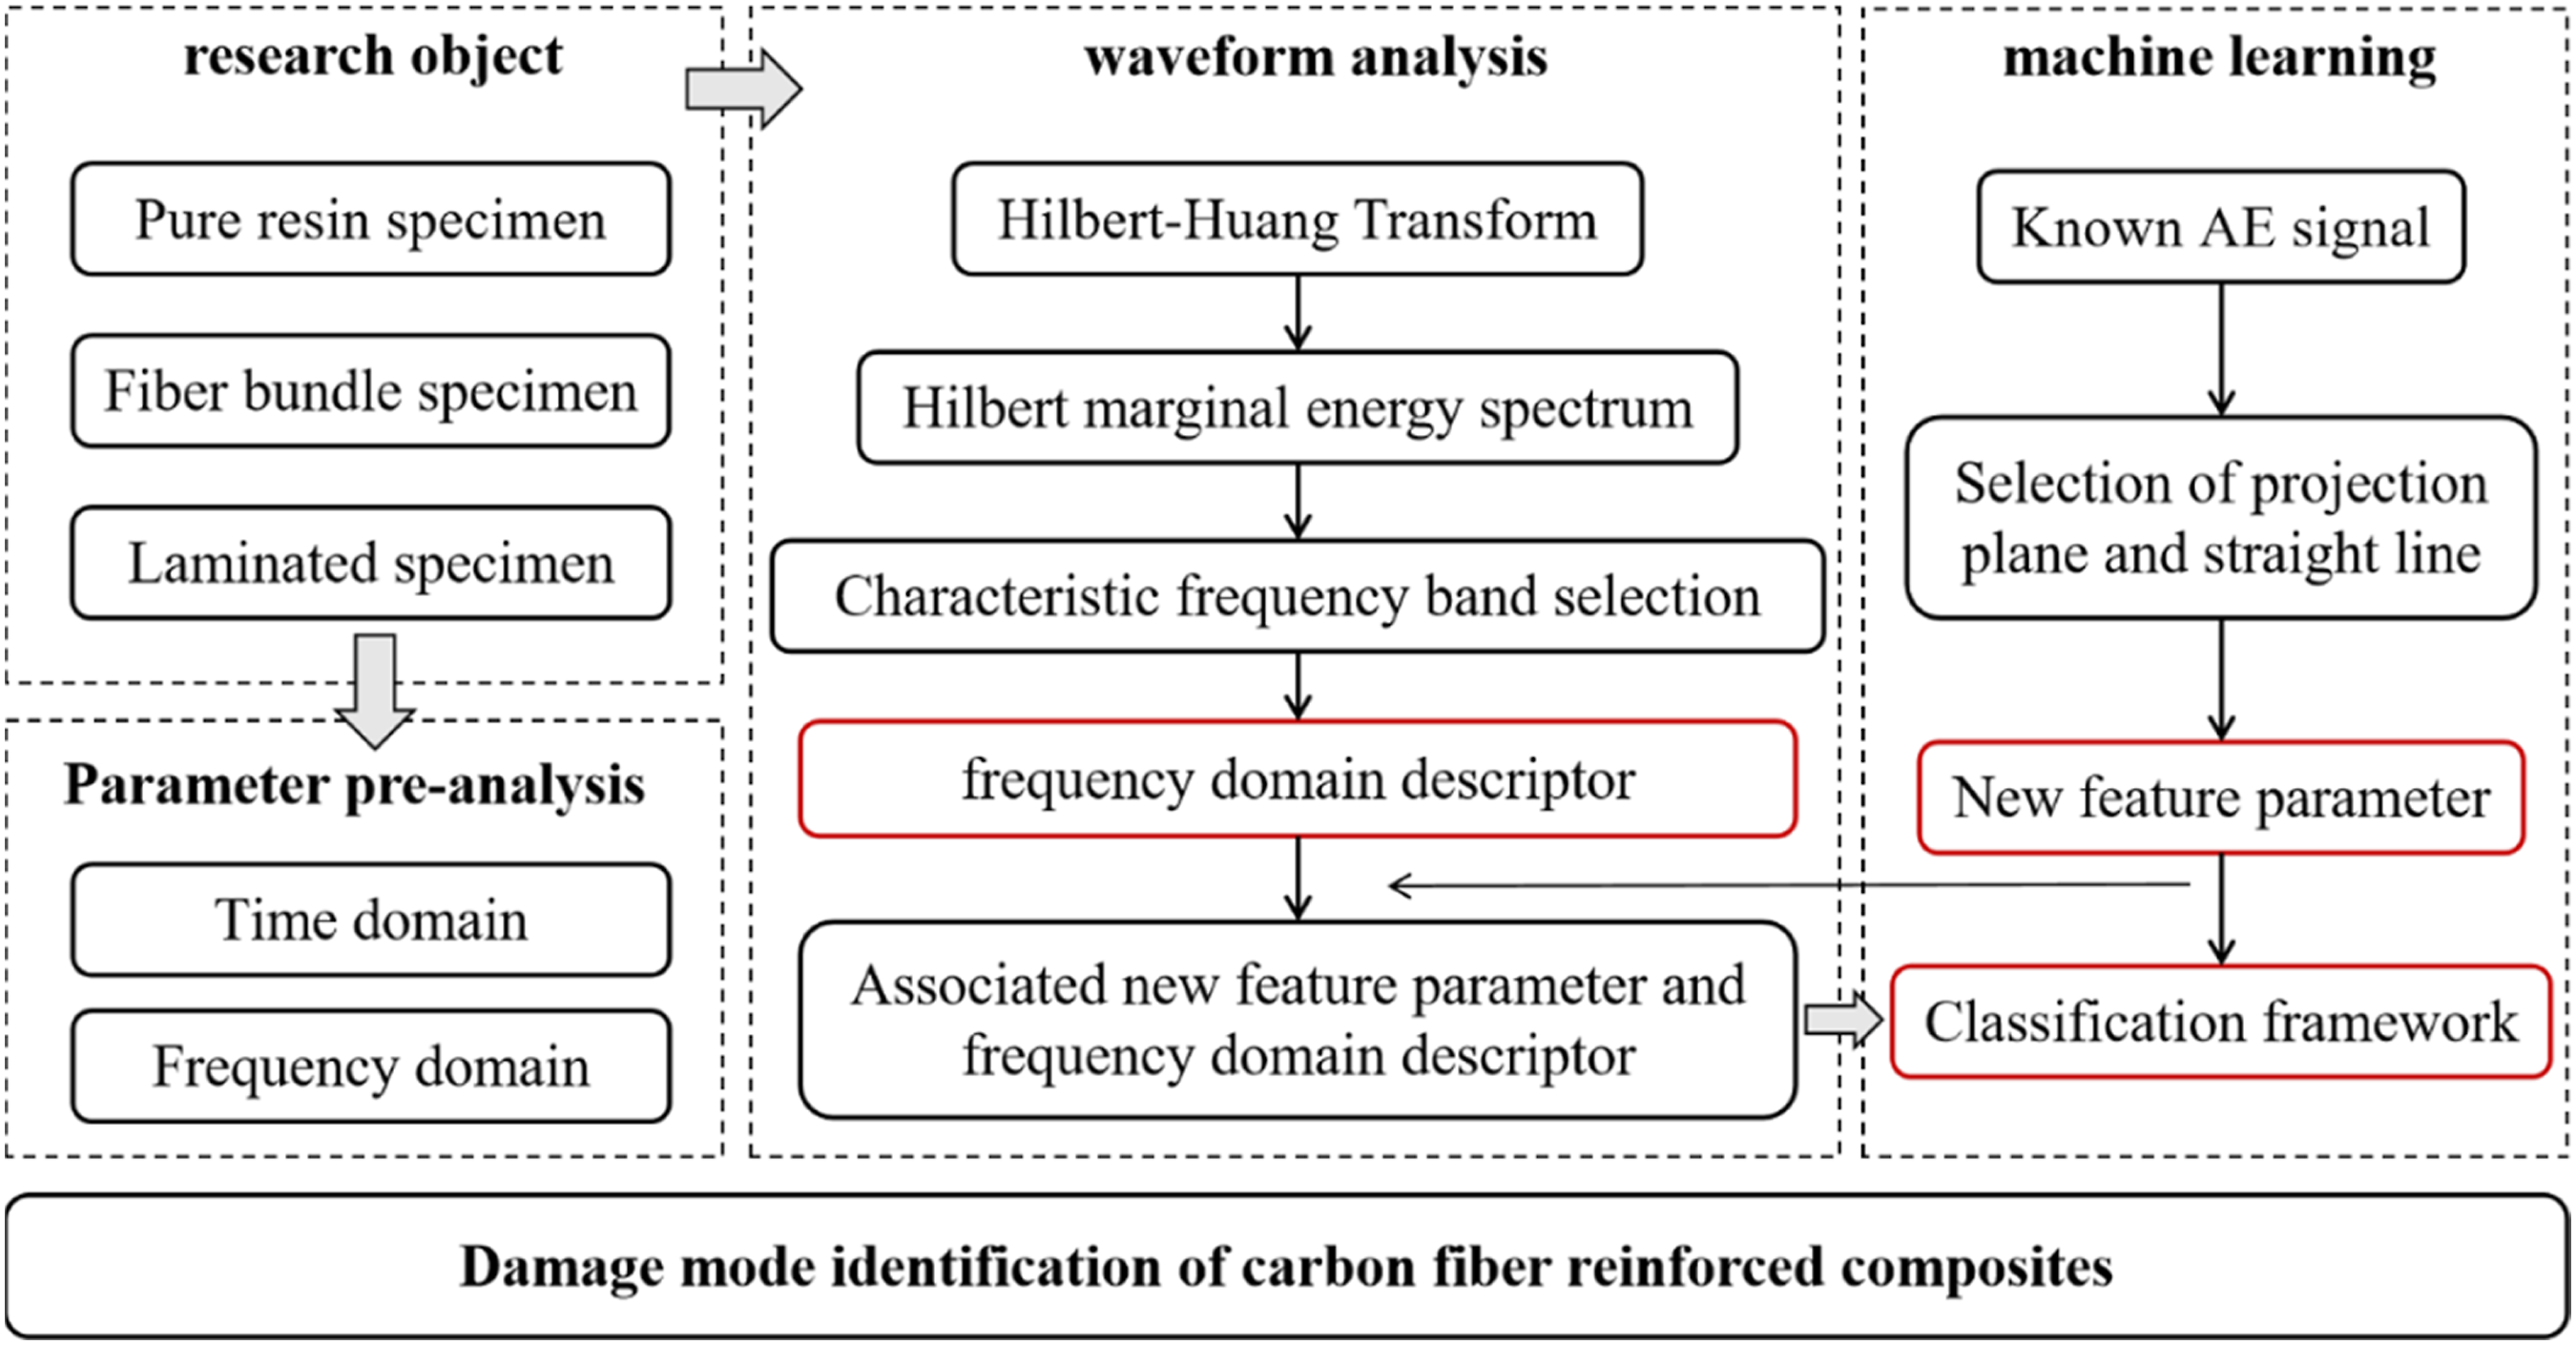
Experimental procedure and methods
Materials and specimens
In order to investigate the characteristics of AE signals related to the damage modes of CFRP specimen as well as to establish a damage pattern identification model, pure epoxy resin specimen, fiber bundle specimen, and laminated specimen with dimensions of 150 mm × 30 mm × 6 mm were prepared in this study. Pure resin specimens were made from a mixture of epoxy resin (SWANCOR 2511-1A) and curing agent (SWANCOR 2511-1B) in a mass ratio of 100:30 cured in a mold. The epoxy resin and curing agent were provided by Swancor Advanced Materials Co., Ltd. The carbon fiber plain fabric was laid up in the sequence of [±45]s, accumulate 40 layers, which was provided by Beijing Glass Research Institute Co., Ltd. The fiber bundle specimen consists of an aluminum sheet and one fiber bundle, which is coated with epoxy resin and sandwiched between two aluminum sheets at the ends of the fiber bundle. Carbon fiber bundle stripping from carbon fiber fabric was supplied by Shanghai Shekou Industrial Co., Ltd.
Experimental equipment
Tensile test was conducted on resin specimen and fiber bundle specimen, while three-point bending test were carried out on laminated specimen. It is worth noting that two specimens of each type were prepared and tested under the same conditions. The loading rate is set to 1 mm/min. Two sensors, named VS900-RIC, were employed to capture elastic wave excited by damage. In addition, the sensor has an optimal operating frequency band of 100–900 kHz. It also has a built-in 34db amplifier. For epoxy test loading, the sensors are fixed at a distance of about 30 mm from the ends, while loading the fiber bundle specimens, the sensors were fixed on reinforced aluminum sheets, likewise at a distance of about 30 mm from the ends. However, in the three-point bending experiment, the span was 80 mm and the sensors were fixed at both ends of the carbon fiber specimen. The AE signals generated by the specimen under tensile and bending loads were captured by the transducer and recorded by an AE instrument (DS2-8A), recorded signals include full-time waveforms and characteristic parameters. The values of peak definition time (PDT), hit definition time (HDT), and hit lock out time (HLT) parameters were set to 30 μs, 150 μs, and 300 μs in the tests, respectively.
21
The threshold and sample rate were set to 5 mv and 1 MHz. Application of silicone grease avoids poor coupling between sensors and specimen. The schematic diagram of the experimental setup and specimen is shown in Figure 2. All loading tests were carried out on an electronic universal testing machine (LD24). The schematic diagram of the experimental setup and specimen.
Linear discriminant analysis
Linear Discriminant Analysis (LDA) is a supervised learning method for dimensionality reduction, which is widely used in data dimensionality reduction, pattern recognition, and task classification. 22 The main idea of LDA is to project the data from the higher space to the lower dimensional space, ensuring that the intra-class variance is minimized and the interclass variance is maximized after projection. LDA is fundamentally different from Principal Component Analysis (PCA) and Independent Component Analysis (ICA). PCA aims to find orthogonal, uncorrelated principal components, 23 while ICA specializes in finding independent components. 24 Whereas the LDA method we use belongs to supervised learning, which needs to know the class of data in advance. The steps of the algorithm are as follows:
Let the training set (1) Calculate the intra-class scatter matrix as shown in equation (1). (2) Calculate the interclass scatter matrix as shown in equation (2). (3) Computational matrix (4) Calculate the eigenvalues and eigenvectors of the matrix (5) For each sample feature


Hilbert–Huang transform
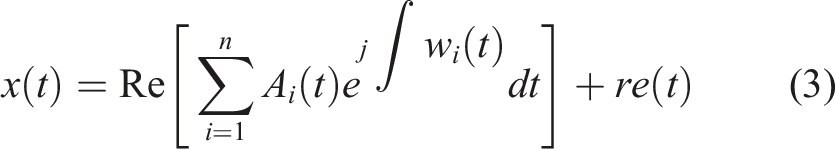
The purpose of the Hilbert transform is to decompose an arbitrary signal especially a nonsmoothed nonlinear time series signal into a linear steady state signal. The HHT analysis consists of two parts, the first part is the Empirical Modal Decomposition (EMD), the original signal is decomposed into a number of Intrinsic Mode Functions (IMFs) and a residual component. Each IMF represents the oscillatory variations in different frequency bands of the original signal, reflecting the local characteristics of the signal, while the final residual component reflects the slowly changing components of the signal. The EMD decomposition flowchart is shown in Figure 3. The second part is the Hilbert spectral analysis. The HHT is employed for each IMF sequence acquired from the EMD and calculate each instantaneous frequency of the IMF. The original signal can be expressed by equation (3): Flowchart of EMD.
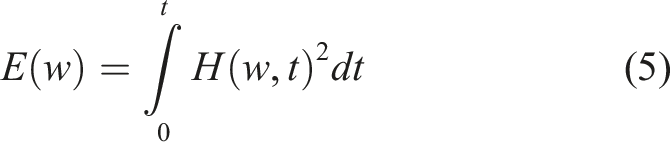
The frequency-time distribution of the amplitude is defined as the Hilbert spectrum

The Hilbert marginal energy spectrum (HMES)
More information about HHT can be found in the study by Zhao et al. 25
Results and discussion
Acoustic emission signal analysis
Summary of frequency distributions of signals with different damage modes.

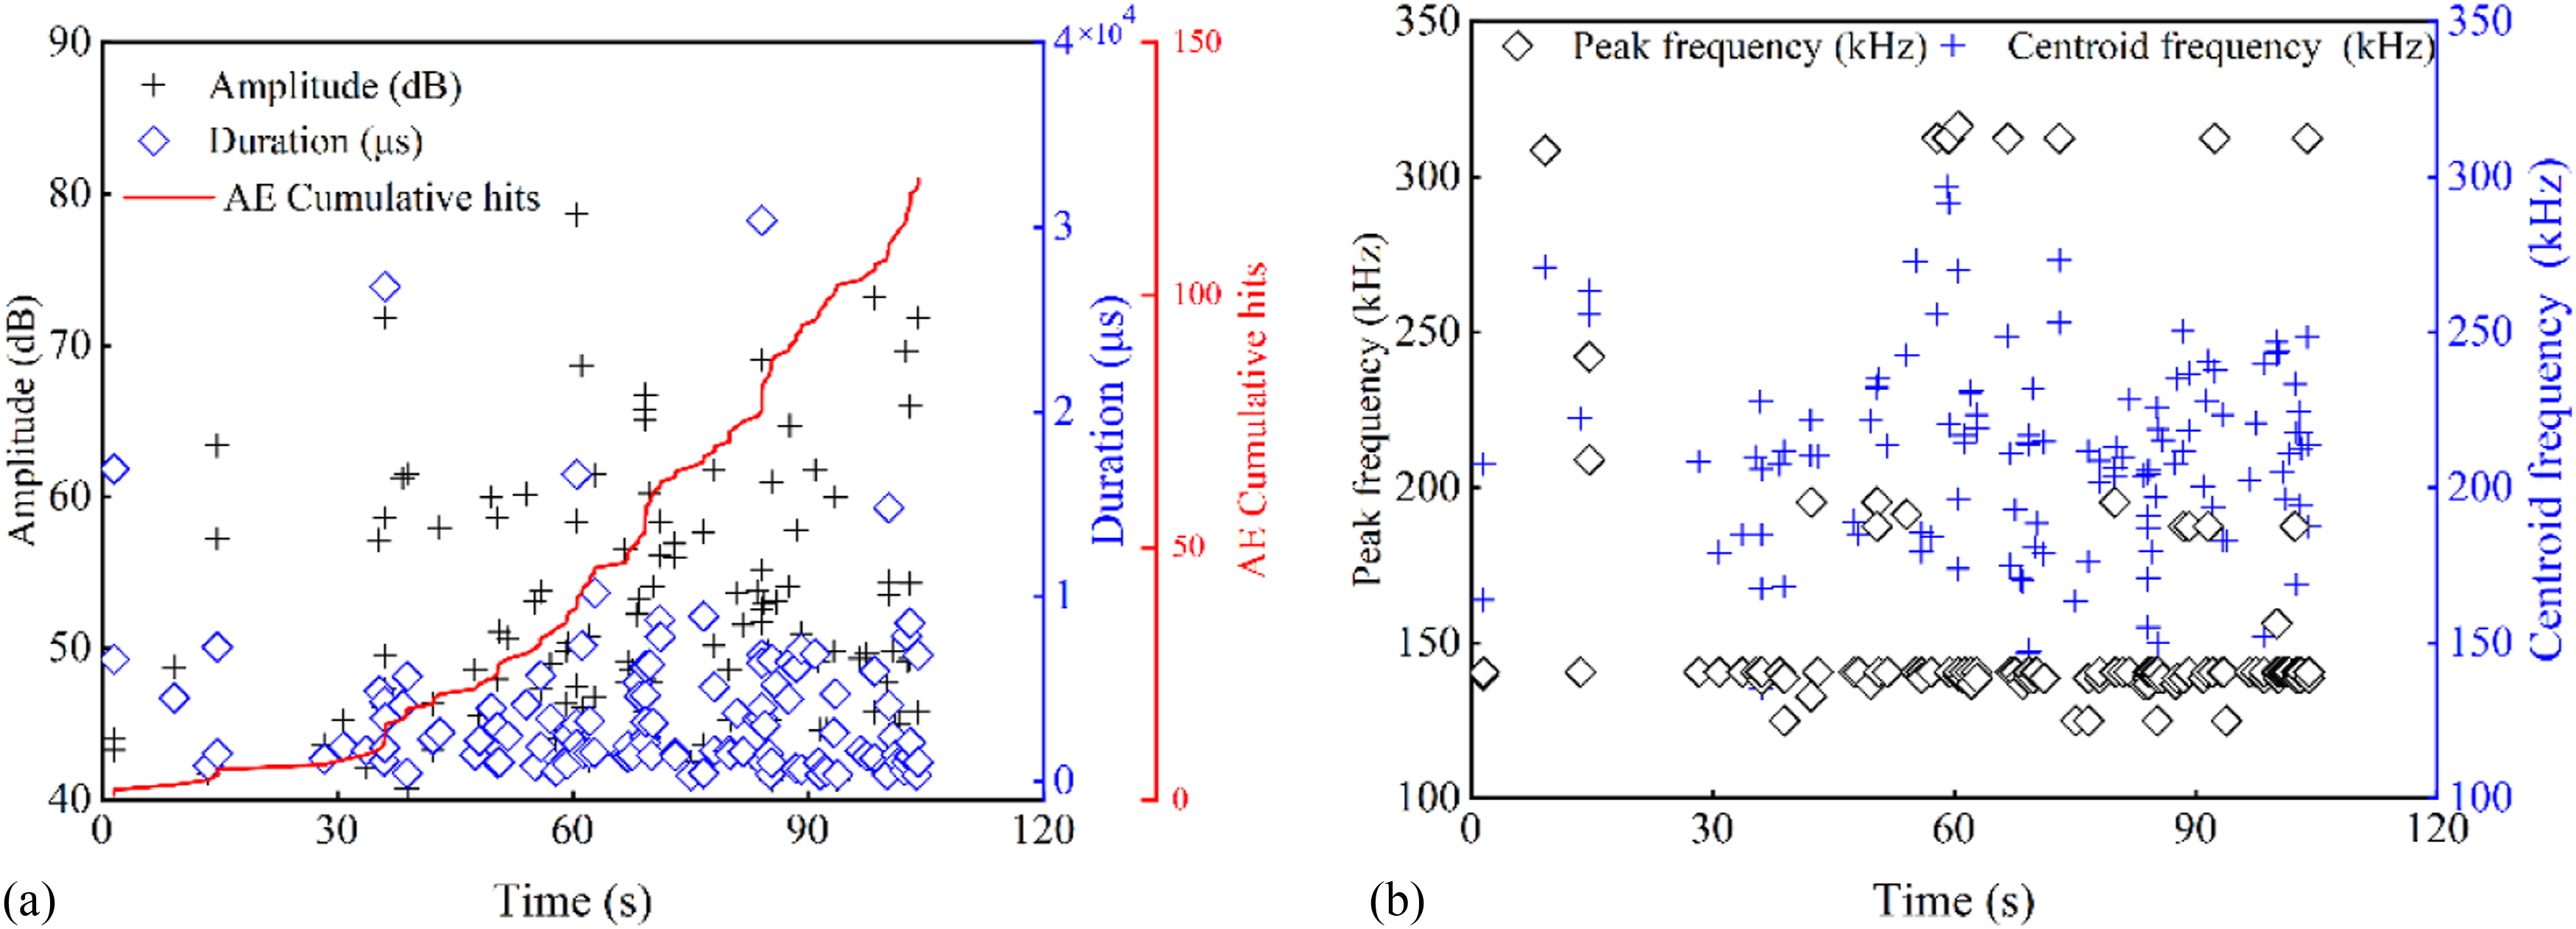
AE signal distribution of pure resin specimen. (a) Time versus AE cumulative counts and amplitude. (b) Time versus peak frequency and centroid frequency.
Figure 5 depicts the AE response of the carbon fiber bundle specimen during the tensile test. Since the carbon fiber bundle specimen was prepared using epoxy resin as the bonding material, AE signals associated with matrix damage occurred during loading. As shown in the Figure 5(a), more long duration signals appear, because at the early stage of loading, the carbon fiber bundles were not fully stretched, so it is also difficult to avoid the signal generated by the friction between fiber bundles during the loading process. As the load increases, each fiber filament was subjected to a different state of stress, so fiber damage appeared every moment. As can be seen from Figure 5(b), during the loading period, the peak frequency of the AE signals was mainly concentrated in the low- and high-frequency range. Moreover, most studies have shown that high-frequency AE signals are associated with fiber failure.28–30 The frequency band in which the centroid frequency is mainly distributed is also different from that of the pure resin specimen, moving to a higher frequency band. AE signal distribution of fiber bundle specimen. (a) Time versus AE cumulative counts and amplitude. (b) Time versus peak frequency and centroid frequency.
As can be seen from Figure 6(a), very few AE signals were captured in the preliminary stage of the three-point bending test for the laminated specimen, and the cumulative number of hits curve rises slowly. At this stage, the bottom surface of the specimen firstly produces micro-cracks, leading to the generation of low frequency–low amplitude AE signals. As the load increases, the cumulative number of hits increases substantially in a short time. As the crack expands, delamination and fiber breakage occur one after another, which are indicated by multiple AE sources appeared. Until the specimen fails, the ultimate load capacity of the laminated specimen under bending load is about 7.5 kN, and the crossheads drop by about 3.5 mm. From Figure 6(b), during the loading period, the AE signals were still dominated by low- and high-frequency signals, which were related to the way the specimen was configured and the way the specimen was loaded. AE signal distribution of laminated specimen. (a) Time versus AE cumulative counts and amplitude. (b) Time versus peak frequency and centroid frequency.
Since a single AE parameter is difficult to accurately describe the differences between different AE sources, a multi-parameter combined analysis may lead to the ambiguous boundaries of certain parameters among the sources. Therefore, starting from the original waveform to extract the frequency domain descriptors associated with the different damage modes. Furthermore, a model training set is built using frequency domain features as criteria to further develop a classification model.
Frequency domain feature extraction
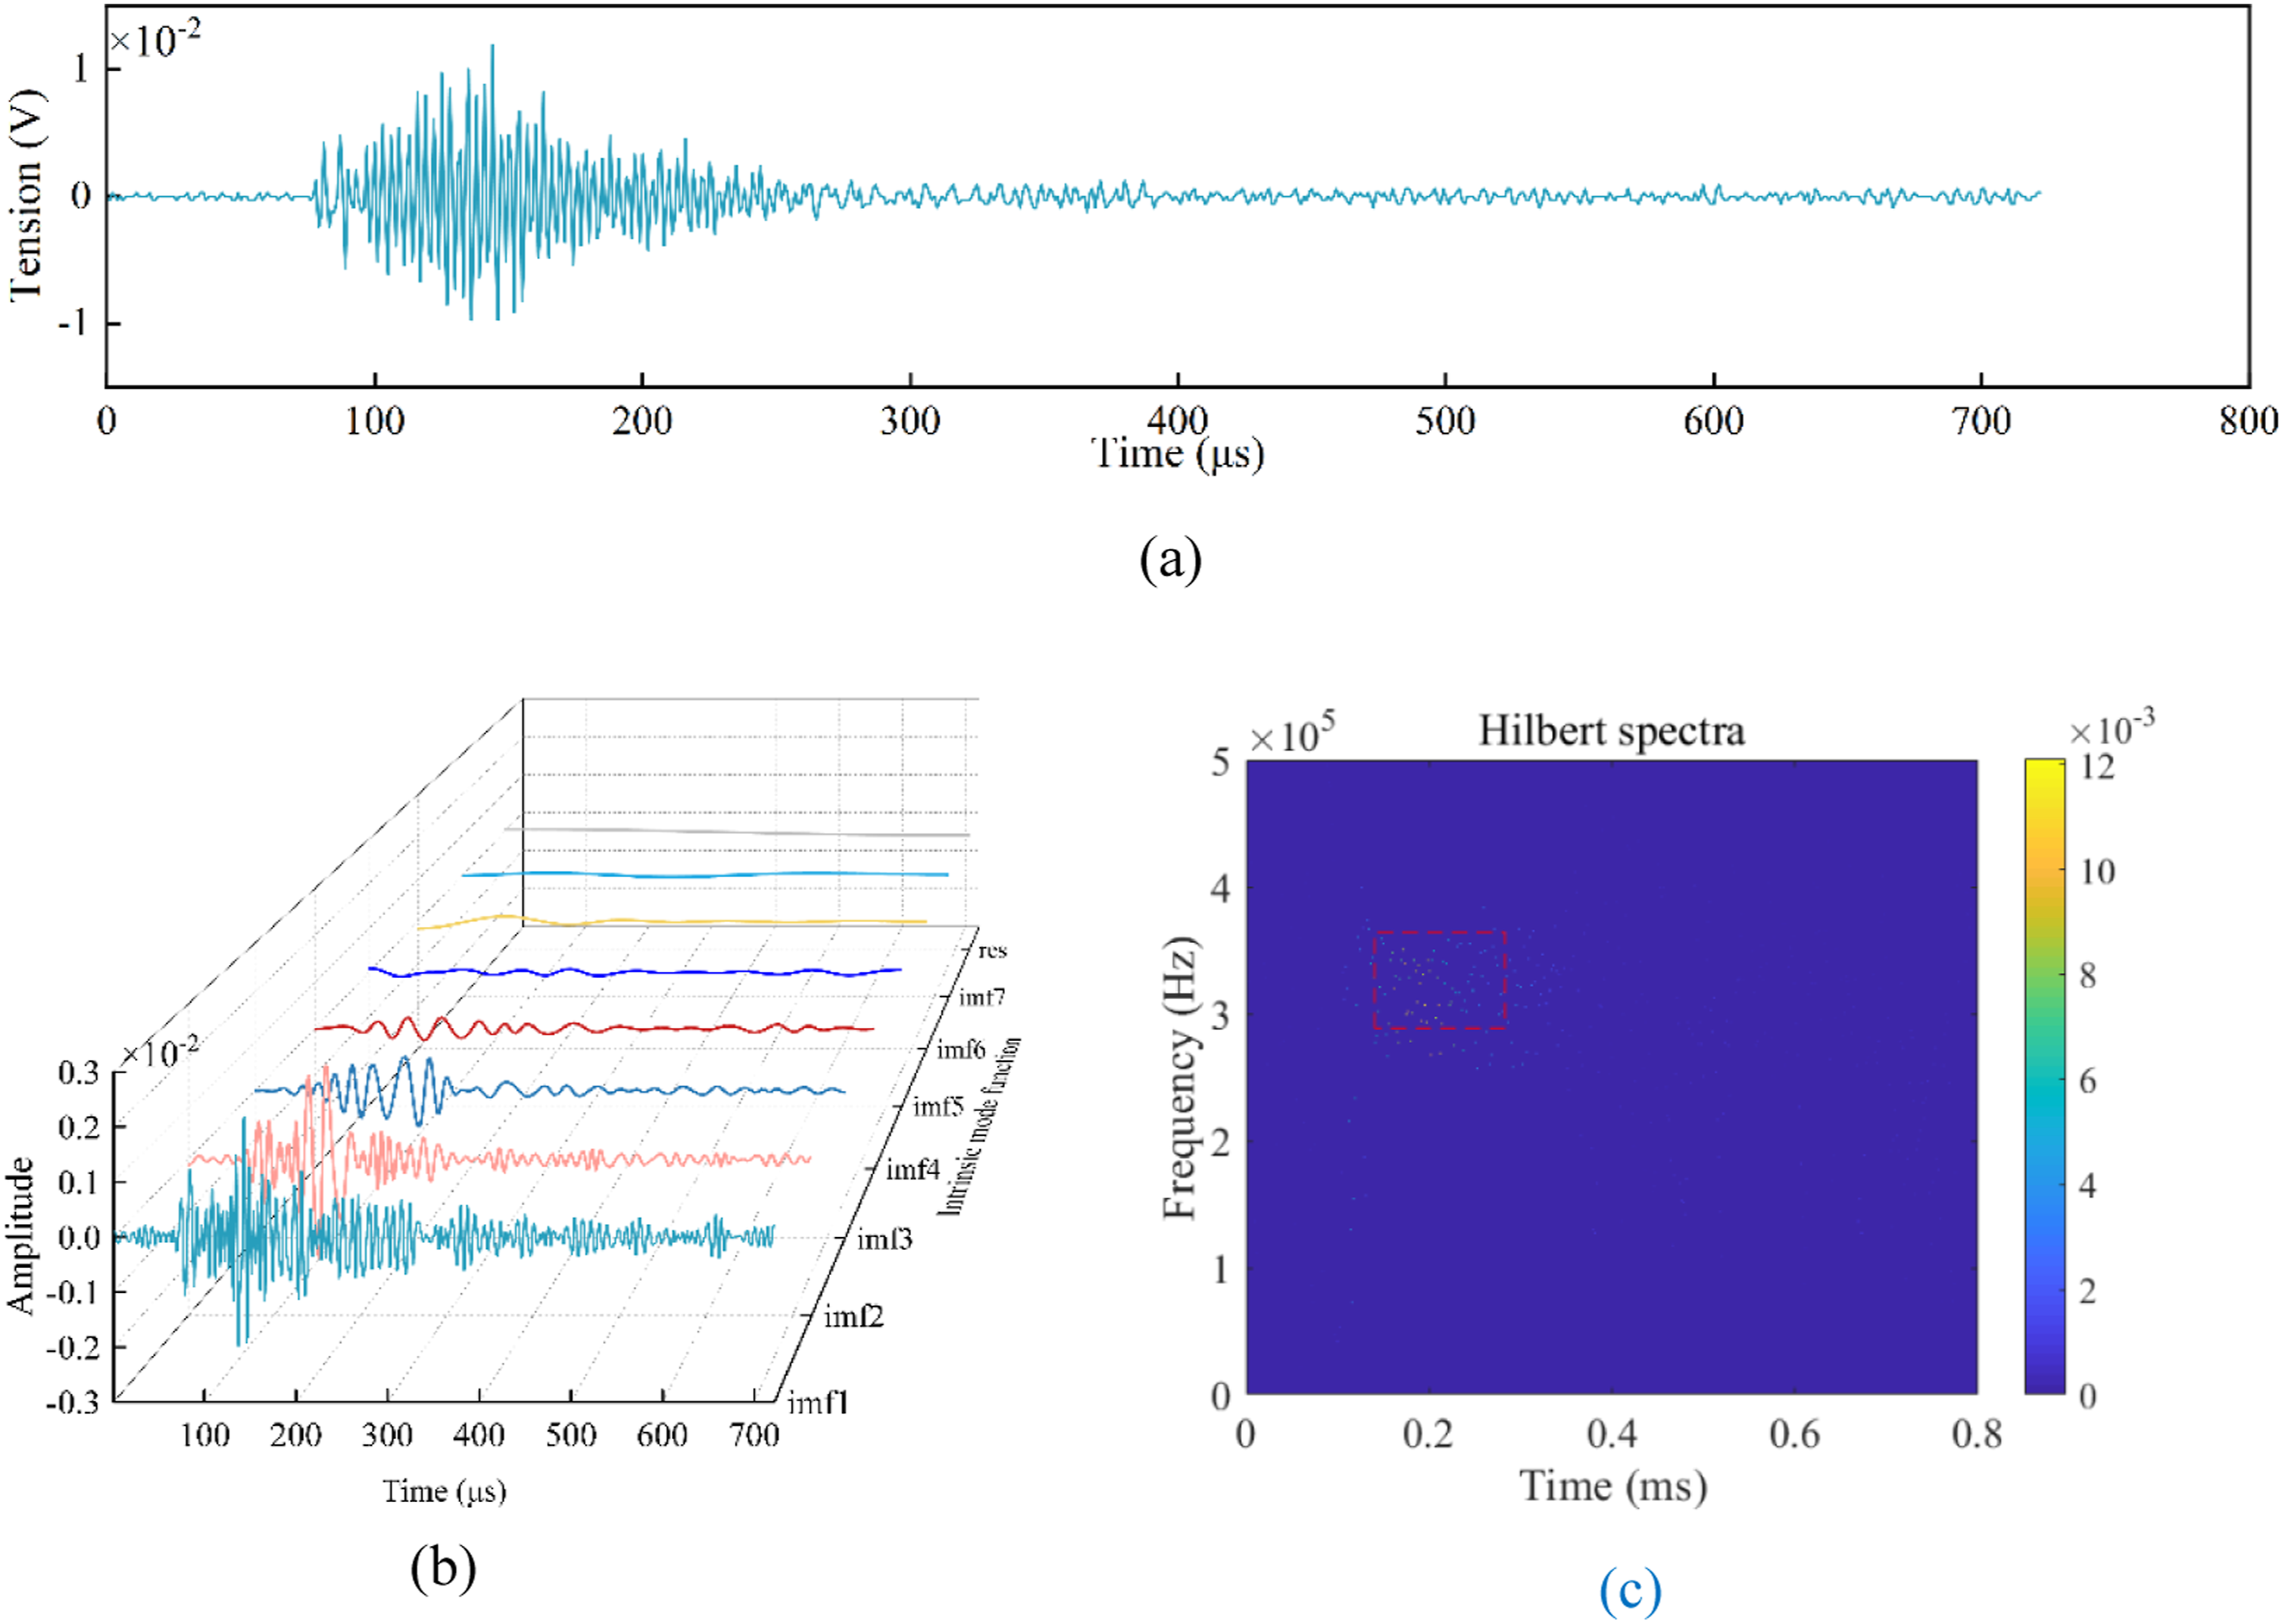
The first step in feature extraction is to intercept the AE signal. The AE event contains a total of 722 points from the beginning to the end of the signal, and the information of the AE source is basically included. In order to extract the frequency domain descriptors of different damage modes from the original signal, typical signals associated with the three damage modes were first subjected to EMD, which make a signal into a variable number of IMEs. Subsequently HHT was performed. Figure 7(a) records the raw AE waveform associated with matrix cracking from pure resin specimen, and Figure 7(b) depicts the results of the waveform after EMD. While Figure 7(c) shows the Hilbert spectrum of the signal, the spectrogram contains the time, frequency, and energy information of the signal, and the color indicates the energy intensity and red boxes indicate areas of energy concentration. Figures 8 and 9 depict the time-frequency information related to the AE signal associated with delamination from laminated specimen and fiber breakage from fiber bundle specimen, respectively. By comparing Figures 7(a), 8(a) and 9(a), it was found that it was not effective to distinguish the characteristics of each damage pattern by the raw waveforms. However, the IMF obtained by EMD exhibits obvious characteristics. Firstly, the number of IMF obtained from the signal associated with the three damages differed. Secondly, the amplitude varies widely across IMFs. But extracting quantitative criteria from IMFs is difficult to achieve. It is worth noting that the Hilbert spectrum of the AE signals associated with each damage mode exhibits distinctive features. Therefore, it is promising to use the Hilbert spectrogram as the main object of study to provide quantitative criteria for the AE signals associated with each damage mode. However, it is short of providing a standard for the quantification of the signals of each damage mode. Raw waveform and HHT analysis of the AE signal associated with matrix cracking. (a) Raw waveform of the AE signal . (b) EMD of the AE signal. (c) Hilbert spectrum of the AE signal. Raw waveform and HHT analysis of AE signals associated with delamination. (a) Raw waveform of AE signals. (b) EMD of AE signals. (c) Hilbert spectrum of AE signals. Raw waveform and HHT analysis of the AE signal associated with fiber breakage. (a) Raw waveform of the AE signal. (b) EMD of the AE signal. (c) Hilbert spectrum of the AE signal.

Range of each band at a band spacing of 100 kHz.

Range of each band at a band spacing of 50 kHz.

Figure 10(a) demonstrates the division of the Hilbert spectrum into 10 bands with a band spacing of 50 kHz. Spectral energy of 40 signals from pure resin specimen is mainly concentrated in frequency band 3. With the further expansion of the frequency band, as shown in Figure 10(b), it is clear that almost all the signals have a relatively homogeneous energy feature, which is manifested in the energy ratio of more than 80% in frequency band 2. Therefore, width of the frequency band does not have much effect on the characterization of the signals related to the matrix cracking. In Figure 11(a), it can be seen that the signals from laminated specimen related to delamination have relatively prominent energy features at a band interval of 50 kHz, and the energy of the waveforms is more distributed on frequency band 4, 5, and 6. This may be due to the fact that delamination often extends from matrix damage and affects the polymerization of fibers and matrix, leading to energy migration to low- and high-frequency band. However, with 100 kHz as the classification interval, the following information can be obtained from Figure 11(b), the waveform energy is distributed in both frequency band 2 and 3, which leads to certain signals being recognized as either substrate cracking or delamination with objections. At a frequency interval of 50 kHz, it is evident from Figure 12(a) that the energy of AE signal generated from fiber bundle specimen is mainly concentrated on frequency band 7. Figure 12(b) shows that the energy of the signals associated with fiber breakage was distributed not only in frequency band 4, but also in frequency band 3. Similarly, the energy feature of the signal associated with fiber breakage at a band interval of 100 kHz are not really clear. This is manifested by the fact that the energy is not concentrated in just one frequency band, which leads to misinterpretation of certain signals. HHT energy features of signals associated with matrix cracking. (a) HHT energy at 50 kHz band spacing. (b) HHT energy at 100 kHz band spacing. HHT energy features of signals associated with delamination. (a) HHT energy at 50 kHz band spacing. (b) HHT energy at 100 kHz band spacing. HHT energy features of signals associated with fiber breakage. (a) HHT energy at 50 kHz band spacing. (b) HHT energy at 100 kHz band spacing.
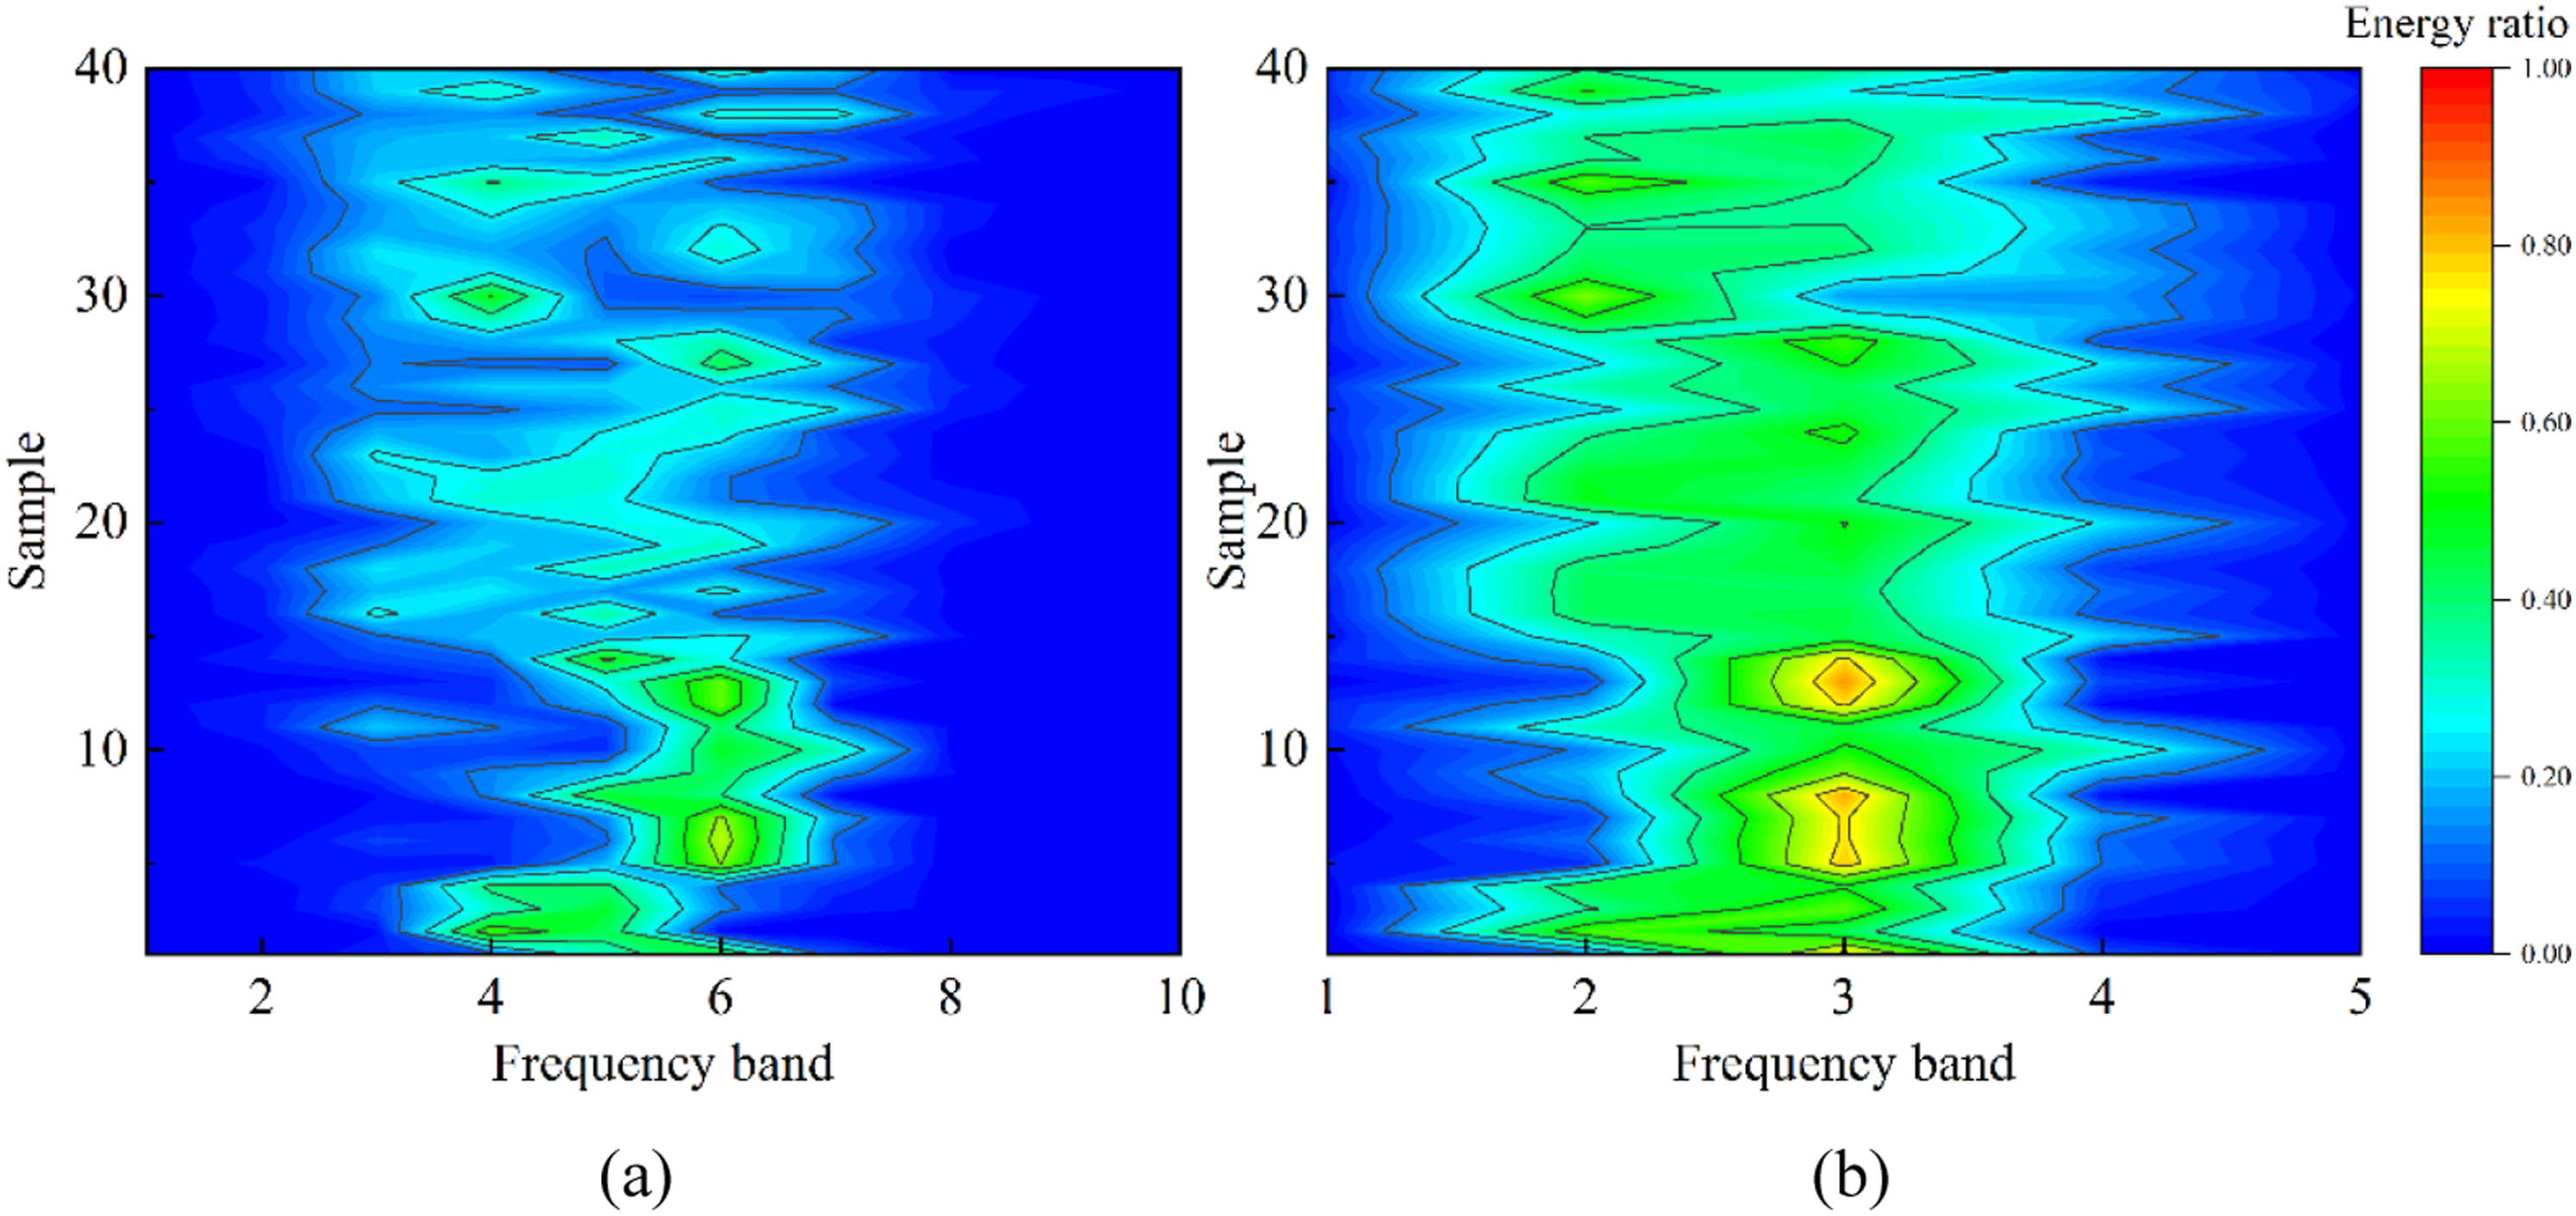

In summary, a band interval of 50 kHz is chosen to effectively characterize the three damage modes, in addition, the increase in band size does not bring large computational complexity. Therefore, the energy of AE signal associated with matrix cracking is mainly concentrated on 100–150 kHz, the signal energy associated with delamination is mainly concentrated on 150–200 kHz, 200–250 kHz, and 250–300 kHz, and the signal energy associated with fiber breakage is mainly concentrated in 300–350 kHz. Therefore, it is reliable to characterize damage modes using the HMES as a frequency domain descriptor.
Establishment and validation of the classification framework
Indeed, a satisfactory classification model requires a precise training set to ensure its effectiveness and accuracy. The numbers 1, 2, and 3 were employed to represent matrix cracking, delamination, and fiber breakage as labels for the training set, respectively. The feature parameters are the new features after dimensionality reduction. There are 40 signals for each type of damage, totaling 120 signals. The AE signals associated with matrix cracking were obtained from pure epoxy resin specimen, the AE signals associated with delamination were obtained from laminated specimen, and the AE signals associated with fiber breakage were obtained from fiber bundle specimen. In the previous section, the energy features frequency domain descriptor of the three damage modes of CFRP and the characterization method were clarified. Because the signal processing needs to intercept the corresponding waveforms and perform the HHT operation to finally calculate the energy characteristics, the steps are complicated and time-consuming. Therefore, in this paper, based on the LDA, an HHT-LDA classifier is established for damage pattern recognition of CFRP, and the key idea is to establish the correlation between the parameters and the frequency domain descriptor. The feature parameters collected by the AE instrument include seven items of frequency, centroid frequency, amplitude, duration, rise time, count, and energy. However, it is well known that large feature dimensions are not conducive to the recognition performed by the classifier, so the data need to be reduced in dimensionality before performing the classification operation. A set of characteristic parameters corresponds to an AE waveform, which also corresponds to an HHT result. Therefore, based on the HHT results, it is clear that the damage pattern is corresponding to the parameter.
The dimension of the projection space is related to the number of clusters, and the three cluster of data are projected into a new 2-dimensional (2D) space at most, that is, the optimal projection plane or the optimal projection line need to be found. Figure 13(a) and (b) record the projection points of the data within each cluster on the 2D plane and the density profiles in the feature 1 direction. It can be seen that the three clusters are well bounded and the distribution of data within the clusters is centralized. Figure 13(c) and (d) records the distribution of the points of each cluster on the projected straight line, and again, the cluster boundaries are clearly visible and the points of each cluster are relatively concentrated. In summary, the projected space, whether a 2D plane or a line, allows the points within clusters to be as close together as possible and the points between clusters to be as far apart as possible. LDA of the training set. (a) Distribution of sample points on the plane. (b) The distribution density of two-dimensional sample points. (c) Distribution of sample points on the line. (d) The distribution density of one-dimensional sample points.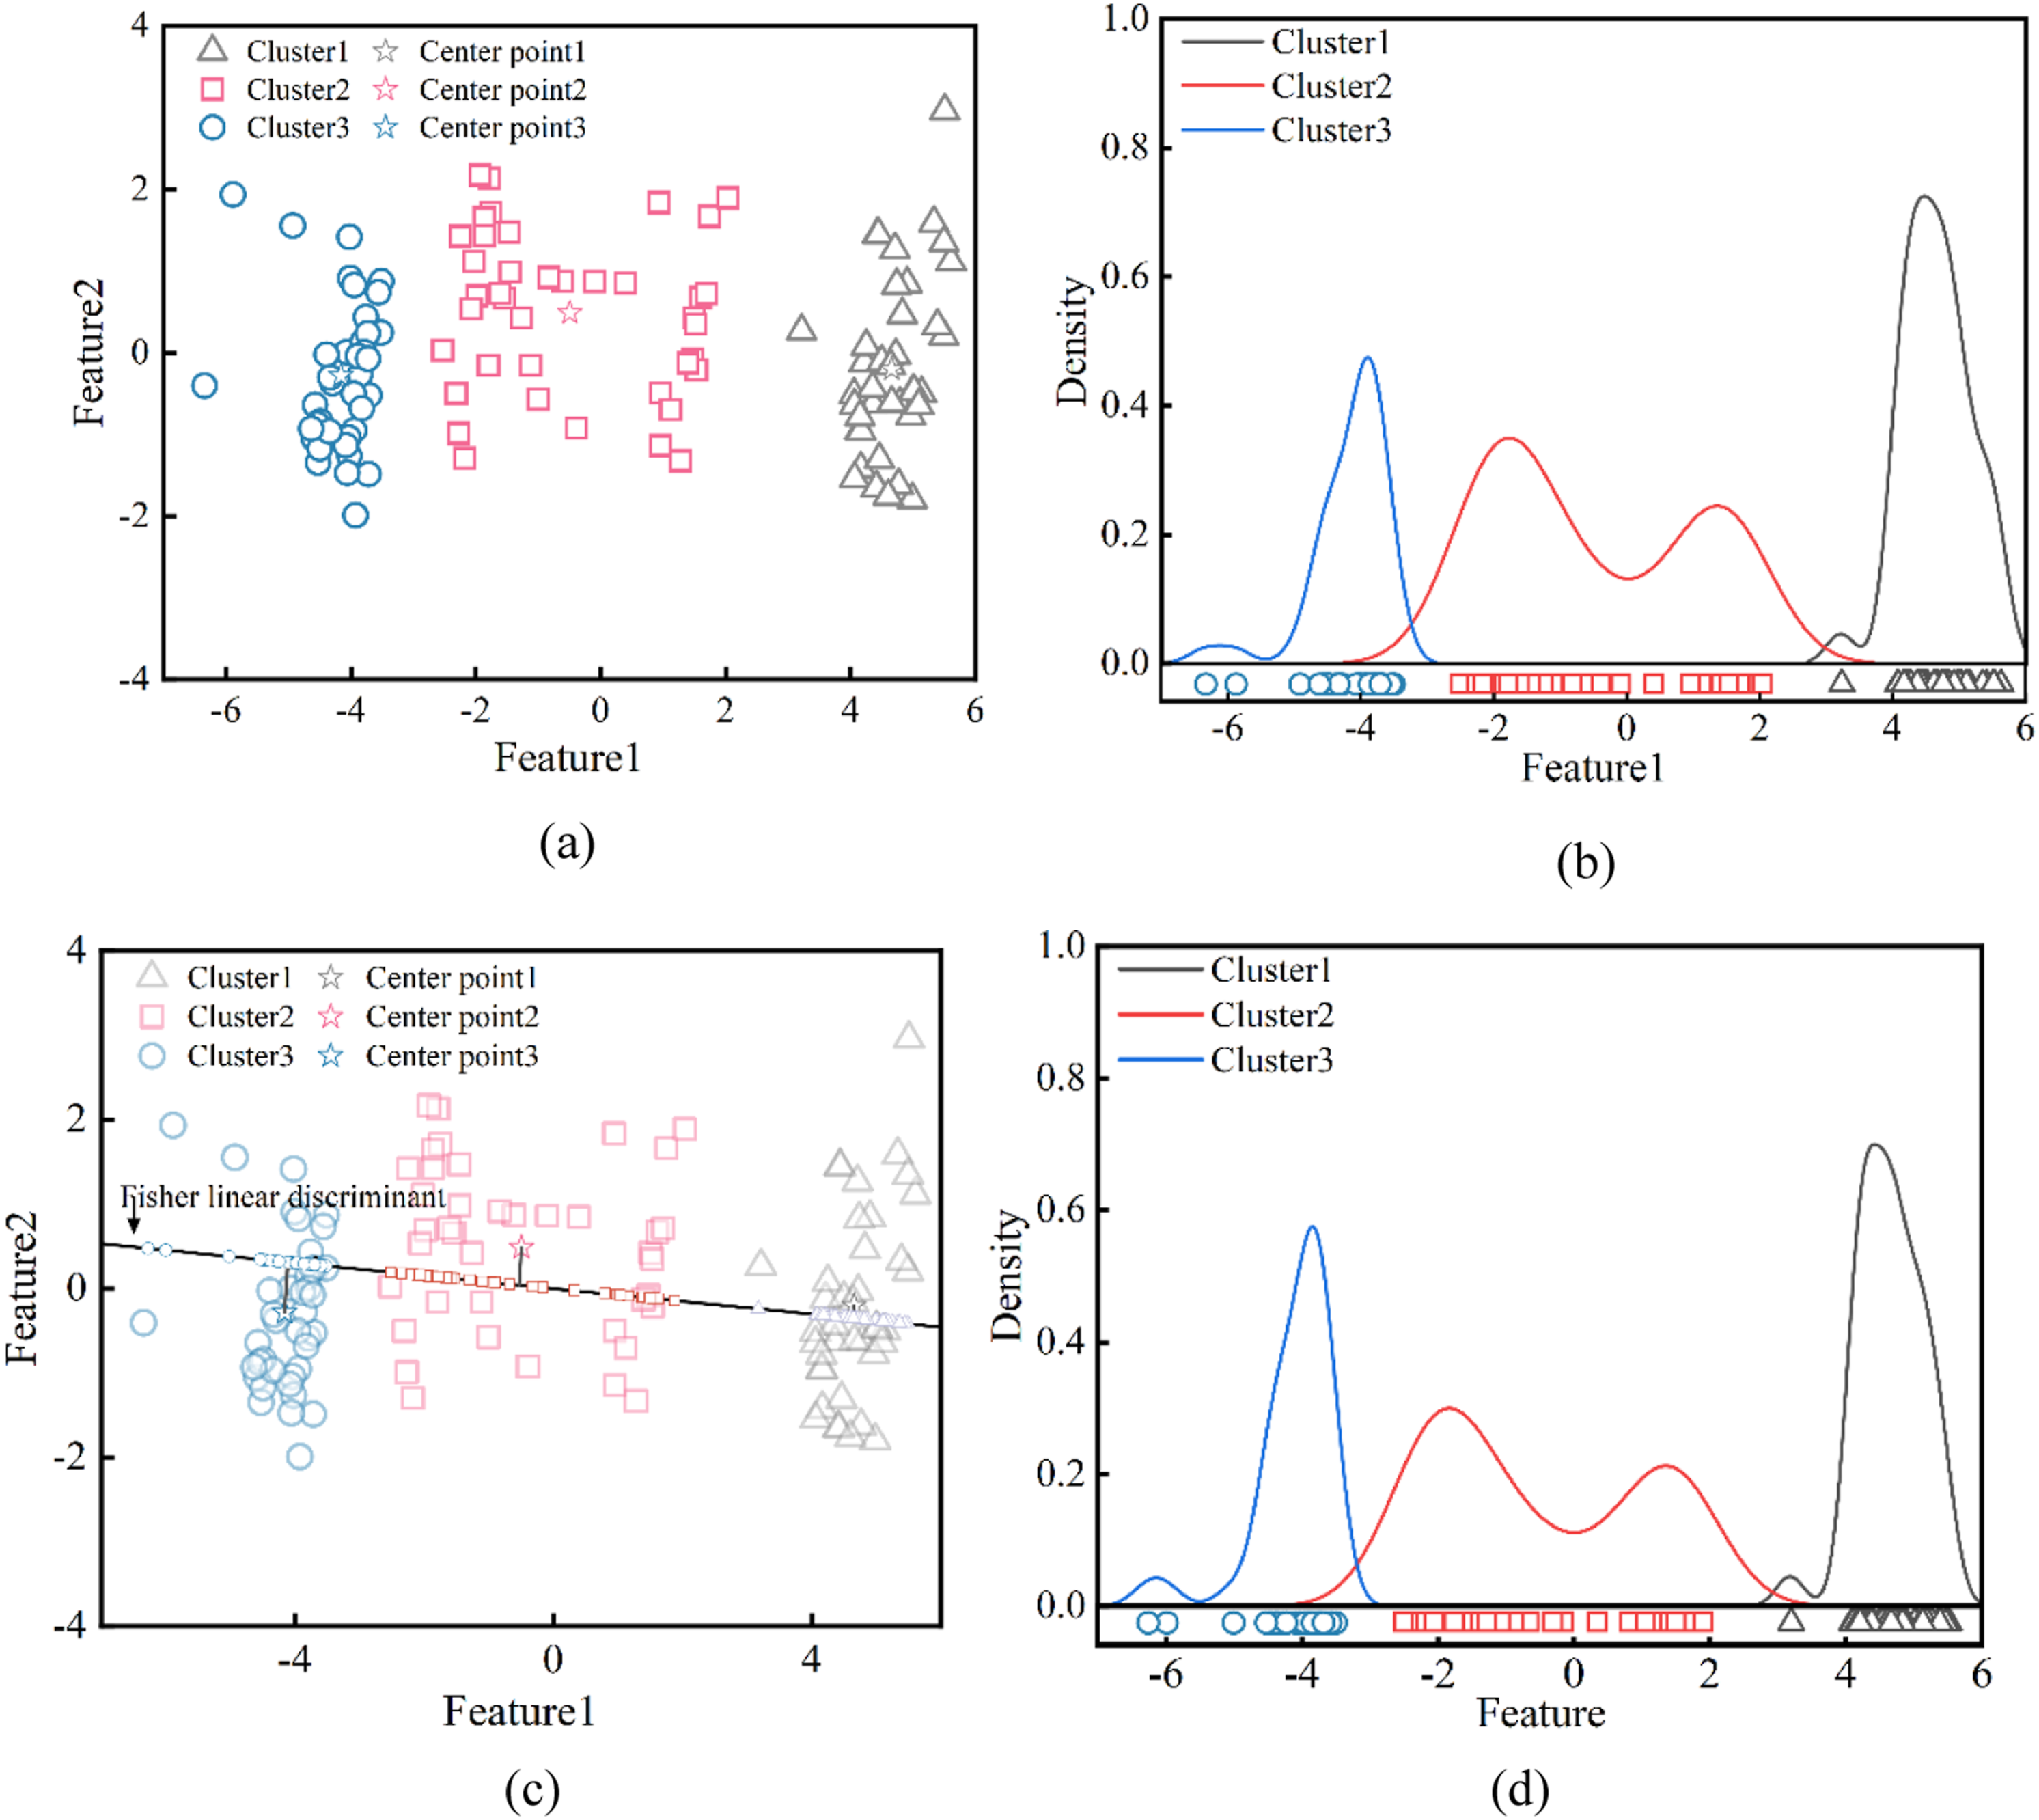
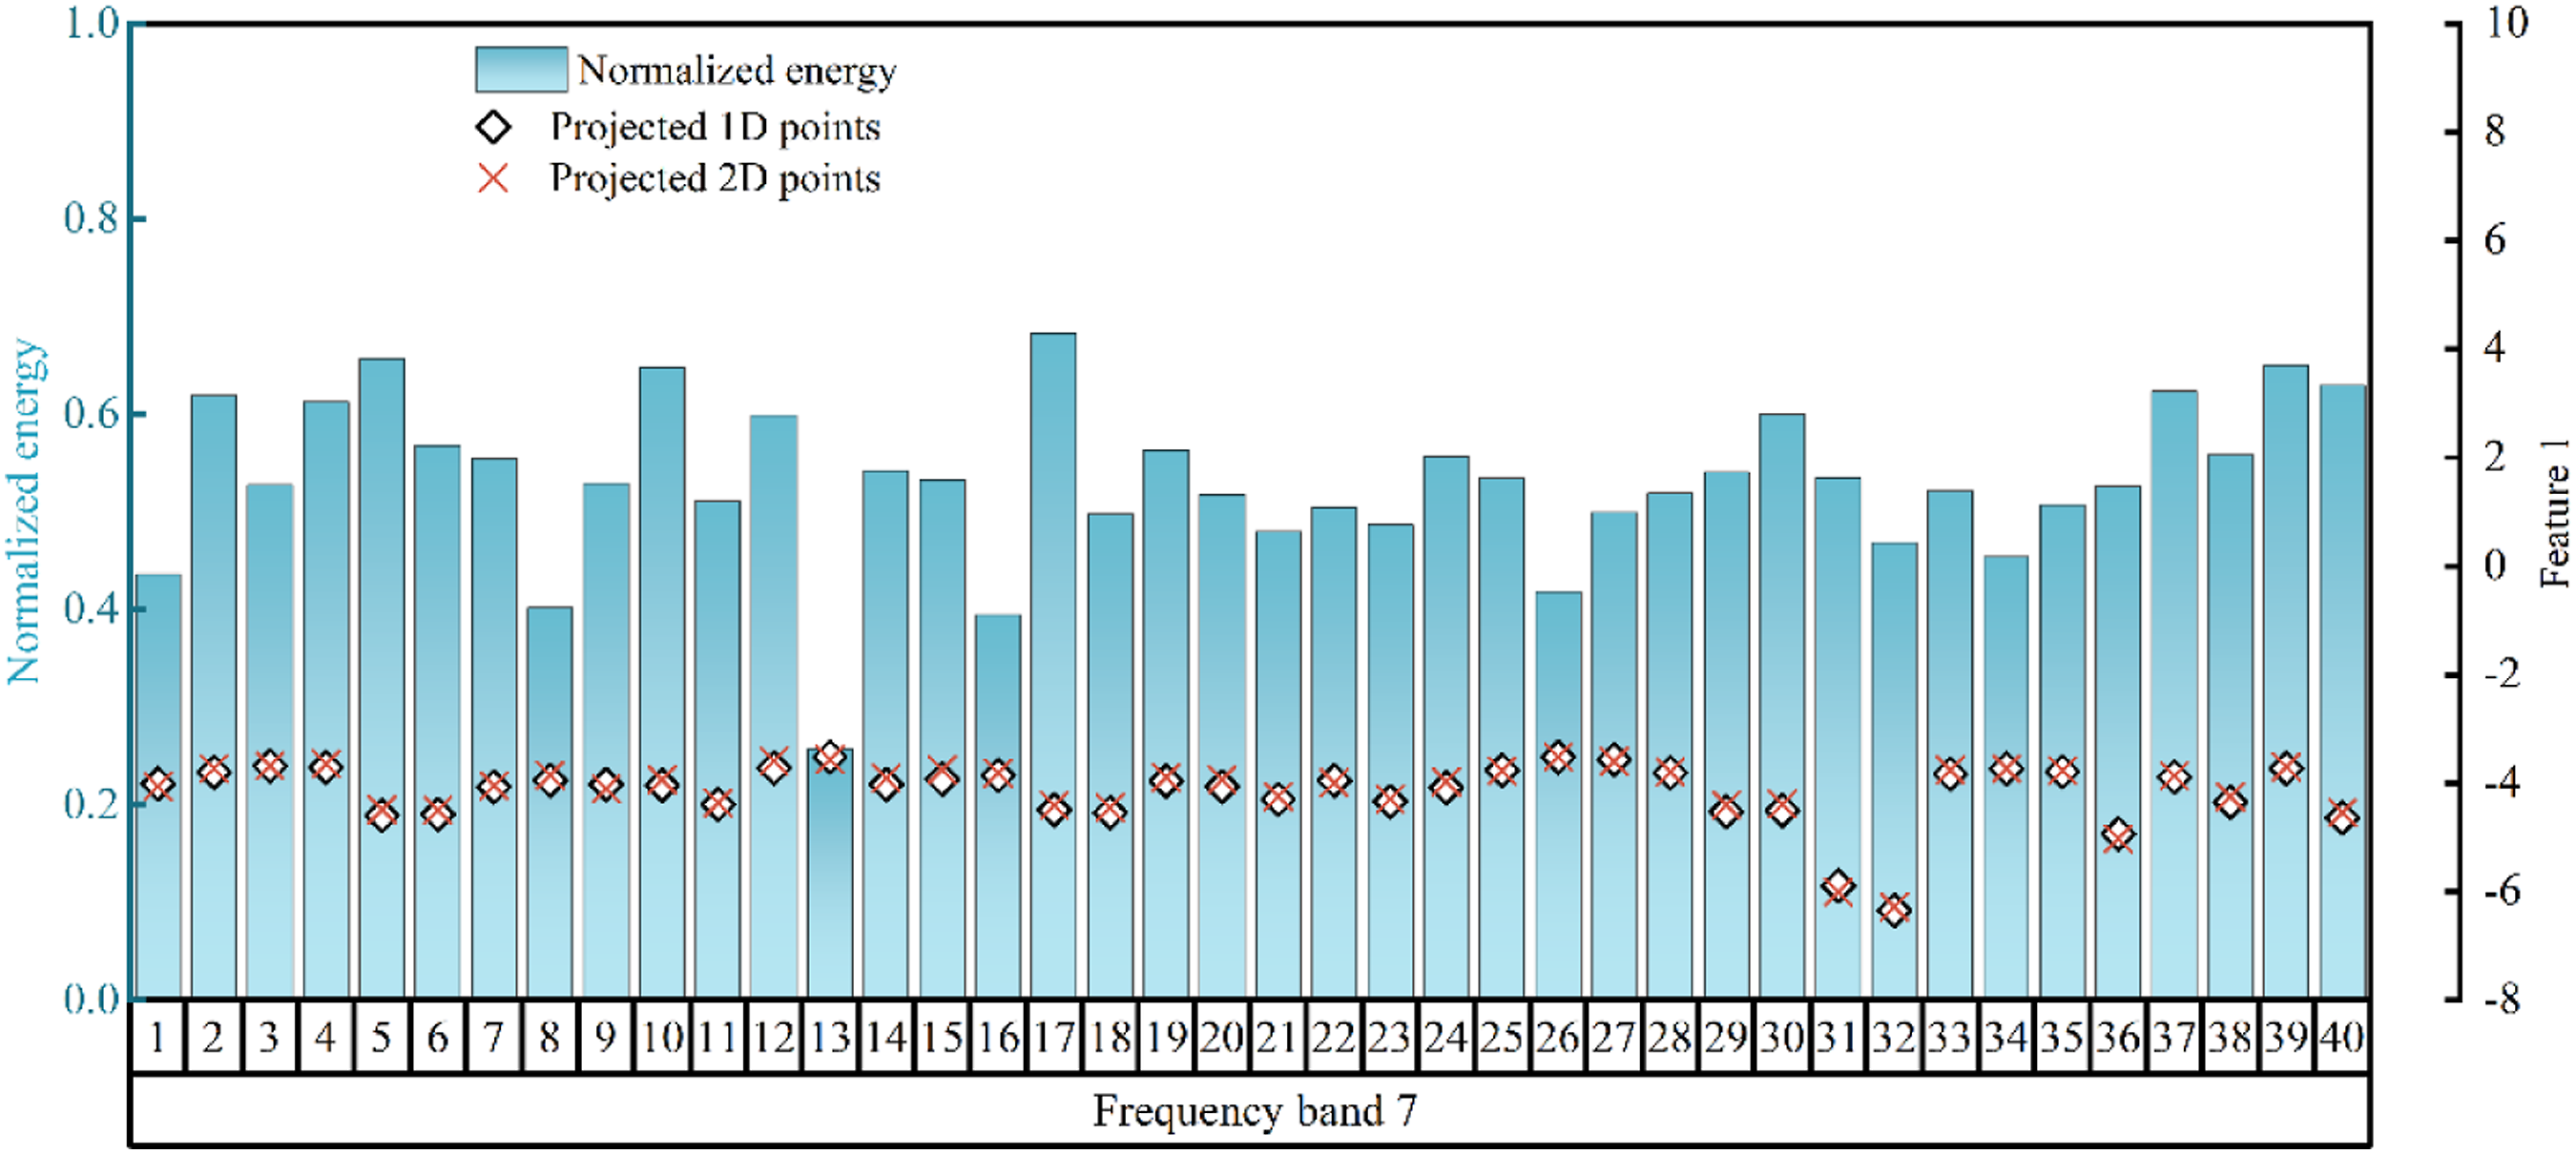
Figures 14–16 establish the connection between the projected points and the frequency domain descriptor. The energy features of each sample were recorded, expressed as the band with the highest energy content. As can be seen in Figure 14, the energy of the signal associated with matrix cracking is mainly concentrated in frequency band 3, where it can be clearly seen differences between energy contents. The normalized energy varies from about 0.3 to 0.9. However, there is no doubt that it is still dominant relative to the other frequency bands. The trend of the projection point is flat and always fluctuates in a small range, either belongs to a 2D plane or a straight line. Figure 15 depicts the frequency domain descriptor of the signal associated with delamination and the distribution of projection points. Obviously, the energy is concentrated in frequency band 4, 5, and 6, with a wide range of fluctuations of the projection points. The normalized energy varies from about 0.2 to 0.6. From Figure 16, it can be seen that the energy of the signal associated with fiber breakage is mainly concentrated in frequency band 7, with small fluctuations in the projection point. The normalized energy varies from about 0.3 to 0.7. HHT energy features and projection points of AE signals from cluster1. HHT energy features and projection points of AE signals from cluster2. HHT energy features and projection points of AE signals from cluster3.

In general, the average energy ratio of the signals related to the three kinds of damage differs greatly. The energy of the signals of matrix damage and fiber damage is relatively concentrated, while the energy of the signals related to delamination is not as concentrated as that of the other two types of signals. The reason for this phenomenon may be that the signals are from different types of specimens. Another explanation is that some AE signals generated by laminated specimens in the process of loading are the superposition of a variety of damage modes rather than generated by a single type of damage. 35
Through the above work, the frequency domain descriptors are associated with the new feature parameters. Subsequently, the HHT-LDA classification model has been built. The performance of the classification model was indicated by the result of HMES. The signals to be tested are randomly taken from different loading stages, which purpose is to simulate damage pattern recognition during loading. In order to determine the dimension of the projection space, the results of the samples to be tested in the projection space as 2D plane and straight line were calculated, respectively. The dimension of the projection space is determined by the actual classifying effect. The sum of the Euclidean distances from the sample to be tested to each cluster point was further calculated, and the damage pattern was determined by the shortest distance metric. In addition, frequency bands where energy is concentrated of the samples to be tested were calculated as an indicator of the true damage pattern, and the similarity between the two methods was considered as a criterion for evaluating the classification model.
The energy features of the 40 waveforms to be tested were recorded in Figure 17. Figure 17(a)–(d) represent the energy features of AE signals at different loading stages, respectively. It needs to be clarified that, there is also the problem of poor characterization in the samples to be tested, which is manifested in the low energy content, in other words, the energy is concentrated in several frequency bands with small differences. This phenomenon is difficult to avoid for the time being, so the frequency band with relatively high energy concentration is still used as the characteristic frequency band. It is clear from Figure 17 that the HMES of each waveform are more distributed in at least one frequency band. In the Figure, F1-10 represents 10 characteristic frequency bands, and W1-40 represents 40 waveforms to be tested. Taking Figure 17(d) as an example, the HHT-based damage pattern recognition result is briefly described. The HMES of W31 shows that about 40% of spectral energy is distributed in 100-150 kHz, 26% and 15% of spectral energy is distributed in 150–200 kHz and 50–100 kHz frequency band, respectively. Therefore, W31 is associated with matrix cracking. Energy distribution of AE signals to be tested at different loading stages. (a) AE signal energy distribution for loading stage 1. (b) AE signal energy distribution for loading stage 2. (c) AE signal energy distribution for loading stage 3. (d) AE signal energy distribution for loading stage 4.
Figure 18(a) and (b) depicts the LDA results and HHT results of the samples to be tested in different projection spaces. It can be clearly seen that the dimension of the projection space does not affect the classification of the samples to be tested, even if there are slight differences in the coordinates of the projected points. Considering that the operation of lower dimensions will increase the computational complexity, and may lose partial information, the 2D plane is considered to be a preferred projection space, that is, the operation of the data projected to the new plane is simple and show good visualization. It is also clear from the Figure 18 that the classification results of the model are high degree of consistency with the HHT results, and the ability to distinguish signals related to matrix cracking is better than delamination and fiber damage. Figure 19 compares the results of the two methods, the results indicate that although the classification model is not as accurate as the other two types of damage in identifying signals of fiber breakage, but consider that the combined classification performance reached 85%. Figure 20 depicts the AE signals associated with different damage patterns that were identified. It is evident that the three aforementioned signals were successfully classified and identified. In addition, most of the data are contained in their respective 95% confidence ellipses. It is important to note that the overlap of the confidence ellipses should not be neglected. One possible explanation is that information related to different damages may appear in a single AE waveform, resulting in an insignificant energy signature. Since the model is built to solve the problem of small sample classification, the generalization performance of the model needs to be improved. Comparison of HHT classification result with LDA classification result. (a) The projection space is a plane. (b) The projection space is a straight line. Comparison of the results of the two methods. Damage identification and visualization for samples to be tested. The ellipses denote the 95% confidence ellipses.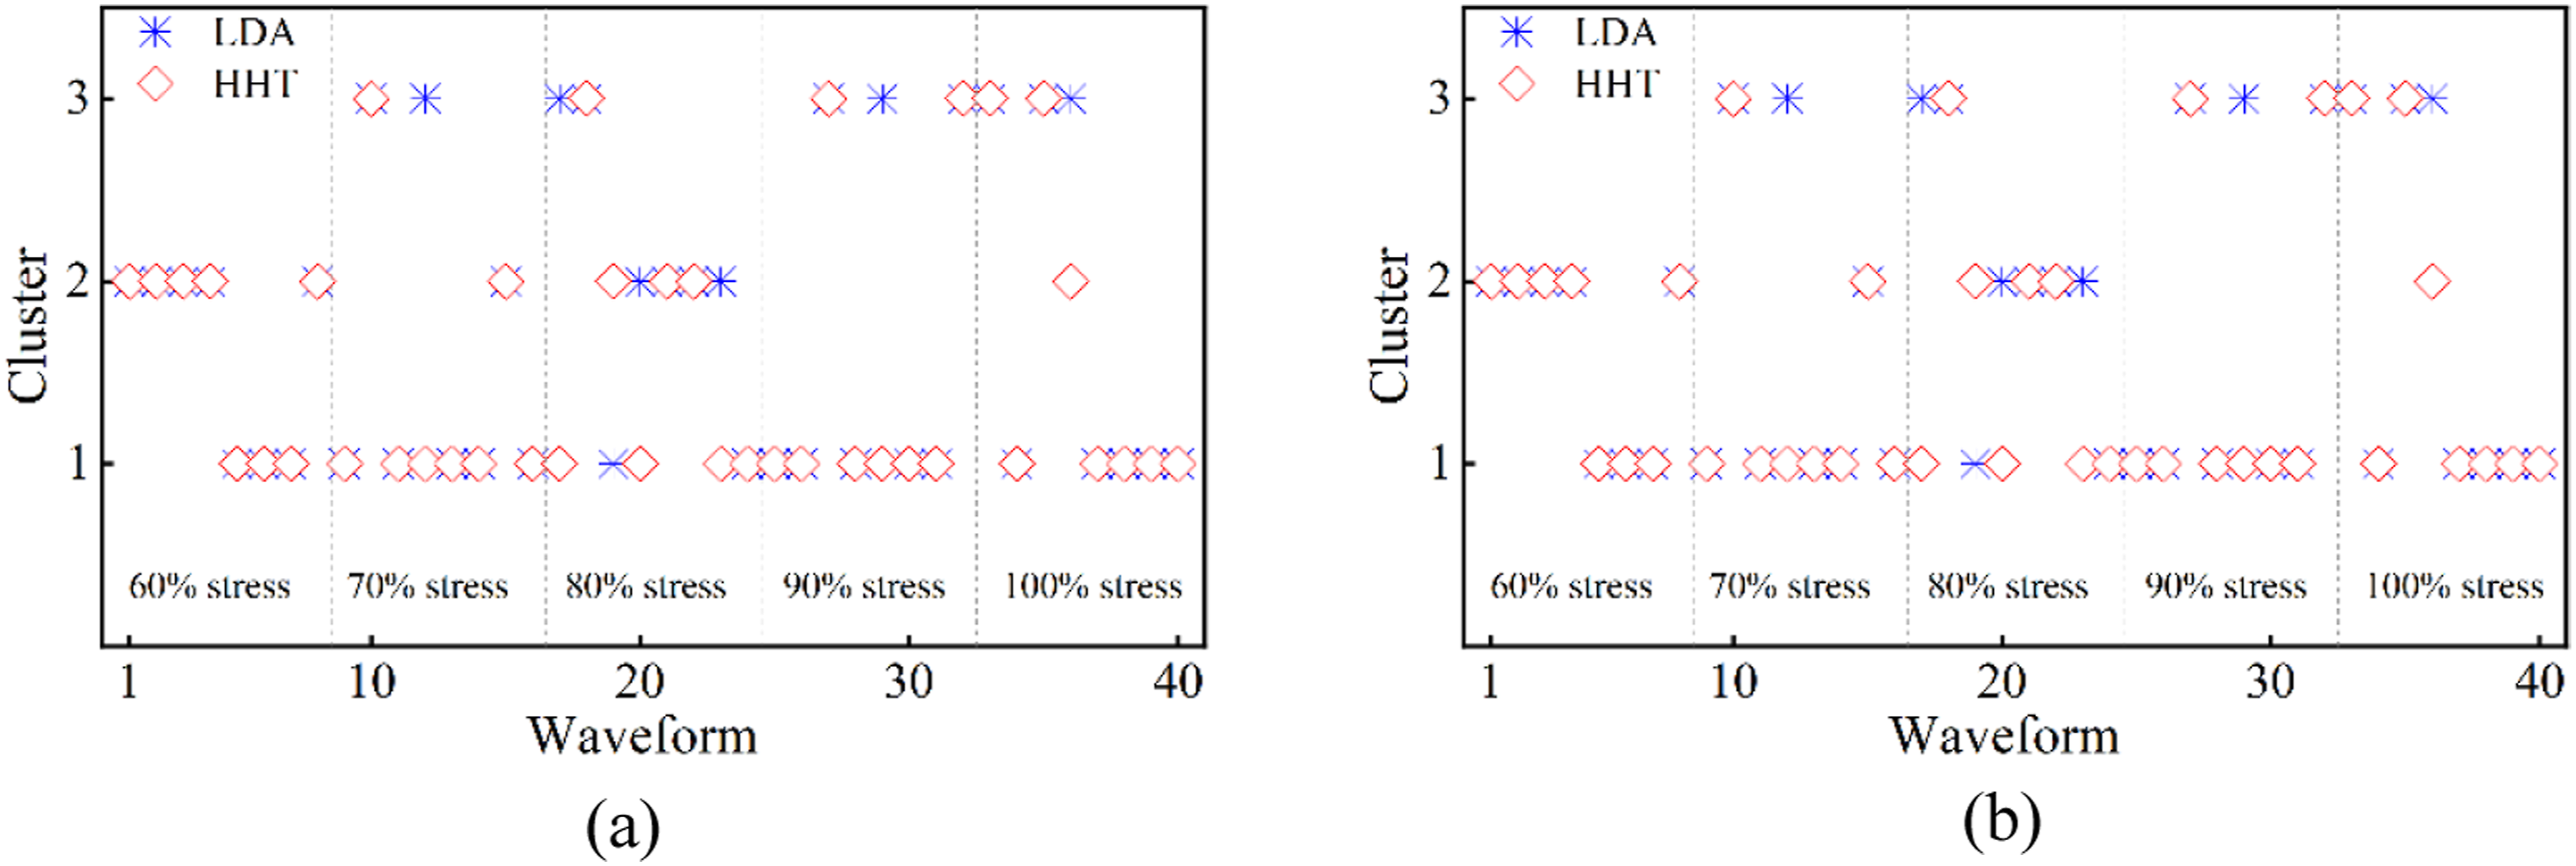


Conclusion
In this paper, a damage pattern recognition model in composites has been developed combining AE technology and machine learning algorithms. The model integrates HHT with LDA to analyze the AE signals generated during the loading of pure resin specimens, fiber bundle specimens, and laminated specimens. Specifically, the original waveforms of the AE associated with the three typical damages were first decomposed into several IMF components with the help of EMD. The percentage of energy in a specific frequency band was subsequently calculated by HHT as a frequency domain descriptor. LDA is performed to reduce redundant features in multidimensional characteristic parameters and associated with frequency domain descriptors to further provide direct visualization of damage identification results. The results show that HMES can be used as an effective feature to characterize damage evolution in composite monitoring processes. The energy of AE signal associated with matrix cracking is mainly concentrated on 100–150 kHz, the energy of AE signal associated with delamination is mainly concentrated on 150–200 kHz, 200–250 kHz, and 250–300 kHz, and the energy of AE signal associated with fiber breakage is mainly concentrated on 300–350 kHz. Furthermore, the high-dimensional data is visualized well by being projected onto a 2D plane. In addition, the three aforementioned damage patterns were successfully detected and recognized by the developed HHT-LDA classification model. The new classification model utilizes more information from the original waveforms while reducing the data dimensionality compared to traditional unsupervised clustering-based methods using AE feature parameters. HHT-LDA classification models can provide more direct and visual damage detection and identification in structural health monitoring. In future work, more accurate models are promising to be developed by building more convincing training sets and better machine learning algorithms for structural health monitoring of composite structures.
Footnotes
Acknowledgments
The authors gratefully acknowledge the financial support of the National Natural Science Foundation of China (grant no. 12172117) and Innovation Team of Nondestructive Testing Technology and Instrument, Hebei University (IT2023C03).
Declaration of conflicting interests
The author(s) declared no potential conflicts of interest with respect to the research, authorship, and/or publication of this article.
Funding
The author(s) disclosed receipt of the following financial support for the research, authorship, and/or publication of this article: This work was supported by the National Natural Science Foundation of China (grant no. 12172117) and Innovation Team of Nondestructive Testing Technology and Instrument, Hebei University (IT2023C03).
Data Availability Statement
The data that support the finding of this study are available from the corresponding author upon reasonable request.