
Abstract
Fused deposition modeling (FDM) is a low-cost additive manufacturing method with moderate tolerances and high design flexibility. Ample studies are being undertaken for modeling the mechanical properties of FDM by using the Finite Element Method (FEM). The process technique of FDM results in anisotropic inner structures that are affected by the chosen manufacturing parameters. Moreover, composite filaments, such as fiber-reinforced polymers, have anisotropy even in filament form before FDM printing. These anisotropic effects are needed to be examined and incorporated for an adequate model. In order to speed up the design stage, we aim to prepare a practical method for simulating the mechanical properties of FDM-printed fiber-reinforced polymer composites. In this work, we computed the homogenized material properties for various fiber lengths, fiber volume percentages, and fiber orientations by asymptotic homogenization at the microscale. Then, mesoscale simulations are carried out through FEM simulations by incorporating the influences of process parameters. In this way, we demonstrate the effect of various micro- and mesostructural features on the homogenized properties step by step.
Keywords
Introduction
Additive manufacturing is an emerging technology and has great potential in many applications, such as automotive, aerospace, biomedical, 1 biomechanical 2,3 as well as research in meta-materials.3–6 This is a critical method because it helps reduce the lead time for producing complex components and the amount of material waste compared to conventional processes. 7 The additive manufacturing routine starts by designing a model that includes the desired geometry. 8 Any CAD software can be used for this purpose. The chosen geometries are then further processed with slicer software in order to define the necessary process parameters such as layer thickness, raster width, raster orientation, and infill ratio.9,10 Fused deposition modeling (FDM) is an additive manufacturing method that falls in the materials-extrusion subcategory.11,12 This is a highly employed technique among all additive manufacturing types for low and medium batches. 13 Highly anisotropic properties occur due to the process employed in FDM.14,15
We assume the FDM polymers are composites, consisting of solidified materials and voids (microporosities between layers). Many researchers have employed various methods for accurately simulating the mechanical behavior of multi-phase materials. Stiffness and strength were computed by micromechanical methods for glass fiber–reinforced epoxy, and a multiscale homogenization was carried out for graphite/polyamide composites. 16 A micromechanics-based nonlinear elastoplastic damage model was employed for composites regarding their interphases. 17 Micromechanical methods for predicting elastoplastic behavior were reviewed and implemented in various multi-phase materials.18–22 Continuum modeling techniques and some of the micromechanical methods were reviewed for simulating the properties of nanocomposites. 23 Moreover, the relations between electrical and mechanical properties for scalable conductive nanocomposites were presented in [24]. A numerical micromechanical method (methods of cell) was proposed, 25 and a computer code was developed. 26
The characterization and simulation of the FDM-printed polymers are challenging due to the anisotropic process effects. FDM-printed short fiber-reinforced polymer composites were modeled through numerical RVE on mesoscale. 27 Elastic properties were determined by microscale RVE numerical analysis. 28 Finite element representative volume cell (RVC) with a numerical procedure was employed for predicting the stiffness of FDM parts. 29 New sets of equations for predicting the elastic constants of FDM polymers were prepared based on void density analysis. 30 A multiscale approach for determining the mechanical properties of FDM parts was prepared for laminate scale, 31 and for multifunctional composites as well as 3D printed polymers. 32 FDM has a feature called infill, which denotes the deposited materials. An infill ratio lower than 100% leads to substructures that introduce metamaterials.33–35 In order to effectively simulate these materials, strain-gradient theories were proposed, 33 and the effect of infill ratio as well as infill pattern on the macroscale mechanical properties were successfully modeled by asymptotic homogenization.36,37
Due to the relatively more straightforward processing technique employed in FDM than in commercial composite manufacturing methods, FDM printing of polymer composites has gained attention in recent years.38,39 The mechanical properties of FDM-printed polymers were successfully simulated regarding their mesostructures,10,40,41 which are significantly affected by the chosen process parameters.10,42–44 However, the mesostructural models may not be sufficient for composites since they already have anisotropy in filament form depending on the shape of reinforcements and their distribution in the polymer matrix. Therefore, microstructural effects need to be included for successfully modeling the FDM-printed polymer composites.
In this paper, we prepared various microstructures for different cases. Their stiffness matrixes and, thereby, elasticity moduli were computed through asymptotic homogenization on the microscale (modeling of the anisotropy in polymer composite filaments). On the mesoscale, an example inner structure with 0.2 mm layer thickness—0% overlap was chosen from our previous studies,
10
and FEM simulations were carried out (simulation of the FDM process-related anisotropic effects). The homogenized stiffness matrixes from the microstructures were used as input parameters for the simulations on the mesoscale. In this way, we proposed a two-stage method in different length scales (micro- and mesoscales) for accurately simulating the elasticity moduli of FDM-printed fiber-reinforced thermoplastic composites. Ultimately, we test and demonstrate the efficiency of the suggested method for various cases. We illustrate the micro- and mesoscale analysis in Figure 1. Illustration of micro- and mesoscale analysis in this study. On the microscale, we concentrate on the polymer composite filaments. We assume the material consists of only polymer matrix and fiber reinforcement phases. On the mesoscale, we include the effect of the FDM process (inner structure with microporous areas).
This paper is structured by demonstrating the CAD models for microstructures and explaining the automatization of the CAD generation in Section CAD preparation. Then, the details of asymptotic homogenization for microscale computations are provided in Section Microscale computations by asymptotic homogenization, and FEM simulations for mesoscale are explained in Section Mesoscale simulations by finite element method (FEM). The results are given and discussed in Section Results and discussion. Ultimately, conclusive remarks are provided in Section Conclusions.
Materials and methods
CAD preparation
The representative volume element configurations that are used as input for simulations with short fibers. L represents the length of carbon fibers.

The particle orientation is one of the critical parameters for fiber-reinforced polymer (FRP) composites. Obviously, composites possess relatively higher mechanical properties along the fiber orientation. Therefore, their fiber positions are generally determined by considering the loading directions. In this way, desired anisotropic properties are generated. However, FDM also creates anisotropic inner structures due to the layerwise production method. 10 Hence, the effects of materials-related anisotropy (fiber orientation on the microscale) and process-related anisotropy (layer orientation on the mesoscale) on the final mechanical properties must be carefully studied. In order to investigate them, we generated RVEs with three different fiber orientations (see Figure 3, (a)-(d)-(g) for x-axis, z-axis, and random orientations, respectively).
From the mechanical point of view, the reinforcement phases (e.g. fibers, particles) carry the loads predominantly, while the polymer matrix enables load transferring between reinforcements. 45 Therefore, the fiber volume ratio is generally desired to be as high as possible. However, the FDM process may cause some limitations in fiber volumes. During FDM printing, the thermoplastic polymers are melted in the nozzle and deposited on the build plate9,10,46 Very high fiber volumes in the polymer filaments may cause nozzle clogging and cause damage to the equipment. Therefore, the fiber volume ratio is to be carefully chosen. In this study, we simulate three different fiber volume ratios (10, 15, and 20%) in order to discuss their effects on the final properties. The RVEs with various fiber volumes are depicted in Figure 3, (a)-(b)-(c).
Fiber length has a significant effect on mechanical properties. There are many different length options for carbon fibers on the market. However, not all of them are suitable for the FDM process. It has to be considered many different process-related issues such as filament and nozzle diameters, deposition of molten material, layer thickness, and width. After carefully checking the options, we decided on 0.08 mm and 0.1 mm fiber lengths as short fiber. Continuous fiber reinforcement is still an emerging issue for FDM printing. Nevertheless, there are some examples in the literature,47,48 and we used them as upper threshold and for comparative analysis with the short fibers (0.08 mm and 0.1 mm). We depict 0.1 mm fiber-reinforced RVE in Figure 3, and continuous fiber reinforcement in Figure 2. Representative volume elements with continuous fiber.
Each RVE consists of carbon fibers and Polyethylene terephthalate glycol (PETG) matrix in this study. The specifications of carbon fibers are obtained from technical datasheets. We automated the CAD model generation using the Salome Kernel feature, which allows preparing geometries without using the graphical user interface. The CAD routine is written in Python language with Salome packages. The automated CAD generation accelerates the CAD preparation and enables generating fibers at random positions, which results in more realistic representative volume elements. Moreover, we employed an algorithm in this routine that prevents the collisions of fibers. This increases the processing time; however, we ensure that there are no fiber agglomerations in RVEs. The input parameters of the CAD routine are the volume ratio of fibers, dimensions of RVEs, specifications of fibers, and maximum rotation angle for the particles along the different axis. All RVE dimensions are 0.2 ⋅ 0.2 ⋅ 0.2 mm3. We depict example representative volume elements for continuous fibers in Figure 2 as well as short fibers with 0.1 mm fiber length in Figure 3. We demonstrate how we suggest an RVE from mesoscale to microscale for FDM-printed polymer composites in Figure 7. Representative volume elements with various fiber volume, V
f
, fiber length and orientation.
In order to test the accuracy of the RVE preparation process and their homogenized stiffness matrixes, we prepared alternative RVEs from homogenized materials. Their stiffness matrixes were computed, and their results were compared with the standard RVEs. The alternative RVE preparation process is illustrated in Figure 4. The illustration of how various RVEs for the same material are prepared. This homogenized material contains the fibers oriented along the x-axis, V
f
: 15%, and 0.1 mm fiber length.
Two different cases were analyzed for the investigations of RVE selections: (a) fiber orientation along X-axis, V
f
: 15%, and 0.1 mm fiber length, and (b) fiber orientation along Z-axis, V
f
: 10%, and 0.1 mm fiber length. The standard and alternative RVEs, as well as their fibers, are depicted in Figure 5. The representation of alternative RVE preparation for the materials a) fiber orientation along X-axis, V
f
:15%, and 0.1 mm fiber length, b) fiber orientation along Z-axis, V
f
: 10%, and 0.1 mm fiber length.
In Figure 5, the standard RVEs are represented by RVE1, and the alternative ones are named as RVE 2. The fibers of RVE1 are embedded in the matrix, and they are aligned on the surface in RVE2 (see Figure 5). The periodic opposite surfaces of RVE2 (Y
min
and Y
max
) along the y-axis are illustrated in Figure 6. The periodic surfaces of RVE2 (Y
min
and Y
max
) along the y-axis. The material has fiber orientation along the x-axis. Their fibers are illustrated in Figure 5(a), (bottom).
Due to the layerwise manufacturing method employed in FDM, microporous areas occur between solidified polymers (see Figure 7, top), and the end products have specific inner structures, depending on process parameters. In this study, CAD model is designed according to 0.2 mm layer and 0% overlap for mesoscale simulations. Its inner structural features, such as contact lines between solidified polymer layers and the shapes of microporous areas, are determined by our previous study.
10
The aforementioned CAD model is depicted in Figure 7, (top). The illustration how a representative volume element is generated step by step. The layered inner structure due to FDM process is seen in Figure 7, (top).
Microscale computations by asymptotic homogenization
The input material properties for asymptotic homogenization.

Asymptotic homogenization
On the microscale, RVEs are considered as heterogeneous systems, and the homogenized stiffness tensors are computed by means of asymptotic homogenizations, which is implemented from [33,49]. For linear elastic isotropic materials with the known, 


We refer to [33] for all derivations of the necessary equations. In asymptotic homogenization, the displacement field is expanded up to second-order by using unknowns (φ and ψ), and by coefficient comparison, additional differential equations are derived for computing them. The unknown φ tensor is computed by numerically solving
After calculating φ by means of equation (4), the homogenized stiffness matrix, 
Solution methodology
In order to compute stiffness matrix at the homogenized length scale, first the unknown φ tensor (see equation (4)) is to be numerically solved, which is carried out through finite element method. FEM-based software in Python language is prepared with the aid of open-source packages of the FEniCS project 50,51 The Galerkin procedure is utilized since we use finite dimensional Hilbetian Sobolev space for trial functions and the same space for test functions as well. The weak form is achieved after integration by parts
We utilize periodic boundaries, so the degrees of freedom on each surface node have to be adjusted equivalent to the corresponding nodes on the opposite surfaces. We provide Figure 8 for a visual illustration of this phenomenon (see Z
max
and Z
min
surfaces). On the corresponding surfaces along the Z-axis, the same meshes are generated and hence, all nodes on these surfaces have the same Y and X coordinates, which is provided using projection method of Salome 9.3. All these boundaries are Dirichlet type, and the test function vanishes in the boundaries. The meshes are generated in Salome 9.3 by utilizing Mephisto and NetGen algorithms. The illustration of the same meshes of the corresponding surfaces along the Z-axis, namely Z
min
and Z
max
.
Mesoscale simulations by finite element method (FEM)
On the mesoscale, the material is modeled as linear elastic. The computed stiffness matrix from the microscale, 
Uniaxial tensile test simulations were carried out by applying Dirichlet boundary conditions: One end of the geometry, X = 0, is clamped u
x
= 0 along the axis and the other side, X = 5, is set to u
x
= 0.5. The strain energy, U = 1/2∫σ
ij
ɛ
ij
dV, is computed and reformulated in order to calculate the elasticity modulus by
Results and discussion
We obtained suitable meshes after h-convergence analysis, and the results for asymptotic homogenizations are provided in Figure 9. The horizontal plateau in Figure 9 indicates that simulations are converged, beginning at about 2.650,000 degree of freedom (DoF). The red circle in Figure 9 shows where the analysis is converged and the selected degree of freedom for the rest of the simulations. As the RVEs have detailed features, a fine mesh is needed, as seen in Figure 9. We refer to [46] for the h convergence results for mesoscale simulations. The horizontal plateau is achieved at around 1,750,000 DoF. Representation of the results of h-convergence analysis. Exx is plotted over the number of degrees of freedom. The red circle indicates the converged point.
Microscale analysis
The computed elasticity moduli, Exx, Eyy, and Ezz by means of asymptotic homogenization. L and v. denote the fiber length and volume ratios, respectively.


The microscale analysis results for RVEs with different fiber volume ratios,V f , fiber length, and orientations. (a) Elasticity moduli of RVEs with fiber orientation along the x-axis, (b) Elasticity moduli of RVEs with fiber orientation along the z-axis, and (c) Elasticity moduli of RVEs with random fiber orientation.
The elasticity moduli, Exx, Eyy, and Ezz from various RVEs of the same materials.

We examine the effect of various volume ratios and fiber lengths in Figure 10(a), where the fibers are aligned along the x-axis. There are bilinear increases of elasticity moduli: we observe slope changes after 15%.
Eyy, and Ezz in Figure 10(a), have almost the same tendency, and there are similar results. We interpreted these outcomes as transverse isotropic material properties (symmetry axis of y = z) due to unidirectional fiber orientation along the x-axis. The same information, such as bilinear increase, as well as transverse isotropy with a symmetry axis of x = y, is observed in Figure 10(b), where the fibers are oriented along the z-axis.
Figure 10(c) represent the results of RVEs with randomly fiber orientations. Almost similar tendencies and outcomes are observed, except for some minor differences, which may be explained by the algorithm of the CAD routine. Due to the algorithm, the fibers are generated at random positions, and hence, more realistic RVEs are created. However, this may cause some differences in the results, which may also happen in laboratory experiments. The homogenized properties for RVEs with continuous fibers are illustrated in Figure 11. The microscale analysis results for RVEs with continuous fibers.
Relatively much higher elasticity moduli are achieved with continuous fiber-reinforced RVEs than with short fiber ones (see Table 3). The Exx results are illustrated in Figure 11, which present a linear increase with higher fiber volume instead of bilinear tendencies in Figure 10.
Eyy and Ezz have the same results (see Table 3) and the same slop (see Figure 11), which is interpreted as transverse isotropy with a symmetry axis of (y = z) since the continuous fibers are oriented along the x-axis.
Mesoscale analysis
On the mesoscale of FDM polymers and polymer composites, there are microporous areas between solidified layers (see Figure 7, top) due to the process technology employed in FDM. In this work, we used a mesoscale of FDM-printed PETG with 0.2 mm layer thickness and 0% overlap. We provide CAD model of the mesostructure in Figure 7.
The results of the mesoscale analysis. Elasticity moduli, Exx, are computed through finite element method (FEM) simulations. L denotes the fiber length.


Illustration of the mesoscale simulations by means of finite element method (FEM), where one end is clamped and the other end is moved by displacement.
The results indicate that the fiber orientation on the microscale is of importance for achieving the highest possible elasticity moduli in the tensile direction. In this section, mesoscale simulations are carried out as unidirectional tensile test simulations along the x-axis. The results of RVEs with fiber orientation along the z-axis (see Table 5) are relatively lower than the rest. The reason is the difference between fiber orientation and test direction, which is illustrated in Figure 13. The RVEs with the fiber volume ratio of 10% and orientation along the z-axis (see Table 5) have similar elasticity moduli with the PETG matrix (see Table 2). This case demonstrates the importance of proper parameter selection. Consequently, we interpret that there is a need for fiber orientation along the loading direction or at least random orientation for achieving sufficient increases in the properties. Representation of the fiber orientation on the mesoscale. The uniaxial tensile simulation direction (along the x-axis) is perpendicular to the fiber orientation (along the z-axis), which leads to relatively lower elasticity moduli, Exx, on the mesoscale.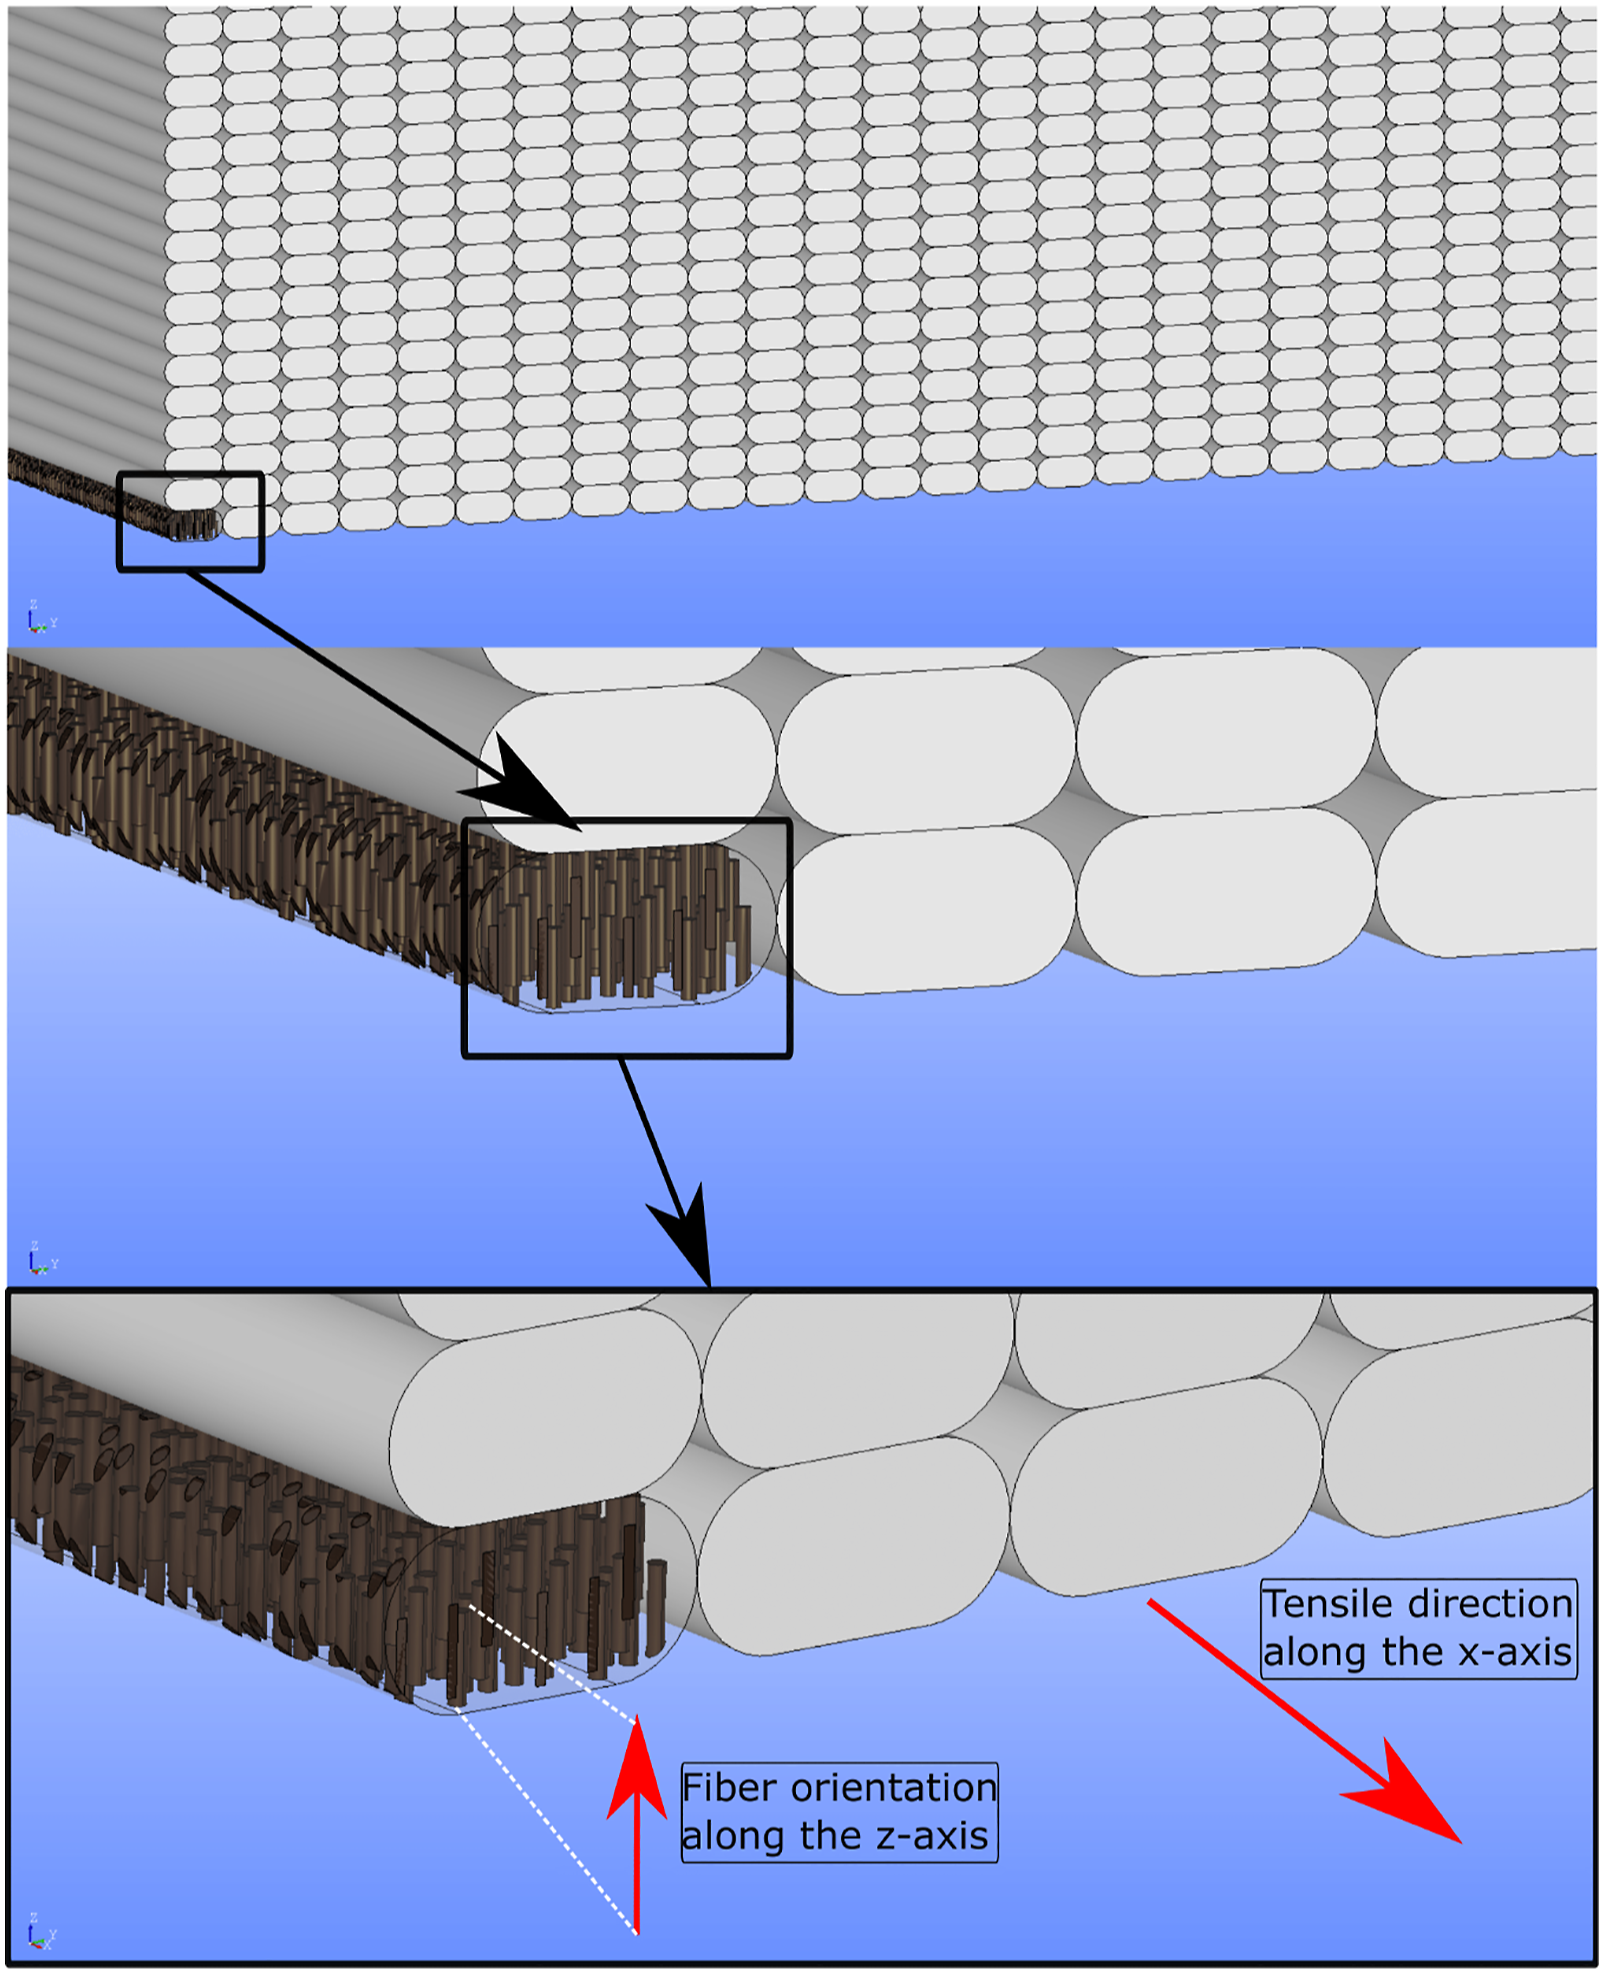
Overall the highest elasticity moduli, Exx, are achieved with continuous fibers along the x-axis. Therefore, continuous fiber reinforcement appears to be the best option if high elasticity modulus along the fiber direction is needed. However, they may complicate the FDM process and cause some process-related problems. In this circumstance, RVEs with short fibers and fiber orientations along the loading direction would be adequate candidates. Significant elasticity moduli increases are achieved in some materials; for instance, at V f = 20%, the elasticity modulus is 6702.81 MPa, almost three times higher than the PETG matrix (2150 MPa). Moreover, fewer problems may be expected with short fiber reinforcements, if adequate parameter optimization is carried out.
Conclusions
In this work, we examined and simulated the mechanical properties of FDM-printed thermoplastic polymer composites on the micro- and mesoscales. PETG and carbon fibers were used as matrix and reinforcement phases, respectively. We prepared and studied 21 RVEs with various fiber volume ratios, fiber orientations along the different axes, and various fiber lengths. Their elasticity moduli were computed by means of asymptotic homogenization on the microscale, and uniaxial tensile test simulations were performed on the mesoscale through FEM. • Transverse isotropic material properties are observed except for the RVEs with random orientations. For transverse isotropic materials, different symmetry axes are generated depending on the orientation axis: x = y for the RVEs with z-axis fiber alignment. y = z, for the RVEs with x-axis orientation. • Microscale analysis results indicate that there are bilinear elasticity moduli increase Exx, Eyy, Ezz with higher volume ratios for short fiber-reinforced RVEs. In contrast, continuous fiber-reinforced RVEs have linear slope. • The mesoscale simulations are carried out by using the computed stiffness matrix from microscale analysis as input parameters. All elasticity moduli, Exx, are decreased after mesoscale simulations since there are microporous areas due to the process of FDM. • The specimens with fiber orientations along the z-axis have the lowest elasticity moduli, Exx. The reason is the perpendicular fiber alignment to the loading direction (x-axis). These results indicate the importance of the proper fiber orientation for composite materials. • The fiber length has a critical effect on the final properties; for instance, the highest elasticity moduli, Exx, are achieved with continuous fibers. The RVEs with L = 0.1 mm fiber lengths have relatively higher elasticity moduli, Exx, than the RVEs with L = 0.08 mm ones. We emphasize that adequate increases in mechanical properties are observed with a higher fiber volume ratio, and fiber orientation along the loading direction.
Footnotes
Acknowledgements
We acknowledge support from the German Research Foundation and the Open Access Publication Fund of TU Berlin.
Declaration of conflicting interests
The author(s) declared no potential conflicts of interest with respect to the research, authorship, and/or publication of this article.
Funding
The author(s) received no financial support for the research, authorship, and/or publication of this article.