
Abstract
One of the main purposes of this research is to control environmental pollution and mitigate the impact of ignorantly discarded waste plastics in the environment through recycling of such plastics and using them to develop innovative composite materials. The present work investigates the influence of stone-dust particles and bagasse fiber on the mechanical and physical properties of reinforced recycled high-density polyethylene bio-composites. The bagasse fiber was first treated with 0.5
Introduction
Composite materials are fast becoming the primary material for virtually all engineering applications. This is mainly due to their specific properties which are suitable for various structural and service applications as well as ease of manufacturing. 1 Currently, there is still massive support for considerable societal change to the use of plastic products throughout the developed world with the primary concern upon: (i) single use plastics for food and domestic packaging; and (ii) improvement of plastic recycling schemes.2–3
Plastic pollution describes the discarding of plastic items in the environment in an uncontrolled or unmonitored manner. Plastic pollution often reaches the oceans and causes problems for marine animals, and this in turn serves as potential ingestion of plastic by humans through the food chain. Hence, the use of waste plastics in conjunction with other wastes for the advancement of zero wastes have been reported. 4 However, recycled material needs to be processed in ways that reduce contamination. 5 Thus, current recycling methods involve filtering for size and type, a comprehensive washing and separation operation, crushing, drying, and granulation to produce a recycled resin pellet product that can be utilized. 6 Nevertheless, low economic value of waste plastic, and the difficult filtering process, has been causing low plastic recycling rates. 7 Also, recycled plastic can suffer degradation in properties compared to virgin polymers, often due to heating when processing, contamination, and immiscibility of differing polymer grades. 5 Phase separation of different plastics produces phase boundaries within the formed product, which limits their potential use, hence, the need to avoid immiscibility of different polymer grades. The only method to eliminate phase separation is to manually sort and separate plastics prior to crushing and shredding, according to their resin identification. 8 Current applications for the relatively small percentage of plastic components that are manufactured using recycled plastics include non-food packaging, traffic bollards and signage, garden furniture, plastic lumber, and automobile. 9
The need to explore other viable low-cost alternative materials as reinforcement in the production of Polymer Matrix Composites (PMCs) lead to the use of abundantly available natural and mineral fibers/particles as reinforcements. The possibilities of using these fibers/particles as reinforcements in composites stimulate the studies of different products combining these raw materials. 10 Each of these natural and mineral fibers/particles has a wide range of mechanical and physical properties governing its wider applications.
Several works have been reported on the use of fibers and particulates either as single reinforcements or in hybrid forms in both virgin and recycled plastics.4,9,10–14 However, comparative studies on the use of reinforcements based on shapes (fiber and particle), as well as origins (from plant (bagasse) and mineral (stone dust)) in recycled high density polyethylene have not been reported. Hence, a comparative study on the properties of recycled synthetic waste plastic was examined to determine which of the single reinforcements will provide the optimum values in the selected properties that were investigated. Most research efforts have not been focused on the use of only wastes 4 ; hence, this paper promotes the development of new composite materials from only waste raw materials. The work promotes an innovative approach to curb the environmental impact of indecently disposed waste plastic and the conversion of such to eco-friendly materials. Besides, finding alternative applications and zero tolerance for wastes are prompted.
Materials and methods
Materials
The materials used for this research were sugarcane bagasse fiber obtained from farmland and stone-dust particles obtained from Sandex Quarry Company which serves as the reinforcements and recycled High Density Polyethylene (HDPE) supplied by ZL Global Alliance Plastic Recycling Company. Other materials used were Sodium Hydroxide (NaOH) pellets supplied by Pascal Scientific Limited while Distilled water was sourced from Corrosion and Electrochemical Research Laboratory, Department of Metallurgical and Materials Engineering, Federal University of Technology, Akure. All the material sourcing and locations were in Akure, Ondo State, Nigeria.
Methods
Preparation of materials
High density polyethylene from broken chair was washed with detergent and rinsed with clean water to remove oil stains, debris, and other contaminant before manual breaking and grinding to the sizes shown in Figure 1. Likewise, bagasse fiber was rinsed with clean water, sundried for 8 h each day within 3 days and, then chopped into short fibers of 8–10 mm lengths using pen knife before treatment with NaOH solution. Granulated recycled high density polyethylene.
Fiber treatment and surface modification
The chopped sugarcane bagasse fiber was treated with 0.5 Chopped/treated sugarcane bagasse fiber.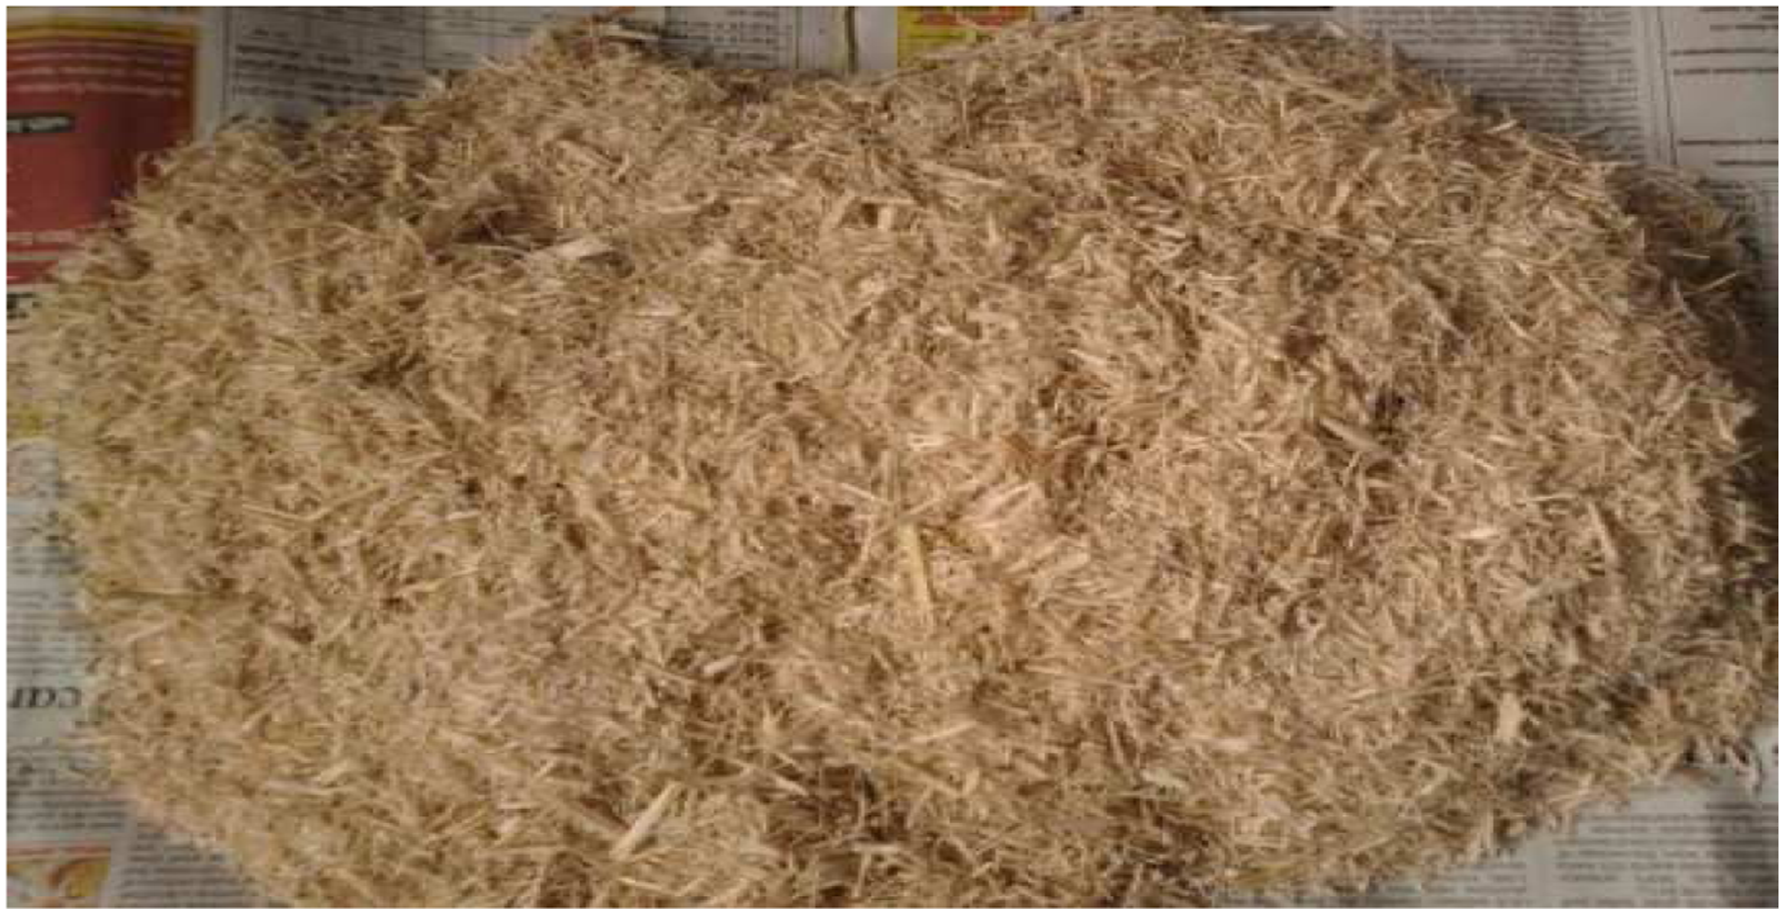
Particle size analysis
Composition of Stone-dust Particles (Hartis et al., 2016). 19

Composite development
The composites were developed using compression molding technique. Predetermined proportion of recycled HDPE, stone-dust particles and treated bagasse fiber were mixed together separately and compounded with compression molding machine. Compounding of samples was carried out in a rectangular mold of dimension 150 × 100 × 3 mm3. The working condition for the production of the composites was 170°C for 7 min at 5 bar. Compounding of samples was carried out to ensure an even distribution of the reinforcement in the matrix and a proper blend, followed by reproduction of the sample using the same working parameters. The respective molds for the properties to be examined were used at this stage. Subsequently, the mold was removed from the compression molding machine and the materials were then allowed to cool in air at ambient temperature. In this way, control sample and composite samples filled with various weight fractions of stone-dust particles and treated bagasse fiber (3, 6, 9, 12, and 15 wt.%) were developed. The mold dimensions for tensile, flexural, impact, and wear are; 90 × 10 × 3 mm3, 150 × 50 × 3 mm3, 15 × 5 × 3 mm3, and 80 × 10 × 3 mm3, respectively.
Examination of mechanical and physical properties
Flexural test
Flexural test was carried out using Tensometric Universal Testing Machine in accordance with ASTM D790-15. 20 Each sample was firmly mounted on the machine and as the sample stretched, the computer generates the graph as well as the desired parameters. Three samples were tested from where the average value was determined.
Tensile test
The test was carried out using an Instron Universal Tensile Testing Machine in accordance with ASTM D638-10 21 standards. The test was conducted at the applied load of 25 kN at a crosshead speed of 5 mm/min. Three samples were tested from where the mean value was evaluated.
Wear test
The wear test was carried out on the Taber Abrasion testing machine. This test was done to know the susceptibility of the material to abrasion. The initial weights of the samples were measured as 
Impact test
The test was carried out on a Charpy impact testing machine (Instron CEAST 9050), in accordance with ISO 179-1:2010 22 standard. Samples were placed horizontally on the machine with the notched surface directly opposite the swinging pendulum. The initial reading of the sample gauge length and the thickness were entered into computer system attached to the machine and the machine was switched on. The pendulum of the machine swung freely through angle 150° and fractured the sample. Three samples were tested from where the mean value was evaluated.
Hardness test
Hardness test was conducted on the sample using Shore D hardness tester following ISO 868:2003. 23 The samples were placed on the flat surface of the tester stand and indented. Four values were obtained by indenting the samples in four different places and the average value was used for analysis.
Thermal conductivity
Lee’s disk apparatus, comprising a temperature controller, contactor, thermocouple sensor, and heater, was used for the determination of thermal conductivity of the developed composites and the control sample. Power was supplied to the contactor switch and heater from 220 V/50 or 50/60 Hz source. Temperature controller 1 was activated to a preset temperature value T 1 for disk A. The heat from the heater is transferred from the disk A through the sample to the disk B. The two sensors Th1 and Th2 connected to the disks are used to sense temperature changes in the metal disks. The process was set up by placing the sample in between disk A and disk B. The switch was on and disk A is preset to known temperatures that act as reference temperature. Temperature change in disk B was noted and recorded at a regular interval until there is no temperature change taking place. The apparatus was switch off after taking the final readings which was used to determine the thermal conductivity from equations (2) and (3).
Thermal conductivity
Thermal conductance was calculated from the thermal conductivity and thickness of the material as shown in equation (3).
Water absorption test
The water absorption tests were carried out in accordance with ASTM D570-10.
24
The weight of the dry samples was reported as the initial weight of the composites. The samples were then placed in distilled water maintained at room temperature and at time intervals of 2 h, the composite samples were removed from the water, cleaned using a dry cloth and weighed. The weight measurements were taken periodically at time intervals of 24 h for up to 168 h. This was after water saturation in all the composite samples had been noticed. The amount of water absorbed by the composites (%) was calculated using the equation (4).
Scanning electron microscope Observation
Scanning Electron Microscope (SEM) of Model JEOL JSM-7600F was used for the morphological characterization of the composite sample surfaces. This was carried out to investigate the miscibility of the particles/fiber with the matrix at the fractured surfaces. Samples cut with bench vice were cleaned thoroughly, air-dried, and glued on sample holder before coated with thick irradium in JEOL sputter ion coater and observed.
Results and discussion
Flexural properties
It has been established that flexural strength shows the aptitude of material to oppose the applied bending forces under three-point loading conditions while flexural modulus is used as an indication of a material’s stiffness when flexed.
Flexural strength at peak
Figure 3 shows the variation of flexural strength at peak with composite samples and the control. It was observed that the flexural strength at peak for the composites tends to decrease linearly as the reinforcement contents increases. Stone-dust reinforced composite samples decreases linearly from 3 wt.% to 12 wt.% while the bagasse fiber reinforced composite samples showed a similar behavior between 3 wt.% and 9 wt.%. This showed that optimum results could be achieved at lower reinforcement content probably due to adequate filling of pores within the polymer and less agglomeration at this level of reinforcement loading. Moreover, the result revealed that stone-dust particles reinforced composite samples had better flexural strength at peak than their counterparts that were reinforced with bagasse fibers. The reason for the superlative strength from stone dust may be due to superior interfacial adhesive strength at the particle–matrix interface in the stone-dust particles reinforced composite which was more pronounced compared to those observed at the fiber–matrix interface in the counterpart composite reinforced with bagasse fiber in agreement with the report of Daramola et al.,
25
Likewise, the presence of elements like Silicon, Iron, Calcium, and Magnesium in high proportion as shown in Table 1 could also aid improved strength. Similarly, treated bagasse fiber with improved cellulosic strength
26
was also responsible for the observed enhancement from the bagasse fiber reinforced composites. Both reinforcements gave improved flexural strength at peak values compared to the control sample. Hence, composites sample with 3 wt.% reinforcement gave the best result with a value of 56.97 MPa for stone-dust particles. The flexural strength at peak for the control was 30.29 MPa and, when compared to the composite with the optimum value, amounted to about 88% enhancement from the use of stone-dust particles. Also, a look at the best sample from bagasse fiber showed that about 55% improvement was attained. Variation of flexural strength at peak with composite samples and the control.
Flexural modulus
Figure 4 shows the variation of flexural modulus with composite samples and the control. Jeziorska et al.,
27
reported that the improvement in the modulus of a composite depends on the morphology of composite samples. In a related mode to Figure 4, the addition of the reinforcement has improved the flexural modulus of most of the composite samples compared to the control sample. As reported in earlier results shown in Figure 3, similar response was observed from the results which may also be due to the same reasons stated above. Stone-dust particles reinforced composite also had better flexural modulus compared to composite samples reinforced with bagasse fibers. The linear reduction in the composites modulus for both reinforcements could be due to several factors which generally affects the overall properties of composite materials, some of which includes, fiber orientation and distribution, degree of bonding at the fiber-matrix interphase, lay-up sequence, variation in particle sizes for the particle reinforced composites, and the interdependencies between all of these factors. Thus, composite sample with 3 wt.% reinforcement in both cases gave the best results with a respective value of 2393.39 MPa and 1598.77 MPa for stone-dust particles and bagasse fiber reinforced composites. The results when compared with the control sample gave about 92% and 28% improvements, respectively. Part of the justification for this may be due to the lower fraction of the reinforcements which was evenly dispersed in the matrix and proper wetting of the reinforcement surface. From the foregoing, it can be stated that substantial flexural properties could be achieved in stone-dust particles reinforced recycled HDPE bio-composites than bagasse fiber based bio-composites due to proper filling of the polymer pores by the stone-dust particles. Variation of flexural modulus with composite samples and the control.
Tensile properties
It was observed from Figure 5 that bagasse fiber reinforced composites were generally able to withstand higher stress than that of the stone-dust particle reinforced composites. It was observed that 12 wt.% bagasse fiber reinforced composite has the highest stress value while sample with 15 wt.% bagasse fiber reinforced composite have the highest strain value. This is most likely due to the fiber–matrix interfacial bonding which is highly dependent on the fiber orientation and distribution, as well as the surface roughness of the fibers. Hence, it was noticed that higher bagasse fiber content aid the enhancement of tensile properties of the developed composites than low content and stone-dust particle reinforced samples. The stone-dust particles on the other hand may fill up the polymer voids but not have sufficient particle-matrix bond strength, and as such may experience de-bonding at lower tensile load than the bagasse fiber reinforced composites. Generally, the deformation behavior of both the bagasse fiber and stone-dust particle reinforced composites shown in Figure 5 are seen to progress in three stages; an initial stage characterized by elastic deformation in which the material still obeys Hooke’s law, followed by a second stage characterized by yielding in which the material undergoes visco-elastic deformation and then the last stage which is characterized by a region of plastic deformation where the plastic strain increases at a constant plastic (yield) stress until total failure occurs and the stress the material can withstand reduces to zero.
28
It therefore, means that both the deformation mechanism of both the bagasse fiber and stone-dust particles plays an important role in the deformation behavior of the developed composites. Tensile stress-strain curves for the developed composites and the control.
Ultimate tensile strength
The variation of ultimate tensile strength (UTS) with composite samples and the control was as shown in Figure 6 which was an extract from Figure 5. It was discovered from the results that the addition of bagasse fiber enhances the ultimate tensile strength of the composite samples reinforced with bagasse fiber while the reverse was the case for the stone-dust particle reinforced composite samples. There is linear relationship between the reinforcement and the UTS in an inverse proportion for the two reinforcements. It was observed that while UTS tends to increase as bagasse fiber increases, it tends to decrease as stone-dust particle increases. The UTS was optimum at 12 wt% for bagasse fiber based bio-composites with a value of about 33.18 MPa while there was no enhancement in UTS from the stone-dust particle based bio-composites. Parts of the reason for this could be due to the fact that tensile loading is directional, fibrous materials are more resilience to tensile pull than particles. Besides, having treated the bagasse fiber, the strength and surface morphology has been improved.
15
The decrease in UTS at 15 wt.% reinforcement content might arise as a result of agglomeration of the fiber which usually occurs at higher weight fraction. Following the improvement, the enhancement achieved was about 43%. Variation of ultimate tensile strength with composite samples and the control.
Tensile modulus
Figure 7 show the variation of tensile modulus with composite samples and the control. It was observed from the result that the addition of both reinforcements enhances the tensile modulus of the developed bio-composite samples. All the developed bio-composite samples had better tensile modulus than the control sample with a value of 287.11 MPa. However, bagasse fiber reinforced composite samples exhibited better tensile modulus compared with their counterpart reinforced with stone-dust particles. Furthermore, bagasse fiber reinforced composite samples revealed a linear increase in tensile modulus of composite samples with an increase in bagasse fiber content, this was in agreement with the work of Verma et al.,
29
and Singh et al.,
30
which reported that an increase in bagasse fiber content resulted to an increase in the tensile modulus and storage modulus of the composite samples, respectively. On the other hand, stone-dust particles reinforced composite samples did not followed any perfect trend but had its optimum result at 12 wt.% with a maximum value of 327.09 MPa. Comparatively, bagasse fiber reinforced composite sample having 15 wt.% bagasse fiber content gave the optimum result with a value of 385.91 MPa. Resulting from this was an enhancement of about 34% from bagasse fiber based bio-composite while it was about 14% from stone-dust particle based bio-composite. Variation of tensile modulus with composite samples and the control.
Impact property
Figure 8 show the variation of the impact strength with composite samples and the control. It was observed from the result that the addition of both reinforcements enhances the impact strength of the developed composite samples seeing that all the developed composite samples had improved impact strength than the control sample with a value of 10.76 kJ/m2. However, bagasse fiber reinforced composite samples exhibited better impact strength compared with their counterpart reinforced with stone-dust particles. Moreover, bagasse fiber reinforced composite samples show a steady increase in impact strength of the bio-composite samples with an increase in bagasse fiber content which agreed with the work of Zhang et al.,.
31
It was reported that an increase in bagasse fiber content may result in a slow but steady increase in the impact strength of composite samples.
32
Also, similar trend was observed in the stone-dust particles reinforced composite samples. Composite samples with 15 wt.% reinforcements in both cases gave the optimum results with values of 11.91 kJ/m2 and 11.89 kJ/m2 for bagasse fiber and stone-dust particles, respectively. Thus, this culminated to about 11% improvements from each bio-composite. The result showed that both reinforcements gave equal enhancement in impact strength from both fibrous and particulate reinforced recycled HDPE based bio-composites. According to a report by Singh et al. (2021a),
33
it was revealed that fiber reinforced polymer composites are generally accompanied with sufficient voids inherited due to the human errors that may occurred during manufacturing process. These voids can serve as stress raiser and accelerate the crack initiation and propagation. They further emphasized that nanoparticles can act as interlocking pins in the interphase of matrix and fiber, which strengthens the interfacial adhesion and contributing to the enhancement of impact energy. Hence, inclusion of stone-dust in polymer will aid the filling up of voids and efficiently hinder the micro-cracks initiation and propagation in composites. Moreover, the stone-dust particles could absorb higher energy due to the larger surface to volume ratio and this may also be the reason behind the improvement in the impact strength. Variation of the impact strength with composite samples and the control.
Hardness property
Hardness property is the ability of a material to withstand/resist surface indentation. Figure 9 show the hardness property of the developed composite samples and the control. From the results, it was observed that the developed composites had better hardness property than the control sample. Similar to previous results, linear relationship was observed in both reinforcements with respect to the hardness where the values tend to increase as the reinforcement content increases. The result further revealed that stone-dust particle reinforced composite samples had better hardness property than their counterpart reinforced with bagasse fiber. This improved property from stone dust reinforced recycled high density polyethylene can be linked with the elemental constituents that are present in the stone dust as shown in Table 1 and other reasons as stated in the discussion of Figure 8. Besides, stone dust is a hard phase. The best result was obtained from 15 wt.% stone dust reinforced composite sample with a value of 60 HS while the best from the same content of bagasse fiber was with a value of 54 HS. The percentage enhancements from these are 40% and 26%, respectively. Variation of hardness property with composite samples and the control.
Wear property
Figure 10 show the wear resistance of composites samples with both bagasse fiber and stone-dust particles and the control. From the result, it was observed that all the composites samples had better wear resistance compared to the control sample. This showed that the addition of the reinforcements has improved the wear resistance of the developed bio-composites. Likewise, it was discovered that increasing the percentage of reinforcements in all the composite samples results in an increase in the wear resistance of the bio-composites samples in agreement with the observed trend for the hardness in Figure 9. Hence, composite samples with 15 wt.% reinforcement content for both the bagasse fiber and stone-dust particles with a respective values of 0.2280 g and 0.2185 g gave the optimum results showing excellent resistance to wear property. In all the compositions considered from the results, stone-dust particles reinforced composite samples showed the best response in wear property when compared with bagasse fiber reinforced composite samples. The best sample from stone-dust particles enhances the wear resistance of the developed composite samples by almost 559%. This feat was possible due to the fact that stone dust was a hard phase and has been properly blend with the polymer. Also, from the discussion of results in the previous sections, other factors that can aid adequate performance of the developed composites from stone dust have been highlighted. Stone dust can be used as filler in polymer composites to enhance the wear resistance of the composites. This is very important in areas where friction and abrasion are prominent like shoe sole, automobile wheel, and other moving parts. Variation of wear resistance with composite samples and the control.
Thermal conductivity properties
Figure 11 showed the thermal conductivity of the bio-composite samples reinforced with bagasse fiber and stone-dust particles as well as the control. From the results, it was observed that the addition of both reinforcements greatly improved the thermal conductivity of the developed bio-composite samples compared with to control sample. This showed that improved thermal conductivity property can be achieved by the incorporation of these reinforcements into the recycled HDPE bio-composites. This finding also agreed with the submission of Zhang et al.
31
Both reinforcements gave a linear increase in thermal conductivity as they increases but with bagasse fiber emerging the best in all the compositions. An optimum value of 2.26 W/mK was achieved at 15 wt.% for bagasse fiber while stone dust at the same composition had 1.36 W/mK. Treated bagasse fiber reinforced composites possess improved thermal conductivity than stone dust based composites and the control due to high molecular movement that is the basis for thermal conductance. Also, due to the possibility of the transfer of thermal energy between particles of matter that are touching, stone dust based composites possessed improved thermal conductivity compared to the control. Improved thermal conductivity in the developed composites occurred due to the likelihood of the presence of porosity or voids in high proportion in the control sample. Variation of thermal conductivity with composite samples and the control.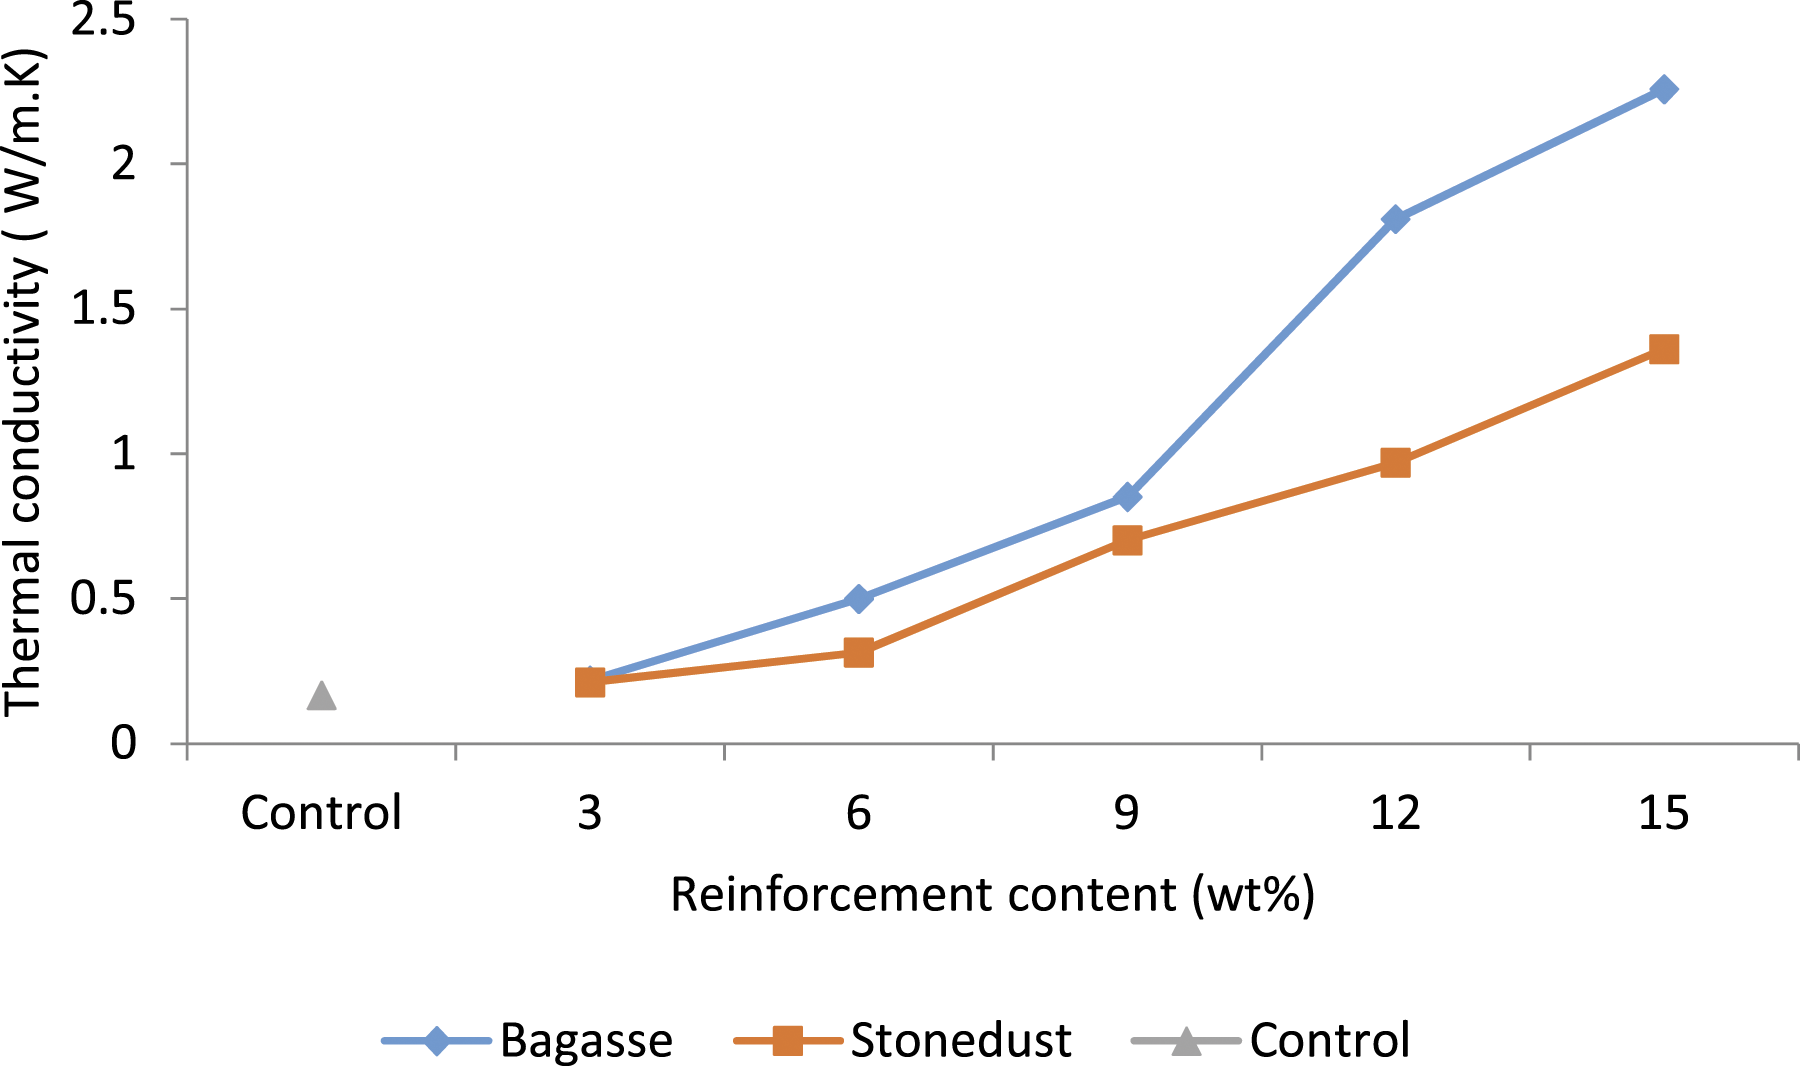
Water absorption behavior
Figure 12(a) showed the weight gained by bagasse fiber reinforced composite samples and the control. It was noticed from the results that all the developed bio-composites absorbed more water than the HDPE due to their conflicting response to moisture in the environment. It has been reported in many literatures that polymers are highly hydrophobic while vegetable fibers are highly hydrophilic and this has contributed to the reasons why they are treated before use.32,34,35 Such treatment usually helped in the reduction of this propensity from agro fibers. Hence, while the control sample absorbed the least amount of water with a value of about 1.99%, the bio-composites absorption was within the range of 6.18–8.14% from 3 to 15 wt.% reinforcement content, respectively. The rate of moisture absorption was seen to be linear whereby, as the reinforcement content increases, moisture absorption also increases. The least absorption was achieved in 3 wt% composition which may be due to the lower fiber content in the composite and the treatment of the fiber which has reduced the amount of hemicellulose responsible for water retention in the fiber in concordance with the result earlier reported by Abdullah et al.
36
Graph of weight gained against exposure time; (a) bagasse fiber reinforced composites and the control (b) stone-dust particles reinforced composites and the control.
Also, Figure 12(b) showed the weight gained of composite samples reinforced with stone-dust particles and the control. Comparable trend to Figure 12(a) was also observed in the stone-dust particles reinforced composite after a period of 7 days. All the developed bio-composites absorbed more water than the control and the range of moisture absorption fall within 4.23–5.24% with a linear relationship as seen in Figure 12(a). Sample from 3 wt.% reinforcement content had the best water repellant property due to the least absorption with a value of about 4.23% compared to bagasse fiber reinforced recycled HDPE bio-composites.
These results further revealed that stone-dust particle reinforced HDPE bio-composites had better water repellant property than their counterpart reinforced with bagasse fiber. The values for the range of absorption and the interval were high for bagasse fiber than for the stone dust due to the reason stated in Figure 12(a). Also, water absorption in solid followed the diffusion principle, and diffusion is the movement of molecules from an area of high concentration of the molecules to an area with a lower concentration. The difference in the concentrations of the molecules in the two areas is called the concentration gradient. The kinetic energy of the molecules results in random motion, causing diffusion, hence, as stated in Figure 11, high molecular movement in treated bagasse fiber based composites also promote high water absorption of the composites compared to other samples.
The SEM images for the control and the developed bio-composites with improved properties were shown in Figures 13–15, respectively. SEM image of the control sample. SEM Images of, (a) 3 wt.% Bagasse Fiber Reinforce Composite and (b) 3 wt.% Stone-dust Particles Reinforced Composite. SEM Images of, (a) 15 wt.% Bagasse Fiber Reinforced Composite and (b) 15 wt.% Stone-dust Particles Reinforced Composite.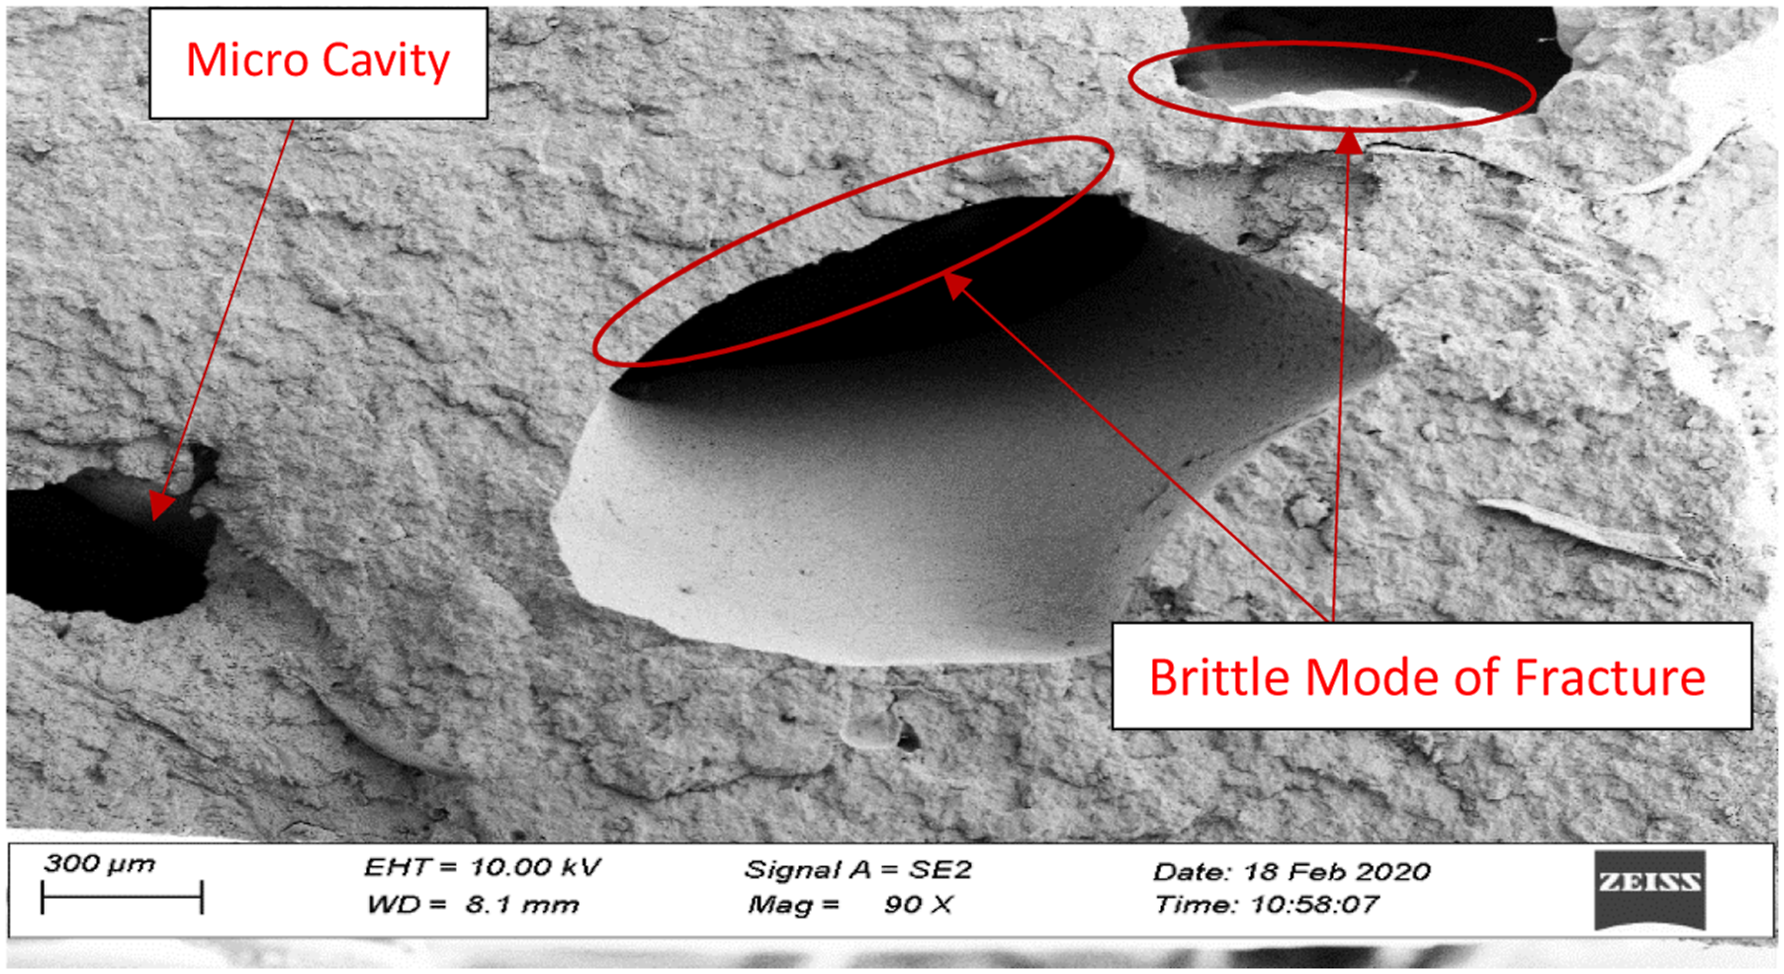

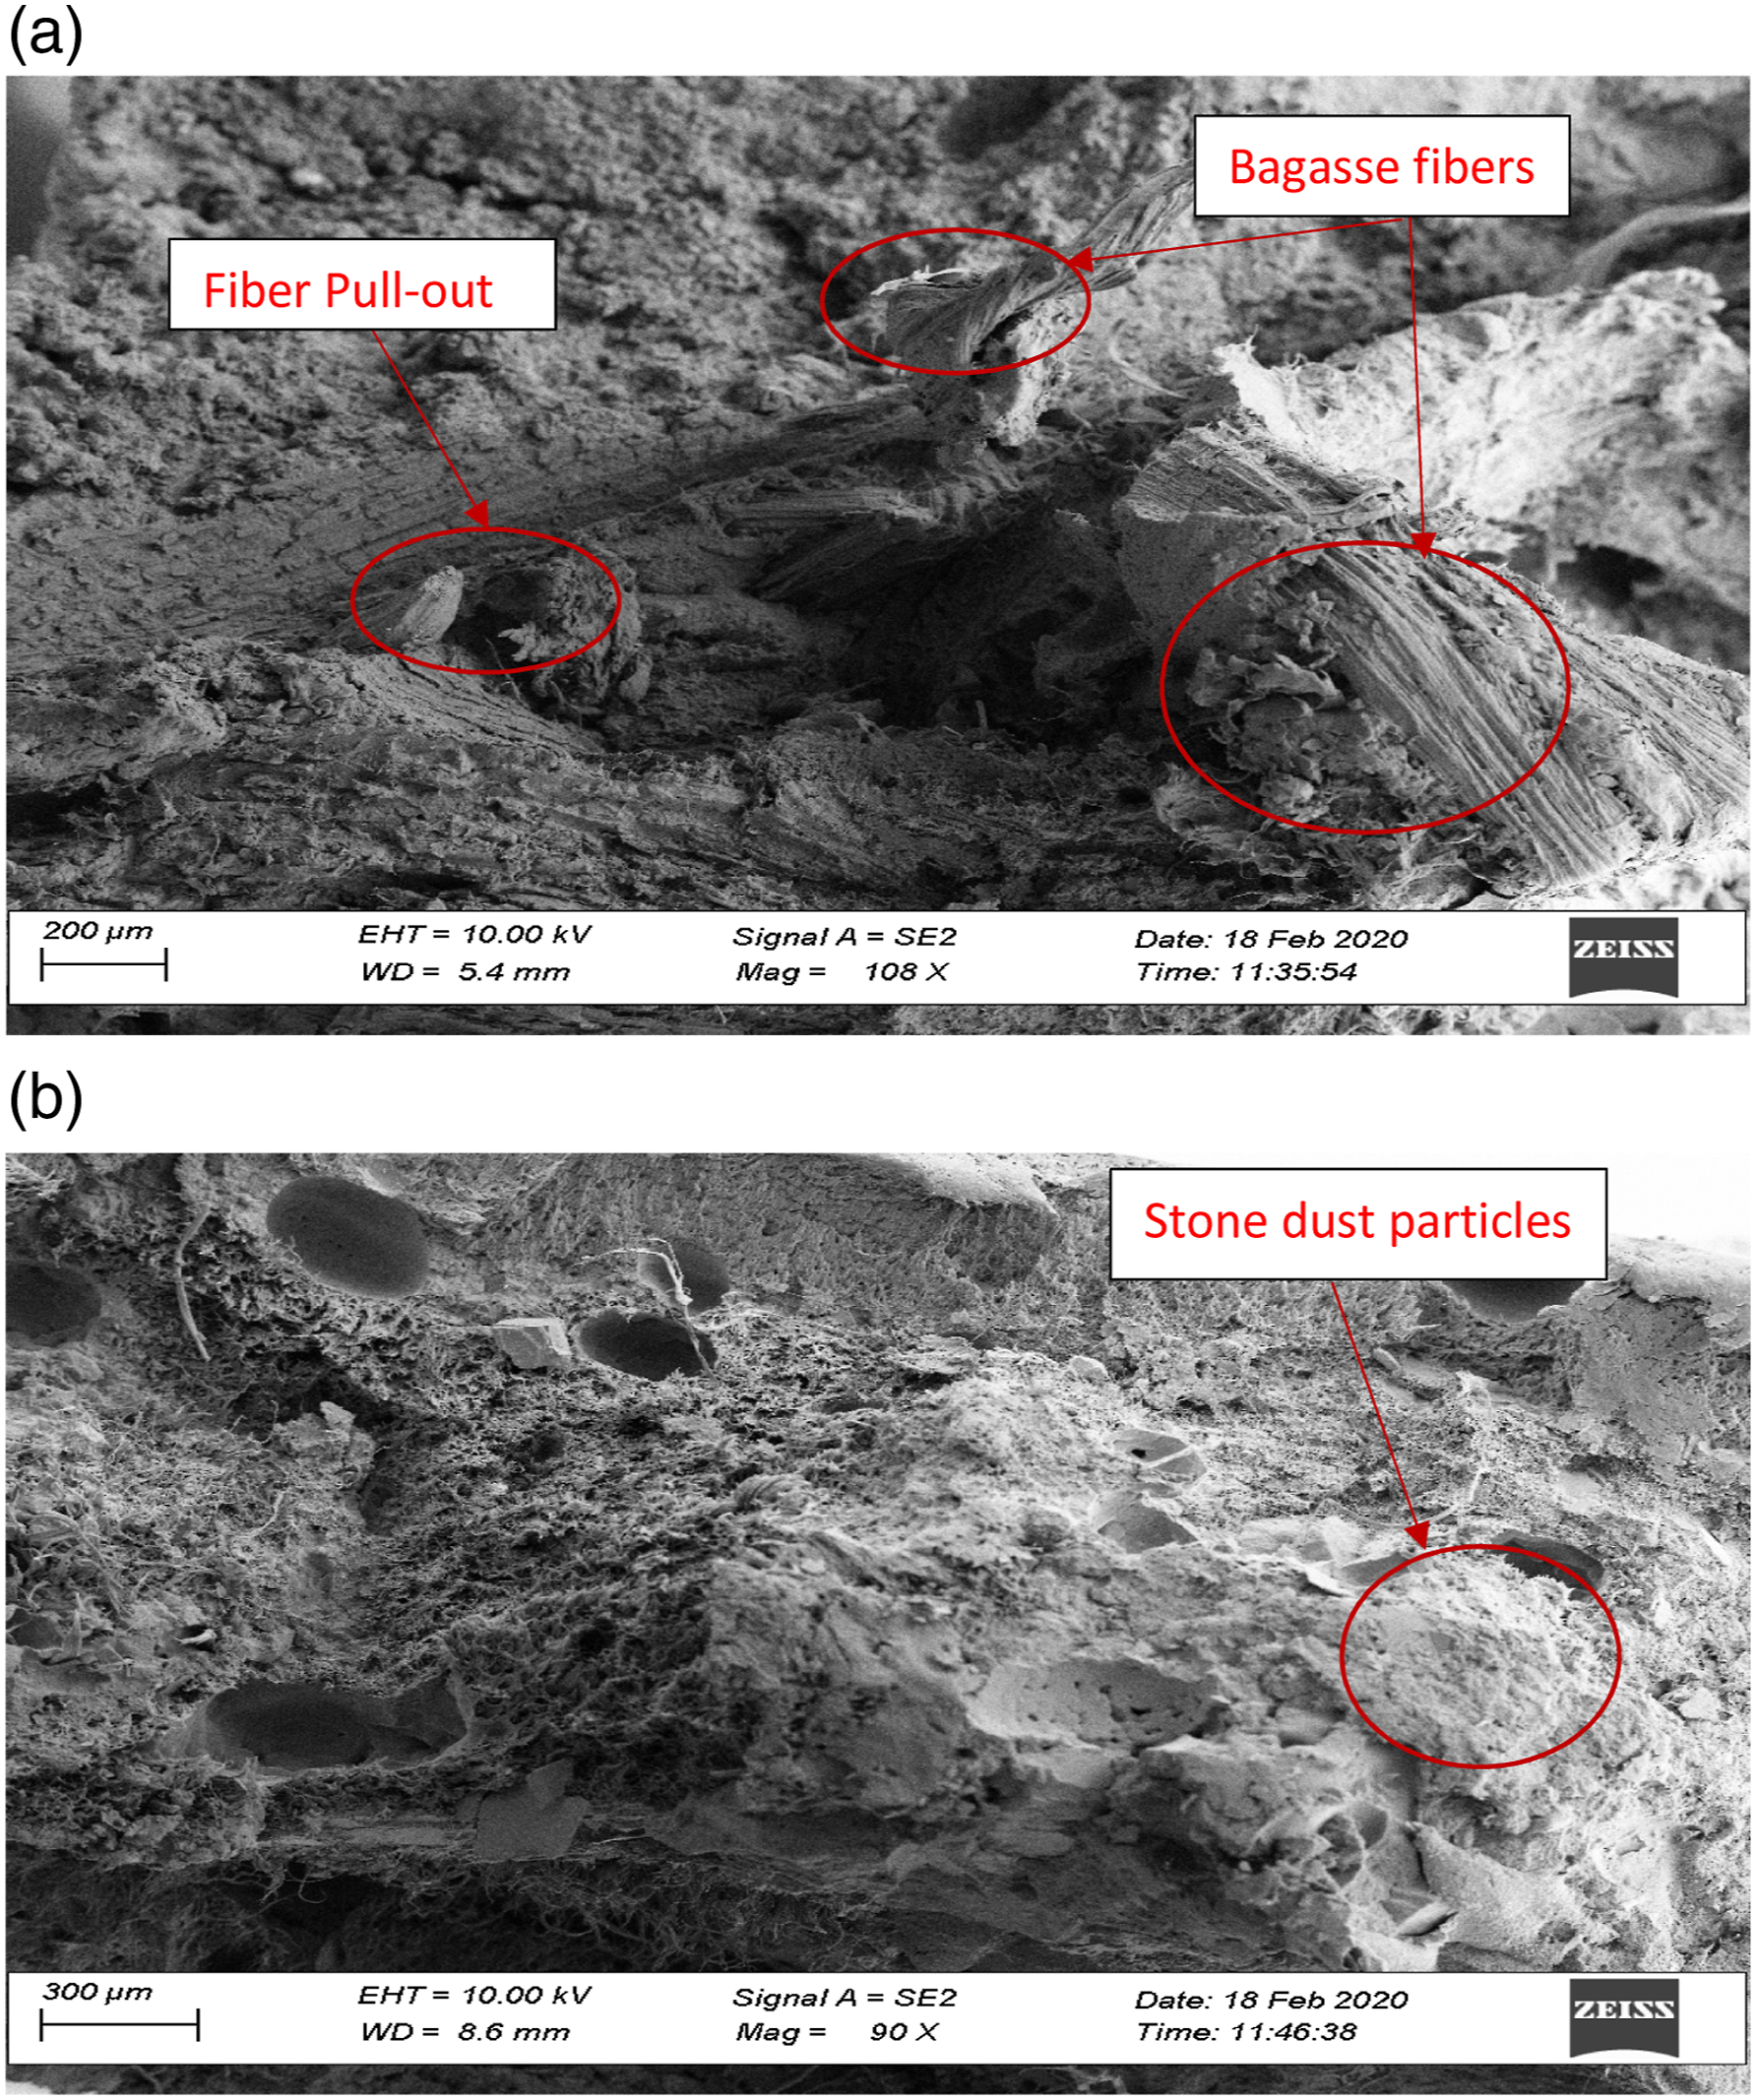
Figure 13 revealed the surface morphology of the fractured control sample. It was seen from the image that pores are present within the materials due to trapped air during production and this might be part of the reasons for the observed performances from the tests carried out. This condition in most cases usually causes the strength of the materials to be reduced, hence, the need for adequate reinforcement. Oladele et al. (2021), 37 highlighted various philosophies for the advancement of polymer-based composites.
Figure 14(a) and (b) showed the SEM images for 3 wt.% treated bagasse fiber and 3 wt.% stone-dust particles reinforced recycled HDPE bio-composites, respectively. From the micrographs, it was observed that both composites appear to have good interfacial adhesion at the fiber-matrix/particle-matrix interface. Also, the reinforcements were well dispersed within the matrix. These observed features may be due to low fraction of the reinforcements in these composites as well as the surface modification of the fiber in the case of bagasse fiber reinforced composite. Though the presence of voids was observed but they are not as pronounced when compared with the control sample in Figure 13.
Figure 15(a) and (b) showed the SEM micrographs for 15 wt.% bagasse fiber and stone-dust particles reinforced bio-composites, respectively. From the results, it was observed that there are fewer voids in the microstructure of these composites compared to Figure 14(a) and (b) due to the more filling of the pores at higher reinforcement content. These high reinforcement contents also cause the bagasse in (a) to aid the load bearing capacity, while in (b) it led to low agglomeration of the particles which tends to reduce the load bearing capacity of the material. Apart from this, every other thing that characterized Figure 14(a) and (b) was found in these images. Hence, improved properties in most of the properties examined were observed from these bio-composites. All improved properties from bagasse fiber based bio-composites are from this composition with the exception of UTS that emerged at 12 wt.%.
Conclusion
The research outcome revealed that flexural, hardness, wear, and hydrophobicity properties of stone-dust particles reinforced bio-composites were better enhanced than their counterparts that were reinforced with bagasse fiber while tensile, impact strength, and thermal conductivity properties were better improved in the bagasse fiber based bio-composites than stone dust based bio-composites. Most the improved properties from stone-dust particle based composites are from both 3 and 15 wt.% while for bagasse fiber based composites, 15 wt.%. This showed that only at high reinforcement content that bagasse based bio-composites properties were improved. Hence, these two wastes have shown that they are potential bio-materials for the development of bio-composites. The use of recycled waste plastic has been advanced with improved hardness and wear resistance for the development of polymer based composites which can be adapted towards products for automobile and other areas where abrasion and friction are prominent.
Footnotes
Acknowledgement
The views expressed in this publication are those of the author(s) and not necessarily those of the AAS, AUDA-NEPAD or Carnegie Corporation. The services of Dr. M. O. Bodunrin of the Department of Chemical and Metallurgical Engineering, University of the Witwatersrand, South Africa, in carrying out SEM analysis are appreciated.
Declaration of conflicting interests
The author(s) declared no potential conflicts of interest with respect to the research, authorship, and/or publication of this article.
Funding
This work was supported through the AESA-RISE Fellowship Program [ARPDF 18-03], African Materials Science and Engineering Network (A Carnegie-IAS RISE network) and the DST-NRF Centre of Excellence in Strong Materials. AESA-RISE is an independent funding scheme of the African Academy of Sciences (AAS) implemented with the support of Carnegie Corporation of New York. At The AAS, AESA-RISE is implemented through AESA, the Academy’s agenda and programmatic platform, created in collaboration with the African Union Development Agency (AUDA-NEPAD).