
Abstract
As the first stewards and scientists, Indigenous Peoples have collected data on land relationships across homelands since time immemorial. Settler-colonial experiences have associated data and maps as tools of dispossession, disparity, and disempowerment. Today, however, Indigenous-led statistics and mapping efforts yield powerful tools for Nations in addressing the interconnected wellness of Indigenous biosystems, lands, and people while honoring collectively held knowledge and community protocols. This article details both quantitative and qualitative Indigenous research, with geospatial methodologies of the Amskapi Piikani (Blackfeet Nation), in the creation of the Amskapi Piikani Nation’s first well-being index. The Piikani Well-being Index (PWI), generated by this project, is grounded in cultural values and informed by traditional and current knowledge(s) defining 80 variables. The PWI encompasses areas of human health, agriculture and food sovereignty, cultural systems, social and educational lifeways, environmental stewardship, institutions and governance, economics, and land tenure to include traditional land use and Native land revitalization after centuries of systematic oppression, assimilation policies, structural inequities, and trauma. This project navigates data sovereignty challenges while mobilizing data generated by the Nation’s first Indigenous land use census. Offering new insights for our Tribal leaders and organizations at nation, local, and watershed scales, the PWI represents an Indigenous system view to better build community research agendas and action. This article discusses the challenges incurred in data collection and use while identifying areas of future work determining metrics and tools to cover the environmental, social, economic, and health research needs of Indigenous communities through data sovereignty.
Keywords
Introduction
The Piikani Well-being project is a community-based research project of the Piikani Lodge Health Institute, an Indigenous-led non-profit organization located within and serving the Blackfeet Nation with a focus on holistic development. The Piikani Well-being Index (PWI) is informed by traditional and current knowledge(s) and encompasses areas of human health, agriculture and food sovereignty, cultural systems, social and educational lifeways, environmental stewardship, institutions and governance, economics, and land tenure. This project navigates data sovereignty challenges while mobilizing data generated by the Nation’s first locally led land use census. Offering new insights and maps for our Tribal leaders and organizations at Nation, local and watershed scales, the PWI represents an Indigenous system view to better build community research agendas and action.
This research project is rooted in and intended to serve the community in which the knowledge originates and is guided by seven core cultural values active in Amskapi Piikani community development, educational, and governance systems:
Tsi-ksi-ka-ta-pi-wa-tsin (Blackfeet Way of Knowing): Blackfeet culture/spirituality in philosophy, thought and action. Nin-na-wa-tsin (Being a Leader): professionalism, integrity, and responsibility in human interaction Ini-yimm (Respect): respect for oneself, all other people, all ideas and each thing in the natural world Ni-ta-pi-pa-ta-pi-tsin (Living in a Good Way): honest in all thoughts and actions. Ii-yi-kah-kii-ma-tsin (Trying Hard): commitment, dedication, sincerity in the pursuit of all our goals. Aoh-kan-otah-tomo (Accepting Everyone): embracing the unique talents and contributions of each individual. Ii-ta-mii-pa-ta-pi-yoip (Happy Living): humor, laughter and enjoyment of life.
This article details quantitative and qualitative Indigenous-led research, including geospatial methodologies of the Amskapi Piikani (Blackfeet Nation), in the creation of the Amskapi Piikani Nation’s first well-being index. The context of the Blackfeet Nation is followed by a review of the academic literature on Indigenous well-being and research methodologies. An overview of the PWI describes its development in the context of a larger research project on Blackfeet food sovereignty, demonstrating the holistic nature of our work. A detailed description of the PWI methodology follows along with the results of the engagement and a discussion of their implications. Finally, we draw conclusions, insights, and next steps for future research.
The Blackfeet Nation
From time immemorial, Niitsitapi People of the Blackfoot Confederacy have governed and stewarded the health and well-being of the land and the people across vast homelands. These homelands stretch southward to what is now Yellowstone National Park, west to the continental divide, north to the North Saskatchewan River, and east to the East Saskatchewan and Missouri Rivers. Sharing a common language and traditional governance, the four Nations of the Siksikaitsitapi—the Amskapi Piikani, the Kainai, the Piikani, and the Siksika—make up a transboundary Indigenous confederacy. The Amskapi Piikani (Blackfeet Nation) is the southernmost Nation of this confederacy located south of the medicine line (US–Canada border). The current boundaries of the Blackfeet Nation encompass 1.5 million acres with 90% of the population living rurally across 5 watersheds and 11 major communities (Blackfeet Nation Agricultural Resource Management Planning Team, 2022; Luna and Bahls, 2017). Ecosystems range from alpine and subalpine in the Miistakis (Backbone of the World) and Ninaistako (Chief Mountain) at 9085 feet (2769 m) in the west, and roll through mixed forests, fen wetlands, prairie pothole lakes, temperate grasslands, and the lowlands along the Cut Bank Creek at 3400 ft (1000 m) in the east (see Figure 1) (Blackfeet Nation, 2018a, 2018b; Blackfeet Nation Agricultural Resource Management Planning Team, 2022; Luna and Bahls, 2017; State of Montana, 2021; US Department of Agriculture (USDA) National Agricultural Statistics Service (NASS), 2017). With its topographical and ecological diversity, this region represents more than 50% of the remaining biodiversity and intact large landscapes in the region and state but only a remnant of the traditional homelands of the Amskapi Piikani (Luna and Bahls, 2017; Tatsey and BirdRattler, 2019).
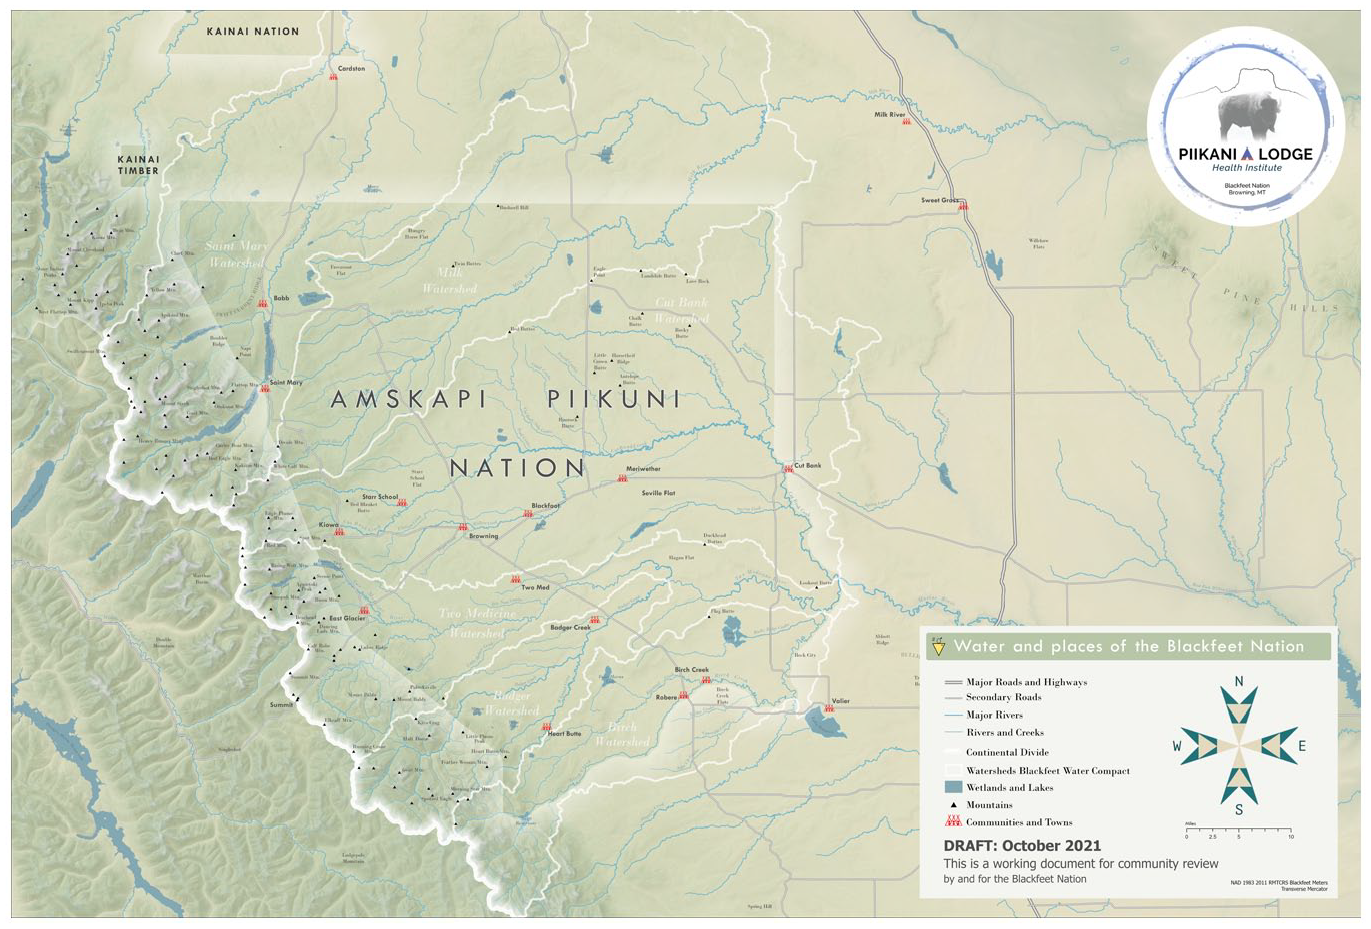
Placenames of Amskapi Piikani and near homelands, 2021.
The exterior boundaries of the current Blackfeet Reservation emerged from the 1855 Blackfeet (also known as Lame Bull) Treaty and, with these boundaries, new hardships to be borne by a Nation now limited in movement and food sources. In the intervening decades, the governance, environmental monitoring, and health systems of the Amskapi Piikani have undergone many changes, often to the detriment of the Blackfeet People. Beginning with the debt system imposed by Indian Agents, loss of land and community through Allotment, and the establishment of government-run health and educational systems, the collective form of observation that informed Blackfeet ways of being and well-being was severely constrained or else used to the advantage of the US federal government in the control of Native people.
With the passage of the Indian Self-Determination and Education Assistance Act in 1975, a new era in federal policy began to create a space for Tribal self-determination and the ability of Tribal Nations to run their own systems again. The reclamation of health delivery systems, access to culturally relevant care, and data and monitoring systems to inform decisions have been a living project to this day. Today, the Blackfeet Nation has one Indian Health Service (IHS) hospital located in the main population center and one rural clinic for outlying communities. The Tribal government operates its own health department, a Tribal Health Improvement Program, a diabetes clinic, two SAMHSA programs, in school health staff, and a suite of other programs aimed at improving the health of Native and local families (Blackfeet Tribal Health Department, 2017). While Western-style medical care exists in a limited fashion, many people access health on the land, with family and ceremony rather than through Western medical institutions where painful memories and abuses persist, and barriers to timely and culturally relevant care remain (Conaty, 2015; US Government Accountability Office, 1976).
Literature review
Defining and measuring Indigenous well-being
The concept of human “well-being” encompasses many fields of applied research and remains locally interpreted and subjective. As early as 1948, well-being was defined by the Constitution of the World Health Organization (WHO) as “a state of complete physical, mental and social well-being and not merely the absence of disease or infirmity.” It refers to a “positive rather than neutral state, framing health as a positive aspiration” (WHO, 1948). Globally, the well-being of Indigenous Peoples is reaffirmed in the United Nations Declaration of the Rights of Indigenous Peoples which honors rights that are “indispensable for their existence, well-being and integral development as peoples.” These are enshrined in Article 43 where Indigenous rights “constitute the minimum standards for the survival, dignity and well-being of the Indigenous peoples of the world” (Gómez Isa, 2019; United Nations Declaration on the Rights of Indigenous Peoples, 2007). Definitions and applications of the concept continue to develop, recognizing an increasingly complex and nuanced understanding (e.g. see Fudge et al., 2021; Sointu, 2012; Yaduen-Antuñano, 2020).
To date, studies of the well-being of Indigenous peoples—globally, regionally and locally—illustrate substantial disparities often between members of the settler colonial state and the first people(s) of the region (Donatuto et al., 2016; Washington, 2016). Well-being in Indigenous communities is challenged in part by colonial histories. These histories have resulted in local conditions of very high social vulnerability and result in chronic illness, trauma, persistent poverty, inadequate housing, economic underdevelopment, and low levels of land tenure (Birkmann, 2006; Cardona et al., 2012; Cutter et al., 2003; Lee, 2014). Indigenous well-being studies and metrics must grapple with these historical and modern settler-colonial systems and their resulting trauma but also turn toward culturally relevant approaches to individual and collective understandings of well-being (Beck, 2016; Rountree, 2016; Smith, 2013).
It is critical that measures of Indigenous well-being move beyond disparity study into appreciative inquiry, positive psychology, a focus on strengths, and the objectives of Indigenous families, citizens, and Nations (Kading et al., 2019). These measures, however forward facing, must also engage with the historical experiences and living legacies of settler colonialism, impacts of federal Indian law, policy, and the federal-Indian trust on land, land tenure, and economic development as well as access to quality education and healthcare (Brewer et al., 2016; Shoemaker, 2016). Indigenous well-being indicators represent complex relationships with place and the land and must rely on metrics that are both quantitative and qualitative. Indices are more relevant for use in local health improvement efforts when they focus on local values and honor traditional ways of governance along with cultural and socio-ecological relationships. Those that do so tend to produce high human development and health outcomes (Kant et al., 2014; Sterling et al., 2017).
Indigenous-led research and data sovereignty
Researchers are exploring the subjective and statistical well-being of First Nations, American Indian, and other Indigenous communities around the world through the development of well-being indexes. However, a vast majority of these efforts have been led by non-native researchers and external governmental and nongovernmental organizations that tend not to privilege locally specific or culturally relevant metrics, Indigenous research methodologies, local processes or protocols for research, or the community-based defining, determining, and resourcing of well-being indicators (Kant et al., 2014; Smith et al., 2014). A small but growing area of study by some Nations is the discussion of locally relevant metrics of well-being affording insights, analyses, and improved strategy and prioritization (Donatuto et al., 2016; Taylor and Kukutai, 2016; Walter and Andersen, 2013). This article adds to that body of work.
The creation of locally relevant metrics includes critical discussion around Indigenous data sovereignty and the strengthening of Indigenous research agendas. Equally important is increasing support for tribal institutional and cultural review boards (IRBs and CRBs) to protect collectively held knowledge, reduce harm, and end extractive methodologies of research that too often have come to define relationships between tribal communities and researchers (Around Him et al., 2019; Carroll et al., 2019; Hull and Wilson, 2017; Kelley et al., 2013).
In the discussion of historic misuse and harm created by data, concerns around both the protection and the use of data emerge, and discussions must deal with the sensitivity, intellectual property, personal safety, tribal sovereignty, and international rights of Indigenous peoples (Axelsson et al., 2016; Carroll et al., 2019; Kukutai, n.d.). Data-oriented and quantitative indicator research focusing on Indigenous well-being presents threats as well as opportunities for Tribal Nations. It is critical that Tribal Nations maintain Ownership, Control, Access and Possession (OCAP) of collectively held knowledge in order to mobilize new understandings to address pressing public policy and health issues (Armatas et al., 2016; Donatuto et al., 2020; First Nations Information Governance Centre, 2014; Sasakamoose et al., 2017).
Blackfeet understanding of well-being
Indigenous leadership has navigated challenges to community well-being by drawing on traditional and deliberative governance, mobilization of knowledge, and observation to inform decision-making (Bastien, 2004; Hungrywolf, 2006; Spoonhunter, 2014). One of the core concepts of Blackfeet’s well-being involves community relations. In 1938, Abraham Maslow, one of the founders of humanistic psychology, visited the Blackfoot people in the Siksika Nation, participating in life and ceremony during the summer months. When the book, “A Theory of Human Motivation” emerged in 1947 a “Hierarchy of Needs,” represented as a triangle, with “physiological needs” at the bottom, then moving upwardly to “Safety,” “Love and belonging, “Esteem,” and finally “Self-actualization” at the top. We now understand these as fundamental concepts of Blackfoot people meeting their needs in the community, concepts that were liberally borrowed from the Niitsitapi but altered to refine mainstream and individualistic motivational theory (Feigenbaum and Smith, 2019).
Upon deeper study, we see this triangle of human development as reminiscent of a Blackfoot lodge, with the mushrooms and wetland plants rising along the bottom, to the celestial beings and world depicted at the lodge’s apex (Blackstock, 2011; Heavy Head, 2007). For the Niitsitapi, rather than a solo endeavor of pursuit of self-actualization there are active relations among all beings, protocols, and responsibilities that ensure members of a community elevate beyond basic needs to become cornerstone members of a band and a Nation toward cultural perpetuity, helping not just meet their own needs but those of others, as well, to achieve collective well-being—the continuation of a lifeway and a Nation. A Niitsitapi revision of Maslow’s Hierarchy of Needs is a reminder of how the Blackfoot lifeway situates Indigenous well-being, with the needs of the individual contextualized within the inherent responsibilities of and accountability to collective well-being. The core practices of Indigenous health, well-being, and perpetuation of a lifeway and culture across the Blackfoot Confederacy are, thus, understood as self-actualization’ through collective well-being. In this sense, Indigenous well-being indexes represent living relationships, community-based observation, and consciousness around health, a locally-informed way to maintain long-standing relationships while mobilizing tools such as data science and GIS mapping to monitor the health of the people and the land while informing action.
Currently, there is a gap in Indigenous well-being index development stemming from the lack of statistical methodological study and application led by Indigenous communities and Indigenous researchers. This offers an opportunity to identify pathways and methodologies and share experiences. Tribal Nations, Indigenous researchers, and community organizers can collaborate to define indexes that reflect the values, objectives, and governance of their respective Nations while modeling best practices (Kant et al., 2014; Washington, 2016). Indigenous methodologies can weave culturally grounded measures of well-being into locally relevant applications of statistical approaches. Locally informed indexes provide the power to influence governance and social services that are bound by the federal-Indian trust relationship (in the U.S. lower 48) and reserved rights to ensure Indigenous health and well-being (Murat and Gürsakal, 2015; Walter and Andersen, 2013).
The PWI project
The PWI is an opportunity to define what health means to Amskapi Piikani (Blackfeet People) people at the local level, to count what matters most to Amskapi Piikani, and use those measures to plan comprehensively about the health of Amskapi Piikani and the land from Blackfeet perspectives. The index approach, covering all systems, is a holistic approach to understanding a Niitsitapi way of well-being. The PWI encompasses areas of human health, agriculture and food sovereignty, cultural systems, social and educational lifeways, environmental stewardship, institutions and governance, economics, and land tenure. Eventually, the PWI will provide a “dashboard” to help community members, decision makers, and leaders understand three main things:
Where are we now? The current state of holistic health and well-being by watershed.
Where do we want to go? Illuminating strengths, weaknesses, and where concerted action is needed to improve the health of the people and land.
Have we arrived? Tracking changes in specific areas to build a stronger Blackfeet Nation (healthy families, food sovereignty, a strong local economy with decent jobs, a stewarded environment, language and cultural revitalization, etc.).
The PWI can be used in specific ways by users:
By Tribal decision makers, departments, and planners to better understand where they can allocate resources and infrastructure and create plans, initiatives, and interventions to ensure that the needs of Blackfeet people, non-human relations, water, and the land are met across watersheds.
By local Indigenous non-profit organizations to monitor the impacts of their environmental, social, and educational work and ease in their reporting and substantiating need.
By Blackfeet families to understand how the Blackfeet Nation is doing as a whole and within their own watersheds.
By individual allotees and other Tribal members to inform watershed groups, land and range management, human health, and other citizen-led planning efforts. Widespread community-based awareness of the health of our watersheds and land management also ensures transparency and accountability, securing good governance in the modern Tribal context.
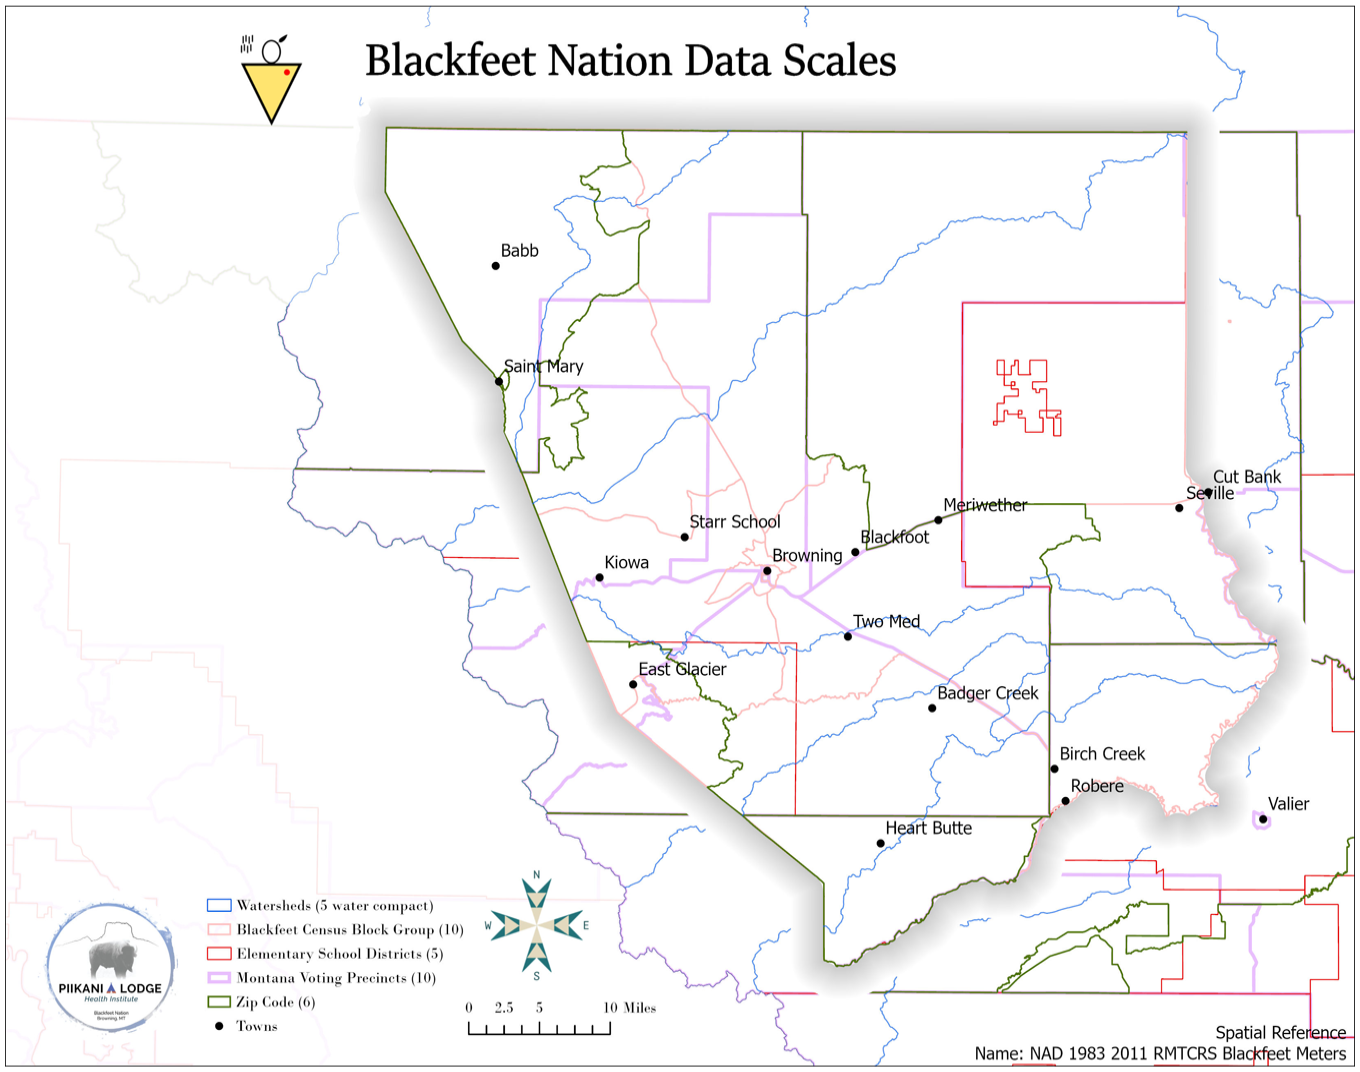
The index is made up of indicator areas with individual aspects of Piikani health captured as variables. Figure 2 is a visual of how the data scales from low levels of detail (blue) to areas of analyses (red) to high levels of detail (green).
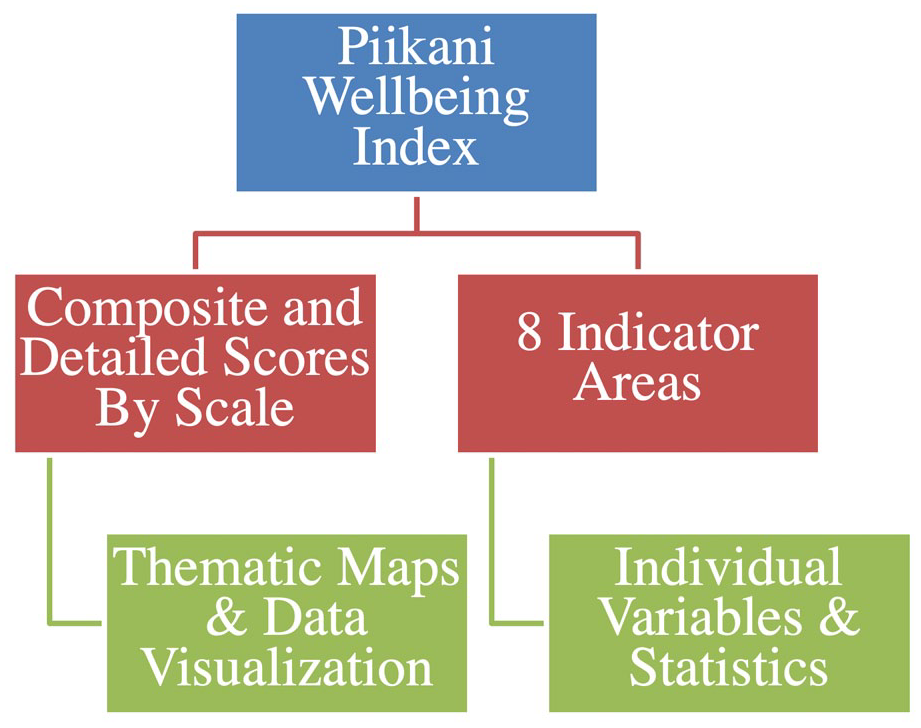
Piikani Well-being Index (PWI) in relation to data scales and decision support.
Individual variables help create a rough model of the state of Piikani well-being. From these indicators composite indexes are created by system. The overall composite of indicator areas and variable data insights comprise the PWI.
PWI methodology
Engaging the community
The “Ohkomi”(To Use One’s Voice) Survey, an agricultural resource based survey conducted by the Blackfeet Tribe in 2018, provided foundational dialogue and community action as well as core new baseline data to begin to create insights and composite scores across the Nation’s local areas and at the Nation level covering ongoing issues and vital themes of health, land and natural resources, culture and language, economic, agriculture, and institutional areas. Informed by these Ohkomi Survey results, early phases of the Piikani Well-being Index began with a group of 20 knowledge holders from across a broad spectrum of backgrounds. This advisory group comprised Blackfeet planning practitioners, community organizers, thought leaders, traditional knowledge holders, and decision makers who would help define fundamentals and core measures of the PWI.
These advisors came from local non-profit, educational institutions including K–12 schools and the community college, Tribal programs and leadership, small businesses, ranches and farms as well as different communities within the Nation. They filled three roundtables and participated in a total of six sessions, each 2 hours long for a grand total of 12 hours of facilitated, intentional discussion. Another 20 hours of community engagement occurred in 2020 and 2021 at local events like Iinnii Days and Piikani Lodge Health Institute’s “culture camps” (partly supported by the same multi-year grant). Piikani Lodge Health Institute (PLHI) technicians were present for all roundtable sessions and events. Roundtable sessions were recorded via Zoom to ensure community transparency and accuracy in selecting the suite of indicators, and notes were made available to all participants.
Community concept mapping and index roundtables
Beginning in Winter and Spring 2021, PLHI, in step with the Blackfeet Nation Agriculture Resource Management and Food Sovereignty Plans and local partners, hosted three digital roundtable sessions. These roundtable sessions offered opportunities to connect with a core group of 20 advisors to understand what they most wanted to learn. The sessions covered the following:
Roundtable 1: Introduction to the PWI, examples of mapping indicators and a draft selection of indicators for Blackfeet to identify what we’d like to learn, count, and what may be missing.
Roundtable 2: Present integrated feedback, discuss revised suite of PWI indicators, and a sample map. Present Piikani WISE dashboard project with a demo of similar projects such as Hydrologic. Review indicators and index results and early maps by watershed. Discuss how we would like to use the index moving forward across our health, environmental, agriculture and food sovereignty, social, cultural, and educational efforts.
Roundtable 3: Integrate all feedback, present final suite of indicators, and sample map. Work toward beta version of PWI maps and Piikani WISE dashboard. Discuss how the group would like to stay engaged moving forward.
Statistical method
A complete GIS inventory has been gathered and attribute tables of existing USDA NASS, US Census, County Health, and the Ohkomi Land Survey have been prepared. During Year 2 of the project, a suite of 80 variables was developed with focus group sessions (roundtables) with agricultural producers, health, cultural and community knowledge holders. This enabled community-based identification of the factors that influence human development more than others across watersheds at the Blackfeet Nation. From this, composite scores for the well-being of agriculture and human health systems at the Nation level were calculated using the following workflow.
Statistical / SPSS workflow
There are two steps to calculating the PWI:
Forming indices for each of the four metrics: Values of each of the four metrics are first normalized to an index value of 0 to 1. To do this, “goalposts” of the maximum and minimum limits on each metrics are set to establish aspirations of an agricultural system and human health that has high development outcomes. With the actual value for the Nation at a given year, the dimension (indices) value for each metric is calculated as a geometric median in relation to a scale of 0 to 1. The dimension index is therefore 1 when Blackfeet Nation achieves the maximum value, and it is 0 for when the Nation is at the minimum value (United et al., 2016).
Aggregating the four metrics to produce the PWI: Once each of the individual indices have been calculated, they are aggregated to calculate the PWI. The PWI at a Nation scale is calculated as the geometric mean (equally weighted) of life expectancy, number of beginning Native agricultural producers, average age of Native agricultural producers, and per capita annual income of producers, as follows:

The agriculture dimension is the arithmetic mean of the two age indices (number of beginning Native agricultural producers and average age of Native agricultural producers).
To ensure rigorous and robust geospatial statistics at smaller scales, the project sought to engage multivariate statistical analysis to dive deeper into the longitudinal data around the indicator areas of Human Health, Agriculture Production & Food Sovereignty, Cultural, Environmental & Non-human Relations, Land Tenure, and Institutional Capacity. In doing so, it became clear how individual factors—the 80 variables identified by community members—may influence overall human development by watershed at the Blackfeet Nation (Arteaga and Glewwe, 2019).
This methodology examines the correlation between individual variables as it pertains to an overall composite score or “index” of Piikani Human Development. Factor analysis methods examine the strength of the relationship between each individual variable and the underlying indicator areas or “capitals” through the estimation of a factor loading, or how much that variable influences human development, calculated using Pearson’s Coefficient and expressed through eigenvalues (Secolsky and Brian, 2017; C. C. Taylor, 1977). Studying the relationship between individual variables and how they impact overall scores helps us understand what correlates with human development at the Blackfeet Nation. The results can be visually communicated back to Blackfeet Nation technicians, producers, and decision makers using two- and three-dimensional data visualization and a complete set of maps projecting composite index results by watershed.
Data storage and protocol
All data collection and storage is guided by a Data Sharing Agreement with Blackfeet Nation IRB and Tribal Council (PLHI, 2021). The Agreement is based on increasingly widely accepted data sovereignty standards guided by international Indigenous intellectual property rights reflected in the OCAP™ Principles of Ownership, Control, Access, and Possession. These principles refer to the collective relationship of First Nations to their cultural knowledge, data, and information. That is, the community or group owns, controls, accesses, and possesses information collectively with the same rights as when an individual owns his or her personal information. To ensure data safety, PLHI uses REDcap (Research Electronic Data Capture) for sensitive geospatial information. This is a secure web application for building and managing online surveys, servers, and databases. Protocols for data collection, storage, and access are assigned according to the local Blackfeet protocol.
Results
From 2019 to 2021, community dialogues and discussions with advisors were synthesized in a singular large suite of indicators now known as the PWI. These indicators were organized via concept mapping sessions, or roundtables, and led to observations across eight Amskapi Piikani systems. Once consensus was reached, the chosen indicator areas were given names in the Blackfeet language. To observe and monitor aspects of well-being in a detailed way within each area, advisors discussed and developed line-item variables, metrics specific to the qualities of the indicator area. These were variables observed in daily life in the community, historical experience and stories, and previous policy analyses as strongly correlated with the outcomes of the indicator area or system (e.g. mental health or rangeland condition). The development of these variables captures the spectrum of values-informed statistics including natural, constructed, and proxy attributes of how a multitude of factors are related to human well-being outcomes.
Indicator areas represent high-level focus areas, and variables represent very detailed, tactical, and source-able line-item observations closely related to indicator areas. Throughout the roundtable sessions, the team discussed why emerging variables resonated with them and how these variables are grounded in their work, personal experiences, and Traditional Ecological Knowledge in land-based systems. These insights are noted in the rationale column in Figure 3. While eight areas emerged based on discussions and concept mapping, Sokinaapi or Saam (human health) and Awahsin (food system production and sovereignty) remained central considerations. Additional connections and interdependencies are inherent across indicator areas, but these two are closely related and inseparable from the health of the people and the land. Furthermore, they are advisor-defined metrics that are useful both at the very local level of, for instance, neighborhood or village, and also at intermediate and national levels.
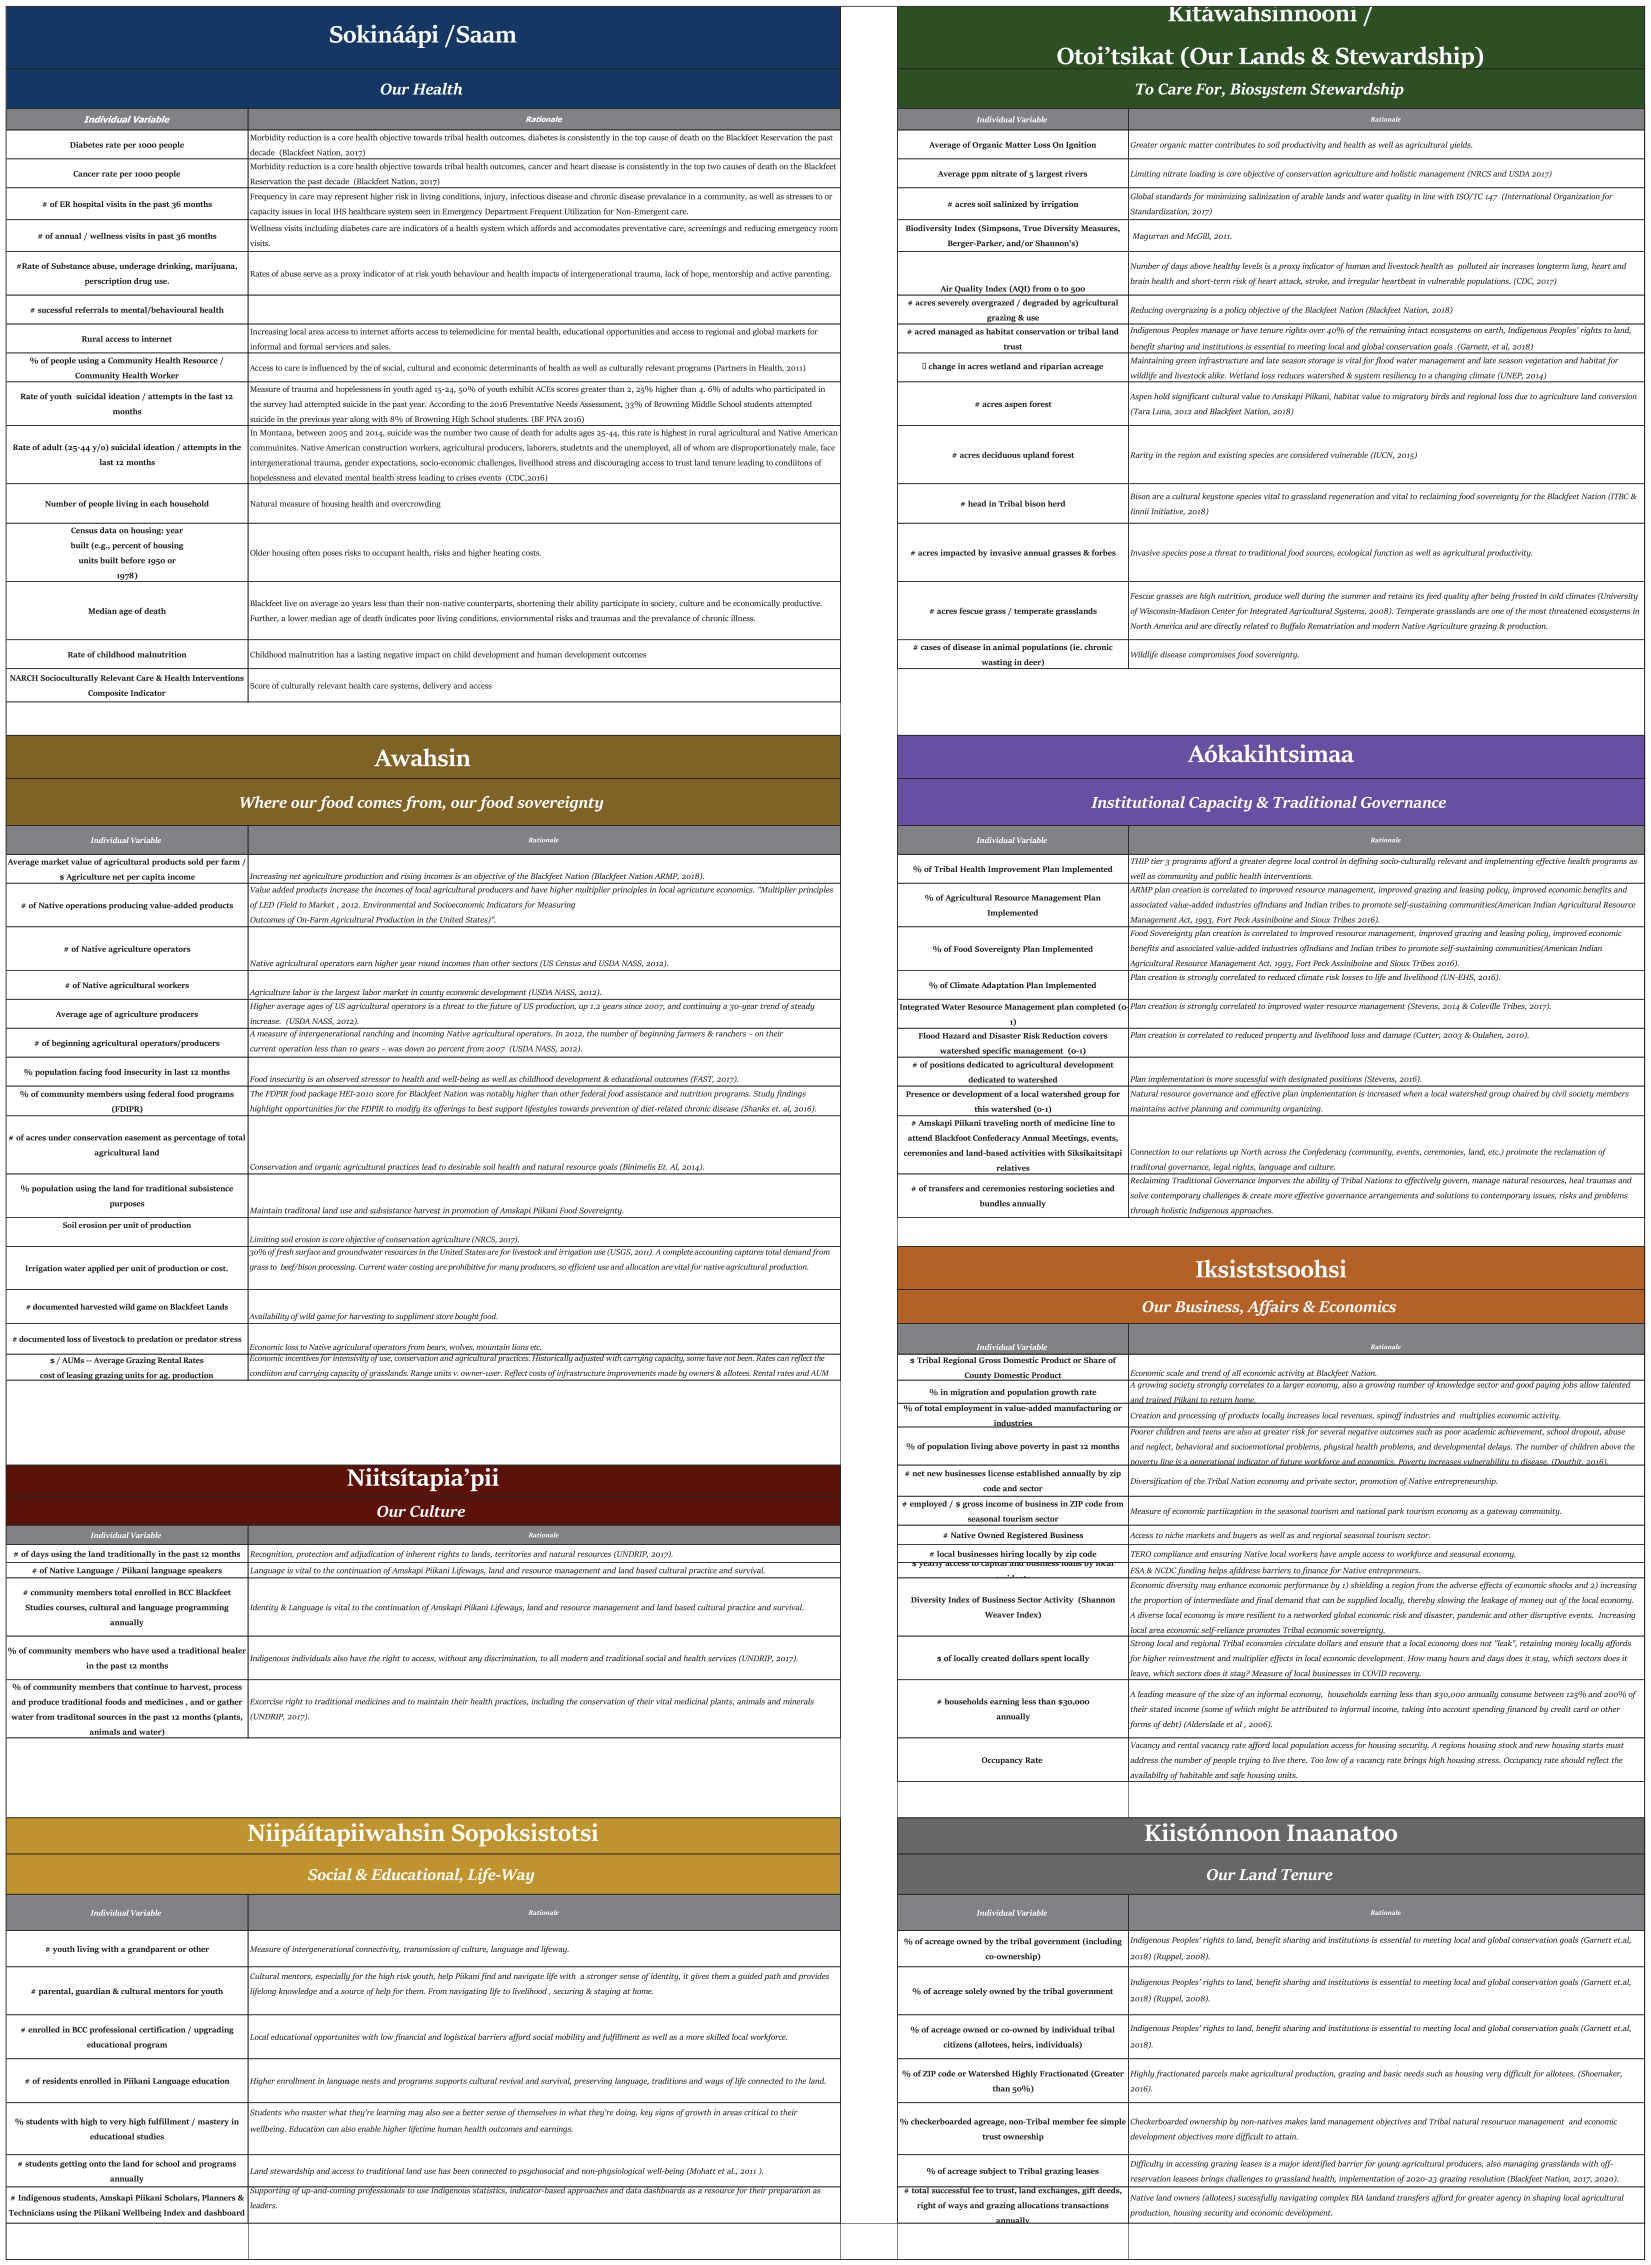
The Piikani Well-Being Index and 8 Indicator Areas.
While the creation of a live test suite of indicators offered a structured approach to the observation of well-being at the Nation level and a common “umbrella” to gather data and collaborate, the team determined that it was not enough to simply have indicators and variables. To gain new insights from the PWI, technicians began creating thematic maps based on statistical findings in relation to landmarks and natural resources deemed important to advisors and elders as inherently interrelated with well-being.
First, technicians and advisors scanned the first iteration of the PWI to ascertain what data was already available and then settled on a final suite of variables that could be sourced for data available at the same scale. In the case of health and food system indicators, variables would need to be scaled to the Nation level to be comparable to the available data. For purposes of descriptive statistics, a regional and tribal median was populated using publicly available information for the Rocky Mountain Region, and then a PCA factor analysis statistics package was run on available data in SPSS to understand which factors may correlate most strongly with overall composite scores. Variables with a high influential factor on an overall indicator area composite score, for example, health and a long healthy life with a level of significance greater than .05 were then noted in the right column. With this test suite of sourced variables and statistics, the team aimed to generate new insights on how the Tribe is doing and locate opportunities to focus resources.
Figure 4 shows the sourced seven health variables in the Sokinaapi/Saam (health) indicator area, descriptive statistics, regional Tribal median for reference, and then marked factors that were observed as influential on overall composite scores. It is important to note the small size of the data set used. The level of confidence will improve as additional datasets for the same variables are collected at local scales across the communities within the Nation and other Tribal Nations in the region to allow for a more robust data set and stronger study of correlating factors of variables to overall composite health indicators scores.
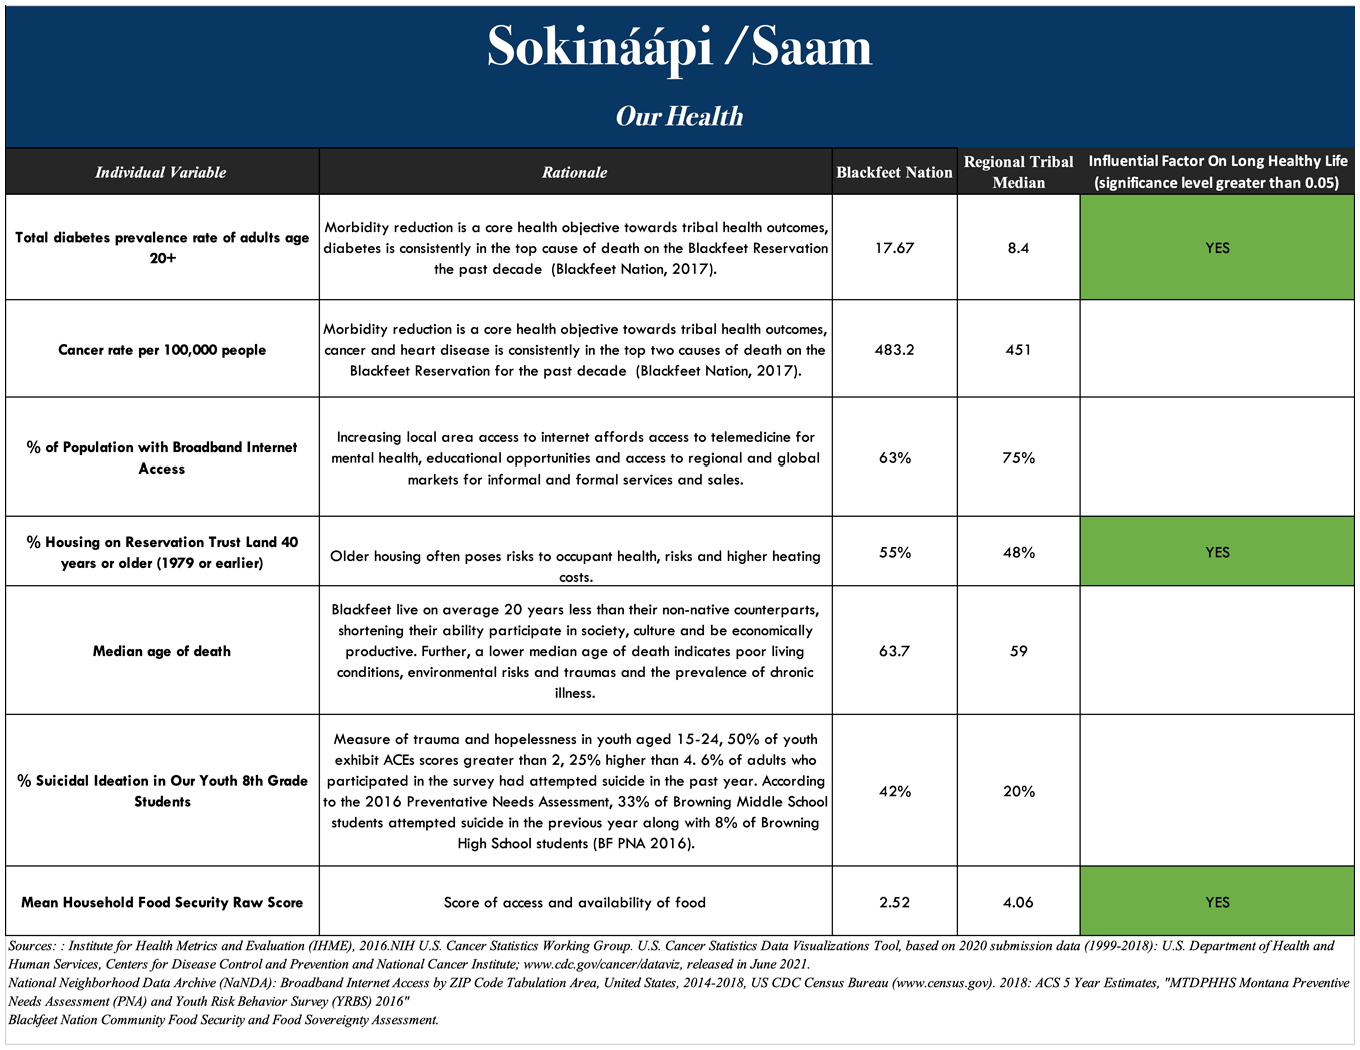
Observed health indicators and correlation scores.
One area of focus was the creation of thematic maps for community planning and tribal decision-making in relation to place and cultural relationships on the land. Figure 5 illustrates the connection between human health resources defined traditionally, and land resources as well as modern schools and health clinics operated by the tribe and under treaty responsibility with the federal government. Given the strong connection between human health and water, water rights as allocated by watershed are also included as a polygon to show a relationship between a community’s water rights and health infrastructure. At the guidance of advisors, International and National Park boundaries were intentionally removed to represent sociocultural and economic connectivity ensured in the Jay Treaty and International Indigenous rights to the Blackfoot Confederacy. Further bold gray lines note the six major water catchments to their heights of land, water rights secured by the Blackfeet Water Compact.
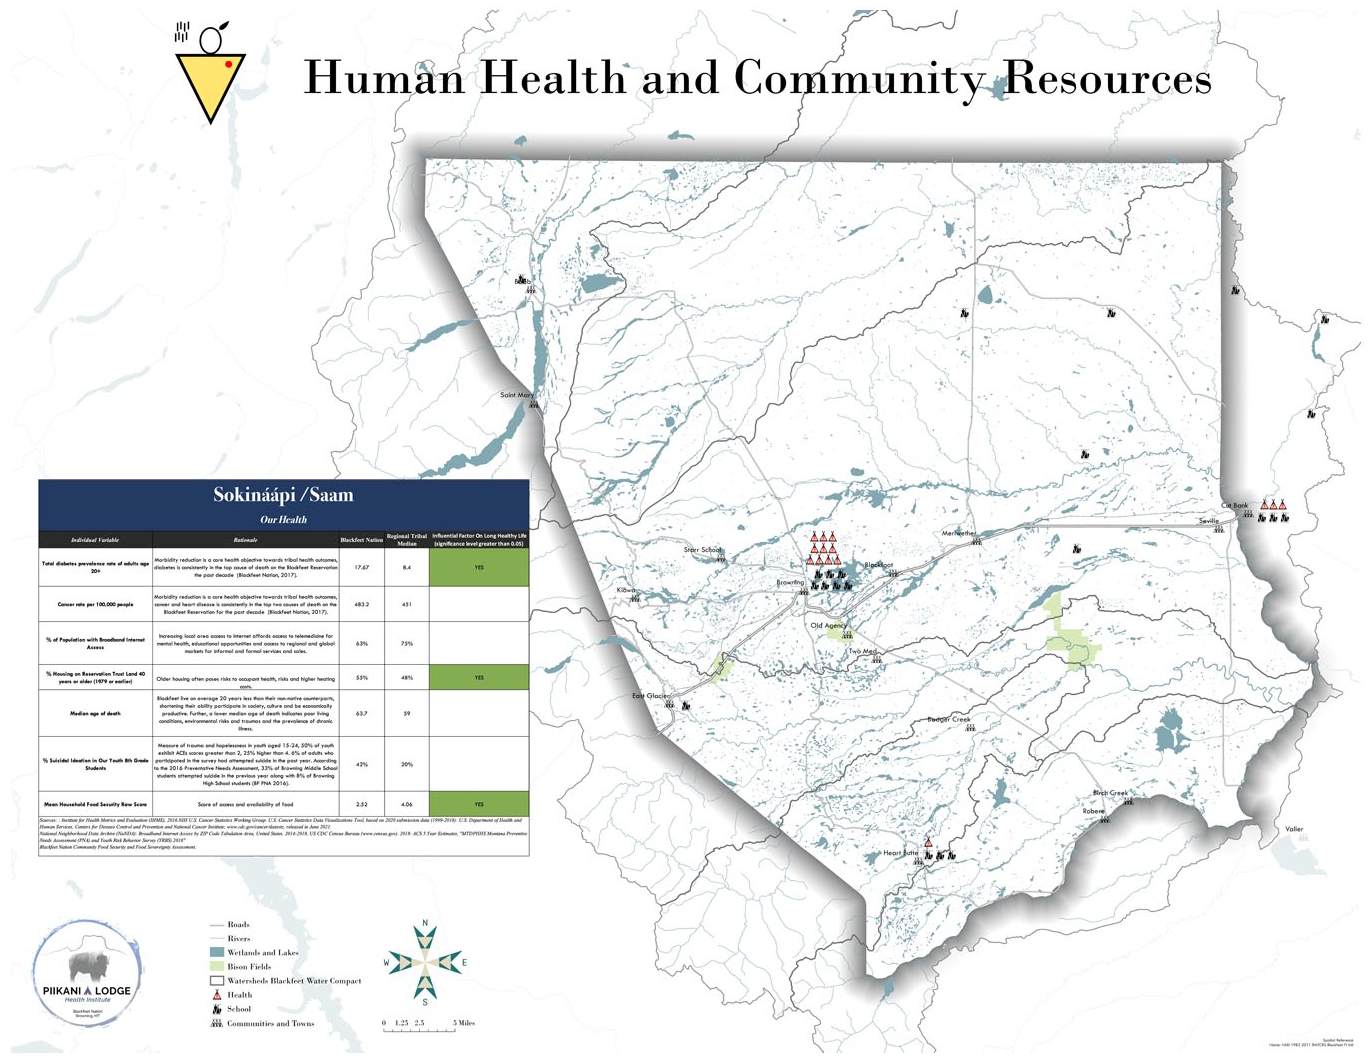
Human health and community resources map with statistics.
This same process of vetting and ground truthing datasets before conducting statistical analysis followed for Awahsin (the Blackfeet Nation’s food systems), offering observed conditions, regional tribal median, and the results of factor analysis statistics with variables observed to be influential to overall food sovereignty. These calculations from Sokinaapi/Saam and Awahsin would also later enable composite Piikani Human Development scores to offer high-level snapshots of human well-being at the Tribal Nation level. Figure 6 displays final approved variables, measures, rationale observations, comparisons, and factors found to be significant upon statistical analysis for the Nation’s food systems.
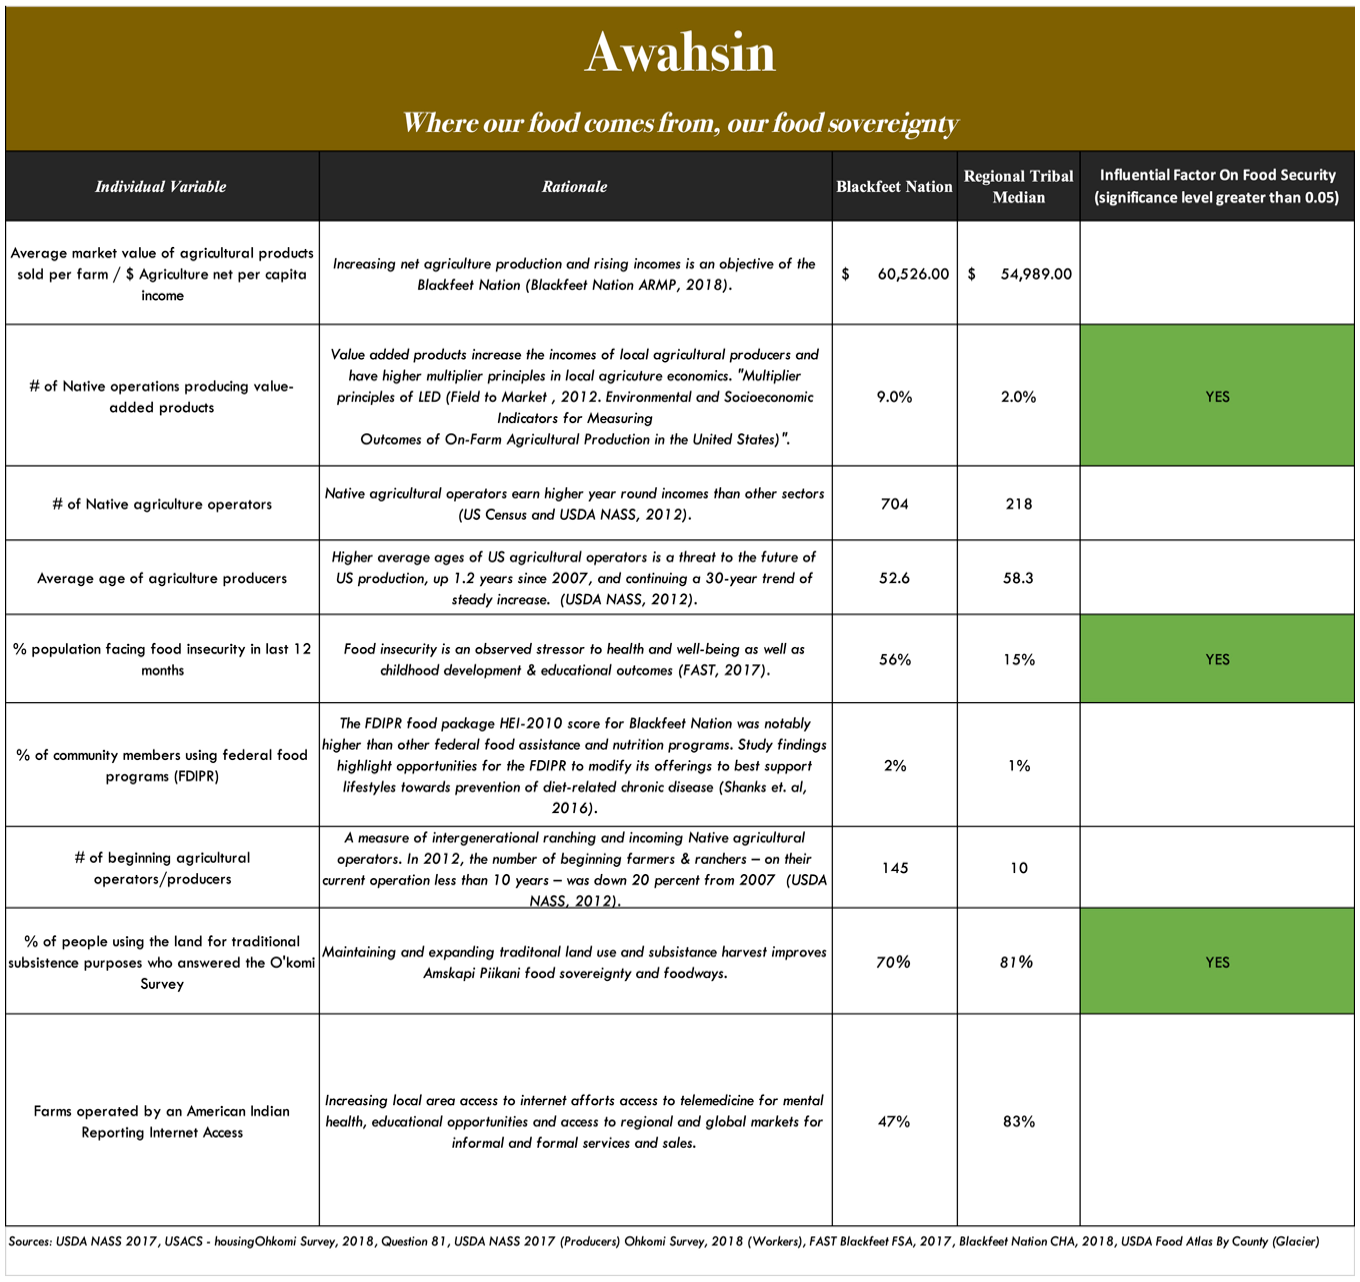
Observed food system indicators and correlation scores.
While these statistics drawn from available data offered a benchmark for where the Nation’s food sovereignty efforts stand, advisors noted the importance of showing the interdependencies of natural capital—the land, irrigation, and water rights—in relation to the Nation’s ability to feed itself and maintain a sustainable and culturally consonant agricultural system. The Nation’s current 1.5 million acres stretches from subalpine forests in the west to mixed forests, wetlands, and more temperate grasslands in the east, a vertical relief of 5000 feet over a mere 50 miles. The Nation’s geography and relative biodiversity mean that not all land is equal in traditional plant distribution and modern food system productivity, range condition and water availability for irrigation and livestock. Alongside the statistics, advisors desired to see the fence line, range unit, and irrigation infrastructure inventory as well as natural water storage which impacts the ability to produce in a harsh climate with a short growing season undergoing environmental change. Figure 7 offers a full projection of this ecological diversity, statistics, and the related built and natural water infrastructure vital to agriculture producers in the Blackfeet Nation.
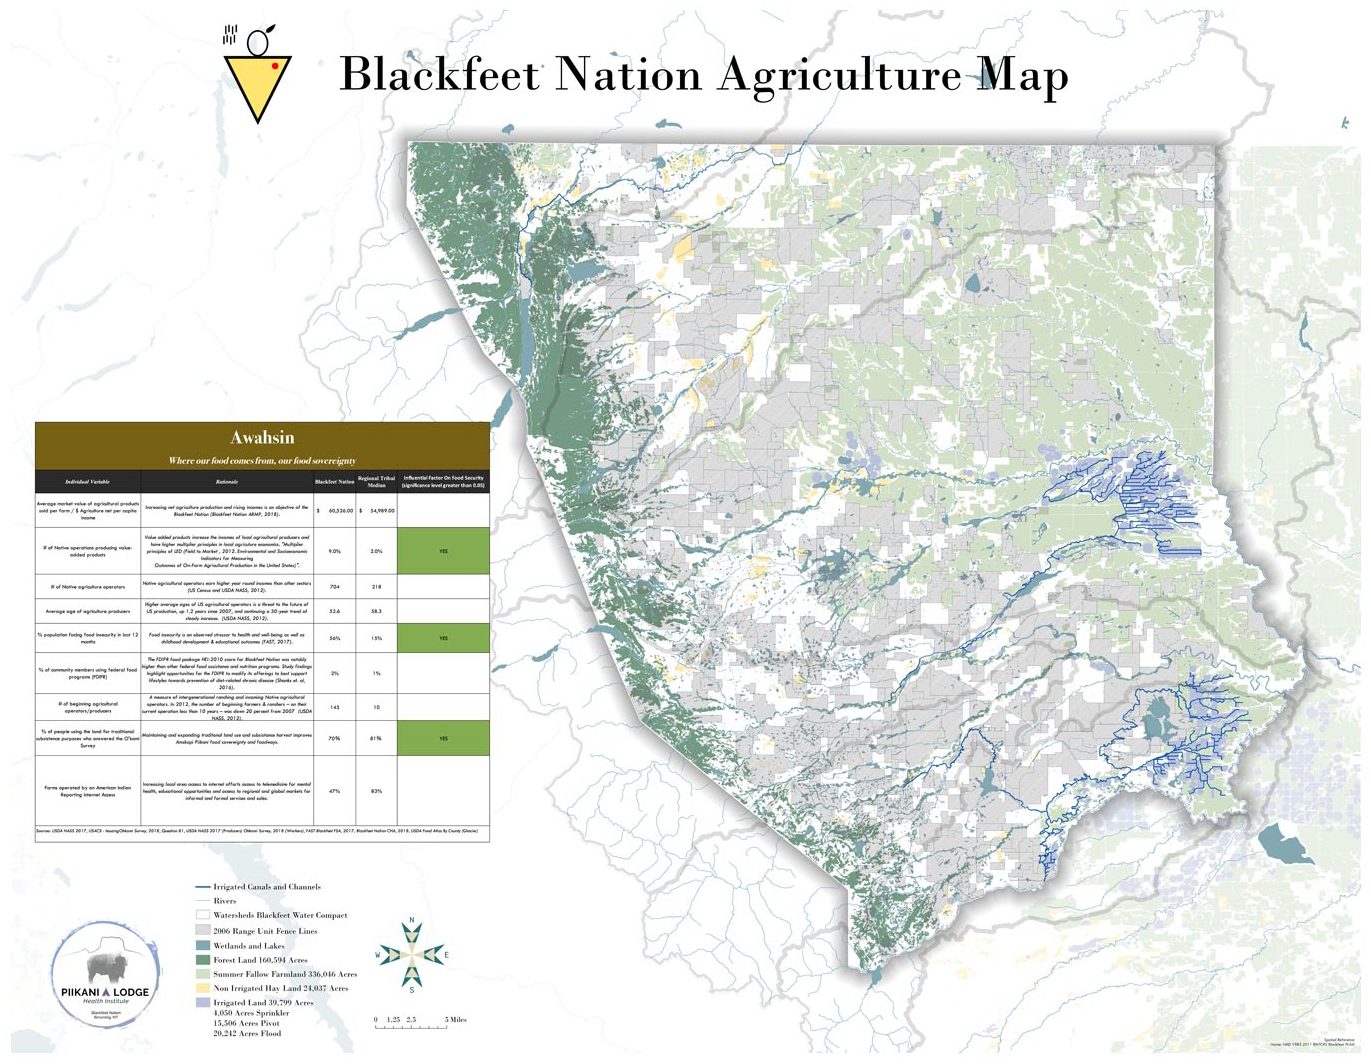
Blackfeet Nation agricultural map.
Early thematic maps by indicator area offer exciting early opportunities for the application of the PWI, statistical analyses, and geospatial mapping efforts. However, throughout the project, root causes and legacies deeply impacting Indigenous well-being emerged as central challenges. Fractionated and checkerboarded Indian land tenure and federal trusteeship were identified as core issues for the research to address. Specific to this process mapping, advisers noted the importance of understanding the majority ownership of land and its implications in land management, human health, and economic development as it relates to human well-being outcomes. The topic of Indian land tenure is rooted in a difficult and painful history in federal Indian law and the inherent pursuit of tribal sovereignty. Land tenure is significantly more complex in tribal contexts than in non-tribal. A number of land tenure types exist, including tribal and individual trust (where absolute title is held by the federal government as trustee), inholdings of fee simple or private landownership held by Natives, non-Natives, Tribes and corporations, as well as restricted land tenure designations including land trusts held by NGOs and Tribes. All of these are present and observable within the exterior boundaries of the Blackfeet Nation today. When discussing maps which display land ownership in relation to Piikani well-being, the team found it appropriate to offer decision support tools like the process maps rather than correlations or prescriptive analyses. The latter could be misinterpreted or seen as supporting a particular position undermining Tribal Sovereignty. Rather the team sought to show, at a Nation level, the overall human development outcome represented in a composite development score, grounded in the PWI. This was only calculable at the national scale with available data, while up-to-date land tenure data were available down to the tract level. The intention for this map is to offer high-level insights on how people are doing, grounded in health, agriculture, and standard of living, and to explore how land tenure issues may be addressed by supporting allotees with decision-making tools, and targeted policies and programs to improve well-being conditions at a subnational level, namely by watershed or zip code. Figure 8 illustrates this grouping of statistics and composite score with land tenure by type across the Blackfeet Nation.
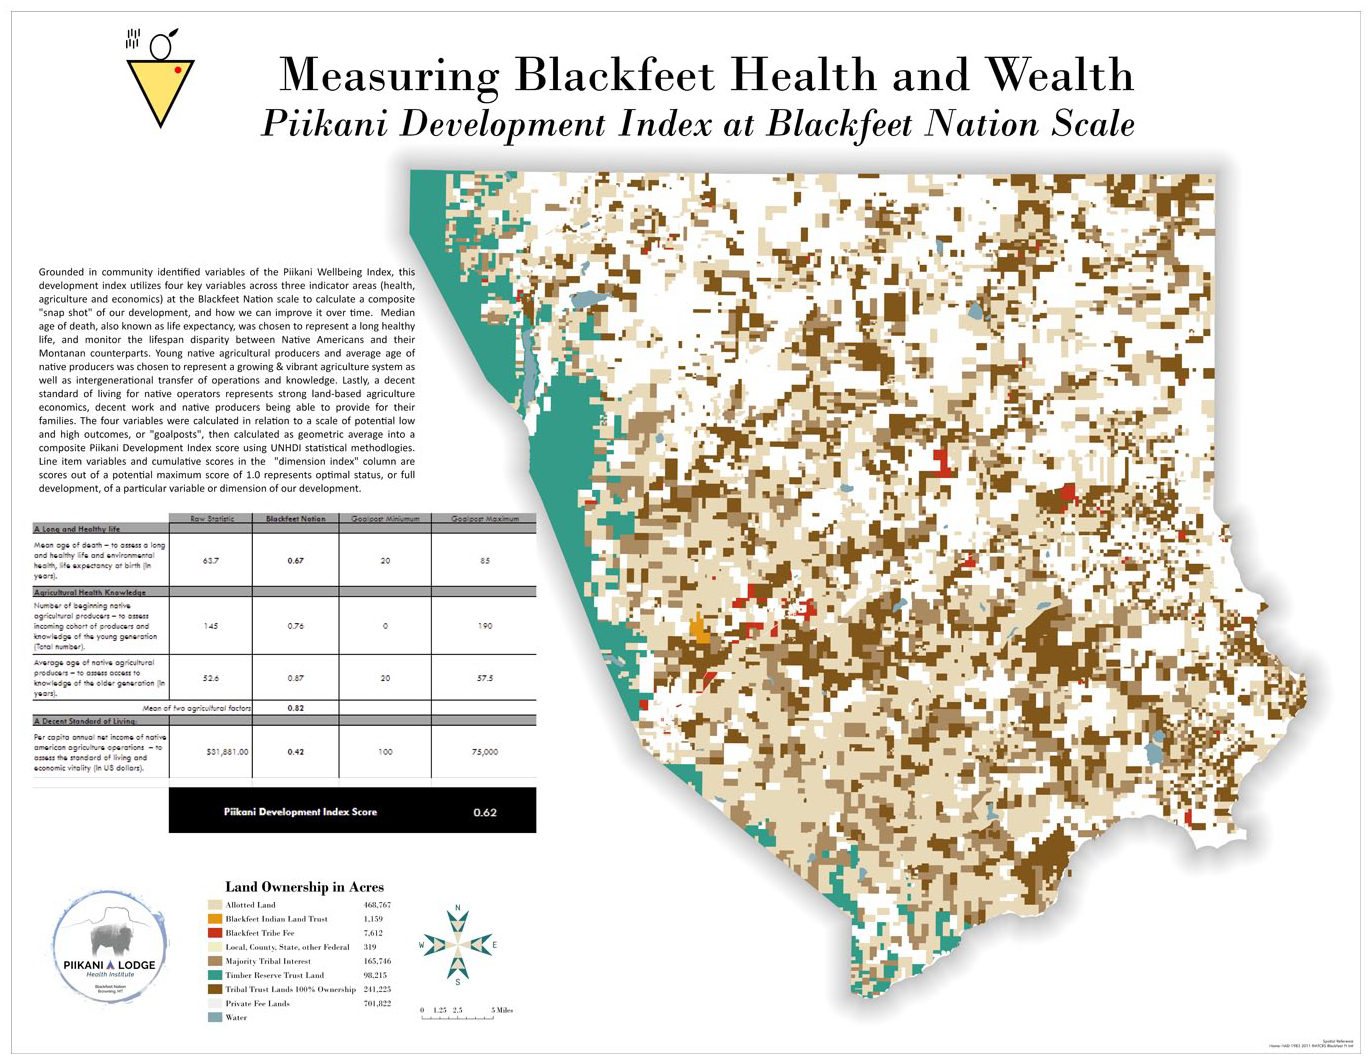
The Piikani Wellbeing Index (PWI)—Nation level score and land tenure.
The PWI—Nation Level Score utilizes four key metrics at the Nation scale. (1) Health: With the variable of mean age of death (to assess a long and healthy life and environmental health); (2) Agriculture: With the number of beginning Native agricultural producers (to assess the incoming cohort of producers and knowledge of the younger generation) as well as the average age of Native agricultural producers (to assess access knowledge of the older generation), and; (3) Standard of Living: With the per capita annual income of agriculture producers (to assess the standard of living and economic vitality). Each of these three aspects of the composite score illustrates where the Nation is on a spectrum from low to high development in relation to possible outcomes, where 1.0 represents optimal status. Overall, the Blackfeet Nation has a nationwide well-being score of 0.62, a moderate score representing areas of strength and opportunities to improve Indigenous well-being. The mean age of death remains at 0.67 related to the development spectrum with the average Piikani living 63.7 years, 20 years younger than non-native cohorts in the State of Montana, and with a higher prevalence of disease and environmental health challenges (Blackfeet Tribal Health Department, 2017). Agricultural systems represent a true strength at the Blackfeet Nation where a relatively high number of beginning producers (145 in the last USDA NASS Census) are entering agriculture, and a younger median producer age (52.6 years old) leading to a 0.82 development score, the highest of any category observed at the Nation. Finally, a decent standard of living, represented by per capita net income of Native American agricultural producers, offers the highest area for improvement with a mere $31,881 USD in net profit annually and a 0.42 development score in relation to potential outcomes. This need for economic and livelihood improvement through strategic local economic development is an active area for community organizing and is reflected in the Blackfeet Nation’s Agriculture Resource Management Plan as well as other efforts to improve the production of value-added products (such as the proposed development of a multi-species processing plant).
In addition thematic maps, grounded in available data at a more local scale, were considered valuable by local Indigenous project advisors. These maps draw from ongoing data sovereignty efforts which address data gaps at the Nation specifically around food access and connection to the land, both of which have been identified by the community and advisors as vital aspects influencing Piikani well-being. Figure 9 builds upon a household survey completed as part of a Community Food Security Assessment completed in 2018. Households responded to questions regarding the availability of food and food stress across communities, the data being collected by zip code, and offering an actionable scale to address food access and security factors and variables influencing Piikani well-being.
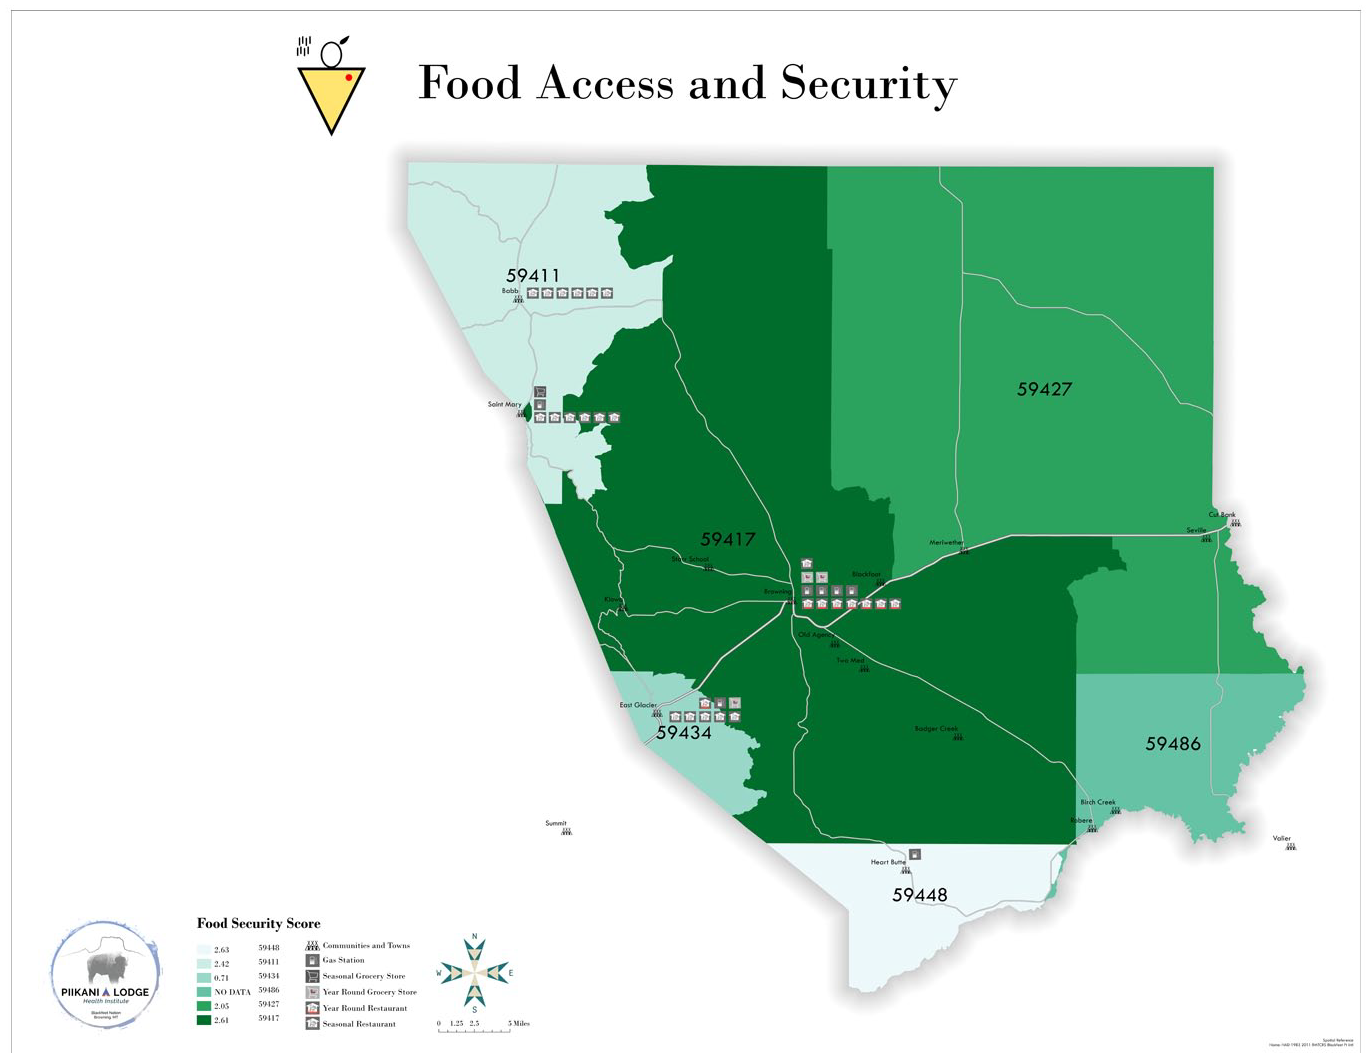
Food security by zip code.
Food insecurity within the Nation remains moderately high with all raw scores across communities in the 2.0–3.0 range. Lighter tones in the map represent higher food security scores. Community food infrastructure, any location where food can be purchased or received free of cost, is noted on the map. The most rural and difficult to reach communities within the Blackfeet Nation—particularly in the northwest and south—exhibit the highest levels of food insecurity.
However, remote communities within the Nation are also those that are closest to the land as revealed by the prevalence of traditional land use practices. The well-being project team noted this role and the importance of traditional land use and subsistence hunting as both a practical solution to food insecurity but also a vital family and individual activity leading to connectedness to the land and culture and supportive of Piikani well-being. Drawing from this observation in community, the PWI, and data available from the Nation’s own land use census, the team created a thematic map to explore this connection to the land for traditional and subsistence purposes by region within the Nation (Figure 10). This map offers the number of users by total responses for the watershed, or intensity of use by population, spatially across the Nation in relation to watersheds and natural resources. This map offers insight into what the Food Security map (Figure 9) may not be able to cover: that is, how much people are getting onto the land each year as well as access opportunities or barriers which may contribute to more Piikani getting on the land for cultural and subsistence purposes. In this case, the highest use remains the highest populated watershed; however, the two communities noted as the least food secure have the second and third highest traditional land use days per person per year.
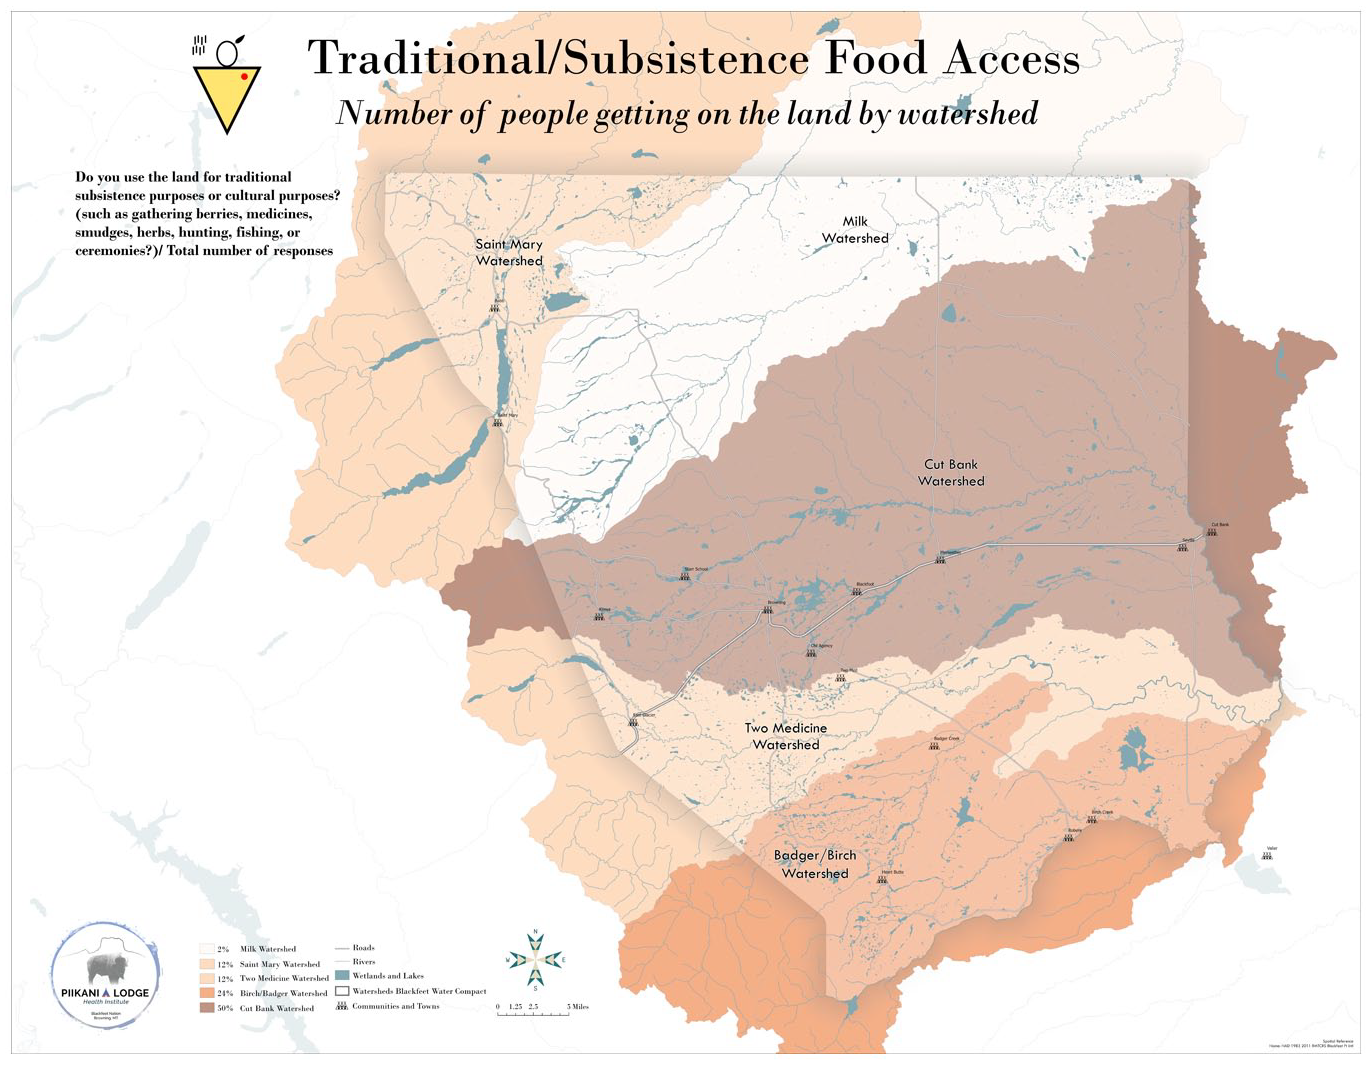
Traditional use / subsistence harvest by watershed.
Discussion
Central to any discussion of results from the Piikani Well-being project is the importance of values as the beginning, the destination, and an ongoing guide for research understandings: How they are created, interpreted, used, and how they may be engaged to improve the well-being of Amskapi Piikani people and lands. At the beginning of dialogues and project scoping in 2018, the research team with 20 advisors from across systems within the Blackfeet Nation discussed the need for efforts and research to be collaborative. It was clear that the team would be building on the work of many generations and centering the core values of Amskapi Piikani people and governance throughout. A set of seven community-generated values informed both creation and application of Indigenous Well-being Indicators, composite scores, maps, and other decision support materials. This set of values, reproduced in this article’s introduction, is consistently referenced in the Nation’s school district, community college, and Tribal Government settings. Piikani core values continue to drive the application of new insights and research products in pursuit of Indigenous well-being within the Blackfeet Nation.
The Piikani Wellbeing Index offers holistic thinking and a common umbrella under which to organize data and improve collaboration toward common objectives of Indigenous well-being and Blackfeet tribal sovereignty. Granted the losses and continuing impacts of the COVID-19 pandemic on all systems, there are ongoing opportunities to apply parts or all the suite of indicators in the recovery phases of the pandemic to “build back better” with Piikani values and collective understanding of what constitutes Indigenous well-being at the core.
Statistical analysis composite scores and thematic maps help to reveal what was invisible. Being able to understand how a few factors are influencing an overall indicator area, for example, health or the economy, offers new insights that supplement intuitive knowledge as well as the collectively held knowledge of the community. The process of creating the index and maps furthered community dialogue around how well-being is defined locally and personally as well as how health is connected to the land. Preliminary analyses in maps offer new insights on local systems, as data, or composite scores, are projected onto the landscape in a new way and in relation to place and local infrastructure. For example, measures of traditional land user days by watershed and composite human well-being scores in relation to land tenure and infrastructure offer new and strategic insights that can be used by the Blackfeet Nation leaders and community organizers to reduce food insecurity by maintaining policies that improve land access and reduce barriers for allotees. While concerns around human health and poverty predate this project and remain central to discussions of how to improve the lives of Piikani people and families, this project offers new and nuanced observations of variables and specific factors that are contributing to human well-being and the health of food systems. Statistics and thematic maps generated by the Piikani Well-being Project offer “vital signs” of human health and food systems at the Nation scale grounded in recently collected data that can be updated as desired to track progression and change.
The creation of indicators that represent local values, worldview, and objectives is not new in the context of Native American Tribal Nations, First Nations, or Indigenous Peoples globally. However, this project established a baseline at the Blackfeet Nation and spurred community dialogue around what is important to observe and monitor when it comes to the well-being of Piikani people and the land and how common metrics may be used to inform decisions. The creation of the PWI, statistical analysis, and thematic maps brings exciting developments and opportunities for the Nation to continue to reclaim ways of planning and strong governance to achieve higher well-being outcomes, specifically in health and food systems. This process, in addition to preliminary maps and statistics, offers powerful new opportunities to reclaim old ways and improve governance capacity to meet the needs of people, from housing to food to social connection and cultural vitality and perpetuity. The PWI, early analyses, and mapping lay the groundwork for future data collection planning (e.g. what types of data do we collect? and at what common scale?). More advanced statistical analyses will explore correlations as more data becomes available at sub-Blackfeet Nation scale in order to strengthen self-governance, policy, planning, and effective programs.
This project actively addressed data gaps within the Blackfeet Nation, bringing up important conversations around data sovereignty as a protective measure and as an act of objective setting where tribes identify data that are vital to track in order to achieve higher human development and well-being outcomes for the Nation. Further, in the creation of the PWI and early decision support materials, there are opportunities to inform and monitor planning policies, programs, and the allocation of resources. Well-being-based budgeting, a concept now popular among progressive governments globally, is also possible at a scale where resource allocation can be grounded in metrics that local technicians and decision makers can track in policymaking, budgeting, programs, and partnerships.
While this project addressed data gaps in the creation of the index, it also identified other gaps and areas for future research to strengthen local capacity and knowledge around how well-being is influenced and monitored within the Nation. Where data are not available, the project team flagged variables that should be included in future surveys. Community advisors identified several indicators that are desired but are either not yet being monitored, or data about which are only available at too coarse of a scale to be useful (e.g. at county scale rather than Tribal Nation, or at Nation scale rather than at community level). What follows is a list of recommendations for future common survey work and research within the Blackfeet Nation to address these data gaps. Identifying a common scale of data and analysis was discussed and is strongly recommended for future research. Nineteen outstanding variables that community advisors would like to track and calculate are noted in Table 1; each is designed to elicit quantitative responses but can include open-ended follow-up questions to capture qualitative feedback, such as assessing the relative cultural significance of different types of land use or time spent on the land. These will be communicated back to advisors and to the Blackfeet Nation Institutional Review Board to support ongoing Tribal research agenda-setting and data sovereignty efforts.
Outstanding data gaps in Piikani well-being variable measures.
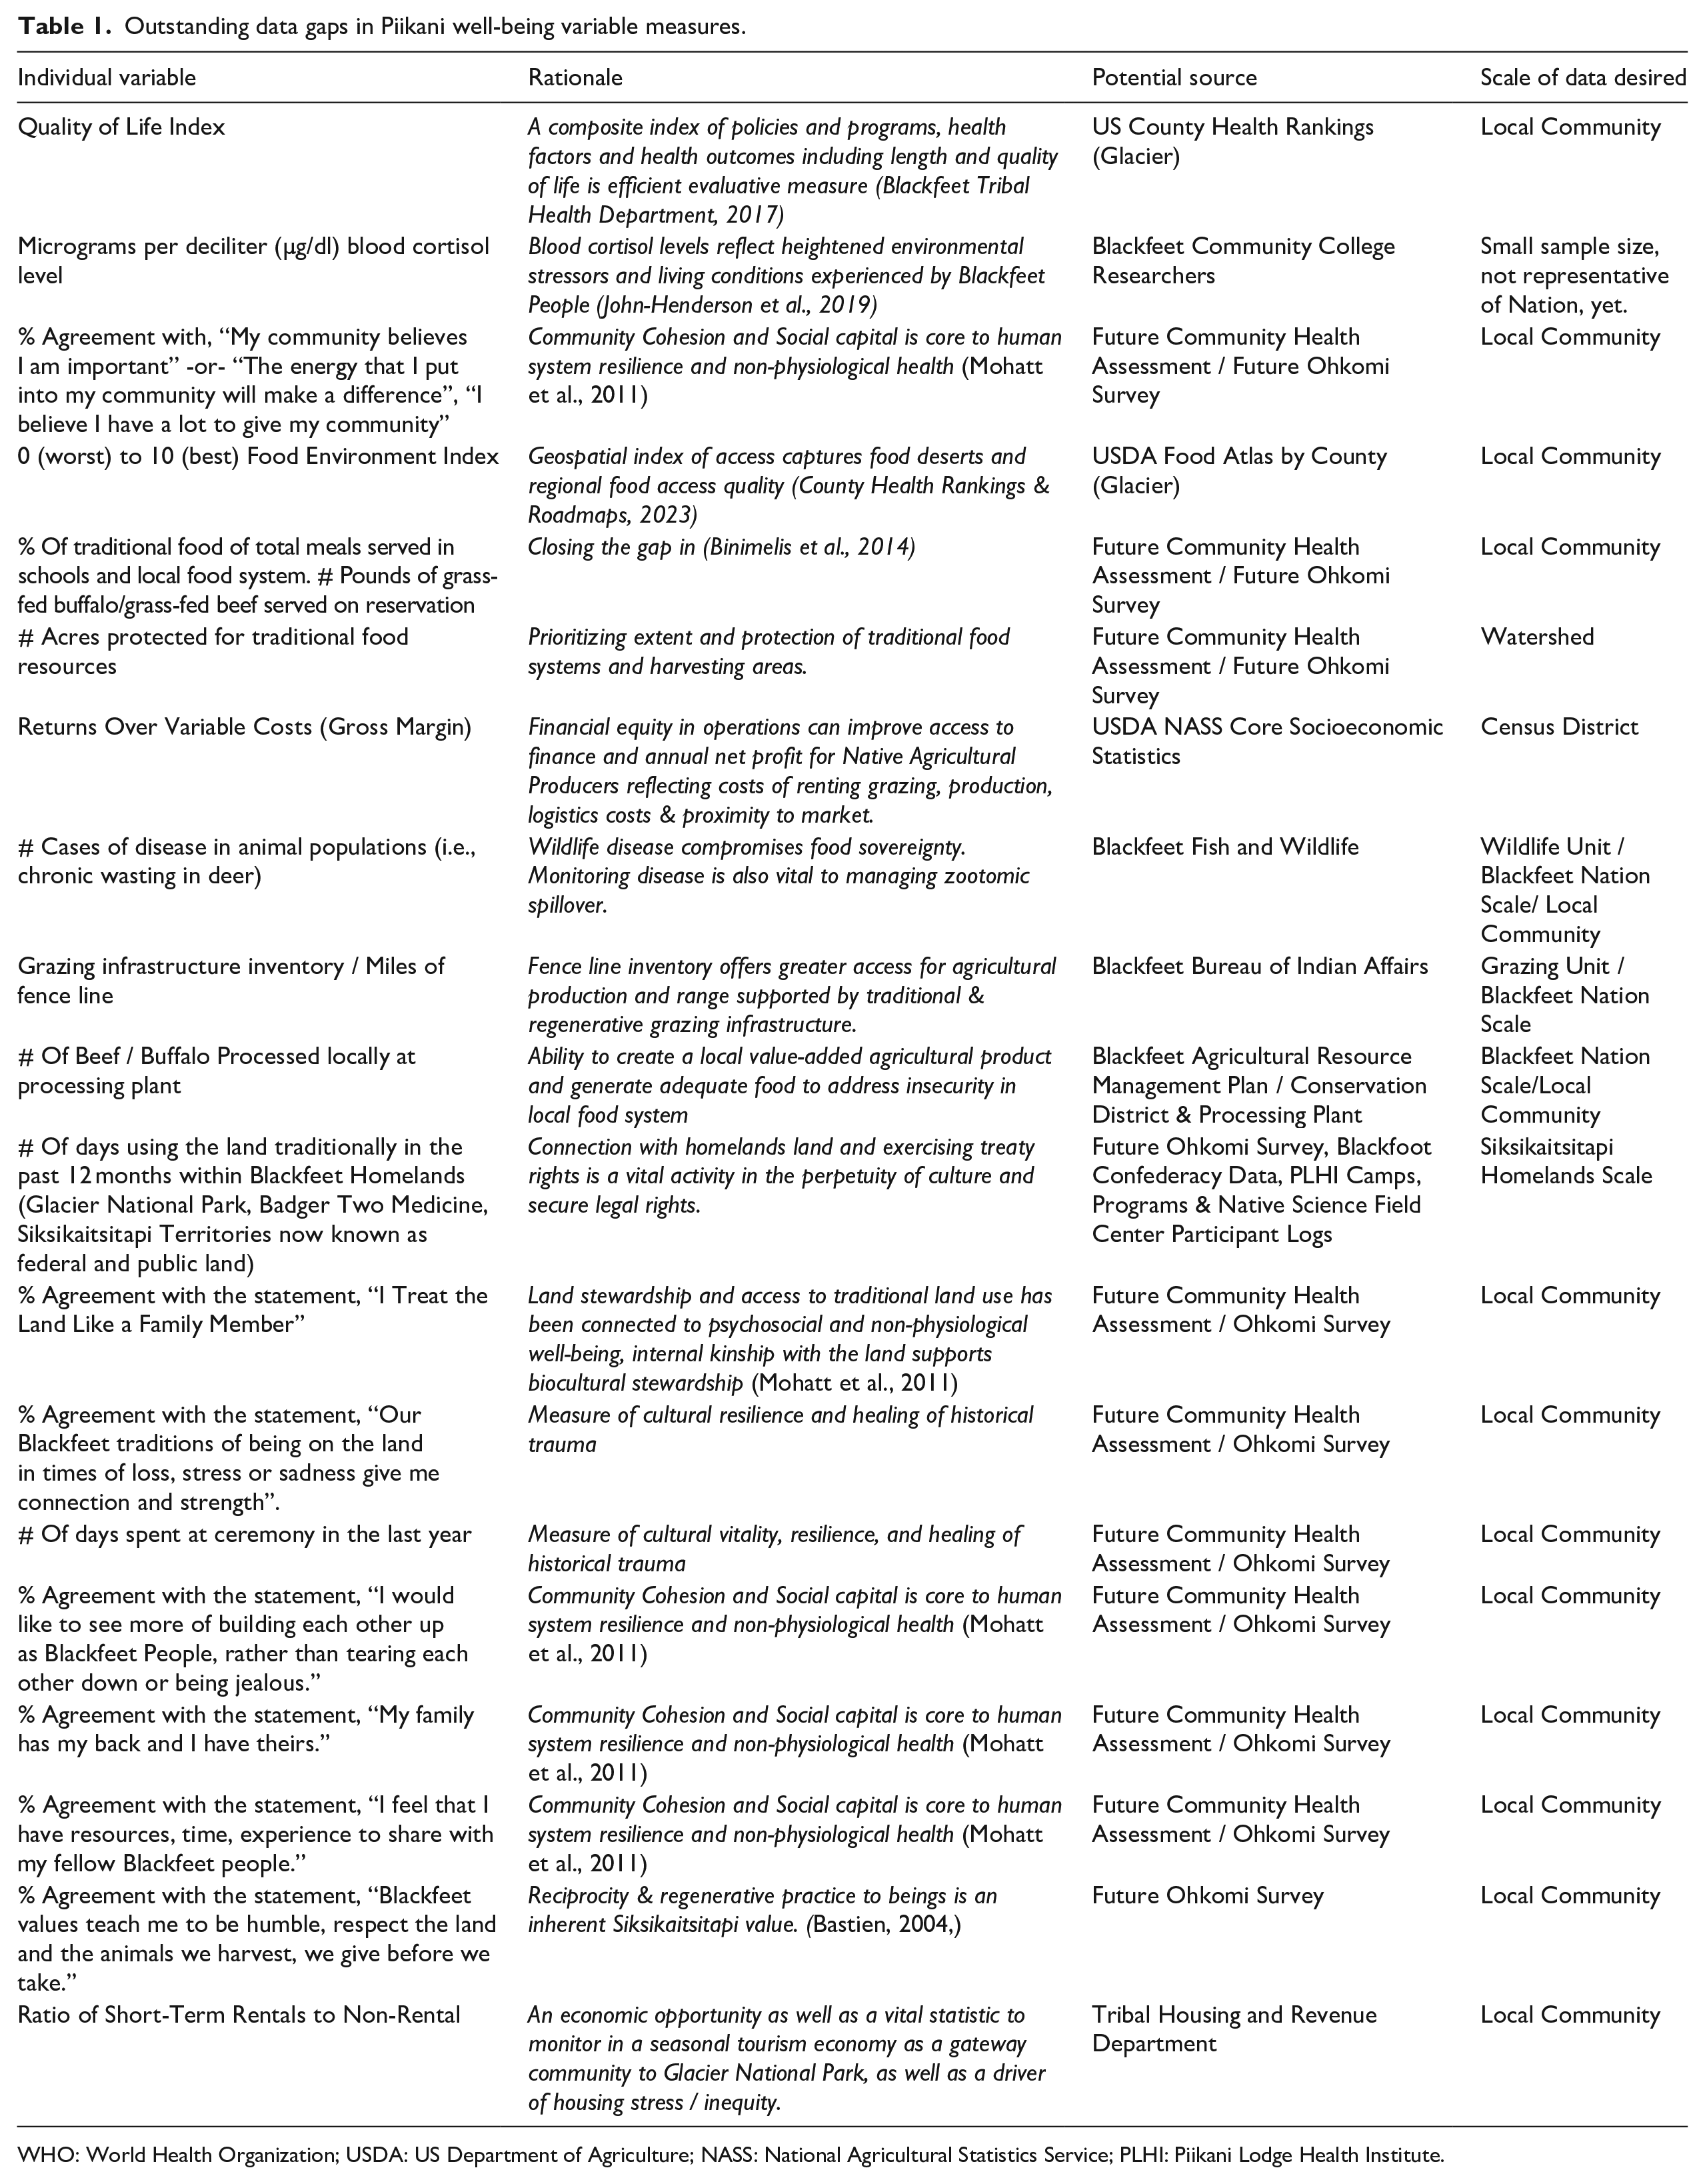
WHO: World Health Organization; USDA: US Department of Agriculture; NASS: National Agricultural Statistics Service; PLHI: Piikani Lodge Health Institute.
Conclusion
Definitions of well-being which emerged in this project are inclusive and interrelated. Indicator areas often crossed over and are interreferential, for example the access to Internet providing access to not only economic markets but also mental care for Native American ranchers.
Common denominators in data scale are vital in creating actionable well-being indicators that can be statistically significant and cover all landscapes. Currently, data are collected ad hoc at varying scales which make integration and analyses for most data possible only at the Nation scale (rather than at more local scales, such as watersheds or tracts).
Data are difficult to access and mobilize (Figure 11). They are scattered across Western-style departments and, in raw form, are practically inaccessible to Tribal decision makers. Furthermore, because electronic data systems are not standardized across systems, it is nearly impossible for subject matter experts from different domains (e.g. health or emergency response) to analyze or be aware of interdependencies between their domain and others (e.g. environmental, schools, or agriculture). Siloed information systems are a well-recognized problem within settler nations and are known to adversely impact decision-making culture as they favor hierarchical over lateral communication.
Data is a mixed bag, blind spots remain.
Information and data relevant to Amskapi Piikani decisions may be missing or is generated from outside the Nation. Too often, outsider-defined indicators and variables only capture what is wrong or include indicators that do not capture human health at all (such as Regional Domestic Product) rather than what Piikani define as living well. Further, outside data are intermittent, have limited response rates, are of uneven quality, and remain at the Nation scale, a scale too big for more tactical budgeting and decision support. For example, human health data come from US Census and is only updated every 5 years; agricultural and economic health data come from USDA NASS and are updated every 3 years. This information gathered by non-native agencies is simply inadequate for addressing real time COVID-19 response, tackling root issues like food insecurity and unemployment, or securing human well-being.
While data does originate from within the Nation and takes account of what is important locally (e.g. land use census and local Native health organizations delivering supplies and providing elder wellness checks for rural residents weekly), it is often self-directed without integration between datasets and scales. Further, epidemic data and live collection of conditions (local observation made by residents, rural drivers, and residents) which help fill gaps are not incorporated into one information system. This inhibits the Amskapi Piikani from respectfully taking the vital signs of the well-being of Piikani people and analyzing it to manage or improve well-being, especially during times of crisis.
Made exponentially worse during the COVID-19 pandemic, Indigenous Nations like Amskapi Piikani govern with limited staff and professional capacity for research and development. This shortage of human and information capital limits the Blackfeet Nation in harnessing its own ability to unlock “big data” and complete powerful analyses that would empower leaders and decision-makers with insights into the health of systems and well-being of people during and after a pandemic. Without the resources and human capacity to evolve decision support systems, the Nation may miss opportunities to blend new tools and “big data” with effective systems of governance and ways of knowing that are thousands of years in the making, thus undermining the exercise of Tribal Sovereignty.
With the foregoing realities, challenges and opportunities in mind, the Piikani Well-being Project offers a roadmap for future survey, data collection, monitoring, updating, and—most importantly—community engagement. Tribally sanctioned and community-led survey development and data collection needs should begin with the formation of a common denominator, zip code, or watershed. By integrating geographically specific attributes into the system, these efforts will then lead to the creation of a live data dashboard to aid and empower Tribal and community decision makers. Monitoring and updating of the PWI with integrated community-led health, agriculture, and land use surveys offers opportunity for longitudinal study and strategic planning that reflect a distinctively Piikani sense of human health and well-being.
Footnotes
Acknowledgements
This research team would like to acknowledge the Blackfeet Tribal Business Council, Traditional Societies, Blackfeet families, elders and Blackfeet Nation Tribal Departments for continued support and service to the people and land of the Blackfeet Nation. We are deeply grateful for guidance and leadership of the Piikani Well-being Project advisors which includes Timothy “Kink” Davis, Melissa Weatherwax, Nonie Woolf, Brad Hall, Lea Whitford, Termaine Edmo, Rosemary Cree Medicine, Annie Wagner, Helen Carlson, Craig Iron Pipe, Latrice Tatsey, Cinnamon Crawford, Dylan DesRosier, and Will Seeley.
Declaration of conflicting interests
The authors declared no potential conflicts of interest with respect to the research, authorship, and/or publication of this article.
Funding
The authors disclosed receipt of the following financial support for the research, authorship, and/or publication of this article: This work was supported by the Foundation for Food & Agriculture Research (grant # CA18-SS-0000000184).