
Abstract
Objective
The Patient Experience with Treatment and Self-management (PETS) is a valid self-report measure of treatment burden. The objective of this analysis is to determine severity cut points for its scores.
Methods
Data from two survey studies of adults with multimorbidity were used to determine estimates of low, moderate, and high burden for twelve PETS scores. Anchor-based analyses were used to map mean PETS scores onto scores of other self-report measures, including physical and mental health, self-efficacy, and activity limitations. Low, medium, and high scores on the anchors were based on published thresholds or tertile splits of score distributions. Mean PETS scores were compared across levels of the anchor variable using analysis of variance (ANOVA) then summarized to produce burden severity cut points.
Results
Study 1 featured survey data from 332 adults with multimorbidity (mean age = 66 years, 56% female); study 2 featured survey data from 439 adults with multimorbidity (mean age = 60 years, 62% female). Anchor measures were correlated with PETS scores at rho≥ 0.30. ANOVAs comparing PETS scores across the levels of each anchor variable were all significant (ps< .001). Estimates were placed into data tables. Cut scores for discriminating treatment burden severity levels were identified as the midpoint between the mean PETS scores associated with adjacent anchor categories (e.g., low vs. medium and medium vs. high burden), rounded to the nearest whole number.
Conclusions
Severity thresholds can improve the interpretability of PETS scores. The preliminary estimates derived require verification in future studies.
Keywords
Introduction
Many chronic health conditions require continuous self-management, i.e., healthcare tasks and activities that must be done routinely to stay healthy. This can include taking medications, maintaining medical appointments, seeking/understanding medical information, and monitoring health.1,2 The complex nature of self-care regimens and other treatment-related stressors can lead to a perception of being ‘burdened by treatment.’ Treatment burden is defined as the workload of treatment and self-management for chronic health conditions, its impact on patient functioning, and stressors that exacerbate burden like medical financial concerns and difficulties with healthcare services.1,3 Treatment burden is especially salient to people with multimorbidity who often face challenges integrating their self-care regimens into daily life.2,4 Meeting these challenges is important to patients as well as healthcare providers as it can lead to higher self-efficacy, improved well-being and quality of life,5–9 and greater adherence to health regimens, such as medication, diet, and exercise.10–13 Adherence is associated with lower rates of disease exacerbation, 14 hospitalization,14–16 and mortality.14,16,17 Hence, understanding a patient’s treatment burden could inform providers about patient self-management challenges that, if addressed, might result in better clinical outcomes. 18
Over the past 12 years, several patient-reported measures of treatment burden applicable to people with multimorbidity have emerged.5,6,19,20 This includes the Patient Experience with Treatment and Self-management (PETS).8,21 The PETS is a multi-domain measure that assesses a range of issues of treatment and self-management burden that cut across disease and treatment types. Its content was fully informed by multimorbid patients,1,3 and it has demonstrated reliability, construct and known-groups validity, and responsiveness to change when used in this population.8,21–23 At present, there is no indication of what PETS score magnitudes constitute ‘clinically problematic burden.’ Hence, the interpretability and clinical utility of the PETS could be facilitated by determining benchmark severity thresholds (i.e., cut points) for low, moderate, and high treatment burden on its available scores.
The present analysis utilizes archived survey data from studies of people living with multiple chronic conditions to determine initial estimates of severity thresholds on PETS scale and index scores.
Methods
Study samples and overview of study procedures
Descriptive and medical characteristics of survey samples and summary statistics of anchor variables.

Abbreviations: SD, standard deviation; AA, African-American; HS, High School; COPD, Chronic obstructive pulmonary disease; PMCSM, Perceived Medical Condition Self-Management Scale; PROMIS, Patient-reported Outcomes Medical Information System; CDC, Centers for Disease Control and Prevention; NA, not available.
aVariability in diagnosed conditions was greater in sample 2 than sample 1, as inclusion criteria were made more formal in the sample 2 study.
bIncludes osteopathic conditions such as disc displacement/ degeneration, spondylosis, spinal stenosis, sciatica, and post-laminectomy syndromes.
cIncludes osteoarthritis and rheumatoid arthritis.
dHigher score indicates greater self-efficacy for self-management.
eHigher score indicates better self-perceived health.
fHigher score indicates more days of activity limitations.
The second study encompassed a prospective test of the PETS for purposes of further validation, including responsiveness to change (details can be found in Eton et al.). 8 The study used the resources of the Rochester Epidemiology Project (REP) to identify a sample of adults (≥20 years old) with medical-record confirmed diagnoses of multiple chronic conditions residing in Olmsted County in southeastern Minnesota (see Table 1). Inclusion criteria were more formal in this study with people being eligible for the survey if they had an International Classification of Diseases (ICD) diagnostic code for one or more of 20 chronic conditions identified by the U.S. Department of Health and Human Services as important for studying multimorbidity.28,29 In addition to these conditions, several other conditions identified by project clinician investigators as having high treatment burden were deemed eligible for this sample (e.g., anxiety, low back problems associated with osteopathic conditions, vision problems). Persons with diagnoses of severe cognitive impairments (e.g., dementia) or severe mental illness (e.g., psychosis) were excluded. The REP electronically links medical records for almost the entire population of Olmsted County making it a valuable resource for population-level health studies.30,31 A survey battery including the PETS and several other measures was mailed to a stratified random sample of 1,496 adults enrolled in the REP at the time of the study. The sample strata included age (20-49, 50–64, 65+), race (white, non-white), number of record-confirmed diagnosed chronic conditions (2-3, 4+) and presence/absence of an incident condition diagnosed within a year of the survey mailing. A total of 443 people returned a completed baseline survey (30% response rate). Four people were subsequently excluded due to an incident diagnosis of an exclusionary condition. Follow-up surveys were mailed to those who completed the baseline survey at 6-, 12-, and 24-months post-baseline. However, for this analysis data from only the baseline survey are used. The study was approved by IRBs at Mayo Clinic and Olmsted Medical Center (IRB #’s 14-008629 and 022-OMC-16), institutional co-administrators of the REP. Hereafter this study sample will be referred to as Sample 2.
The STROBE guidelines for the reporting of an observational, cross-sectional study 32 are included with this report in Supplemental file 1.
Measures and survey data available
The PETS is a multi-scale (multi-domain) self-report measure of treatment burden. This analysis focuses on ten domain scales and two summary index scores of the PETS. The scales include medical information, medications, medical appointments, monitoring health, diet, exercise/physical therapy, medical expenses, difficulty with healthcare services, role activity limitations, and physical/mental exhaustion. The index scores are aggregated summaries of PETS scale scores indicating Workload (i.e., medical information, medications, medical appointments, and monitoring health) and Impact (i.e., role activity limitations and physical/mental exhaustion). The Workload index score summarizes the domains assessing challenges in doing the work of treatment and self-management. The Impact index score summarizes the domains assessing the personal impact of treatment and self-management on well-being. Scoring of PETS scales and aggregate index scores has been previously described,8,21 including how missing data are handled using prorated scoring. All scale and index scores are standardized to a 0 to 100 metric with a higher score indicating more treatment burden. The PETS including all versions is protected by copyright, ©2016, 2020, 2024 Mayo Foundation for Medical Education and Research, all rights reserved.
From the first study, 21 PETS data were available for the following domain scales: medical information, medications, medical appointments, monitoring health, medical expenses, difficulty with healthcare services, role activity limitations, and physical/mental exhaustion. The diet and exercise/physical therapy domains were not scored in this study due to substantial missing data making analyses unfeasible. Data from established measures used for purposes of validation of the PETS were also available. This included the Perceived Medical Condition Self-Management scale (PMCSM),33,34 a generic dispositional measure of self-efficacy for managing a health condition, and the Patient-Reported Outcomes Measurement Information System (PROMIS) Global-10, a self-report measure of general health featuring summary scores for global physical health (GPH) and global mental health (GMH). 35 These measures are reliable and valid in people living with chronic illnesses.33–36 Targeted single items were available that assessed demographic characteristics (e.g., age, race/ethnicity, education and employment status), economic hardship due to medical care, and convenience of healthcare services. Economic hardship was assessed by the item, “Has your physical condition or medical treatment caused you financial difficulties? (not at all, a little, somewhat, quite a bit, very much).” Convenience of healthcare services was assessed by the 0 to 10 rating scale item, “Overall, how would you rate the convenience of the healthcare services that you seek for your health problems? (0-not at all to 10-extremely)”. 21
From the second study, 8 PETS data were available for all of the same domains as in the first study and also for the diet and exercise/physical therapy domain scales. These domains were slightly modified for this second study of the PETS to mitigate the prior problem of missing data by eliminating a yes/no screening question and rewording the item response scale used. The two summary index scores of Workload and Impact were first derived, validated, and used in this study. Several established measures were used for the additional validation testing conducted in the second study. This once again included the PMCSM scale of self-efficacy and the PROMIS Global-10 measure of general health, as well as a single-item measure of activity limitations due to poor health drawn from the Centers for Disease Control and Prevention’s (CDC) Healthy Days measure. 37 The activity limitations item of the Healthy Days measure asks a respondent to judge how many days in the past month has poor physical or mental health kept them from doing their usual activities, such as self-care, work, or recreation, with a higher score indicating more days of activity limitations. Demographic characteristics (e.g., age, race/ethnicity, education status) were also queried on the survey.
Anchor-based data analyses
Traditional anchor-based methods that map scores of a patient-reported outcome (PRO) measure onto levels of an external anchor variable38,39 were used to identify severity estimates on PETS scores. The candidate anchors were those self-report measures mentioned above that were used to help validate the PETS, including the PMCSM measure of self-efficacy, the PROMIS Global-10 measure of general health, and the CDC Healthy Days item measuring activity limitations due to poor health. These concepts indicative of personal well-being were hypothesized to be associated with the elements of subjective treatment burden assessed by the PETS. The PMCSM and PROMIS measures were used in both studies and are therefore available to be used as anchors in both the Sample 1 and Sample 2 analyses. Two other items used in the Sample 1 survey study were available as anchors for select PETS scales – the question on economic hardship due to medical care and the question addressing convenience of healthcare services. These candidate anchor variables were associated with PETS scores in the two validation studies.8,21 The use of multiple anchors and analyses is desirable as there is no single ‘gold standard’ correlate or indicator of treatment burden.38,39 Since treatment burden is a subjective concept, candidate anchors are all self-report measures.
Candidate anchor variables were first screened to determine their degree of association with each PETS score. Only anchors with an acceptable association with the PETS scores were selected for inclusion in the analysis. This is indicated by a correlation magnitude of at least 0.30, a recognized threshold for acceptable association of an anchor with a target PRO score.38,39 Other variables available in the two datasets that were not as strongly correlated with the PETS scores (e.g., number of diagnosed conditions) were not selected to be anchors as they failed to meet the correlation magnitude criterion for inclusion. In conventional anchor-based analyses mean scores of a target PRO are compared across discrete levels of the anchor variable,38,40 using a statistical test such as analysis of variance (ANOVA). In this analysis, discrete levels of the anchor variables were defined in the following ways. (1) When available, empirically established cut points were used. HealthMeasures 41 has made available cut points of high, medium, and low GPH and GMH scores for the PROMIS Global-10. (2) For continuous variables with no established empirical thresholds (e.g., scores of the PMCSM and Healthy Days measures), “high,” “medium,” and “low” values are based on the 33rd and 66th percentiles of their respective score distributions. (3) For single-item indicators (e.g., economic hardship, convenience of healthcare services), “high,” “medium,” and “low” values are based on sensible breakdowns of the response options.
Each PETS score was compared across the levels of each anchor to determine estimates of low, moderate, and high burden severity. This was done by identifying the mean PETS score that corresponds to “low,” “medium,” and “high” on each tri-level anchor (e.g., Summary of PETS severity thresholds.
Results
Characteristics of survey samples
Table 1 (see below) shows descriptive characteristics of the two samples. Both samples were diverse in age, with the mean age of sample 1 being slightly older than sample 2 (65.9 years vs. 60.3 years). There were slightly more female than male participants in both samples (56% female in sample 1 and 62% female in sample 2). The majority of participants of both studies self-reported white race (73% sample 1; 77% sample 2). Among those self-reporting a minority race, the largest proportion of participants in both samples reported black/African American (15% sample 1; 9% sample 2). Most participants reported being married/partnered (58% sample 1; 59% sample 2), having a college education (70% sample 1; 73% sample 2), and not currently employed (65% sample 1; 57% sample 2). Sample 1 had slightly fewer diagnosed chronic conditions (Median = 3 conditions) than sample 2 (Median = 5 conditions). Hypertension, hyperlipidemia, arthritis, and diabetes were frequent occurring diagnoses in both samples. Other frequent occurring diagnoses in sample 2 were disorders of the low back (51%), depression (43%), vision problems (36%), anxiety (31%), cardiac arrhythmia (26%), and cancer (26%). In general, there is greater variability in the types of diagnosed conditions among sample 2 respondents. Summary statistics (i.e., means, frequencies) for the anchor variables used in the analyses of the two samples appear at the bottom of Table 1.
Anchor analyses of PETS domain scales and summary indices
All anchor-based analyses to determine cut point severity thresholds for scores of ten PETS domain scales and two summary indices utilized the same basic pattern with, in most cases, the same anchor variables. Hence, detailed results are provided below for three examples only – two domain scales (i.e., Medical Information and Physical/mental Exhaustion) and one summary index (Impact).
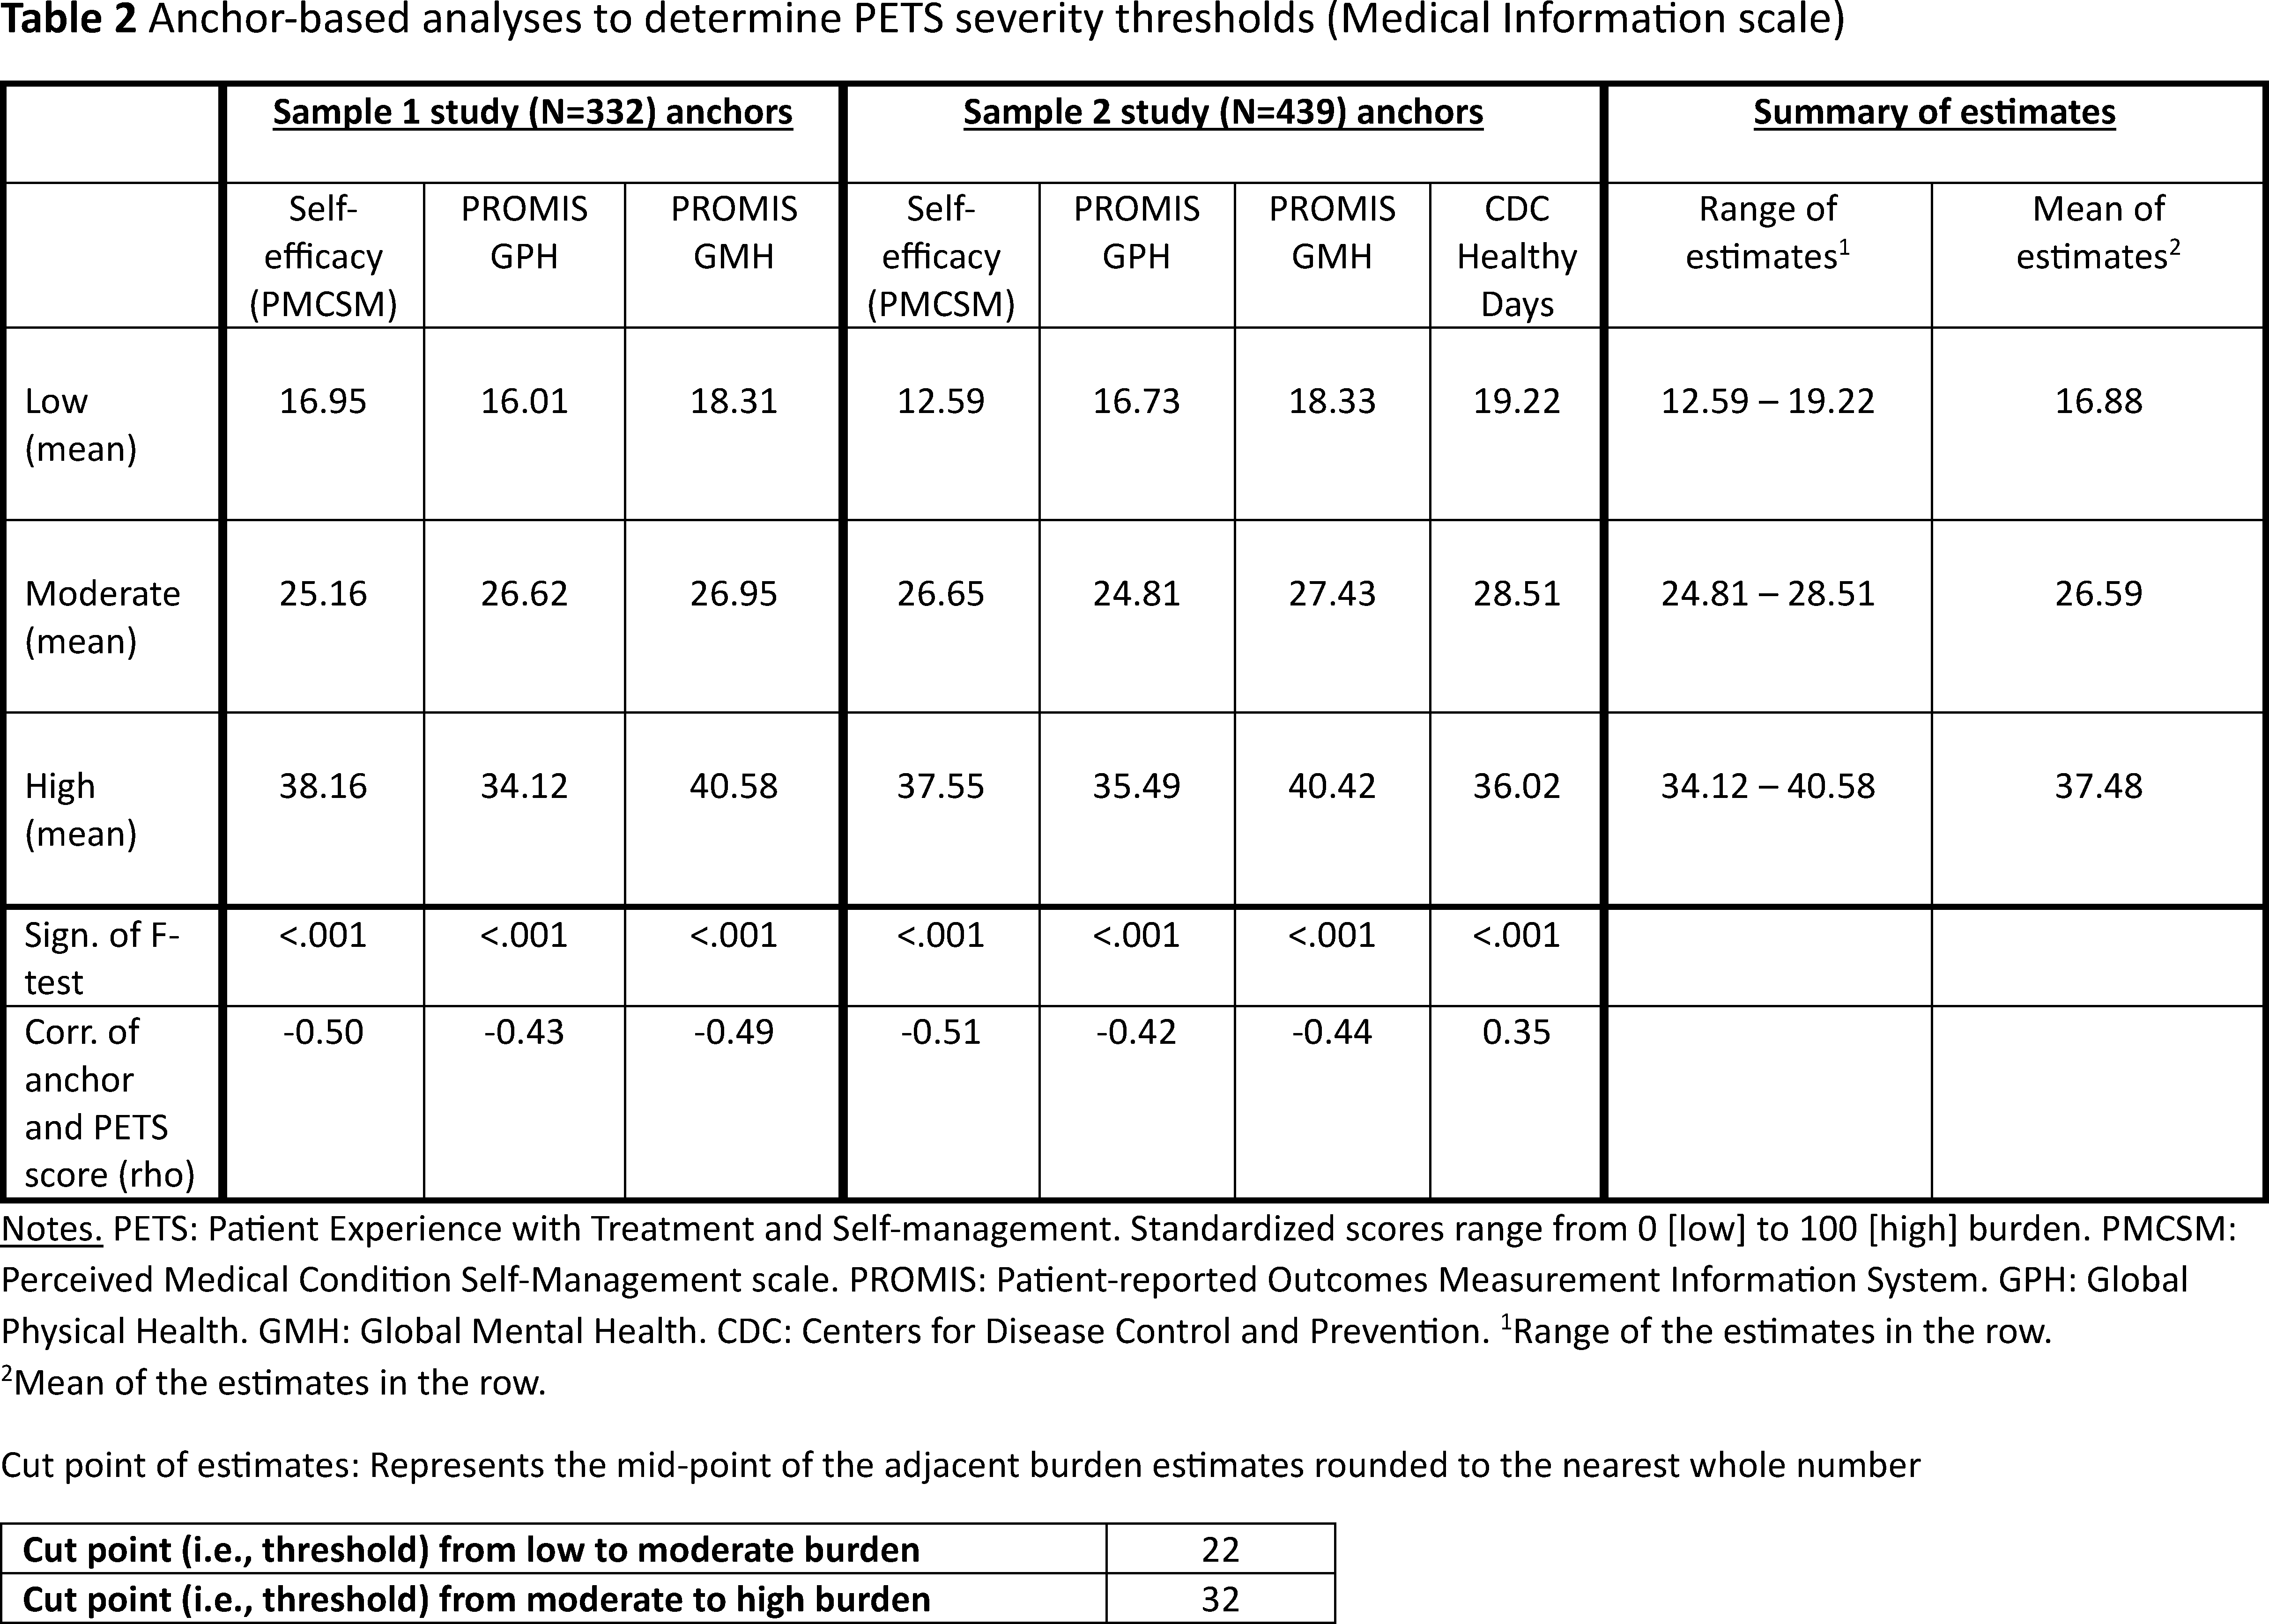
Anchor-based analyses to determine PETS severity thresholds (Medical Information scale).

Notes. PETS: patient experience with treatment and self-management. Standardized scores range from 0 [low] to 100 [high] burden. PMCSM: perceived medical condition self-management scale. PROMIS: patient-reported outcomes measurement information system. GPH: global physical health. GMH: global mental health. CDC: centers for disease control and prevention.
aRange of the estimates in the row.
bMean of the estimates in the row.
Anchor-based analyses to determine PETS severity thresholds (physical/mental exhaustion scale).
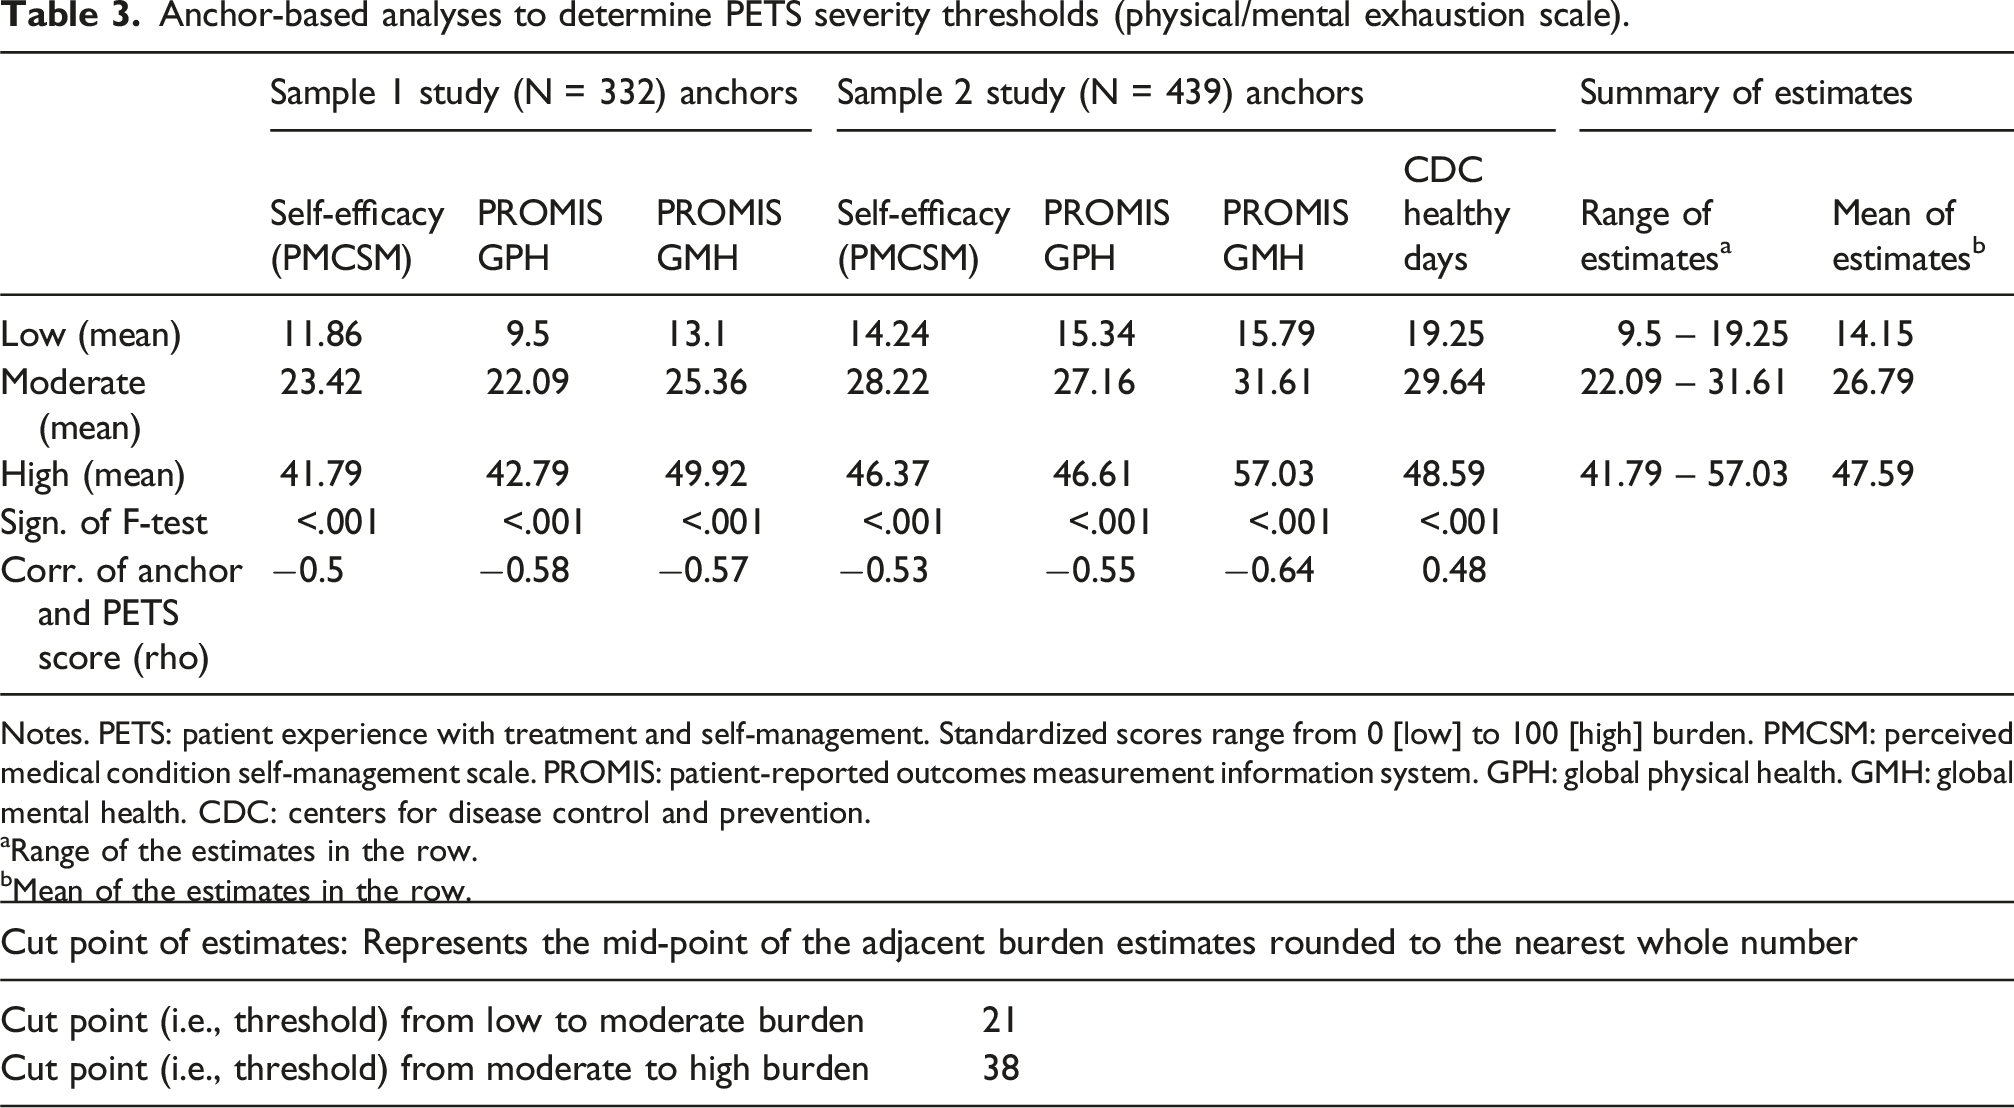
Notes. PETS: patient experience with treatment and self-management. Standardized scores range from 0 [low] to 100 [high] burden. PMCSM: perceived medical condition self-management scale. PROMIS: patient-reported outcomes measurement information system. GPH: global physical health. GMH: global mental health. CDC: centers for disease control and prevention.
aRange of the estimates in the row.
bMean of the estimates in the row.

Anchor-based analyses to determine PETS severity thresholds (impact summary index) a .
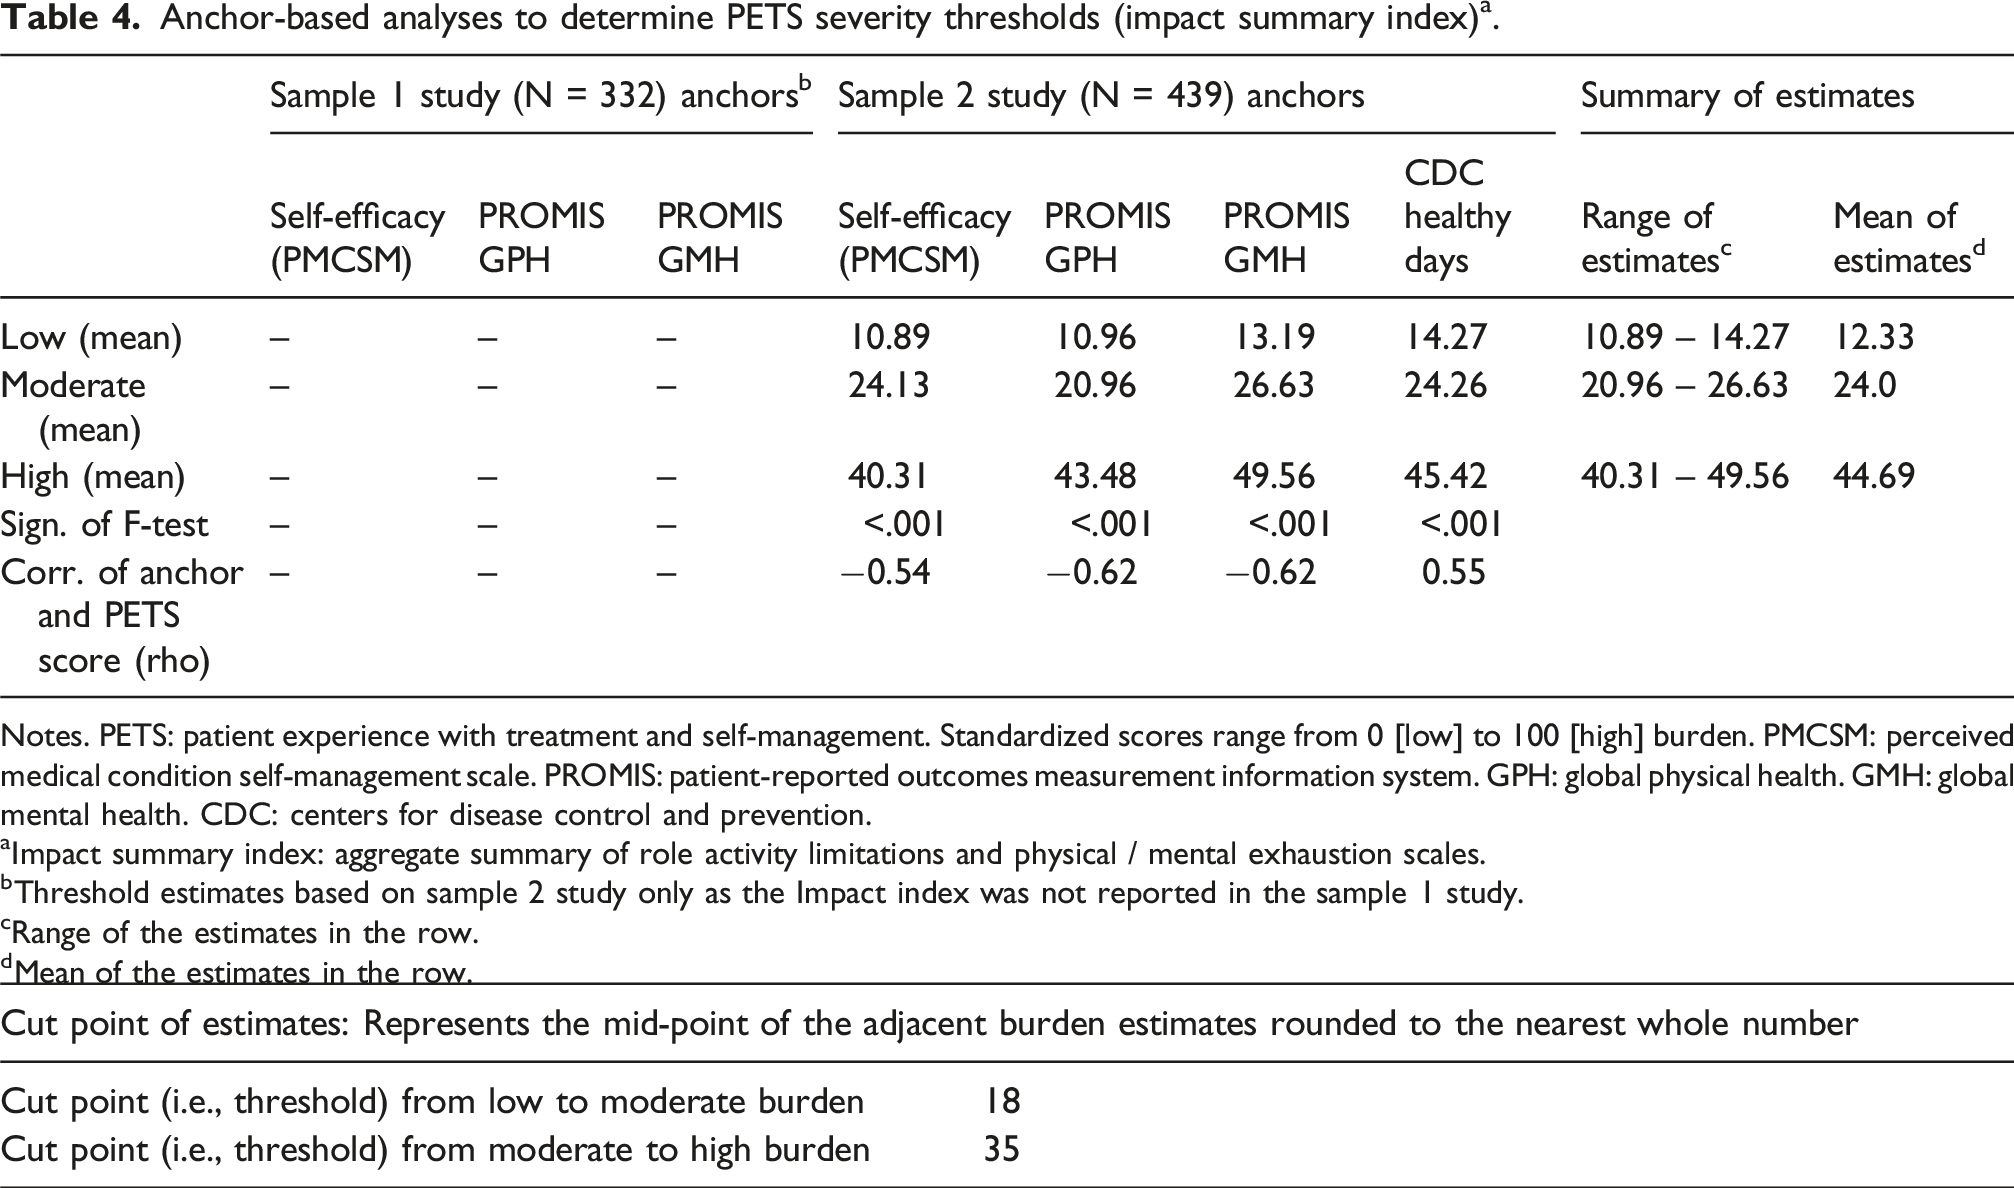
Notes. PETS: patient experience with treatment and self-management. Standardized scores range from 0 [low] to 100 [high] burden. PMCSM: perceived medical condition self-management scale. PROMIS: patient-reported outcomes measurement information system. GPH: global physical health. GMH: global mental health. CDC: centers for disease control and prevention.
aImpact summary index: aggregate summary of role activity limitations and physical / mental exhaustion scales.
bThreshold estimates based on sample 2 study only as the Impact index was not reported in the sample 1 study.
cRange of the estimates in the row.
dMean of the estimates in the row.

Summary of PETS severity thresholds
All the computed PETS severity thresholds discriminating low, moderate, and high burden for each of the 10 PETS domain scales and the two PETS summary index scores are represented in Figure 1. On the Figure, a low burden score is indicated in green, a moderate burden score is indicated in yellow, and a high burden score is indicated in red. These severity groupings were based on the cut points identified in the anchor-based analyses and featured in the data tables. Note that complete results of the anchor-based analyses for all other PETS scales and the Workload aggregate index score can be found in Supplemental Tables 1-9, located in Supplemental file 2 accompanying this report.
Discussion
An important step to making a patient-reported outcome measure (PROM) more practically useful is determining the clinical significance of its scores. 39 In the past this has been accomplished through analyses of group-level data that identify PROM score differences that are ‘meaningful’ by comparing clinically distinct groups of patients (i.e., the so-called ‘minimally important difference’ or MID). This can enhance the interpretability of results of clinical trials and comparative effectiveness studies where a PROM is used as an endpoint. 38 Today, with increasing use of PROMs in clinical practice,42–44 it is also critical to understand individual-level score thresholds that are meaningful to both patients and providers. Cut points on scale scores help classify individuals based on the presence or severity of a problem, making it easier for practitioners to detect when intervention might be warranted. 40 Having precise, easy to interpret information about treatment burden scores will improve the ability of clinical investigators and healthcare providers to identify patients who may struggle with adherence to health regimens12,21 or those who may simply feel overwhelmed by their treatment.2,45 Finally, like the MID, benchmark severity thresholds have the potential to identify score targets for interventions in clinical trials of treatment burden. While small-scale studies of interventions to reduce treatment burden have been conducted, more large-scale tests are needed. 46
Group-based analyses of PROM results, such as the anchor-based analysis reported here, are recognized as being a useful starting point for determining interpretation guidelines for PROM scores to be used at the individual level. 40 The “individual level” refers to the PROM data of individual patients that can be used by healthcare providers to help manage the patients they care for. One of the challenges with determining individual-level cut points from anchor analyses of group data is selecting suitable anchors. Ideally, the selected anchor would be a ‘gold standard’ clinical indicator of the very concept that the PROM is designed to assess. For instance, a clinician’s diagnosis of depression could be used as an anchor for a PROM designed to assess depression. In the absence of a ‘gold standard,’ the alternative is to use multiple anchors of related constructs that each show “nontrivial” associations with scores on the PROM. 38 Evidence suggests that a correlation of at least 0.30 is an acceptably strong correlation magnitude to justify the use of a given anchor in an analysis of clinical significance of a PROM. 39 Results from analyses of multiple anchors are triangulated and summarized to arrive at estimates of clinical significance. This was the approach employed in this analysis of PETS severity thresholds.
Severity thresholds have been determined for other patient-reported measures of treatment burden. Duncan and colleagues used a simple approach to identify severity cut points on the Multimorbidity Treatment Burden Questionnaire (MTBQ). In two validation studies with multimorbid patients seen in primary care clinics in the UK, they relied exclusively on the score frequency distributions of the respective study samples, grouping global MTBQ scores greater than 0 (no burden) into tertiles to generate score categories of low, medium, and high burden.6,47 Sample sizes were vastly different in the two studies with an N of 1,546 in the 2018 study and an N of 244 in the 2024 study. Cut-point values for the burden categories were slightly higher in magnitude in the 2024 study. While simple, the lack of use of any external anchors renders this a somewhat arbitrary approach to defining thresholds, very much dependent on the sample being analyzed.
A different approach was used to calculate a burden severity cutoff for the Treatment Burden Questionnaire (TBQ). Tran et al. 45 employed an adapted form of the Patient Acceptable Symptom State (PASS) question. The PASS has been used in studies of rheumatologic conditions such as osteoarthritis to help identify the point on a continuous scale of measurement that a particular symptom state is perceived by a patient to be unacceptable. 48 The analogous question adapted for treatment burden indicates the state above which a patient perceives their burden to be unsustainable over time. The question presents a binary choice (yes/no), asking individuals to consider all their current healthcare tasks and determine whether they could continue investing the same amount of time, energy, and money into their health care lifelong. Responses to this question provided the anchor upon which TBQ total scores were matched. A cutoff level was defined as the TBQ score below which 75% of patients reported an “acceptable burden state.” Unlike the MTBQ and PETS approaches which define discrete grades of burden severity, the TBQ approach discriminates scores that are either acceptable or unacceptable, in this case a score of 59 out of the maximal score of 150. Sensitivity and specificity of this cutoff were 57% and 75%, respectively. 45
Limitations
The analysis reported herein has several limitations, some that hint at future directions for research. First, while the sample sizes of the two studies were robust and featured diversity in age, gender, race, and socioeconomic status, both study samples were drawn from one region of the United States. This may have introduced some bias in the estimates. Second, this is an analysis of two archived datasets each of which was collected for another purpose, namely validating the PETS. Future studies should be designed to test and, if necessary, refine these initial estimates. Investigators should consider employing anchors that are more conceptually aligned with the concept of treatment burden, for instance, customized PASS questions as used by Tran and colleagues, or one of the other available measures of treatment burden like the MTBQ. More objective indicators like illness severity, presence of a condition known to be burdensome, treatment type or complexity, and numbers of healthcare providers seen might serve as useful anchors in future analyses determining severity cut points. Anchor-based approaches can indeed be limited by the number and types of anchors available for an analysis. However, it is important to appreciate that anchor-based analyses are only one method of determining the clinical significance of scores on PRO measures. Qualitative techniques such as ‘standard setting’ and ‘benchmarking’ approaches that rely on stakeholder review of scores, informed by practical experience and sometimes paired with clinical vignettes, are methods that also deserve consideration.40,49 Ultimately, the most robust approach to determining clinical significance of scores on a target PRO measure would rely on the triangulation of results from multiple and diverse methods. 38 Third, it is possible that the severity estimates generated may be different across different index conditions or circumscribed sets of conditions. Future studies will need to test this. Finally, caution must be exercised when interpreting the clinical significance of changes in treatment burden over time. It would be tempting to interpret a change from one burden severity category to another over time as a “real” change in a patient’s burden status; however, the magnitude of some changes may fall within the standard error of measurement. Given this, it would be inappropriate to interpret results of only the severity levels, both the severity level and the PETS scale/index score should be considered. Hence, while these severity estimates can aid interpretation of PETS scores, they should not replace PETS scores.
Conclusion
The PETS is a measure of treatment burden originally designed for use in clinical research of people with multimorbidity.8,21 Score severity thresholds can facilitate its use by identifying subgroups of patients with problematic burden and possibly even individual patients who may be overwhelmed by their treatment regimens. The severity threshold estimates derived from this analysis and featured in Figure 1 should be treated as initial estimates, subject to verification in future studies.
Supplemental Material
Supplemental Material - Deriving severity thresholds of treatment burden for the patient experience with treatment and self-management (PETS)
Supplemental Material for Deriving severity thresholds of treatment burden for the patient experience with treatment and self-management (PETS) by David T. Eton and Kathleen J. Yost in Journal of Multimorbidity and Comorbidity.
Footnotes
Author note
Presented at the 30th annual meeting of the International Society for Quality of Life Research, October 18-21, 2023: Calgary, Alberta, Canada.
Acknowledgements
We thank Ms. Ann Harris, Ms. Wendy Daniels and other personnel of the Mayo Clinic Survey Research Center (Rochester, Minnesota USA) for formatting, distribution, and receipt of the surveys used in the original validation studies. We thank Dr. Jennifer St. Sauver for supporting the use of the Rochester Epidemiology Project resources that enabled the research of the study 2 prospective validation of the PETS measure. We also thank Ms. Bayly Bucknell and Ms. Amy Eisenberg for study coordination at Mayo Clinic and Ms. Sara Poplau for study coordination at Hennepin County Medical Center (Minneapolis, Minnesota USA).
Ethical considerations
Study 1 from which sample 1 was drawn was deemed exempt from Institutional Review Board (IRB) review by the Mayo Clinic IRB under category 2 of Title 45 Code of Federal Regulations (CFR) Part 46.101 (Protection of Human Subjects). A waiver of written consent was approved in accordance with 45 CFR 46.117. Study 2 from which sample 2 was drawn was approved by IRBs at Mayo Clinic and Olmsted Medical Center (IRB #’s 14-008629 and 022-OMC-16) in Rochester, Minnesota USA. These two institutions co-administer the Rochester Epidemiology Project, the data resource used to recruit the sample. The datasets were completely de-identified prior to analysis for this report.
Consent to participate
As indicated above, written informed consent was waived in study 1. Written informed consent was obtained from participants in study 2. Signed consent forms were returned to the investigator and separated from the survey responses.
Author contributions
DTE is responsible for all elements of this report including the study concept and design, data analysis and interpretation, acquisition of funding support, and manuscript drafting. KJY assisted in the study design, access to the study data, data interpretation, and revisions to the original manuscript draft. DTE and KJY accept accountability for the overall work produced and approve of the final version of this manuscript. The views and opinions expressed in this manuscript are theirs alone.
Funding
The authors disclose receipt of the following financial support for this research: The research was funded by the National Institute of Nursing Research of the National Institutes of Health (USA) under awards R21NR012984 and R01NR015441. The content is solely the responsibility of the authors and does not represent the official views of the National Institutes of Health.
Declaration of conflicting interest
The authors declare no potential conflicts of interest with respect to the research, authorship, and/or publication of this article.
Data Availability Statement
The datasets analyzed in this report are not publicly available as they are governed by resource sharing plans for each funded project. De-identified datasets can be made available to interested investigators upon reasonable request and approval of the authors and the institutions where the studies were conducted, provided that all conditions of data sharing as stipulated in the resource sharing plans are met. All requests are subject to review by the projects’ principal and co-investigators. The PETS measure, including all versions and adaptations, are protected by copyright: PETS ©2016, 2020, 2024 Mayo Clinic Foundation for Medical Education and Research. All rights reserved.
Supplemental Material
Supplemental material for this article is available online.
References
Supplementary Material
Please find the following supplemental material available below.
For Open Access articles published under a Creative Commons License, all supplemental material carries the same license as the article it is associated with.
For non-Open Access articles published, all supplemental material carries a non-exclusive license, and permission requests for re-use of supplemental material or any part of supplemental material shall be sent directly to the copyright owner as specified in the copyright notice associated with the article.